Abstract
NUP98 fusion proteins cause leukemia via unknown molecular mechanisms. All NUP98 fusion proteins share an intrinsically disordered region (IDR) in the NUP98 N terminus, featuring repeats of phenylalanine-glycine (FG), and C-terminal fusion partners often function in gene control. We investigated whether mechanisms of oncogenic transformation by NUP98 fusion proteins are hardwired in their protein interactomes. Affinity purification coupled to mass spectrometry (MS) and confocal imaging of five NUP98 fusion proteins expressed in human leukemia cells revealed that shared interactors were enriched for proteins involved in biomolecular condensation and that they colocalized with NUP98 fusion proteins in nuclear puncta. We developed biotinylated isoxazole-mediated condensome MS (biCon-MS) to show that NUP98 fusion proteins alter the global composition of biomolecular condensates. An artificial FG-repeat-containing fusion protein phenocopied the nuclear localization patterns of NUP98 fusion proteins and their capability to drive oncogenic gene expression programs. Thus, we propose that IDR-containing fusion proteins combine biomolecular condensation with transcriptional control to induce cancer.
Cancer-associated chromosomal rearrangements often result in the expression of pathogenic fusion proteins. Leukemia features a particularly high frequency of fusion oncogenes1, and the functional investigation of leukemia-associated fusion proteins has provided invaluable insights into the molecular mechanisms of cancer development2.
The protein complexes around fusion oncoproteins play defining roles in shaping oncogenic gene expression patterns3. Thus, the investigation of protein interactions is critical for uncovering actionable targets to devise more effective targeted cancer therapies. Several studies have used affinity purification coupled to mass spectrometry (AP-MS) to identify key effectors of fusion protein–driven leukemia4,5. Whereas the most common leukemia fusion proteins have been extensively characterized, functional understanding of the rare fusions, which affect a substantial number of patients and have limited treatment options, is still lacking.
The N-terminal part of the Nucleoporin 98 (NUP98) gene (N-NUP98) is fused to more than 30 different C-terminal partner loci in acute myeloid leukemia (AML)6. Although NUP98 rearrangements are rare (~2% of all AML)6, they are overrepresented in pediatric AML, where they are associated with a particularly bad prognosis7.
The endogenous NUP98 protein is part of the nuclear pore complex (NPC), which mediates bidirectional transport of macromolecules between the nucleus and the cytoplasm8. NUP98 is part of the group of FG nucleoporins, which contain IDRs consisting of repeats of either FG or Gly-Leu-Phe-Gly (GLFG) amino acid residues. GLFG repeats can serve as binding sites for RNA-binding proteins, like the mRNA export factor RAE1, thus mediating trafficking of RNA molecules through the NPC6. While the majority of mature NUP98 protein is directly recruited to the NPC, NUP98 was also found to associate with the anaphase-promoting complex (APC)9 and to interact with chromatin, where it actively regulates gene expression in a NPC-independent fashion10,11.
C-terminal fusion partners of N-NUP98 in AML are enriched for proteins with roles in transcriptional control and epigenetics. Several studies have addressed the functional contribution of different protein modules present in NUP98 fusions to leukemogenesis. For instance, the plant homeodomain (PHD) in NUP98–PHF23 (ref.12) and the RNA helicase motif in NUP98-DDX10 (ref.13) were required for leukemogenesis, demonstrating critical roles for the C-terminal fusion partner. Similarly, deletion of the N-terminal NUP98 moiety in NUP98–NSD1 also prevented myeloid progenitor immortalization and high Hox gene expression, highlighting the importance of the conserved IDR for oncogenic transformation by NUP98 fusion proteins14. Yet, the molecular mechanisms of NUP98 fusion protein–induced leukemogenesis remain poorly understood. It is unclear if the oncogenic properties of NUP98 fusion proteins depend on molecular functions of endogenous NUP98 or if they are governed by novel functions that are mediated by the fusion partner15.
Biomolecular condensates are membraneless structures that govern biological processes through the dynamic compartmentalization of macromolecules16. Their formation can be driven by multivalent, low-affinity interactions between IDR-containing proteins, which are able to undergo liquid–liquid phase separation (LLPS)17. In fact, the FG-repeat-containing domain of NUP98 forms phase-separated structures that may regulate the transport properties of the NPC18.
We hypothesized that NUP98 fusion proteins interact with specific networks of cellular proteins and that the oncogenic functions of NUP98 fusion proteins are hardwired into their protein interactomes. Here we show via AP-MS-based interactome analysis that the NUP98 fusion interactome is highly enriched for proteins with known roles in LLPS and in the formation of biomolecular condensates. Using biCon-MS, we found that NUP98 fusion protein expression alters the composition of cellular condensomes. An artificial FG-repeat-containing fragment fused to KDM5A mimicked this effect and induced NUP98-fusion-specific patterns of leukemogenic gene expression. Our data show that the biophysical properties of oncogenic fusion protein partners have the potential to specifically alter cellular biomolecular condensation to drive cancer-specific gene expression programs.
Results
NUP98–KDM5A does not operate in the context of the NPC
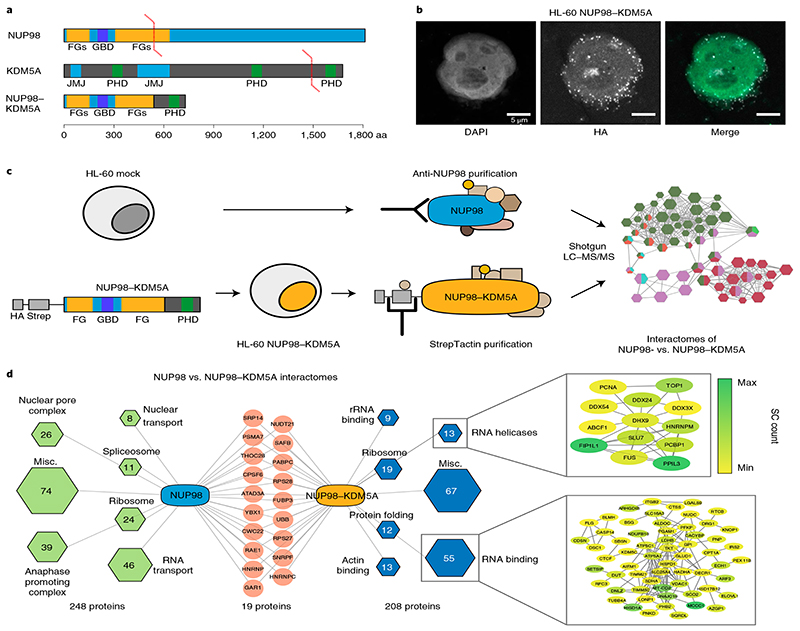
In order to probe the contribution of physiological functions of endogenous NUP98 to NUP98-fusion-dependent oncogenesis, we compared global protein–protein interactions of endogenous NUP98 with those of NUP98–KDM5A, the most prevalent NUP98 fusion protein in human leukemia. A Strep-HA-tagged variant of NUP98–KDM5A (Fig. 1a) was stably expressed in the human leukemia cell line HL-60 at near-physiological levels19 (Extended Data Fig. 1a). In line with previous results20, NUP98–KDM5A did not colocalize with the nuclear membrane but was present in intranuclear puncta (Fig. 1b). To enable unambiguous annotation of protein complexes to endogenous NUP98 versus NUP98–KDM5A, we purified endogenous NUP98–protein complexes from HL-60 cells using a highly specific anti-NUP98 antibody, while the NUP98–KDM5A interactome was isolated via the Strep-tag present in the fusion protein. Western blotting confirmed enrichment of baits and showed that NUP98–KDM5A did not coprecipitate with endogenous NUP98 (Extended Data Fig. 1b). Purified protein complexes were analyzed using liquid chromatography coupled to MS (LC–MS/MS) using a one-dimensional gel-free approach, identifying 315 and 392 proteins (Supplementary Table 1) in anti-NUP98- and Strep-tag-mediated purifications of NUP98–KDM5A, respectively.
Fig. 1. NUP98–KDM5A does not operate in the context of the nuclear pore complex.
a, Domain architecture of endogenous NUP98 and KDM5A proteins and the oncogenic NUP98–KDM5A fusion protein. GBD, Gle2-binding domain; JMJ, Jumonji domain. b, Confocal microscopy images showing a representative HL-60 cell expressing NUP98–KDM5A, stained with DAPI (green in the merged image) and anti-HA antibody for fusion proteins (white in the merged image). Scale bar, 5μm. Six independent experiments were performed with similar results. c, Schematic representation of the experimental setup. HL-60 cells were transduced with a retroviral vector expressing tagged NUP98–KDM5A (left). Endogenous NUP98 complexes were pulled down from mock-transduced HL-60 cells with a NUP98-specific antibody, whereas tagged NUP98–KDM5A complexes were purified using Strep-Tactin (middle). Data on purified protein complexes were acquired by LC–MS/MS and subsequently analyzed (right). d, Interactome analysis was performed by CRaPome (antibody IP) or mock pull-down (Strep-Tactin AP) subtraction for NUP98 and NUP98–KDM5A, respectively. Individual protein complexes within the interactomes were obtained by K-means clustering (K=7) based on String db interactions, assigned using Gene Ontology Biological Processes and illustrated as hexagons (green for NUP98 and blue for NUP98–KDM5A complexes). Hexagon sizes and numbers represent the identified proteins associated with respective subcomplexes. Red nodes show shared proteins between the interactomes. Detailed string db networks (cutoff 0.4) are shown for subcomplexes of ‘RNA helicases’ and ‘RNA binding,’ and individual proteins are highlighted (yellow to green) according to abundance in MS acquisition.
After stringent filtering for background and nonspecific interactions21, the NUP98 interactome featured 267 proteins, and the NUP98–KDM5A interactome consisted of 227 proteins (Fig. 1d and Extended Data Fig. 1c). The interactome of endogenous NUP98 recapitulated protein complexes that were previously reported to interact with NUP98 with high affinity11, including the NPC (26 proteins)22, the APC (39 proteins)9 and factors involved in nuclear transport (8 proteins). In contrast, NUP98–KDM5A mainly copurified with distinct sets of RNA-binding protein complexes, including RNA helicases (13 proteins) and RNA-binding factors (55 proteins). Most importantly, only 19 of 475 proteins interacted with both endogenous NUP98 and NUP98–KDM5A. Among those was RAE1, which was reported to bind to the N terminus of NUP98 (ref. 23) (Fig. 1d). AP-MS analysis of the non-leukemogenic N-NUP98 fragment, which showed a similar localization pattern to that of NUP98–KDM5A (Extended Data Fig. 1d), confirmed diverging interactomes of endogenous NUP98 and N-NUP98 (Extended Data Fig. 1e). These data suggest that despite sharing the same N-terminal sequence, NUP98 and NUP98–KDM5A operate in largely non-overlapping cellular contexts and that NUP98–KDM5A does not localize to the NPC.
Common interactors of diverse NUP98 fusion proteins
Given the structural heterogeneity of the more than 30 NUP98 fusion partners found in AML, it was unclear whether potential effector mechanisms that are critical for NUP98-fusion-dependent leuke-mogenesis might converge on a shared set of interaction partners. To characterize the shared interactome of NUP98 fusion proteins, we chose four molecularly diverse NUP98 fusion oncoproteins in addition to NUP98–KDM5A. We based our selection of fusion proteins on their abundance in the AML patient population, but also on the functional diversity of the fusion partner proteins. The most frequent fusion partners of NUP98 are KDM5A (JARID1A), a histone 3 lysine 4 (H3K4) di- and tri-demethylase24, and NSD1, a histone methyltransferase mediating H3K36 and H4K20 methylation25. NUP98–HOXA9 was chosen to represent the recurrent fusions of NUP98 to members of the HOX gene cluster. HOXA9 is a transcription factor that is highly expressed in hematopoietic stem and progenitor cells26. Finally, fusions of NUP98 with the RNA helicase DDX10 and the transcriptional coactivator PSIP1 (LEDGF) were also included in this study.
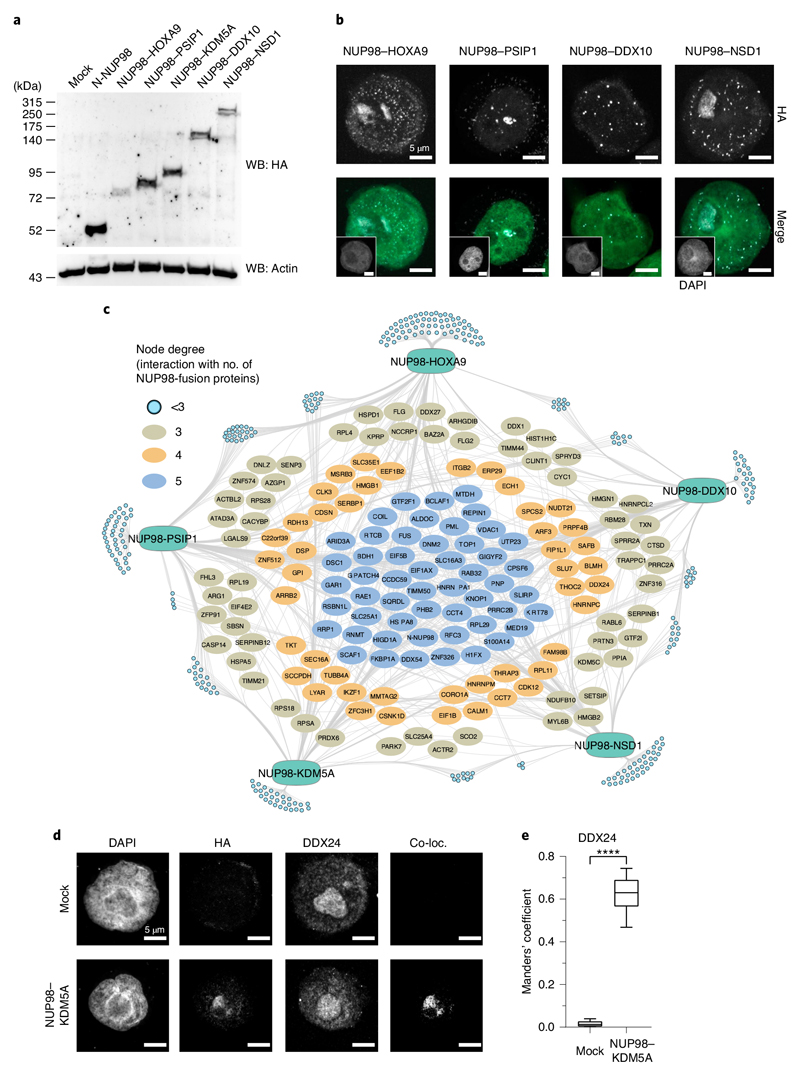
Strep-HA-tagged variants of all fusion proteins were expressed in HL-60 cells, and transgene expression was verified using Western blotting (Fig. 2a). Confocal microscopy of transduced cells revealed that all NUP98 fusion proteins showed comparable patterns of speckled localization across the cell nucleus (Figs. 1b and 2b). Protein complexes nucleated by different NUP98 fusion proteins were purified from lysates of HL-60 cells, and their compositions were analyzed via LC–MS/MS (Extended Data Fig. 2a). Analysis of AP-MS data yielded 616 proteins engaging in more than 6,000 interactions. After subtracting proteins from lysates of non-transduced HL-60 cells and filtering for nonspecific interactions, 501 differentially enriched proteins were retained as high-confidence interactors of NUP98 fusion proteins (Supplementary Table 2). Each individual NUP98 fusion protein exhibited between 19 and 61 exclusive interactions. In contrast, the majority of proteins in the network interacted with more than one NUP98 fusion protein (Fig. 2c). Overall, 157 proteins were found in three or more NUP98 fusion interac-tomes, and a conserved set of 27 proteins was present in all five NUP98 fusion protein complexes (Fig. 2c). This conservation of interaction partners indicates significant functional overlap among different NUP98 fusions, pointing to the presence of similar molecular mechanisms. NUP98–KDM5A colocalized with the conserved interaction partners DDX24 and RAE1 in the context of nuclear puncta (Fig. 2d,e, Extended Data Fig. 2b,c and Supplementary Table 3), and the interaction of NUP98–KDM5A with RAE1 was validated by coimmunoprecipitation (Extended Data Fig. 2d). The 157 conserved NUP98 fusion interactors were enriched in protein complexes involved in RNA splicing, ribosome biogenesis and transcriptional control (Extended Data Fig. 2e). Further analysis using Gene Ontology annotation confirmed a significant enrichment for DNA- and RNA-related processes, including mRNA processing and transcription, which is in line with initial results from the NUP98–KDM5A interactome (Extended Data Fig. 2f).
Fig. 2. Functional proteomic identification of conserved interactors of diverse NUP98 fusion proteins.
a, Western blot analysis of mock-transfected, N-NUP98- or NUP98 fusion protein–expressing HEK293T cells. Exogenous proteins were detected with anti-HA antibodies, and β-actin was used as a loading control. Blot is representative of three independent experiments. Uncropped images are available in Supplementary Fig. 1. b, Confocal microscopy images showing representative HL-60 cells expressing different NUP98 fusion proteins, stained with DAPI (green in the merged image) and anti-HA antibody for fusion protein detection (white in the merged image). Scale bar, 5μm. Six independent experiments were performed with similar results. c, Interactome analysis of five NUP98 fusion proteins. Light blue nodes represent proteins interacting with less than three baits. Proteins that interact with three or more baits are illustrated as ovals. MS analysis was performed in two biological and two technical replicates. d, Immunofluorescence of mock-transduced HL-60 cells (top) or cells expressing NUP98–KDM5A (bottom) stained with DAPI, anti-HA (background fluorescence corrected) and anti-DDX24. Colocalization was determined using the ImageJ plugin ‘Colocalization’. Images shown are representative of six independent experiments. e, Manders’ coefficient showing the co-occurrence of NUP98–KDM5A with DDX24. The box plot center line defines the median, the box limits indicate upper and lower quartiles, and whiskers indicate minima and maxima among all data points. n = 6 cells, ****P < 0.0001, two-sided paired t test, t = -14.895, df = 5, P = 2.468 × 10⁻⁵. Data behind the graph are available as source data.
NUP98 fusion interactome is enriched for components of biomolecular condensates
Nuclear biomolecular condensates play important regulatory roles in transcription, splicing and chromatin organization27. Several well-described factors with roles in biomolecular condensation were present in the conserved NUP98 fusion protein interactome, including the RNA-binding protein FUS28, heterogeneous nuclear ribonucleoprotein A1 (HNRNPA1)17 and H/ACA ribonucleoprotein complex subunit 1 (GAR1)29 (Fig. 2c).
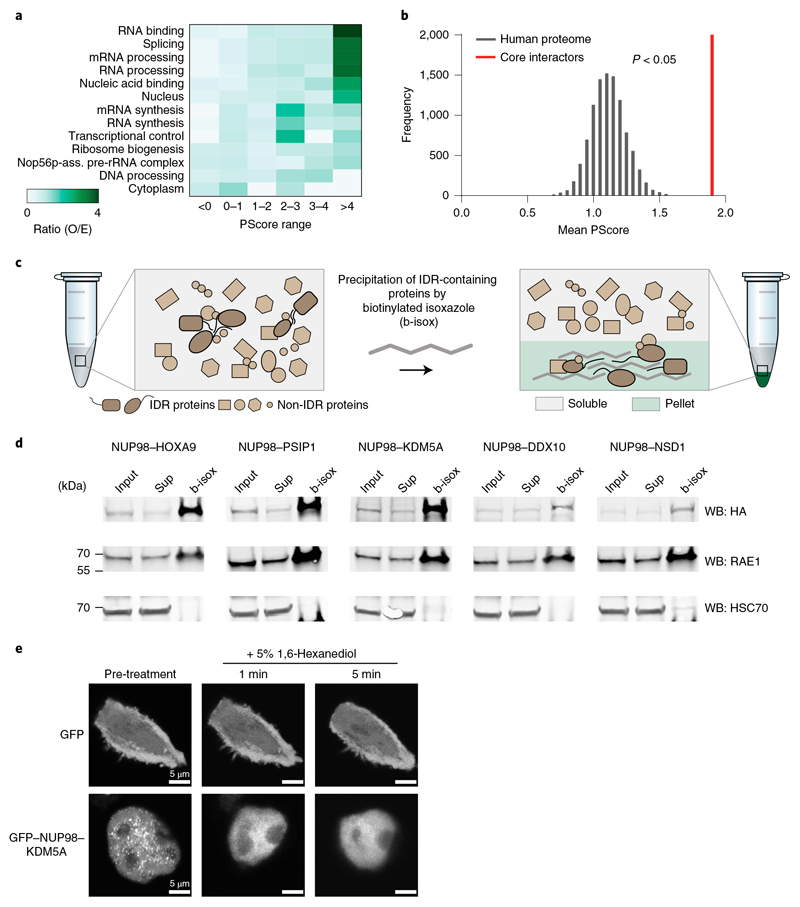
To evaluate a potential enrichment of IDR-containing proteins involved in biomolecular condensation among the NUP98 fusion protein interactome, we used an algorithm that was designed to predict properties of proteins that are linked with LLPS in an unbiased fashion. The PScore classifies the potential of proteins to self-associate based on the abundance of pi-orbital-containing amino acid residues, as pi–pi interactions are important features in phase separation30. Binning of NUP98-fusion-interacting proteins based on their PScores revealed a significant overrepresentation of LLPS-prone proteins (PScore >4) within functional categories that are enriched in the NUP98 fusion interactome, including RNA metabolism, RNA binding, RNA processing and transcription (Fig. 3a). In line with this, the mean PScore of the individual 157 core interactors was significantly higher than a size-matched list of the human proteome that was obtained by random subsampling (Fig. 3b). While a global list of nuclear proteins was associated with high PScores, the mean PScores of nuclear membrane proteins and protein complexes involved in DNA synthesis or DNA repair did not significantly divert from the human proteome (Extended Data Fig. 3a and Supplementary Table 4), and the subsampling process did not alter the global distribution of PScores (Extended Data Fig. 3b).
Fig. 3. The NUP98 fusion protein interactome is enriched for proteins with roles in biomolecular condensation.
a, Observed over expected (O/E) ratios of binned PScores for proteins of significantly enriched Gene Ontologies from Extended Data Fig. 2f were calculated by the observed PScore distribution of the 157 NUP98 fusion core interactors as compared to the expected distribution of the proteome. Gene Ontology terms were ranked by O/E ratio of the bin with the highest PScores. b, The mean PScore for 157 NUP98 fusion core interactors was compared to a set of lists of equal length randomly subsampled from the human proteome. The P value was calculated using a two-sided, two-sample Kolmogorov–Smirnov test, D = 0.11288, P = 0.03598. Data behind the graph are available as source data. c, Schematic illustration of the b-isox-mediated precipitation assay. IDR-containing proteins form β-sheets upon b-isox treatment and can be collected by centrifugation. d, Western blot analysis of HL-60 cell lysates expressing different NUP98-fusion proteins treated with 100 μM b-isox. Fusion proteins were detected with anti-HA antibody, RAE1 was detected with anti-RAE1 antibody, and HSC70 was detected with anti-HSC70 antibody. Total input, supernatant (sup) and b-isox fractions are shown. Uncropped images are available in Supplementary Fig. 1. e, Live-cell confocal microscopy images of HEK293T cells expressing GFP or GFP-tagged NUP98–KDM5A, before and after treatment with 5% 1,6-hexanediol for the indicated time. Cells were plated on polymer-coated chamber slides and imaged 24 h after transfection. Scale bar, 5 μm. Images shown are representative of six independent experiments.
Given the enrichment of LLPS-prone factors among the core NUP98 fusion interactome, we next aimed to investigate the biophysical properties of NUP98 fusion proteins with regard to biomolecular condensation. The chemical substance biotinylated isoxazole (b-isox) enables precipitation of IDR-containing proteins via the formation of microcrystals in solution31,32 (Fig. 3c). All NUP98 fusion proteins precipitated efficiently upon incubation with 100 μM b-isox (Fig. 3d). This effect was likely mediated by the IDR domain in the NUP98 N terminus, which was previously shown to undergo LLPS in vitro18. The susceptibility for b-isox precipitation was not influenced by the Strep-HA tag, as FLAG-tagged or native NUP98–KDM5A variants were efficiently enriched under the same conditions (Supplementary Fig. 3c). Despite the lack of IDRs, the known NUP98 interactor RAE1 was efficiently coprecipitated with NUP98 fusion proteins in this assay, while the highly structured heat-shock cognate 71 kDa protein (HSC70), which does not interact with NUP98 fusion proteins, was insensitive to b-isox precipitation (Fig. 3d). In line with biophysical properties of phase-separated condensates, NUP98–KDM5A-containing nuclear puncta were rapidly and efficiently resolved upon treatment with 1,6-hexanediol (1,6-HD), which has been used to disrupt weak interactions found in biomolecular condensates18 (Fig. 3e).
Taken together, our results indicate that NUP98 fusion proteins and their interactomes are involved in biomolecular condensation in AML cells.
biCon-MS globally charts the cellular condensome
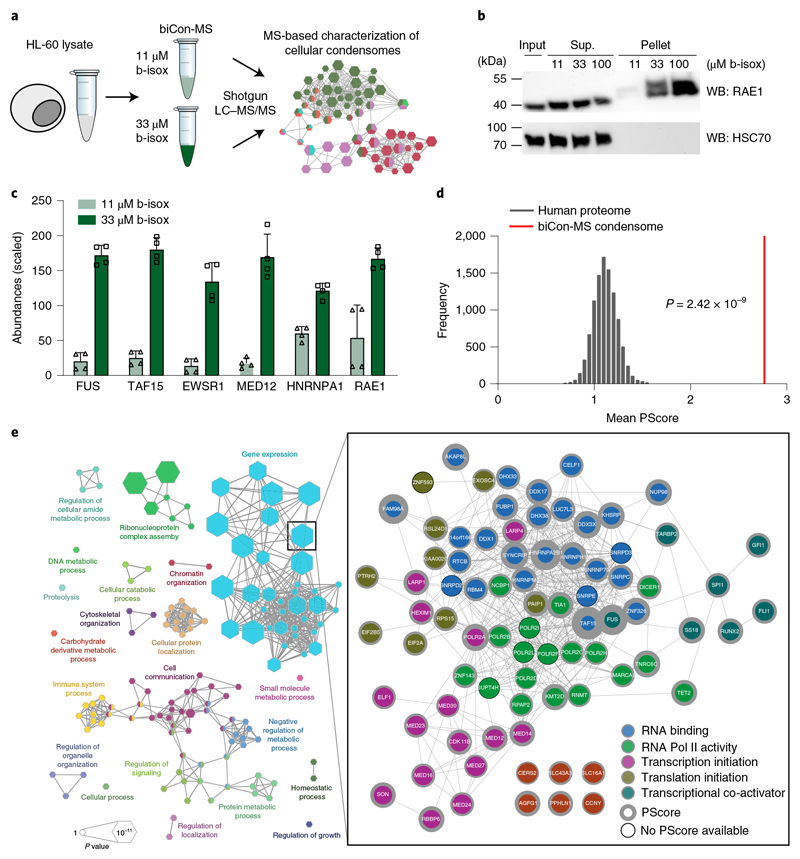
We next aimed to analyze the entirety of cellular proteins that are sensitive to b-isox in an unbiased fashion. We developed an experimental setup to characterize subsets of the cellular proteome that are dynamically integrated in b-isox-precipitates in a dose-dependent manner (Fig. 4a). This optimized method, which we termed biotinylated isoxazole-mediated condensome mass spectrometry (biCon-MS), efficiently reduces background noise caused by nonspecific precipitation and increases the likelihood of true positive hits by eliminating proteins that do not display dose-dependent enrichment, as exemplified by Western blot analysis for the NUP98 interaction partner RAE1 and N-NUP98 (Fig. 4b and Extended Data Fig. 4a). As higher concentrations might cause nonspecific precipitation of proteins, biCon-MS was performed after treatment of lysates with 11 μM and 33 μM b-isox.
Fig. 4. biCon-MS globally charts the cellular condensome.
a, Schematic illustration of the biCon-MS approach. MS analysis was performed in two biological and two technical replicates. b, Western blot analysis of HL-60 cell lysates treated with 11 μM, 33 μM or 100 μM b-isox. Dose-dependent precipitation was investigated for RAE1 and HSC70. Total input, supernatant (sup) and b-isox fractions (pellet) are shown. Blot is representative of three independent experiments. Uncropped images are available in Supplementary Fig. 1. c, Normalized and scaled protein abundance for selected proteins previously implicated in the formation of biomolecular condensates identified by biCon-MS of mock HL-60 cells. Graphs show individual data points, mean and s.d. for n = 4 (2 biological, 2 technical replicates). d, Mean PScore for proteins significantly enriched (P < 0.05, log2(fold change) > 0.5) in 33μM b-isox precipitates as compared to 11 μM b-isox precipitates was compared to a set of lists of equal length that were randomly subsampled from the human proteome. P value was calculated using a two-sided, two-sample Kolmogorov-Smirnov test, D = 0.23547, P = 2.424 × 10⁻⁹. e, Gene Ontology analysis of proteins significantly enriched (P < 0.05, log2(fold change) > 0.5) in 33 μM b-isox precipitates compared to 11 μM b-isox precipitates. Edges connect terms with overlapping protein lists. The protein list of the most significant Gene Ontology term (‘gene expression’) is represented by interactions from the String database. The network of annotated interactions was clustered using Reactome FI in Cytoscape. Gray border thickness indicates PScores for individual proteins. Proteins without any annotated PScore are indicated by black borders. Size of the hexagons scale with significance of Gene Ontology term analysis. Data behind the graphs in c,d are available as source data.
biCon-MS analysis of HL-60 lysates identified 931 proteins that exhibited dose-dependent precipitation behavior (Supplementary Table 5), and 209 proteins were significantly enriched in the samples exposed to the higher b-isox concentration. Well-described factors implicated in biomolecular condensates such as FUS, TAF15 and MED12 were retrieved in a dose-dependent fashion (Fig. 4c). PScore analysis with group-size-dependent testing statistic (GSDTS) indicated that these 209 proteins were highly enriched for proteins capable of LLPS (Fig. 4d). Functional annotation of proteins showing dose-dependent b-isox precipitation behavior resulted in a comprehensive network that was representative of diverse cellular physiology associated with biomolecular condensation, including cellular signaling and metabolism, but also RNP assembly, chromatin organization and gene expression (Fig. 4e). Further interaction-based clustering of proteins in the most significantly enriched hub (‘gene expression’) yielded a network of 81 proteins with 496 interactions. It consisted of complexes that play critical roles in transcriptional regulation (transcription factors GFI1, FLI1 and RUNX2), transcriptional initiation (multiple components of the mediator complex, the SWI/SNF complex and RNA polymerase II), but also proteins involved in RNA binding and translation, such as TAF15 or HNRNPA2B1 (Fig. 4e). Importantly, many of these factors have been previously implicated in LLPS, which is consistent with their high PScores (Fig. 4e), providing further evidence of this algorithm’s suitability as an unbiased predictor of the capability of individual proteins to participate in biomolecular condensation.
NUP98 fusion protein expression dynamically alters the cellular condensome
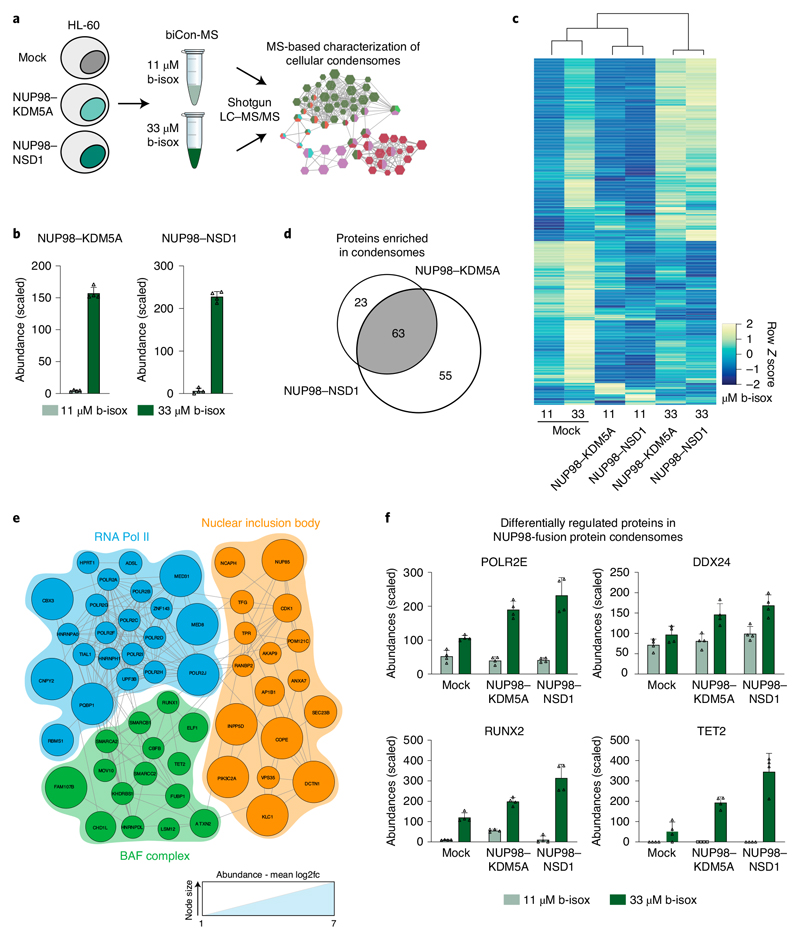
As we found that NUP98 fusion proteins specifically interact with proteins capable of undergoing biomolecular condensation, we next aimed to investigate dynamic changes in the cellular condensome that result from the expression of oncogenic NUP98–KDM5A or NUP98-NSD1 fusion proteins by biCon-MS (Fig. 5a). In addition to proteins that were consistently identified in biCon-MS, such as FUS, TAF15, EWSR1 (Extended Data Fig. 5a,b), we found a dose-dependent increase of NUP98 fusion proteins, confirming that NUP98 fusion proteins are involved in biomolecular condensation (Fig. 5b and Extended Data Fig. 5c,d). Comparison of global condensomes in NUP98 fusion protein-expressing versus mock-transduced HL-60 cells based on stringent statistical filtering revealed extensive reorganization of the cellular condensome upon oncogene expression (Fig. 5c and Supplementary Table 5). A total of 145 and 240 proteins were significantly depleted from cellular condensomes upon expression of NUP98–KDM5A and NUP98-NSD1, respectively. Conversely, 64 and 70 proteins were significantly enriched in condensomes of NUP98–KDM5A- and NUP98–NSD1-expressing cells, respectively (Extended Data Fig. 5e,f). In line with the hypothesis that NUP98 fusion proteins share molecular mechanisms leading to oncogenic transformation, the majority of differentially enriched proteins in fusion protein condensomes were shared between NUP98–KDM5A and NUP98–NSD1 (Fig. 5d).
Fig. 5. Expression of NUP98 fusion proteins dynamically alters the cellular condensome.
a, Schematic illustration of biCon-MS for HL-60 cells expressing NUP98–KDM5A or NUP98-NSD1. MS analysis was performed in two biological and two technical replicates. b, Normalized and scaled protein abundance for Strep-HA-tag-derived peptides identified by biCon-MS in lysates of NUP98 fusion protein-expressing HL-60 cells. Graph shows individual data points, mean and s.d. for n = 4 (2 biological, 2 technical replicates). c, Heat map of proteins that were more abundant in 33 μM than in 11 μM precipitates of mock-transduced HL-60 cells. Each row represents Z scores of mean abundances for individual proteins for each condition (mock, NUP98–KDM5A and NUP98-NSD1 with 11 μM and 33 μM b-isox). Rows and columns were clustered using Pearson correlation as a distance measure and ward.D clustering. d, Venn diagram of enriched proteins (log2(fold change) > 1.0) in condensomes of NUP98–KDM5A- and NUP98-NSD1-expressing cells compared to mock-transduced HL-60 cells. e, Reactome FI clustering of all proteins that were precipitated by b-isox in a dose-dependent manner upon expression of NUP98–KDM5A and NUP98-NSD1, compared to mock-transduced HL-60 cells. Proteins representative of the three most significant protein complexes are shown in groups and connected via annotated String db interactions. The size of the nodes represents mean log2(fold change). f, Scaled abundance of selected significantly enriched proteins in both NUP98 fusion protein condensomes as identified by biCon-MS. Graphs show individual data points, mean and s.d. for n = 4 (2 biological, 2 technical replicates). Data behind graphs for b,f are available as source data.
Network analysis of all proteins enriched in condensomes upon NUP98 fusion protein expression uncovered key complexes of transcriptional activation and chromatin organization (Fig. 5e). For instance, different subunits of the transcriptional machinery such as POLR2E and MED31, as well as the conserved NUP98 fusion protein interactor DDX24 were enriched in both NUP98 fusion protein condensomes (Fig. 5f and Extended Data Fig. 5g). In contrast, MED15 was significantly depleted from condensomes upon expression of NUP98–KDM5A and NUP98–NSD1 (Extended Data Fig. 5g). In addition, important factors in leukemia development, such as RUNX2 and TET2 were also enriched in NUP98-fusion-dependent condensomes. (Fig. 5f).
Artificial IDR-KDM5A fusion recapitulates condensome changes by NUP98 fusions
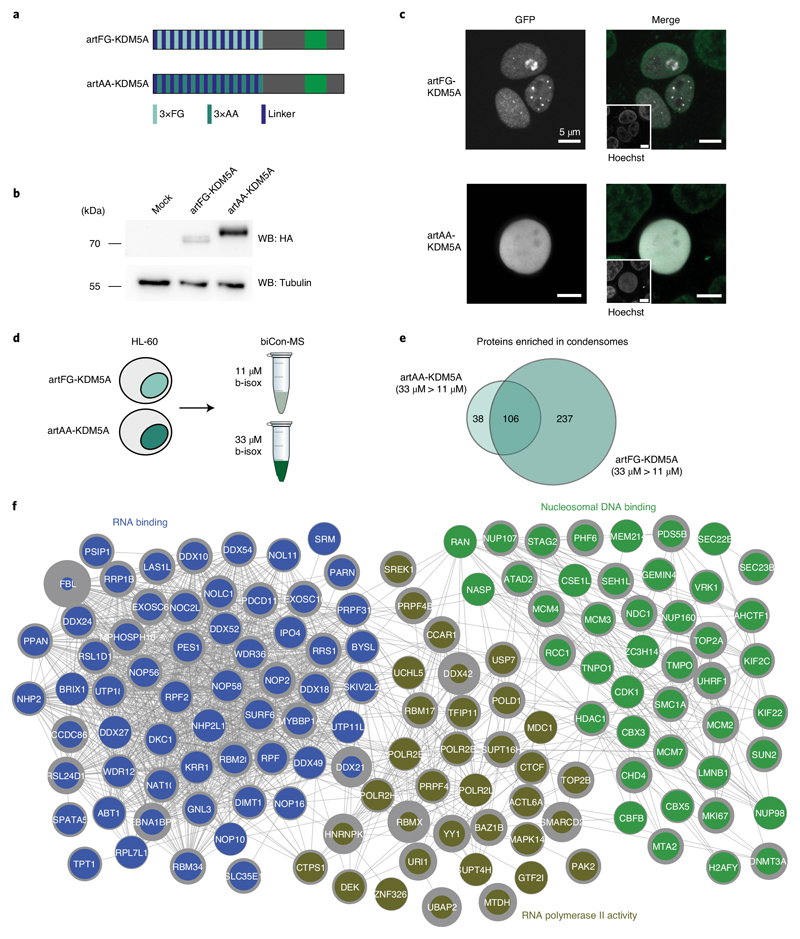
The IDR-containing N terminus of NUP98 is essential for the formation of biomolecular condensates in vitro18. To test its contribution to the specific subcellular localization and to the specific changes in the cellular condensome in the context of NUP98 fusion proteins, we designed an artificial peptide containing 39 FG repeats and fused it to the C terminus of KDM5A, resulting in an artificial FG–KDM5A fusion protein (artFG–KDM5A). As a control, the KDM5A C terminus was fused to a sequence of 39 dipeptides of the nonpolar and aliphatic amino acid alanine (A) (artAA–KDM5A, Fig. 6a,b). Live cell imaging of GFP-tagged variants of these constructs confirmed the localization of artFG–KDM5A to nuclear puncta (Fig. 6c), which was highly reminiscent of the nuclear localization pattern of NUP98–KDM5A (Figs. 1b and 3e). In contrast, artAA–KDM5A was distributed homogenously across the cell nucleus (Fig. 6c).
Fig. 6. An artificial IDR-containing KDM5A fusion protein phenocopies NUP98-fusion-induced changes in the condensome.
a, Schematic illustration of artificial (art) KDM5A fusion proteins. Thirteen triple repeats of phenylalanine-glycine (FG) or alanine-alanine (AA), connected by 18-amino-acid linkers, were fused to the C-terminal part of KDM5A found in patients with NUP98–KDM5A-driven AML. b, Western blot analysis of HEK293T cells transfected with mock, artFG–KDM5A or artAA–KDM5A. Fusion proteins were detected with anti-HA antibodies, and tubulin was used as a loading control. Blot is representative of three independent experiments. Uncropped images are available in Supplementary Fig. 1. c, Live cell imaging of HEK293T cells expressing GFP-tagged variants of artFG–KDM5A and artAA–KDM5A. Fusion proteins are shown in white, and Hoechst staining is shown in green. Scale bar, 5μm. Images are representative of six independent experiments. d, Schematic illustration of biCon-MS for HL-60 cells expressing artFG–KDM5A or artAA–KDM5A. MS analysis was performed in two biological and two technical replicates. e, Venn diagram of proteins enriched in 33μM precipitates compared to 11 μM precipitates for artAA–KDM5A (Extended Data Fig. 6a) and artFG–KDM5A (Extended Data Fig. 6b). f, Reactome FI clustering for 237 proteins uniquely enriched in artFG–KDM5A compared to artAA–KDM5A. The three most significant nuclear clusters are shown with String db interactions (cutoff 0.4) for individual proteins. Gray border thickness indicates PScores for individual proteins.
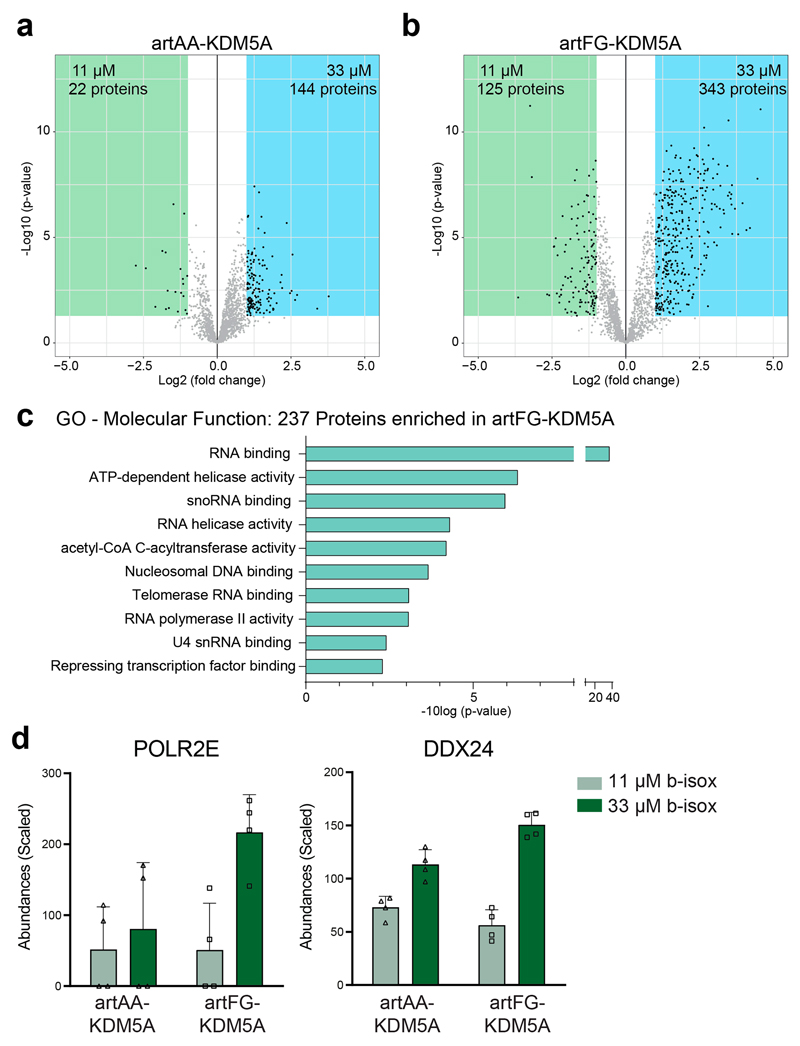
To test whether artFG–KDM5A and NUP98–KDM5A also share the capability to alter the global composition of the cellular condensome, we performed biCon-MS of lysates from HL-60 cells expressing artFG–KDM5A and artAA–KDM5A constructs (Supplementary Table 6). Whereas only 144 proteins exhibited significant dose-dependent precipitation in cells expressing artAA–KDM5A, more than twice as many (343 proteins) were significantly enriched in artFG–KDM5A-expressing cells (Extended Data Fig. 6a,b). A total of 237 proteins were exclusively identified in the artFG–KDM5A-associated condensome (Fig. 6e). Gene ontology analysis of these candidates revealed a significant enrichment of RNA- and DNA-binding processes (Extended Data Fig. 6c). Clustering of proteins that were exclusively found in the artFG–KDM5A-induced condensome yielded three large clusters of nuclear processes, comprising RNA binding, RNA polymerase II activity and nucleosomal DNA binding (Fig. 6f). The condensome of artFG–KDM5A showed considerable overlap to proteins enriched in biCon-MS of NUP98 fusion proteins. For instance, precipitation of POLR2E and DDX24 was enhanced in cells expressing NUP98–KDM5A, NUP98–NSD1 and artFG–KDM5A in comparison to mock-transduced cells or cells expressing artAA–KDM5A, respectively (Extended Data Fig. 6d).
Artificial IDR-KDM5A fusion drives leukemia-associated gene expression
To test whether the biophysical properties of an FG-repeat-containing IDR fused to the KDM5A Cterminus are sufficient to induce leukemia-specific gene expression patterns, the artFG–KDM5A and artAA–KDM5A constructs were introduced into mouse fetal liver stem and progenitor cells, and the resulting changes in gene expression were compared to the effects of the leukemogenic NUP98–KDM5A fusion protein by RNA sequencing (RNA-seq; Fig. 7a). Principal component analysis of RNA-seq data revealed high similarity of global gene expression between artAA–KDM5A and wild-type (WT) fetal liver cells, whereas transcriptional profiles resulting from expression of NUP98–KDM5A and artFG–KDM5A were significantly distinct (Extended Data Fig. 7a).
Fig. 7. Artificial FG-containing fusion proteins induce leukemogenic gene expression programs in hematopoietic progenitor cells.
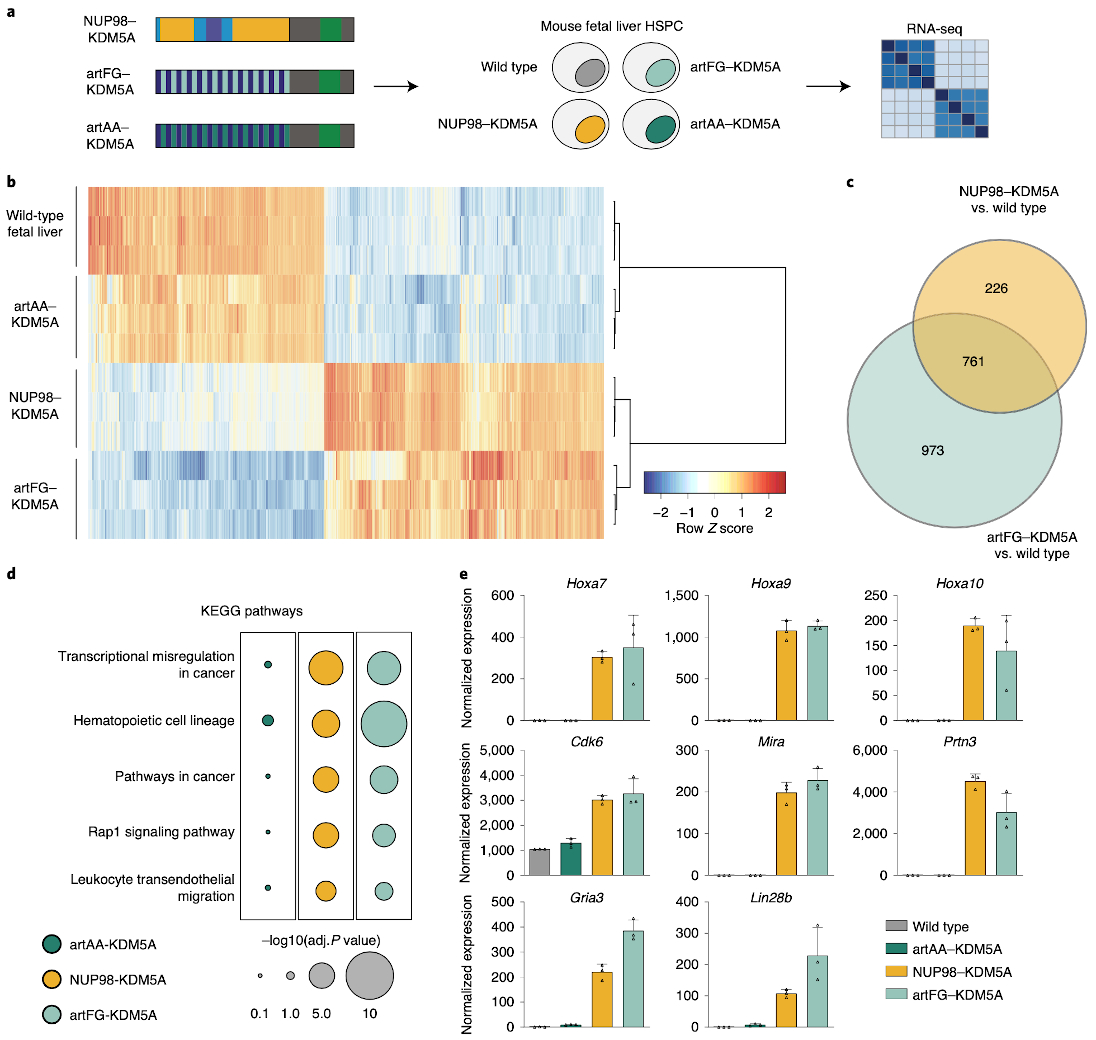
a, Schematic illustration of fusion protein expression in murine fetal liver hematopoietic stem and progenitor cells, followed by RNA-seq. b, Heat map of significantly deregulated genes in NUP98–KDM5A- and artFG–KDM5A-expressing cells compared to control fetal liver cells. Rows and columns were clustered using Pearson correlation as a distance measure and ward.D clustering. Each row represents Z scores of scaled expression levels for each replicate. Only genes with P < 0.01 are shown. c, Venn diagram of differentially regulated genes in NUP98–KDM5A and artFG–KDM5A-expressing cells compared to mock-transduced cells. P < 0.001 and log2(fold change) <–2 or > 2. P values and fold changes were obtained using DESeq2 for normalization and differential gene expression analysis (Methods). d, KEGG pathway analysis for differentially regulated genes of artAA–KDM5A-, NUP98–KDM5A- and artFG–KDM5A-expressing fetal liver cells. Most significant pathways induced by NUP98–KDM5A are shown. e, Gene expression of known direct NUP98 fusion protein targets, shared between NUP98–KDM5A and artFG–KDM5A. Data are mean and s.d. of n = 3 independent biological replicates.
Differential gene expression analysis revealed that deregulated genes in NUP98–KDM5A- and artFG–KDM5A-expressing cells differed significantly from those in wild-type cells. In contrast, only minor changes in gene expression were observed upon expression of artAA–KDM5A (Fig. 7b). Out of 987 genes whose expression was deregulated by NUP98–KDM5A, artFG–KDM5A caused consistent expression changes in 761 genes (78%; Fig. 7c). In line with this finding, pathway analysis of differentially expressed genes in NUP98–KDM5A- and artFG–KDM5A-expressing cells revealed a high overlap, whereas the same terms were not enriched in the transcriptome of artAA–KDM5A (Fig. 7d). NUP98–KDM5A and artFG–KDM5A proteins were capable of inducing gene expression patterns that were characteristic of hematopoietic malignancies (Extended Data Fig. 7b), highlighting the oncogenic transcriptional potential of the artFG–KDM5A fusion protein. Finally, we found that exogenous expression of the artFG–KDM5A fusion caused high expression of Hoxa7, Mira and Cdk6, which are direct transcriptional targets of NUP98 fusion proteins33 (Fig. 7e).
Discussion
In this study, we show that structurally different NUP98 fusion proteins localize to biomolecular condensates. We also find that the structural determinants guiding biomolecular condensation are encoded in the NUP98 N terminus and are sufficient to evoke leukemia-specific gene expression in the context of oncogenic fusion proteins. Thus, we speculate that alteration of biomolecular condensation mediated by IDR-containing oncogenic fusion proteins might represent a novel mechanism of oncogenic transformation.
Our results provide a comprehensive AP-MS-based interactome analysis of NUP98 fusion proteins versus endogenous NUP98 in human cells. In line with previous reports, our data show that NUP98 is associated with proteins of the NPC22 and the APC9. Furthermore, we confirm its interaction with RAE1 (ref. 23) and the ATP-dependent RNA helicase A (DHX9)11. Yet, our AP-MS experiments did not identify the previously reported interaction of NUP98 fusion proteins with the NSL and MLL1 complexes34. This could be explained by differences in the experimental approaches that have been used to characterize protein interactors of NUP98 fusion proteins. As MS-based methods identify interactors of a bait protein in an unbiased fashion, the range of retrieved interactions in this approach strongly depends on the abundance of interaction partners and the stoichiometry of the interaction. In contrast, antibody-based detection of interaction partners can identify low-abundance, substoichiometric interactions with much higher potential. Thus, while the interaction between NUP98 fusion proteins and the MLL1 complex is important for oncogenesis34, it might occur at low frequencies in leukemia cells.
Out of 267 identified NUP98 interactors, only 46 were not annotated as part of the NUP98 protein complex, highlighting the high purity of the NUP98 interactome. AP-MS-based comparison of the interactomes of endogenous NUP98 versus a NUP98–KDM5A fusion protein revealed surprisingly little overlap. While most overlapping proteins are part of the RNA transport machinery (HNRNPA1, YBX1, NUDT21), they might interact with endogenous NUP98 or NUP98 fusion proteins in distinct contexts. Extended interactome analysis of five structurally diverse, yet clinically relevant NUP98 fusion proteins further demonstrated their association with protein complexes involved in RNA metabolism. A core set of 157 proteins represents the conserved core interactome of NUP98 fusion proteins. Functional annotation of this core NUP98 fusion interactome revealed high enrichment for proteins involved in the control of gene expression. These results support our hypothesis that structurally distinct NUP98 fusion proteins share highly specialized protein environments that are critical for their oncogenicity. Conversely, proteins that uniquely interact with individual fusion proteins might as well be critical for the oncogenic function of NUP98 fusion proteins. Notably, the NUP98 fusion core interactome was enriched in factors that were previously implicated in the formation of biomolecular condensates, such as FUS28, HNRNPA1 (ref.17) and GAR1 (ref. 29). Biomolecular condensates are membraneless compartments within cells that serve to efficiently compartmentalize macromolecules35, such as stress granules17, Cajal bodies36 or paraspeckles35. Their formation is often governed by IDR-containing proteins17, which are capable of undergoing LLPS. Recent studies have identified a critical role for biomolecular condensation in transcriptional control, translation and protein transport27,37–39. For instance, IDR-containing transcription factors40 and coactivators form condensates at super-enhancers to establish subnuclear compartments that concentrate the transcriptional machinery to ensure efficient gene control37. PScore-based prediction of the propensity of proteins to undergo LLPS30 showed that the core NUP98 fusion protein interactome was significantly enriched for proteins that have the capacity to phase separate.
Confocal imaging is often used to directly visualize biomolecular condensates in cells41. We and others have observed that NUP98 fusion proteins show speckled localization in the nucleoplasm but do not localize to the nuclear membrane20,42. This is consistent with our AP-MS data, supporting roles of NUP98 fusion proteins in RNA metabolism and gene expression in the context of biomolecular condensates. Measuring b-isox-mediated precipitation of proteins can serve as a proxy to characterize the propensity of proteins to form aggregates in the context of complex cellular lysates31,32. The NUP98 N terminus contains two large IDRs that consist of 38 di-amino-acid repeats of FG, and endogenous NUP98 is able to form biomolecular condensates43. Consistent with the biochemical and biophysical properties of the NUP98 N terminus, all NUP98 fusion proteins were highly susceptible to b-isox precipitation. This is in line with previous observations showing that NUP98 can localize to so-called ‘GLFG bodies’ whose formation was dependent on the NUP98 N terminus44.
To globally analyze the composition of biomolecular condensates in an unbiased manner, we developed biCon-MS. Beyond recovering the majority of proteins previously found to be sensitive to b-isox precipitation31,32, biCon-MS efficiently identified several proteins with well-described roles in LLPS, such as the FET protein family (FUS/EWSR1/TAF15)45, 17 constituents of the mediator complex and 11 members of the RNA Pol II holoenzyme38. Functional annotation of the identified proteins clearly links bio-molecular condensation to gene expression, mRNA transport and metabolic regulation, processes that were recently revealed to be critically dependent on LLPS27,37,38,40,46. Beyond that, we identified a large number of proteins that were not previously implicated in bio-molecular condensation, including RNA helicases, epigenetic modulators and transcriptional coactivators. Thus, biCon-MS is able to efficiently recover proteins involved in biomolecular condensation and holds great potential to expand the catalog of cellular proteins capable of biomolecular condensation.
biCon-MS analysis showed that expression of NUP98–KDM5A or NUP98-NSD1 fusion proteins caused substantial alterations in the composition of biomolecular condensates. While biCon-MS identified a large proportion of IDR-containing proteins irrespective of fusion protein expression, core complexes involved in gene regulation were enriched in condensomes in a NUP98-fusion-dependent fashion with high reproducibility and significance. This includes factors that are essential for basic functions related to transcriptional control, such as POLR2E and MED31 (ref. 47), but also proteins that are important for leukemia-specific gene regulation, like RUNX2 (ref. 48) and TET2 (ref. 49). Specifically, NUP98-dependent recruitment of these factors to biomolecular condensates involved in transcription might explain the unique effects NUP98 fusion proteins have on gene expression.
While the number of FG repeats had a strong influence on subnuclear localization of NUP98 fusion proteins50,51, and deletions in the NUP98 N terminus affected the leukemogenicity of NUP98-HOX fusions52, it was not clear if FG repeats in the NUP98 N terminus are critical determinants of the oncogenicity of NUP98 fusion proteins. We engineered an artificial IDR consisting of 13 triple FG repeats and fused it to the C-terminal part of KDM5A. This artFG–KDM5A fusion protein phenocopied the speckled nuclear localization of NUP98–KDM5A. RNA-seq and biCon-MS analysis of cells expressing this artificial fusion protein showed that the structural properties of FG repeats in the NUP98 N terminus were sufficient to phenocopy condensome alterations and gene expression changes that are induced by the NUP98–KDM5A fusion, including induction of direct target genes of NUP98 fusion proteins. These data also indicate that the GLEBS domain in the NUP98 N terminus is dispensable for the induction of leukemic gene expression programs.
These results might provide a common molecular mechanism for how a family of >30 structurally diverse fusion proteins can cause a very similar disease. We postulate that the unique combination of IDR-containing protein sequences provided by the NUP98 N terminus (mediating biomolecular condensation) together with protein modules involved in gene control (represented by the C-terminal fusion partners) is sufficient to induce oncogenic gene expression programs.
Investigation of the 368 factors that are involved in oncogenic fusion proteins, as listed in the Catalogue of Somatic Mutations in Cancer (COSMIC), reveals a high enrichment of IDR-containing proteins, such as EWS, TAF15, NUP214 and FUS (Supplementary Fig. 7c). For instance, the EWS-FLI1 fusion protein, which is the driver oncogene in Ewing’s sarcoma, was shown to undergo phase transitions that are critical for gene activation53. Although the underlying molecular mechanisms might be distinct, the structural characteristics of fusion proteins could indicate that alteration of biomolecular condensation is a fundamental principle of cancer development driven by oncogenic fusion proteins.
Online content
Any methods, additional references, Nature Research reporting summaries, source data, extended data, supplementary information, acknowledgements, peer review information; details of author contributions and competing interests; and statements of data and code availability are available at https://doi.org/10.1038/s41594-020-00550-w.
Methods
Constructs
cDNAs for different NUP98 and artificial (artFG–KDM5A and artAA–KDM5A) fusion proteins were cloned into retroviral vectors, enabling tetracycline-inducible expression of Strep-HA-tagged transgenes (pSIN-TREt-SH-gw-IRES-GFP-PGK-BlastR) using the Gateway technology. For constitutive transgene expression in mouse fetal liver cells, cDNAs were cloned into pMSCV-SH-gw-PGK-BlastR-IRES-mCherry. GFP-tagged variants of artificial fusion proteins were cloned into expression vectors for live cell imaging. Nucleotide sequences for artAA–KDM5A and artFG–KDM5A are provided in the Supplementary Note.
Cell culture
HL-60, HEK293T and NIH-3T3 cells were obtained from the German Collection of Microorganisms and Cell Cultures GmbH (DSMZ), and Platinum-E (Plat-E) cells were purchased from Cell Biolabs, Inc. HL-60 cells were modified to stably express the ecotropic receptor and the reverse tetracycline transactivator protein (rtTA3) (HL-60-RIEP) and were cultured in RPMI 1640 (Gibco) supplemented with 10% fetal bovine serum (FBS, Gibco), 2 mM L-glutamine (Gibco) and 100 U ml-1 penicillin-streptomycin (Gibco). HEK293T, NIH-3T3 and Plat-E cells were maintained in DMEM (Gibco) supplemented with 10% FBS, 2 mM L-glutamine and 100 U ml-1 penicillin-streptomycin. All cell lines were tested for mycoplasma contamination. HL-60-RIEP cells transduced with TREt-HA-Strep-NUP98-FP-IRES-eGFP-PGK-Blasti were cultivated in the presence of puromycin (2 μg ml-1) and blasticidin (10 μg/ml). Doxycycline (1 μg ml-1; Sigma-Aldrich) was added to induce transcription of cDNAs encoding NUP98 fusion proteins 24 h prior to harvesting, and transgene expression was monitored by flow cytometry for GFP. Primary mouse hematopoietic stem and progenitor cells were isolated from fetal livers of C57BL/6 N mice between day E13.5 and E14.5. Cells were cultured in DMEM/IMDM (50:50% vol/ vol), supplemented with 10% FBS, 100 U ml-1 penicillin-streptomycin, 4 mM L-glutamine and 50 μM beta-mercaptoethanol in the presence of murine stem cell factor (mSCF, 150 ng ml-1), murine interleukin 3 (mIL-3, 10 ng ml-1) and murine interleukin 6 (mIL-6, 10 ng ml-1) (all PeproTech). Animal experiments were approved by the institutional ethics and animal welfare committee and the national authority according to §§ 26ff. of the Animal Experiments Act, Tierversuchsgesetz 2012–TVS 2012 (license number BMWF 68.205/188-V/3b/2018).
Retroviral transduction
For retroviral transductions, Plat-E cells were transiently transfected with pGAG-POL and retroviral expression vectors using the polyethylenimine (PEI) protocol54. Virus-containing supernatant was harvested, filtered (0.45 μm), and supplemented with polybrene (final concentration 10 yg ml-1, Merck Millipore/TR-1003-G). Target cells were spinoculated at 800g for 45 min on two successive days.
RNA isolation and quantitative real-time PCR
Total RNA was extracted using the QIAGEN RNeasy Mini Kit. Reverse transcription was done using RevertAID RT Kit (Thermo Scientific), and quantitative PCR was done using the SsoAdvanced Universal SYBR Green Supermix (Bio-Rad) on a Bio-Rad CFX-Connect Real-Time PCR Detection System. Results were normalized to human GAPDH for HL-60 cells and mouse Gapdh for mouse leukemia cells and analyzed using the 2-ddC(t) method. Primers are listed in the Supplementary Note.
Immunofluorescence analysis
Cells were spotted on glass histology slides using a Shandon Cytospin Centrifuge II and air-dried. Spots were fixed with 4% formaldehyde (Histofix, Roth, P087.6) for 10 min at 4 °C. Cells were permeabilized with 0.2% Triton X100 in PBS for 10 min at room temperature, followed by 1 h of incubation with primary antibody in 2% BSA/0.2% Triton X100 in PBS in a wet chamber. For detection of exogenous fusion proteins, a mouse anti-HA (Santa Cruz, sc-7392, clone F-7, RRID: AB_627809) antibody was used. Samples were incubated with a secondary Alexa Fluor-568 f(ab’)2-goat anti-mouse antibody (Thermo Fisher Scientific, A-21237, RRID: AB_2535806) for 1 h at room temperature in a dark, wet chamber. DNA was stained with DAPI (4’,6-diamidino-2-phenylindole, Dilactate, Biolegend, 522801), and slides were mounted using Entellan New (Merck, 1079610100). Images were acquired using a Zeiss SM 880 Airyscan confocal laser scanning microscope with the Zeiss ZEN-black software. Post-processing of images was performed using ZEN-blue and ImageJ for brightness and contrast enhancement. For detection of colocalization of NUP98–KDM5A and DDX24/RAE1, background subtraction was followed by contrast enhancement. For HA antibody staining, the nonspecific fluorescence signal from mock-transduced HL-60 cells was subtracted from images of cells expressing NUP98–KDM5A.
Statistical analysis of protein colocalization
For correlation and co-occurrence analysis of NUP98–KDM5A and DDX24/RAE1 we used the Coloc 2 plug-in for ImageJ/Fiji55–57. To avoid user bias and ensure reproducible results, this analysis was conducted with an ImageJ macro script in an automated fashion. All images were converted to 8-bit, and the DAPI channel was used to select the nucleus as the region of interest (ROI). Control images (from samples that were treated with secondary antibodies only) were used for background removal by separately calculating the mean pixel intensities for channel 1 (NUP98–KDM5A) and channel 2 (RAE1/DDX24). Mean intensities derived from all control images were used as background for both channels. The background was subtracted from all ROIs in the tested channel pairs. We then applied the Coloc 2 plug-in for the calculation of Spearman’s rank correlation and Kendall’s tau correlation coefficients and to perform Costes randomization (with 200 repeats) to compare channel 1 and channel 2 for images from cells NUP98–KDM5A- or mock-transduced cells. A paired, two-sided t test was applied for significance testing. Results are shown in the Supplementary Note.
Live cell imaging
Cells were transiently transfected with 250 to 500 ng plasmid DNA using the PEI54 protocol and imaged on a Zeiss SM 880 Airyscan confocal microscope. For 1,6-HD treatment, cells were transferred to polymer-coated cover slip dishes (Ibidi, Cat.No: 81156) or chamber slides (Ibidi, Cat.No: 80426 and 80826) 6 h after transfection and imaged 24 h later. A 20% 1,6-HD working solution was prepared and added to a final concentration of 5%. Pictures were taken before treatment, and 1 min and 5 min after addition of 1,6-HD. Cells expressing artFG–KDM5A/artAA–KDM5A fusions were imaged 72 h after transfection. Before acquisition, nuclei were stained with 5 μg ml-1 Hoechst 33342 (Thermo Fisher Scientific, H1399) for 7 min. Post-processing of confocal z-slice images were accomplished using ZEN-blue software and ImageJ for contrast enhancement.
Affinity purification of protein complexes
Cells (10–100 × 106) were harvested and washed with PBS. Fresh or frozen cell pellets were resuspended in ice-cold AP-MS buffer (50 mM HEPES-KOH, pH 8.0, 100 mM KCl, 2 mM EDTA, 0.1% NP40, 10% glycerol, 1× protease inhibitor cocktail (25×, 11697498001, Sigma), 50 mM NaF, 1 mM PMSF, 1 mM dithiothreitol (DTT), 10 μg ml-1 TPCK) in a 1:4 pellet:buffer ratio. Samples were snap frozen in liquid nitrogen and thawed at 37 °C while agitating. Samples were sonicated for 30 s and treated with 125 U benzonase for 1 h at 4 °C. After centrifugation at 16,600g for 30 min at 4 °C, the supernatant was transferred to a fresh tube, and the protein concentration was measured by Bradford assay. Lysates were used at 2 mg ml-1 for immunoprecipitation (2 mg for western blot, 12 mg for MS). One-hundred microliters of lysate was used as input sample. The remaining sample was incubated with Strep-Tactin XT magnetic beads (IBA) or Dynabeads (Thermo Fisher Scientific, 14311D) coupled with a NUP98 antibody (Abcam, ab50610) for 1 h at 4 °C while rotating. Bead-protein complexes were washed three times with AP-MS buffer and eluted in 2% SDS buffer (50 mM HEPES, pH 8.0, 150 mM NaCl, 5 mM EDTA, 2% SDS). Eluates were subsequently used for western blot analysis or submitted to tryptic digestion and LC–MS/MS analysis.
Biotinylated isoxazole-mediated precipitation
The assay was performed as previously described with slight modifications31. Cells (10–20 × 106) were resuspended in 1 ml ice-cold lysis buffer (50 mM HEPES-NaOH, pH 7.4, 150 mM NaCl, 0,1% NP40, 1 mM EDTA, 2.5 mM EGTA, 10% glycerol, 1× protease inhibitor cocktail (25×), 50 mM NaF, 1 mM PMSF, 1 mM DTT, 10 μg ml-1 TPCK) and incubated at 4 °C for 30 min while rotating. After centrifugation at 16,600g for 30 min at 4 °C, the supernatant was transferred to a fresh tube. After removing 50 μl of whole cell extract (input sample), the remaining sample was split in up to three fractions and treated with different concentrations of b-isox (10 mM stock in DMSO). Samples were incubated for 1 h at 4 °C while rotating. Precipitated proteins were pelleted at 16,600g and washed three times with lysis buffer. Washed precipitates were resuspended in Laemmli buffer (western blot) or directly submitted to sample preparation for LC–MS/MS. For biCon-MS, lysates were treated with two concentrations of b-isox per sample (11 μM and 33 μM) in duplicates before MS analysis.
Western blotting
Western blotting was performed according to standard laboratory protocols. Primary and secondary antibodies used are listed in the Supplementary Note. Presentation of full scan blots can be found in the source data file.
Filter-aided sample preparation and stage-tip purification for AP-MS
One-hundred microliters of eluted protein complexes were used for filter-aided sample preparation (FASP), as reported by Wisniewski et al.58. Samples were reduced by adding DTT to a final concentration of ~83.3 mM, incubated for 5 min at 99 °C before being cooled down to room temperature. Four-hundred microliters 8 M urea in 100 mM Tris-HCl, pH 8.5 (UA buffer) was added to the sample and mixed, and the sample was transferred to a UA-buffer-washed Microcon-30 kDa centrifugal filter unit (Millipore, MRCF0R030). After an additional wash step with UA buffer, 100 μl of iodoacetamide (50 mM) was added to the filter unit, which was then mixed at 800 r.p.m. for 1 min before incubating for 30 min in the dark at room temperature. Filters were then washed three times with UA buffer, then three washes with 50 mM triethylammonium bicarbonate (TEAB, pH 8.5) buffer. To digest the proteins, 1 μg trypsin (Promega, V511X) in 50 mM TEAB buffer was added, and samples were incubated overnight at 37 °C. After additional washing steps with 50 mM TEAB buffer, digested peptides were eluted with 50 μl of 0.5 M NaCl. Samples were acidified with 5 μl 30% trifluoroacetic acid (TFA) and subsequently loaded onto in-house-fabricated C18 stage tips. Desalted peptides were eluted using 0.4% formic acid with 90% acetonitrile. After vacuum centrifugation, peptides were reconstituted in 5% formic acid and submitted to LC–MS/MS analysis.
biCon-MS
b-isox precipitates were resuspended in 8 M urea in 100 mM TEAB buffer, pH 8, and proteins were reduced with a final concentration of 50 mM DTT and incubated at 60 °C for 1 h. After cooling down to room temperature, reduced cysteines were alkylated with iodoacetamide at a final concentration of 55 mM for 30 min in the dark. Prior to tryptic digestion, urea concentration was diluted with 100 mM TEAB buffer, pH 8, to 1.5 M, and samples were digested with 1.25 μg of trypsin overnight at 37 °C. Peptides were cleaned up by acidifying the samples to a final concentration of 1% TFA before performing solid-phase extraction using C18 SPE columns (SUM SS18V, NEST Group) according to the manufacturer’s instructions. Peptides were eluted two times using 50 μl 90% acetonitrile and 0.4% formic acid; organic solvent was removed in a vacuum concentrator before reconstituting in 26 μl of 5% formic acid (Suprapur, MERCK KgaA).
Liquid chromatography MS was performed on a hybrid linear trap quadrupole (LTQ) Orbitrap Velos mass spectrometer (Thermo Fisher Scientific) or a Q Exactive Hybrid Quadrupole-Orbitrap (Thermo Fisher Scientific) coupled to an Agilent 1200 HPLC nanoflow system (Agilent Biotechnologies) via nanoelectrospray ion source using a liquid junction (Proxeon). Tryptic peptides were loaded onto a trap column (Zorbax 300SB-C18 5 μm, 5 × 0.3 mm, Agilent Biotechnologies) at a flow rate of 45 μl min-1 using 0.1% TFA as loading buffer. After loading, the trap column was switched in-line with a 75-μm inner diameter, 25-cm analytical column (packed in-house with ReproSil-Pur 120 C18-AQ, 3 μm, Dr Maisch, Ammerbuch-Entringen, Germany). Mobile-phase A consisted of 0.4% formic acid in water and mobile-phase B of 0.4% formic acid in a mix of 90% acetonitrile and 9.610% water. The flow rate was set to 230 nl min-1, and a 90-min gradient was used (4% to 30% solvent B within 81 min, 30% to 65% solvent B within 8 min, and 65% to 100% solvent B within 1 min, 100% solvent B for 6 min before equilibrating at 4% solvent B for 18 min). For the MS/MS experiment, the LTQ Orbitrap Velos mass spectrometer was operated in data-dependent acquisition (DDA) mode with the 15 most intense precursor ions selected for collision-induced dissociation (CID) in the linear ion trap. MS1-spectra were acquired in the Orbitrap mass analyzer using a scan range of 350 to 1,800 m/z at a resolution of 60,000 (at 400 m/z). Automatic gain control (AGC) was set to a target of 1 × 10⁶ and a maximum injection time of 500 ms. MS2-scans were acquired in parallel in the linear ion trap with AGC target settings of 5 × 10⁴ and a maximum injection time of 50 ms. Precursor isolation width was set to 2 Da, and the CID normalized collision energy was set to 30%. The Q Exactive MS was operated in a Top10 DDA mode with a MS1 scan range of 375 to 1,650 m/z at a resolution of 70,000 (at 200 m/z). AGC was set to a target of 1 × 10⁶ and a maximum injection time of 55 ms. MS2-spectra were acquired at a resolution of 15,000 (at 200 m/z) with AGC settings of 1 × 10⁵ and a maximum injection time of 110 ms. Precursor isolation width was set to 1.6 Da, and the HCD normalized collision energy was set to 28%. The threshold for selecting MS2 precursor ions was set to ~2,000 counts for both instruments. Dynamic exclusion for selected ions was 30 s. A single lock mass at m/z 445.120024 was employed59. All samples were analyzed in technical duplicates. Xcalibur version 2.1.0 SP1/Tune2.6.0 SP3 and XCalibur version 4.1.31.9 Tune 2.9.2926 were used to operate the LTQ Orbitrap Velos or Q Exactive MS instrument, respectively.
MS data analysis
For Figs. 1 and 2, we used msconvert60 from the ProteoWizard60 toolkit to convert raw data files to mgf format. These mgf files were then processed with SearchGUI (version 3.2.20)61 with default parameters and the xtandem, myrimatch, ms_amanda, msgf, omssa, comet and tide search engines switched on. SearchGUI was applied against the human Swiss-Prot62 database (01.2017), extended with the Strep-HA-tag, Strep-Tactin and trypsin protein sequences. As posttranslational modifications, we configured fixed carbomidomethylation of cysteine and variable oxidation of methionine. The decoy database was generated within SearchGUI by reversing all sequences of the database described previously. Results were then analyzed with PeptideShaker (version 1.16.15)63.
For Figs. 4–6, acquired raw data files were processed using the Proteome Discoverer 2.2.0.388 platform, utilizing the database search engine Sequest HT. Percolator V3.0 was used to remove false positives with a false discovery rate of 1% on peptide and protein level under strict conditions. RAW data were recalibrated prior to Sequest HT searches using full tryptic digestion against the human SwissProt database v2017.06 (20,456 sequences and appended known contaminants) with up to one miscleavage site. Oxidation (+15.9949 Da) of methionine, acetylation (+42.010565 Da) of lysine and protein N terminus and phosphorylation (+79.966331 Da) of serine, threonine and tyrosine were set as variable modifications, and carbamidomethylation (+57.0214 Da) of cysteine residues were set as fixed modifications. Data was searched with mass tolerances of ±10 p.p.m. and 0.025 Da on the precursor and fragment ions, respectively. The ptmRS node was used for additional validation of posttranslational modifications. Results were filtered to include peptide spectrum matches with Sequest HT cross-correlation factor (Xcorr) scores of ≥1, ptmRS scores of ≥75 and protein groups including ≥2 peptides. For calculation of protein amounts, the Minora Feature Detector node and Precursor Ions Quantifier node, both integrated in Thermo Proteome Discoverer, were used. Automated chromatographic alignment and feature linking mapping were enabled. Precursor abundance was calculated using intensity of peptide features, including only unique peptide groups and excluding phosphorylated and acetylated peptides. To equalize total abundance between different runs, protein abundance values were normalized using the total peptide amount approach. No computational missing value imputation was applied to fill gaps. For statistical analysis a nested (paired) approach was applied using pairwise ratio calculation and background-based ANOVA statistical testing. Pairwise ratio calculation was chosen to make the analysis less sensitive toward missing values. Background-based ANOVA uses the background population of ratios for all peptides and proteins in order to determine whether any given single peptide or protein is significantly changing relative to that background (as stated in the manual of Proteome Discoverer 2.2, Thermo Fisher Scientific). Adjusted P values were calculated using the Benjamini-Hochberg method. Volcano plots were generated from the normalized protein abundances with the R-package DEP64. We used default parameters, with the exception of the vsn normalization and imputation function MinProb with q = 0.01. Significant differences in the enrichment of proteins were called based on the adjusted P value lower than 0.05 and a log2(fold change) of >1 or <-1.
Protein network analysis
Protein networks were illustrated with Cytoscape 3.6.1 (ref. 65). Annotated protein–protein interactions were obtained from the STRING database using the StringApp 1.4.2 in Cytoscape, with a confidence score cutoff of 0.4. Reactome clustering for protein networks was performed using the Reactome FI 7.1.0 application and executed with default conditions. Gene Ontology networks were generated with ClueGO v2.5.4 (ref. 66) application with a P-value cutoff of 0.05. Details for protein networks shown in Figs. 1, 2, and 4–6 and Extended Data Fig. 1 are provided in the Supplementary Note.
O/E ratios of binned PScores
PScores of individual proteins found within each Gene Ontology term were grouped into six bins ranging from <0 to >4 (observed distribution). The same was done for the PScores of the human proteome30 (expected distribution). Next, the ratio between observed and expected frequencies were calculated for each bin and illustrated as a heat map. The heat map was generated with the heatmap.2 function from the R-package gplots (version 3.0.1)67, using the default distance function.
Group-size-dependent testing statistic
GSDTS tests a list of values x against a larger universe y of values (x < y) by subsampling z times, a list of length of x out of the universe. Each subsampled list is checked against the already created lists to ensure unique lists to satisfy ‘subsampling without replacement’. The lists x and y as well as the number of subsampling repeats, z, need to be provided by the user. As a result, the sum, mean or median of all subsampling results are plotted as a histogram, and the respective sum, mean or median of list x is then indicated by a red bar in the histogram. The script is implemented in R and available at https://github.com/Edert/R-scripts.
For the histograms shown, we applied GSDTS with a z of 10,000 to obtain 10,000 subsampled lists of length x of the universe y. As universe y, we chose the whole human proteome30, and x was chosen to match the length of the query list. We then used the mean to plot the histogram and for indicating the tested list as a red line.
RNA-seq
RNA was isolated according to the standard protocol using the RNeasy Mini Kit (QIAGEN). Sequencing libraries were generated using the QUANT seq 3’ mRNA-Seq Library Prep Kit (Lexogen). Pooled libraries were processed at the Vienna Biocenter Next Generation Sequencing Facility (Vienna, Austria) and sequenced using single-read 70-bp chemistry on a NextSeq550 instrument (Illumina).
RNA-seq data analysis
The quality of the raw sequence files was checked with FastQC (version 0.11.4)68. Based on this, the quality trimming and filtering and length filtering were applied using PRINSEQ-lite (version 0.20.4)69. Remaining reads were aligned against the mouse reference genome (GRCm38/mm10) using STAR (version 2.5.0b)70. Final processing was carried out with SAMtools (version 1.7)71 and counts per gene were obtained by featureCounts (version 1.6.0)72. Differential gene expression analysis and normalization prior to visualization and clustering was then performed with DESeq2 (version 1.22.2)73. Heat maps and bar charts showing normalized gene expression were based on the DESeq2 normalized data. Batch correction for two library preparation and sequencing runs was done with ComBat74 from the sva package (3.12)75. For the PCA-plot the rlog normalized expression of the top 500 genes with the highest variance were used. The heat map of shared regulated genes was generated with the heatmap.2 function from the R-package gplots (version 3.0.1)67, using Pearson correlation as distance measure and ward.D clustering.
Further information on experimental design is available in the Nature Research Reporting Summary linked to this article.
Extended Data
Extended Data Fig. 1. Immunoprecipitation of endogenous NUP98 and affinity purification of NUP98–KDM5A coupled to LC–MS/MS, Related to Fig. 1.
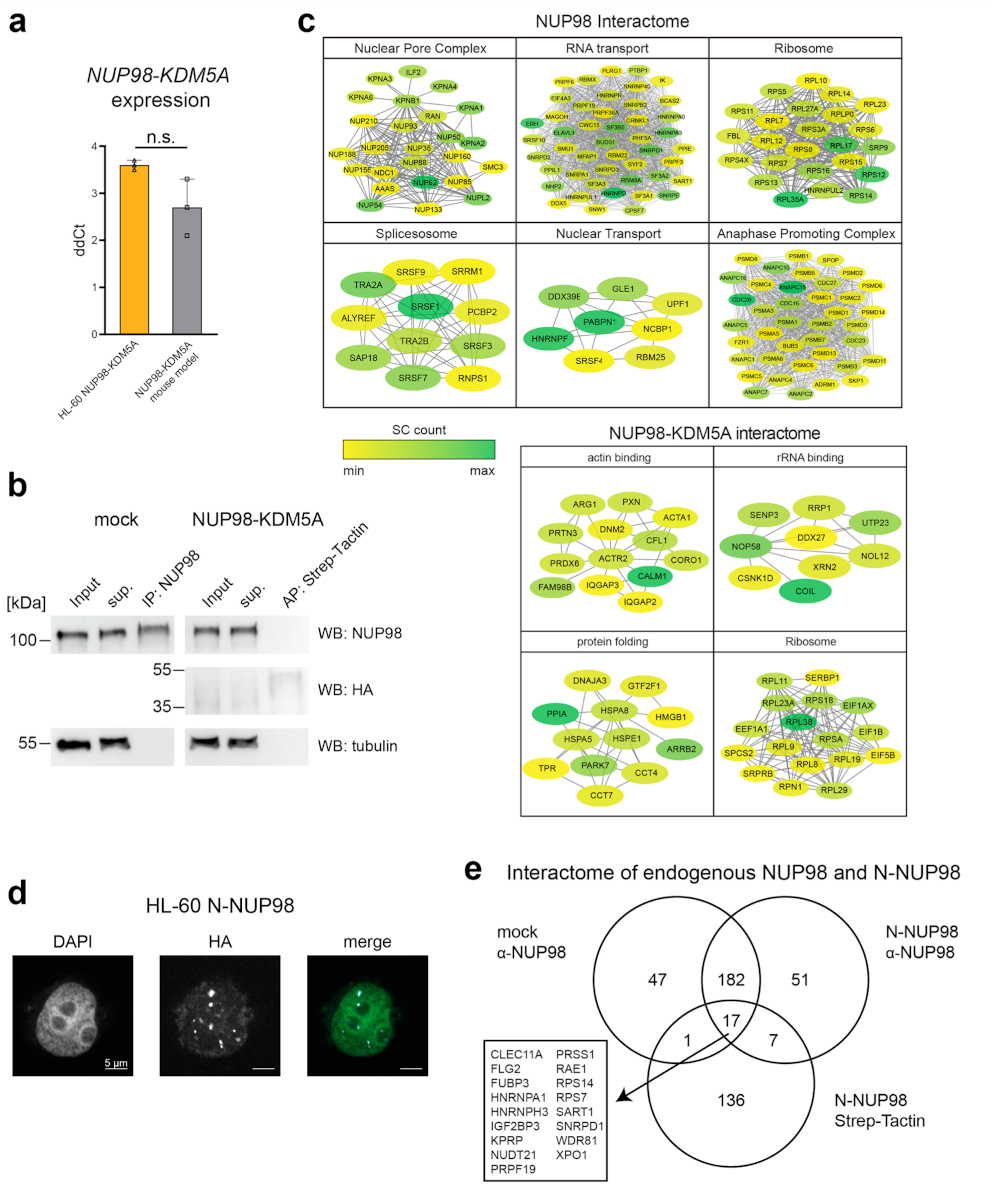
a, mRNA expression of NUP98-KDM5A in HL-60 cells and mouse AML cells expressing NUP98-KDM5A (paired, two-sided t-test, p-value: 0.33, three biological replicates). ddCt values were calculated using GAPDH/Gapdh expression for HL-60 cells and mouse leukemia cells, respectively. Graph shows individual data points, mean and s.d. n = 3 (biological replicates of the same experiment) (b) Western blot analysis of mock-transduced- and NUP98-KDM5A-expressing HL-60 cells. Control lysates were incubated with NUP98 antibody conjugated to magnetic beads and NUP98-KDM5A lysates were incubated with magnetic Strep-Tactin beads for 1 hour. Input, supernatant (sup) and pull down fractions were loaded and membranes were probed with anti-NUP98, anti-HA and anti-Tubulin antibodies. A representative blot of three independent experiments is shown. Uncropped images are available in Supplementary Fig. 1. c, String database networks of individual subcomplexes identified by Gene Ontology for Biological Processes (Fig. 1d). Identified interactors for respective GO terms were clustered using String database (cutoff 0.4). Individual proteins are highlighted (yellow to green) according to abundance in MS datasets. d, Confocal microscopy images of N-NUP98-expressing HL-60 cells stained with DAPI (green in merge) and anti-HA antibody (white in merge) for exogenous fusion proteins. Scale bar: 5μm. Six independent experiments were performed with similar results. e, Venn diagram of identified proteins from three different affinity purifications in HL-60 cells. Protein lists from immuno-affinity purification experiments with an anti-NUP98 antibody in mock transduced cells or N-NUP98-expressing cells were intersected with each other and with proteins identified in Strep-Tactin purifications from N-NUP98-expressing cells. The overlap shows N-terminal NUP98 interactors that are conserved between different pull-down approaches.
Extended Data Fig. 2. AP-MS analysis of NUP98-fusion proteins and validation of selected interaction partners, Related to Fig. 2.
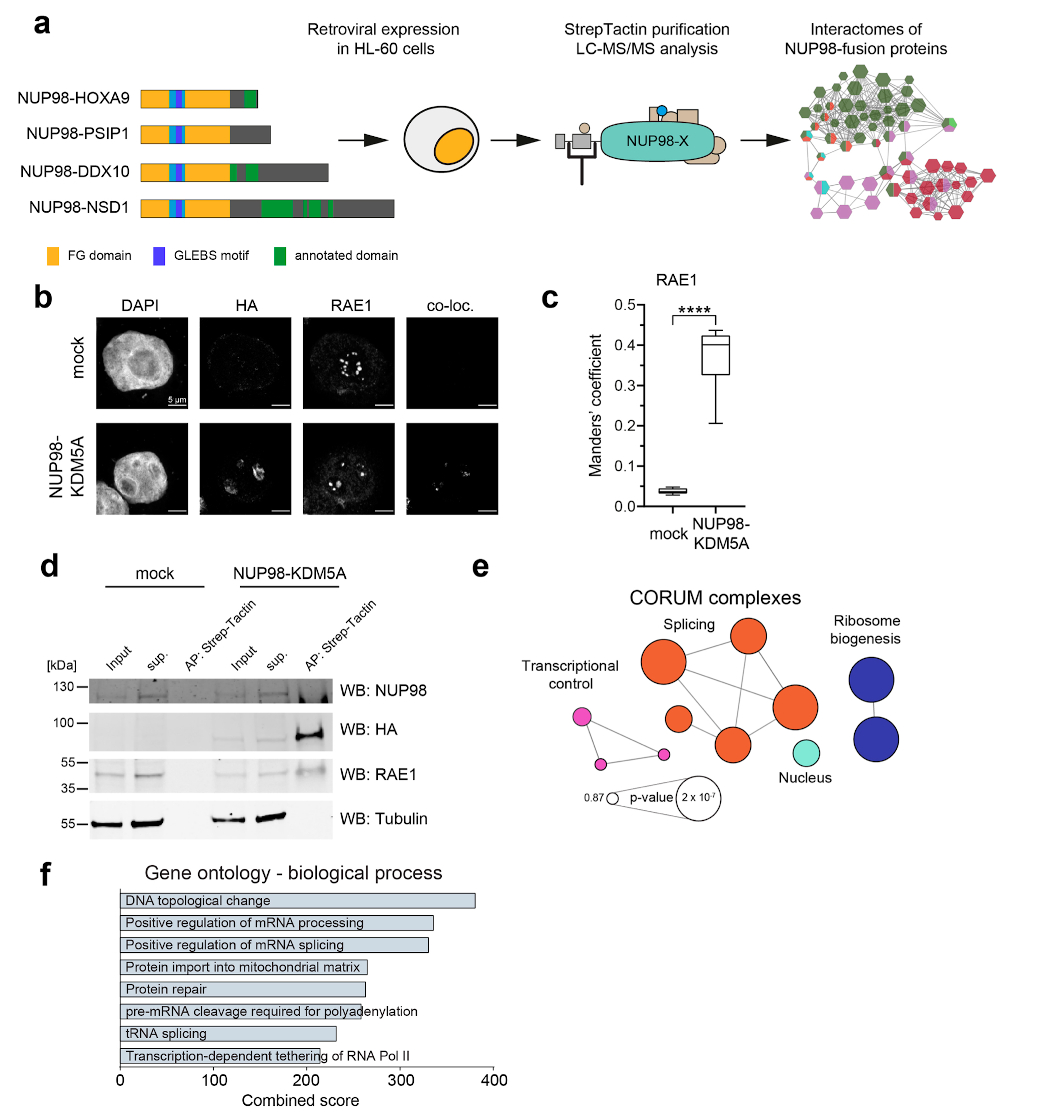
a, Schematic representation of the experimental strategy. HL-60 cells were transduced with retroviral constructs encoding NUP98 fusion proteins and protein complex pulldowns were performed using Strep-Tactin followed by LC-MS/MS analysis. b, Immunofluorescence of mock transduced (top) HL-60 cells or cells expressing NUP98-KDM5A (bottom) stained with DAPI, anti-HA (background-fluorescence corrected) and anti-RAE1. Co-localization (co-loc) was determined with the ImageJ plugin ‘Colocalization’ Six independent experiments were performed with similar results. (c) Manders’ coefficient showing the co-occurrence of NUP98-KDM5A with RAE1. **** p-value < 0.0001, n = 12 cells examined over 2 independent experiments (6 mock vs. 6 NUP98-KDM5A) Two sided, paired t-test, t = -10.277, df = 5, **** p-value = 0.0001499. The box plot centre line defines the median, the box limits indicate upper and lower quartiles, whiskers indicate minima and maxima among all data points. Data behind graph are available as Source Data. d, Western blot analysis of protein lysates from control HEK293T cells or cells transfected with NUP98-KDM5A after Strep-Tactin affinity purification. Blot is representative of three independent experiments. Uncropped images are available in Supplementary Fig. 1. (e) CORUM analysis of 157 NUP98-fusion protein core interactors. Complexes are illustrated as a network highlighting top terms ranked by p-value. The network was generated with ClueGo v3.5.4. f, GO analysis (Biological Process) was performed for 157 NUP98-fusion protein core interactors. GO terms were ranked by combined score using Enrichr.
Extended Data Fig. 3. PScore analysis of different protein lists, Related to Fig. 3.
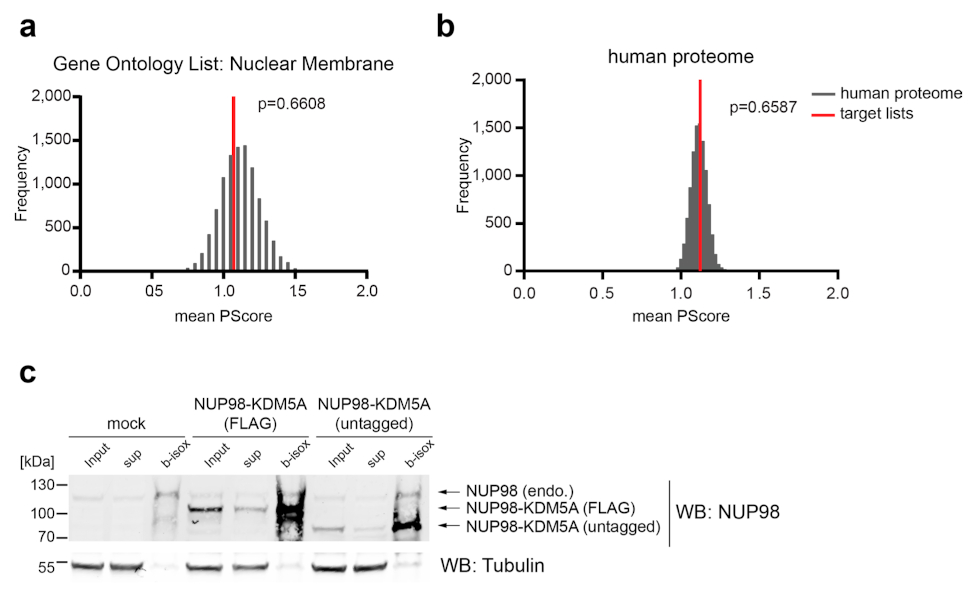
a, GSDTS was performed for the Gene Ontology list ‘Nuclear Membrane’. The mean PScore was compared to a set of lists of equal length that were randomly subsampled from the human proteome. b, GSDTS was performed for the human proteome. p-values were calculated using the Kolmogorov-Smirnov test. c, 100 μM b-isox precipitation of HEK293T cells transfected with mock, flag-tagged NUP98-KDM5A or untagged NUP98-KDM5A. Endogenous NUP98 and NUP98-KDM5A proteins were detected with anti-NUP98 antibodies in input, supernatant (sup) and precipitated (b-isox) fractions. Blot is representative of three independent experiments. Uncropped images are available in Supplementary Fig. 1.
Extended Data Fig. 4. b-isox precipitation of N-NUP98, related to Fig. 4.
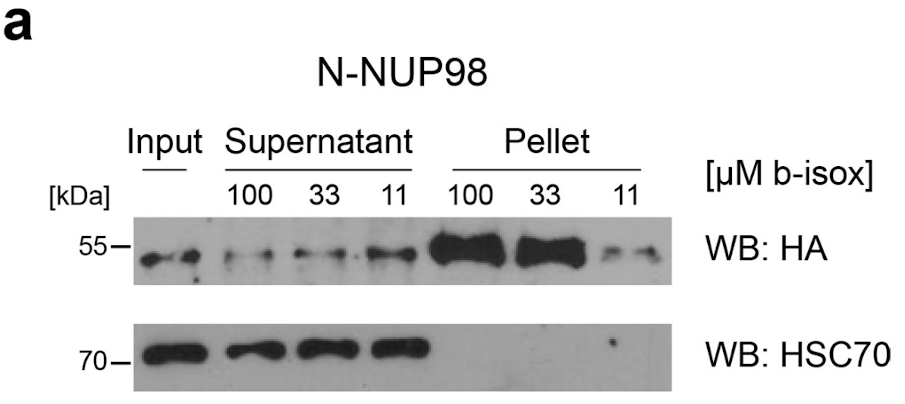
a, Western blot analysis of protein lysates from HEK293T cells expressing
N-NUP98 treated with 11 μM, 33 μM or 100 μM b-isox. N-NUP98 was detected using anti-HA antibodies. Total input, supernatant and b-isox fractions (pellet) are shown. Blot is representative of three independent experiments. Uncropped images are available in Supplementary Fig. 1.
Extended Data Fig. 5. biCon-MS for NUP98-KDM5A and NUP98-NSD1, Related to Fig. 5.
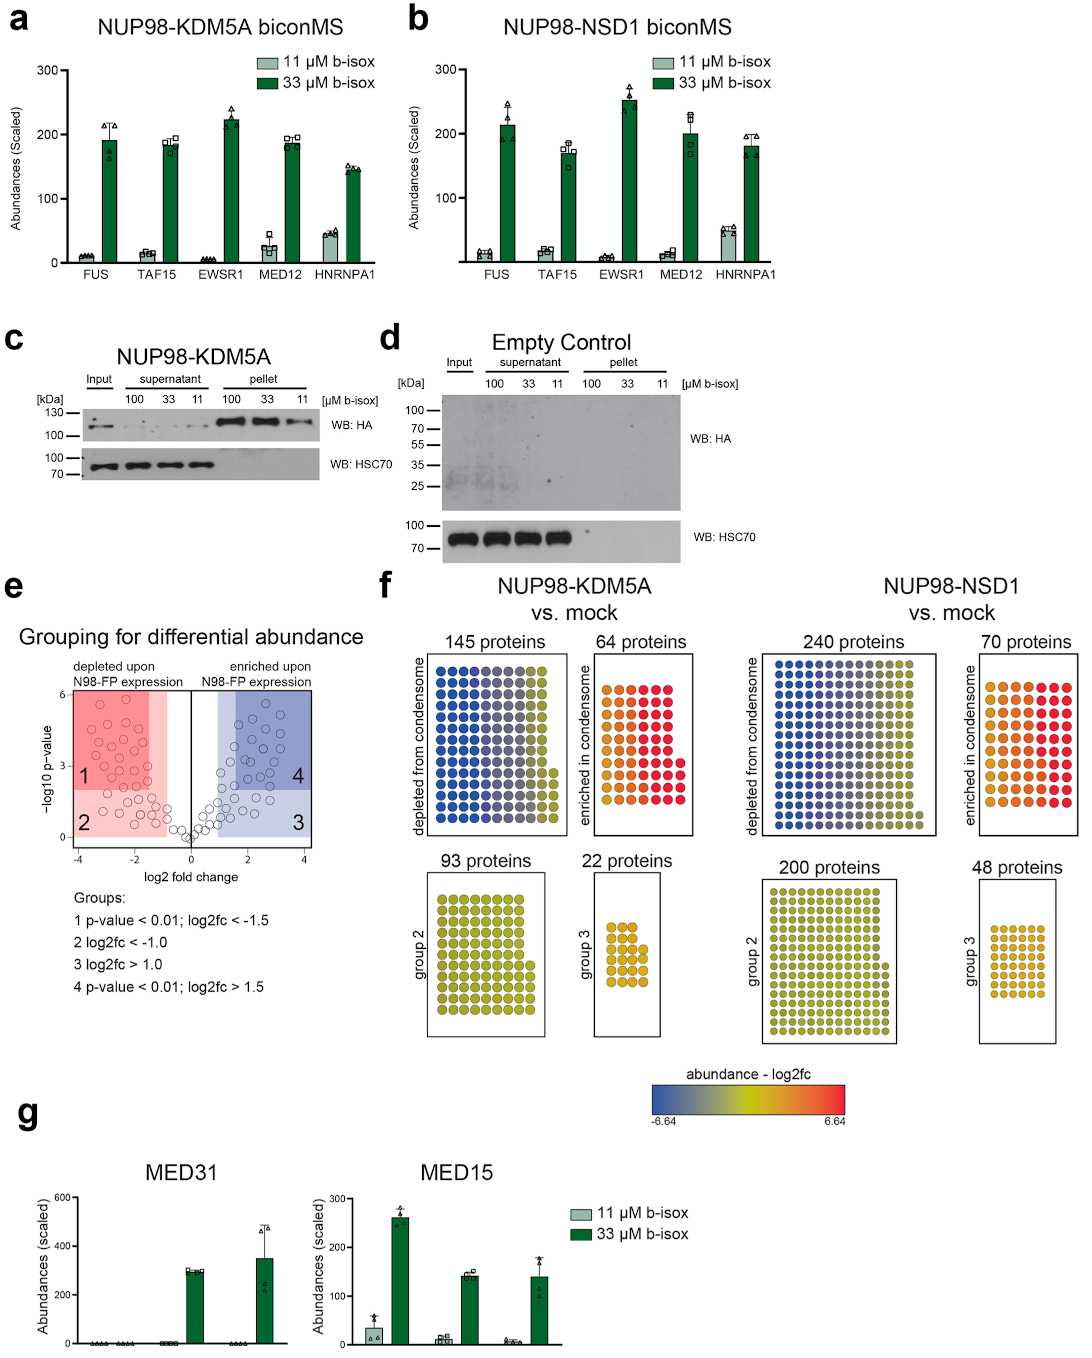
a, Normalized and scaled protein abundances for selected proteins previously implicated in the formation of biomolecular condensates identified by biCon-MS from lysates of HL-60 cells expressing NUP98-KDM5A. Graph shows individual data points, mean and s.d. for n = 4 (2 biological, 2 technical replicates). b, Normalized and scaled protein abundances for selected proteins previously implicated in the formation of biomolecular condensates identified by biCon-MS within lysates of HL-60 cells expressing NUP98-NSD1. Graph shows individual data points, mean and s.d. for n = 4 (2 biological, 2 technical replicates). c, Western blot analysis of NUP98-KDM5A-expressing NIH-3T3 cell lysates treated with 11 μM, 33 μM or 100 μM b-isox. Dose-dependent precipitation was investigated for NUP98-KDM5A and HSC70 as loading control. One representative blot of three independent experiments is shown. d, Western blot analysis of NIH-3T3 cell lysates treated with 11 μM, 33 μM or 100 μM b-isox. Dose-dependent precipitation was investigated for HSC70. One representative blot of three independent experiments is shown. Blot is representative of three independent experiments. Uncropped images for panels c and d are available in Supplementary Fig. 1. e, Schematic illustration of enriched/depleted proteins identified in fusion protein biCon-MS compared to mock-transduced HL-60 cells. f, Enrichment of proteins that exhibit dose-dependent precipitation upon expression of NUP98-KDM5A and NUP98-NSD1 as compared to mock-transduced HL-60 cells based on abundances in biCon-MS analysis. Enriched/depleted proteins in NUP98-fusion protein condensates are illustrated as nodes and are colored according to calculated fold change values. Depletion cutoff: log2(fc) < −1.5 and p-value < 0.01 Enrichment cutoff: log2(fc) > 1.5 and p-value < 0.01. P-value was calculated using a two-sided ANOVA test. g, Normalized and scaled abundances of significantly enriched (MED31) or depleted (MED15) proteins in NUP98-fusion protein condensomes as identified by biCon-MS. Graph shows individual data points, mean and s.d. for n = 4 (2 biological, 2 technical replicates).
Extended Data Fig. 6. biCon-MS for artAA-KDM5A and artFG-KDM5A, Related to Fig. 6.
Volcano plot of (a) artAA-KDM5A and (b) artFG-KDM5A for
11 μM and 33 μM condensomes, generated from normalized protein abundances obtained by biCon-MS. The significance cutoff was log2(fc) < -1 or > 1 and p-value < 0.01. (c) GO (Molecular Function) analysis for 237 proteins precipitated by b-isox in artFG-KDM5A-vs. artAA-KDM5A-expressing cells. (d) Normalized and scaled abundances of selected enriched proteins in the artFG-KDM5A-induced condensome as identified by biCon-MS. Graph shows individual data points, mean and s.d. for n = 4 (2 biological and 2 technical replicates).
Extended Data Fig. 7. RNA-seq of mouse fetal liver cells, Related to Fig. 7.
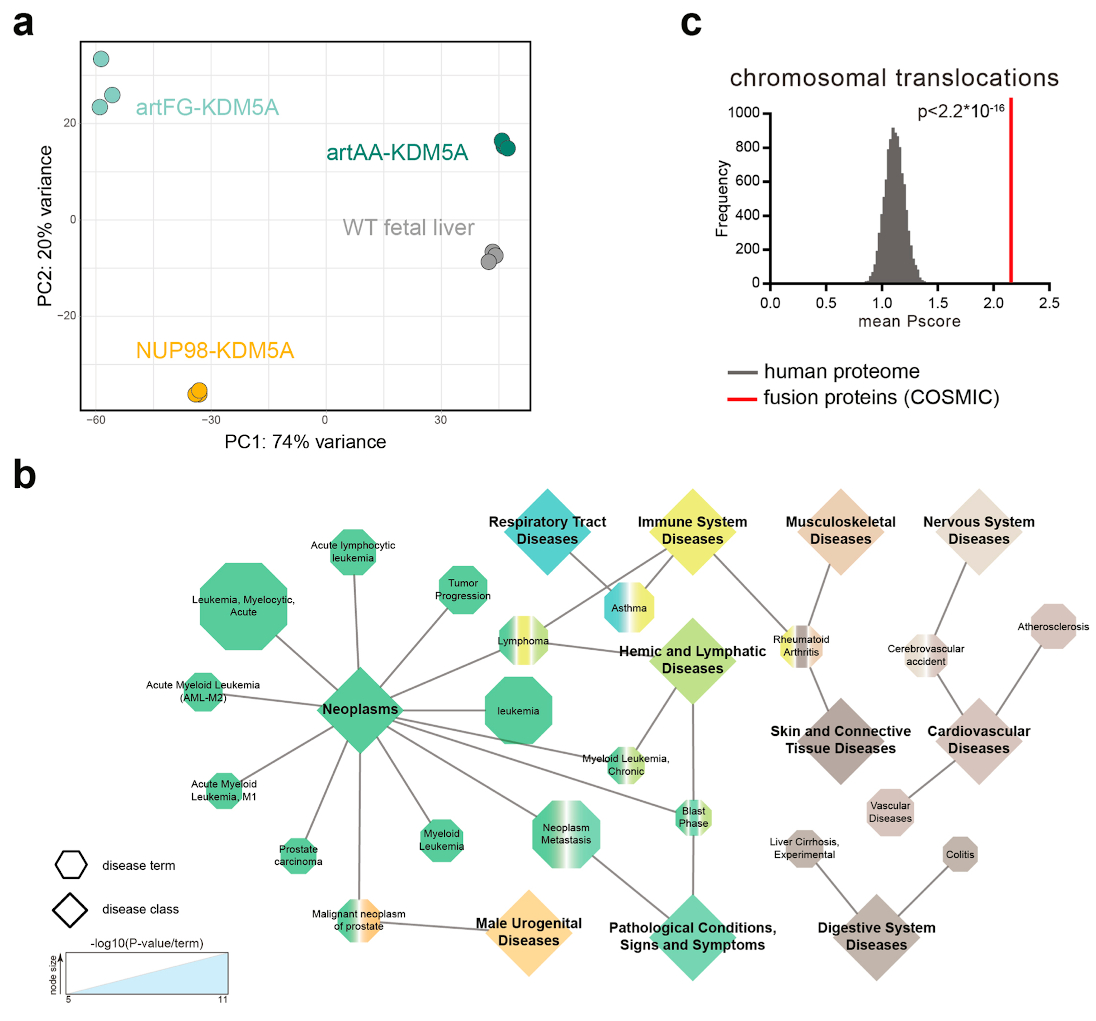
a, Principal component analysis based on normalized expression profiles of RNA-seq from murine wild type fetal liver cells and cells expressing NUP98-KDM5A, artAA-KDM5A or artFG-KDM5A. b, 761 genes that are differentially regulated upon expression of NUP98-KDM5A and artFG-KDM5A were grouped using DisGeNET according to related diseases. Most significant disease terms are illustrated as hexagons sized according to their p-value. Corresponding disease classes are shown as diamonds connected by edges to diseases, defined by DiGeNET. c, The mean PScore for all proteins involved in cancer gene fusions listed in COSMIC was compared to a list of 10,000 randomly subsampled lists of the human proteome with the same size. The p-value was calculated using the two-sided, two-sample Kolmogorov-Smirnov test, D = 0.26114, p-value < 2.2e-16.
Supplementary Material
Acknowledgements
We thank all members of the Grebien laboratory for stimulating discussions and A. Orlova for help with QUANT-seq experiments. A. Spittler, G. Hofbauer (Core Facility Flow Cytometry, Medical University of Vienna), S. Fajmann and P. Jodl (Institute of Pharmacology and Toxicology, University of Veterinary Medicine Vienna) are acknowledged for cell sorting. This research was supported using resources of the VetCore Facility (Imaging) of the University of Veterinary Medicine Vienna. Next-generation sequencing was performed at the VBCF NGS Unit (https://www.viennabiocenter.org/facilities/). In addition, we thank all members of the Proteomics and Metabolomics Facility (CeMM Research Center for Molecular Medicine of the Austrian Academy of Sciences) for the proteomics analysis. J.S. is a recipient of a DOC Fellowship of the Austrian Academy of Sciences at the University of Veterinary Medicine Vienna. This work was supported by a grant from the European Research Council under the European Union’s Horizon 2020 research and innovation programme (grant agreement no. 636855/StG) to F.G. E.M.T. was supported by a fellowship of the Austrian Science Fund (FWF, Elise Richter Fellowship V506-B28).
Footnotes
Reporting Summary: Further information on research design is available in the Nature Research Reporting Summary linked to this article.
Publisher’s note
Springer Nature remains neutral with regard to jurisdictional claims in published maps and institutional affiliations.
Author contributions
S.T.-Z, F.G.L. and F.G. designed the study; S.T.-Z, J.S., F.G.L and F.G. developed the methodology; S.T.-Z., T.H., T.E. and A.C.M. performed data analysis; S.T.-Z., T.H., J.S., N.K., E.H., G.M. and K.P. conducted experiments and collected data; T.E. performed bioinformatics analysis and developed software; S.T.-Z. and F.G. wrote the initial draft; S.T.-Z., T.H., T.E., N.K. and F.G. generated visualization of the data; F.G. supervised the project; S.T-Z. and F.G. coordinated responsibility for the research activity; E.M.T. and F.G. acquired funding; all authors revised the final manuscript prior to submission.
Competing interests
The authors declare no competing interests.
Additional information
Extended data is available for this paper at https://doi.org/10.1038/s41594-020-00550-w.
Supplementary information is available for this paper at https://doi.org/10.1038/s41594-020-00550-w.
Peer review information Nature Structural & Molecular Biology thanks Christopher Slape and the other, anonymous, reviewer(s) for their contribution to the peer review of this work. Peer reviewer reports are available. Inês Chen was the primary editor on this article and managed its editorial process and peer review in collaboration with the rest of the editorial team.
Reprints and permissions information is available at www.nature.com/reprints.
Data availability
LC–MS/MS data have been deposited into the PRIDE database under the accession number PXD022518.
RNA-seq data have been deposited into the GEO under the accession number GSE159037. Source data are provided with this paper.
Code availability
R script implemented for group size–dependent testing statistic (GSDTS) is available at https://github.com/Edert/R-scripts
References
- 1.Mitelman F, Johansson B, Mertens F. The impact of translocations and gene fusions on cancer causation. Nat Rev Cancer. 2007;7:233–245. doi: 10.1038/nrc2091. [DOI] [PubMed] [Google Scholar]
- 2.Mertens F, Johansson B, Fioretos T, Mitelman F. The emerging complexity of gene fusions in cancer. Nat Rev Cancer. 2015;15:371–381. doi: 10.1038/nrc3947. [DOI] [PubMed] [Google Scholar]
- 3.Zhao J, Lee SH, Huss M, Holme P. The network organization of cancer-associated protein complexes in human tissues. Sci Rep. 2013;3:1583. doi: 10.1038/srep01583. [DOI] [PMC free article] [PubMed] [Google Scholar]
- 4.Reckel S, et al. Differential signaling networks of Bcr–Abl p210 and p190 kinases in leukemia cells defined by functional proteomics. Leukemia. 2017;31:1502–1512. doi: 10.1038/leu.2017.36. [DOI] [PMC free article] [PubMed] [Google Scholar]
- 5.Skucha A, et al. MLL-fusion-driven leukemia requires SETD2 to safeguard genomic integrity. Nat Commun. 2018;9:1983. doi: 10.1038/s41467-018-04329-y. [DOI] [PMC free article] [PubMed] [Google Scholar]
- 6.Gough SM, Slape CI, Aplan PD. NUP98 gene fusions and hematopoietic malignancies: common themes and new biologic insights. Blood. 2011;118:6247–6257. doi: 10.1182/blood-2011-07-328880. [DOI] [PMC free article] [PubMed] [Google Scholar]
- 7.Struski S, et al. NUP98 is rearranged in 3.8% of pediatric AML forming a clinical and molecular homogenous group with a poor prognosis. Leukemia. 2017;31:565–572. doi: 10.1038/leu.2016.267. [DOI] [PubMed] [Google Scholar]
- 8.Radu A, Moore MS, Blobel G. The peptide repeat domain of nucleoporin Nup98 functions as a docking site in transport across the nuclear pore complex. Cell. 1995;81:215–222. doi: 10.1016/0092-8674(95)90331-3. [DOI] [PubMed] [Google Scholar]
- 9.Jeganathan KB, Malureanu L, van Deursen JM. The Rae1–Nup98 complex prevents aneuploidy by inhibiting securin degradation. Nature. 2005;438:1036–1039. doi: 10.1038/nature04221. [DOI] [PubMed] [Google Scholar]
- 10.Capelson M, et al. Chromatin-bound nuclear pore components regulate gene expression in higher eukaryotes. Cell. 2010;140:372–383. doi: 10.1016/j.cell.2009.12.054. [DOI] [PMC free article] [PubMed] [Google Scholar]
- 11.Capitanio JS, Montpetit B, Wozniak RW. Human Nup98 regulates the localization and activity of DExH/D-box helicase DHX9. Elife. 2017;6:e18825. doi: 10.7554/eLife.18825. [DOI] [PMC free article] [PubMed] [Google Scholar]
- 12.Wang GG, et al. Haematopoietic malignancies caused by dysregulation of a chromatin-binding PHD finger. Nature. 2009;459:847–851. doi: 10.1038/nature08036. [DOI] [PMC free article] [PubMed] [Google Scholar]
- 13.Yassin ER, Abdul-Nabi AM, Takeda A, Yaseen NR. Effects of the NUP98–DDX10 oncogene on primary human CD34+ cells: role of a conserved helicase motif. Leukemia. 2010;24:1001–1011. doi: 10.1038/leu.2010.42. [DOI] [PMC free article] [PubMed] [Google Scholar]
- 14.Wang GG, Cai L, Pasillas MP, Kamps MP. NUP98-NSD1 links H3K36 methylation to Hox-A gene activation and leukaemogenesis. Nat Cell Biol. 2007;9:804–812. doi: 10.1038/ncb1608. [DOI] [PubMed] [Google Scholar]
- 15.Franks TM, et al. Nup98 recruits the Wdr82–Set1A/COMPASS complex to promoters to regulate H3K4 trimethylation in hematopoietic progenitor cells. Genes Dev. 2017;31:2222–2234. doi: 10.1101/gad.306753.117. [DOI] [PMC free article] [PubMed] [Google Scholar]
- 16.Brangwynne CP, et al. Germline P granules are liquid droplets that localize by controlled dissolution/condensation. Science. 2009;324:1729–1732. doi: 10.1126/science.1172046. [DOI] [PubMed] [Google Scholar]
- 17.Molliex A, et al. Phase separation by low complexity domains promotes stress granule assembly and drives pathological fibrillization. Cell. 2015;163:123–133. doi: 10.1016/j.cell.2015.09.015. [DOI] [PMC free article] [PubMed] [Google Scholar]
- 18.Schmidt HB, Görlich D. Nup98 FG domains from diverse species spontaneously phase-separate into particles with nuclear pore-like permselectivity. Elife. 2015;4:e04251. doi: 10.7554/eLife.04251. [DOI] [PMC free article] [PubMed] [Google Scholar]
- 19.Schmoellerl J, et al. CDK6 is an essential direct target of NUP98-fusion proteins in acute myeloid leukemia. Blood. 2020;136:387–400. doi: 10.1182/blood.2019003267. [DOI] [PMC free article] [PubMed] [Google Scholar]
- 20.Fahrenkrog B, et al. Expression of Leukemia-Associated Nup98 fusion proteins generates an aberrant nuclear envelope phenotype. PLoS ONE. 2016;11:e0152321. doi: 10.1371/journal.pone.0152321. [DOI] [PMC free article] [PubMed] [Google Scholar]
- 21.Mellacheruvu D, et al. The CRaPome: a contaminant repository for affinity purification–mass spectrometry data. Nat Methods. 2013;10:730–736. doi: 10.1038/nmeth.2557. [DOI] [PMC free article] [PubMed] [Google Scholar]
- 22.Griffis ER, Xu S, Powers MA. Nup98 localizes to both nuclear and cytoplasmic sides of the nuclear pore and binds to two distinct nucleoporin subcomplexes. Mol Biol Cell. 2003;14:600–610. doi: 10.1091/mbc.E02-09-0582. [DOI] [PMC free article] [PubMed] [Google Scholar]
- 23.Ren Y, Seo H-S, Blobel G, Hoelz A. Structural and functional analysis of the interaction between the nucleoporin Nup98 and the mRNA export factor Rae1. Proc Natl Acad Sci USA. 2010;107:10406–10411. doi: 10.1073/pnas.1005389107. [DOI] [PMC free article] [PubMed] [Google Scholar]
- 24.Klein BJ, et al. The histone-H3K4-specific demethylase KDM5B binds to its substrate and product through distinct PHD fingers. Cell Reports. 2014;6:325–335. doi: 10.1016/j.celrep.2013.12.021. [DOI] [PMC free article] [PubMed] [Google Scholar]
- 25.Lucio-Eterovic AK, et al. Role for the nuclear receptor-binding SET domain protein 1 (NSD1) methyltransferase in coordinating lysine 36 methylation at histone 3 with RNA polymerase II function. Proc Natl Acad Sci USA. 2010;107:16952–16957. doi: 10.1073/pnas.1002653107. [DOI] [PMC free article] [PubMed] [Google Scholar]
- 26.Ramos-Mejía V, et al. HOXA9 promotes hematopoietic commitment of human embryonic stem cells. Blood. 2014;124:3065–3075. doi: 10.1182/blood-2014-03-558825. [DOI] [PubMed] [Google Scholar]
- 27.Boija A, et al. Transcription factors activate genes through the phase-separation capacity of their activation domains. Cell. 2018;175:1842–1855.e16. doi: 10.1016/j.cell.2018.10.042. [DOI] [PMC free article] [PubMed] [Google Scholar]
- 28.Patel A, et al. A liquid-to-solid phase transition of the ALS protein FUS accelerated by disease mutation. Cell. 2015;162:1066–1077. doi: 10.1016/j.cell.2015.07.047. [DOI] [PubMed] [Google Scholar]
- 29.Nott TJ, et al. Phase transition of a disordered nuage protein generates environmentally responsive membraneless organelles. Mol Cell. 2015;57:936–947. doi: 10.1016/j.molcel.2015.01.013. [DOI] [PMC free article] [PubMed] [Google Scholar]
- 30.Vernon RM, et al. Pi-Pi contacts are an overlooked protein feature relevant to phase separation. Elife. 2018;7:e31486. doi: 10.7554/eLife.31486. [DOI] [PMC free article] [PubMed] [Google Scholar]
- 31.Kato M, et al. Cell-free formation of RNA granules: low complexity sequence domains form dynamic fibers within hydrogels. Cell. 2012;149:753–767. doi: 10.1016/j.cell.2012.04.017. [DOI] [PMC free article] [PubMed] [Google Scholar]
- 32.Han TW, et al. Cell-free formation of RNA granules: bound RNAs identify features and components of cellular assemblies. Cell. 2012;149:768–779. doi: 10.1016/j.cell.2012.04.016. [DOI] [PubMed] [Google Scholar]
- 33.Schmöllerl J, et al. CDK6 is a common transcriptional target of NUP98-fusion-proteins in acute myeloid leukemia. Blood. 2020;136:387–400. doi: 10.1182/blood.2019003267. [DOI] [PMC free article] [PubMed] [Google Scholar]
- 34.Xu H, et al. NUP98 fusion proteins interact with the NSL and MLL1 complexes to drive leukemogenesis. Cancer Cell. 2016;30:863–878. doi: 10.1016/j.ccell.2016.10.019. [DOI] [PMC free article] [PubMed] [Google Scholar]
- 35.Feric M, et al. Coexisting liquid phases underlie nucleolar subcompartments. Cell. 2016;165:1686–1697. doi: 10.1016/j.cell.2016.04.047. [DOI] [PMC free article] [PubMed] [Google Scholar]
- 36.Gall JG, Bellini M, Wu Z, Murphy C. Assembly of the nuclear transcription and processing machinery: Cajal bodies (coiled bodies) and transcriptosomes. Mol Biol Cell. 1999;10:4385–4402. doi: 10.1091/mbc.10.12.4385. [DOI] [PMC free article] [PubMed] [Google Scholar]
- 37.Sabari BR, et al. Coactivator condensation at super-enhancers links phase separation and gene control. Science. 2018;80 doi: 10.1126/science.aar3958. eaar3958. [DOI] [PMC free article] [PubMed] [Google Scholar]
- 38.Cho W-K, et al. Mediator and RNA polymerase II clusters associate in transcription-dependent condensates. Science. 2018;361:412–415. doi: 10.1126/science.aar4199. [DOI] [PMC free article] [PubMed] [Google Scholar]
- 39.Banani SF, Lee HO, Hyman AA, Rosen MK. Biomolecular condensates: organizers of cellular biochemistry. Nat Rev Mol Cell Biol. 2017;18:285–298. doi: 10.1038/nrm.2017.7. [DOI] [PMC free article] [PubMed] [Google Scholar]
- 40.Chong S, et al. Imaging dynamic and selective low-complexity domain interactions that control gene transcription. Science. 80 doi: 10.1126/science.aar2555. eaar2555. [DOI] [PMC free article] [PubMed] [Google Scholar]
- 41.Schürmann M, et al. Three-dimensional correlative single-cell imaging utilizing fluorescence and refractive index tomography. J Biophotonics. 2018;11:e201700145. doi: 10.1002/jbio.201700145. [DOI] [PubMed] [Google Scholar]
- 42.Kasper LH, et al. CREB binding protein interacts with nucleoporin-specific FG repeats that activate transcription and mediate NUP98-HOXA9 oncogenicity. Mol Cell Biol. 1999;19:764–776. doi: 10.1128/mcb.19.1.764. [DOI] [PMC free article] [PubMed] [Google Scholar]
- 43.Romana SP, et al. NUP98 rearrangements in hematopoietic malignancies: a study of the Groupe Francophone de Cytogénétique Hématologique. Leukemia. 2006;20:696–706. doi: 10.1038/sj.leu.2404130. [DOI] [PubMed] [Google Scholar]
- 44.Griffis ER, Altan N, Lippincott-Schwartz J, Powers MA. Nup98 is a mobile nucleoporin with transcription-dependent dynamics. Mol Biol Cell. 2002;13:1282–1297. doi: 10.1091/mbc.01-11-0538. [DOI] [PMC free article] [PubMed] [Google Scholar]
- 45.Wang J, et al. A molecular grammar governing the driving forces for phase separation of prion-like RNA binding proteins. Cell. 2018;174:688–699.e16. doi: 10.1016/j.cell.2018.06.006. [DOI] [PMC free article] [PubMed] [Google Scholar]
- 46.Shin Y, et al. Liquid nuclear condensates mechanically sense and restructure the genome. Cell. 2018;175:1481–1491.e13. doi: 10.1016/j.cell.2018.10.057. [DOI] [PMC free article] [PubMed] [Google Scholar]
- 47.Soutourina J, Wydau S, Ambroise Y, Boschiero C, Werner M. Direct interaction of RNA polymerase II and mediator required for transcription in vivo. Science. 2011;331:1451–1454. doi: 10.1126/science.1200188. [DOI] [PubMed] [Google Scholar]
- 48.Kuo Y-H, et al. Runx2 induces acute myeloid leukemia in cooperation with Cbfβ-SMMHC in mice. Blood. 2009;113:3323–3332. doi: 10.1182/blood-2008-06-162248. [DOI] [PMC free article] [PubMed] [Google Scholar]
- 49.Gaidzik VI, et al. TET2 mutations in acute myeloid leukemia (AML): results from a comprehensive genetic and clinical analysis of the AML study group. J Clin Oncol. 2012;30:1350–1357. doi: 10.1200/JCO.2011.39.2886. [DOI] [PubMed] [Google Scholar]
- 50.Xu S, Powers MA. In vivo analysis of human nucleoporin repeat domain interactions. Mol Biol Cell. 2013;24:1222–1231. doi: 10.1091/mbc.E12-08-0585. [DOI] [PMC free article] [PubMed] [Google Scholar]
- 51.Xu S, Powers MA. Nup98-homeodomain fusions interact with endogenous Nup98 during interphase and localize to kinetochores and chromosome arms during mitosis. Mol Biol Cell. 2010;21:1585–1596. doi: 10.1091/mbc.E09-07-0561. [DOI] [PMC free article] [PubMed] [Google Scholar]
- 52.Yung E, et al. Delineating domains and functions of NUP98 contributing to the leukemogenic activity of NUP98-HOX fusions. Leuk Res. 2011;35:545–550. doi: 10.1016/j.leukres.2010.10.006. [DOI] [PMC free article] [PubMed] [Google Scholar]
- 53.Boulay G, et al. Cancer-specific retargeting of BAF complexes by a prion-like domain. Cell. 2017;171:163–178.e19. doi: 10.1016/j.cell.2017.07.036. [DOI] [PMC free article] [PubMed] [Google Scholar]
- 54.Longo PA, Kavran JM, Kim M-S, Leahy DJ. Transient mammalian cell transfection with polyethylenimine (PEI) Methods Enzymol. 2013;529:227. doi: 10.1016/B978-0-12-418687-3.00018-5. [DOI] [PMC free article] [PubMed] [Google Scholar]
- 55.Fiji. Colocalisation_Analysis: Fiji’s plugin for colocalization analysis. 2020 https://github.com/fiji/Colocalisation_Analysis.
- 56.Schneider CA, Rasband WS, Eliceiri KW. NIH Image to ImageJ: 25 years of image analysis. Nat Methods. 2012;9:671–675. doi: 10.1038/nmeth.2089. [DOI] [PMC free article] [PubMed] [Google Scholar]
- 57.Schindelin J, et al. Fiji: an open-source platform for biological-image analysis. Nat Methods. 2012;9:676–682. doi: 10.1038/nmeth.2019. [DOI] [PMC free article] [PubMed] [Google Scholar]
- 58.Wisniewski JR, Zougman A, Nagaraj N, Mann M. Universal sample preparation method for proteome analysis. Nat Methods. 2009;6:359–362. doi: 10.1038/nmeth.1322. [DOI] [PubMed] [Google Scholar]
- 59.Olsen JV, et al. Parts per million mass accuracy on an Orbitrap mass spectrometer via lock mass injection into a C-trap. Mol Cell Proteom. 2005;4:2010–2021. doi: 10.1074/mcp.T500030-MCP200. [DOI] [PubMed] [Google Scholar]
- 60.Chambers MC, et al. A cross-platform toolkit for mass spectrometry and proteomics. Nat Biotechnol. 2012;30:918–920. doi: 10.1038/nbt.2377. [DOI] [PMC free article] [PubMed] [Google Scholar]
- 61.Barsnes H, Vaudel M. SearchGUI: a highly adaptable common interface for proteomics search and de novo engines. J Proteome Res. 2018;17:2552–2555. doi: 10.1021/acs.jproteome.8b00175. [DOI] [PubMed] [Google Scholar]
- 62.The Uniprot Consortium. UniProt: a worldwide hub of protein knowledge. Nucleic Acids Res. 2019;47:D506–D515. doi: 10.1093/nar/gky1049. [DOI] [PMC free article] [PubMed] [Google Scholar]
- 63.Vaudel M, et al. PeptideShaker enables reanalysis of MS-derived proteomics data sets. Nat Biotechnol. 2015;33:22–24. doi: 10.1038/nbt.3109. [DOI] [PubMed] [Google Scholar]
- 64.Zhang X, et al. Proteome-wide identification of ubiquitin interactions using UbIA-MS. Nat Protoc. 2018;13:530–550. doi: 10.1038/nprot.2017.147. [DOI] [PubMed] [Google Scholar]
- 65.Shannon P, et al. Cytoscape: a software environment for integrated models of biomolecular interaction networks. Genome Res. 2003;13:2498–2504. doi: 10.1101/gr.1239303. [DOI] [PMC free article] [PubMed] [Google Scholar]
- 66.Bindea G, et al. ClueGO: a Cytoscape plug-in to decipher functionally grouped gene ontology and pathway annotation networks. Bioinformatics. 2009;25:1091–1093. doi: 10.1093/bioinformatics/btp101. [DOI] [PMC free article] [PubMed] [Google Scholar]
- 67.Warnes GR, et al. Various R programming tools for plotting data. 2016 R package. https://cran.r-project.org/web/packages/gplots/index.html.
- 68.Andrews S. FastQC: a quality control tool for high throughput sequence data. 2010 https://www.bioinformatics.babraham.ac.uk/projects/fastqc/
- 69.Schmieder R, Edwards R. Quality control and preprocessing of metagenomic datasets. Bioinformatics. 2011;27:863–864. doi: 10.1093/bioinformatics/btr026. [DOI] [PMC free article] [PubMed] [Google Scholar]
- 70.Dobin A, et al. STAR: ultrafast universal RNA-seq aligner. Bioinformatics. 2013;29:15–21. doi: 10.1093/bioinformatics/bts635. [DOI] [PMC free article] [PubMed] [Google Scholar]
- 71.Li H, et al. The sequence alignment/map format and SAMtools. Bioinformatics. 2009;25:2078–2079. doi: 10.1093/bioinformatics/btp352. [DOI] [PMC free article] [PubMed] [Google Scholar]
- 72.Liao Y, Smyth GK, Shi W. featureCounts: an efficient general purpose program for assigning sequence reads to genomic features. Bioinformatics. 2014;30:923–930. doi: 10.1093/bioinformatics/btt656. [DOI] [PubMed] [Google Scholar]
- 73.Love MI, Huber W, Anders S. Moderated estimation of fold change and dispersion for RNA-seq data with DESeq2. Genome Biol. 2014;15:550. doi: 10.1186/s13059-014-0550-8. [DOI] [PMC free article] [PubMed] [Google Scholar]
- 74.Johnson WE, Li C, Rabinovic A. Adjusting batch effects in microarray expression data using empirical Bayes methods. Biostatistics. 2007;8:118–127. doi: 10.1093/biostatistics/kxj037. [DOI] [PubMed] [Google Scholar]
- 75.Leek JT, Johnson WE, Parker HS, Jaffe AE, Storey JD. The sva package for removing batch effects and other unwanted variation in high-throughput experiments. Bioinformatics. 2012;28:882–883. doi: 10.1093/bioinformatics/bts034. [DOI] [PMC free article] [PubMed] [Google Scholar]
Associated Data
This section collects any data citations, data availability statements, or supplementary materials included in this article.
Supplementary Materials
Data Availability Statement
LC–MS/MS data have been deposited into the PRIDE database under the accession number PXD022518.
RNA-seq data have been deposited into the GEO under the accession number GSE159037. Source data are provided with this paper.
R script implemented for group size–dependent testing statistic (GSDTS) is available at https://github.com/Edert/R-scripts


