

Abstract
This study aimed to identify optimal cold-temperature indices that are associated with the elevated risks of mortality from, and outpatient visits for all causes and cardiopulmonary diseases during the cold seasons (November to April) from 2000 to 2008 in Northern, Central and Southern Taiwan. Eight cold-temperature indices, average, maximum, and minimum temperatures, and the temperature humidity index, wind chill index, apparent temperature, effective temperature (ET), and net effective temperature and their standardized Z scores were applied to distributed lag non-linear models. Index-specific cumulative 26-day (lag 0–25) mortality risk, cumulative 8-day (lag 0–7) outpatient visit risk, and their 95% confidence intervals were estimated at 1 and 2 standardized deviations below the median temperature, comparing with the Z score of the lowest risks for mortality and outpatient visits. The average temperature was adequate to evaluate the mortality risk from all causes and circulatory diseases. Excess all-cause mortality increased for 17–24% when average temperature was at Z = − 1, and for 27–41% at Z = − 2 among study areas. The cold-temperature indices were inconsistent in estimating risk of outpatient visits. Average temperature and THI were appropriate indices for measuring risk for all-cause outpatient visits. Relative risk of all-cause outpatient visits increased slightly by 2–7% when average temperature was at Z = − 1, but no significant risk at Z = − 2. Minimum temperature estimated the strongest risk associated with outpatient visits of respiratory diseases. In conclusion, the relationships between cold temperatures and health varied among study areas, types of health event, and the cold-temperature indices applied. Mortality from all causes and circulatory diseases and outpatient visits of respiratory diseases has a strong association with cold temperatures in the subtropical island, Taiwan.
Abbreviations: AIC, Akaike's information criterion; AT, apparent temperature; CI, confidence interval; CWB, Central Weather Bureau; DLNM, distributed lag non-linear model; ET, effective temperature; Flu, influenza; NET, net effective temperature; NHRI, National Health Research Institute; PM10, particulate matter less than 10 μm in aerodynamic diameter; RR, relative risk; RH, relative humidity; THI, temperature humidity index; TEPA, Taiwan Environmental Protection Administration; WCI, wind chill index; WS, wind speed; WVP, water vapor pressure
Keywords: Mortality, Outpatient visits, Temperature index, Taiwan
Highlights
-
•
Cold temperature elevated mortality from all causes and circulatory diseases.
-
•
Cold temperatures caused greater impact on outpatient visits of respiratory diseases.
-
•
Average temperature was the optimal cold index in association with mortality.
-
•
Minimum temperature was most associated with outpatient visits of respiratory disease.
1. Introduction
High temperatures have garnered considerable attention in Europe and the US because of their short-term adverse health impacts. Increased mortality, emergency room visits, and hospital admissions worldwide have been associated with vulnerable populations exposed to heat waves (Anderson and Bell, 2011, Knowlton et al., 2009, Semenza et al., 1999). However, several studies reported that the adverse health effects of cold temperatures may be more significant than those of high temperatures in Spain, Canada, Shanghai, and Taiwan (Gomez-Acebo et al., 2010, Lin et al., 2011, Ma et al., 2011, Martin et al., 2012, Wang et al., 2012). Mortality risk associated with low temperatures is likely underestimated when studies fail to address the prolonged effect of low temperature (Martin et al., 2012, Mercer, 2003).
Ambient temperatures, including mean, maximum, and minimum temperatures, are usually used to assess temperature-related adverse health effects (Hajat et al., 2007, McMichael et al., 2008, Medina-Ramon and Schwartz, 2007). However, other weather variables, such as relative humidity (RH), wind speed (WS), and water vapor pressure may also affect human perceptions of ambient temperature. The cold effect is most severe when accompanied by strong winds (Kunst et al., 1993). Therefore, composite indices, including the temperature humidity index (THI), wind chill index (WCI) (Kunst et al., 1994, Woodall, 2004), apparent temperature (AT) (Anderson and Bell, 2009, Chung et al., 2009), effective temperature (ET) (Gomez-Acebo et al., 2010, Gonzalez et al., 1974) and net effective temperature (NET) (Gomez-Acebo et al., 2010, Li and Chan, 2000), have been applied to evaluate health risks associated with cold spells or low temperatures. However, few studies have focused on the cold effect in subtropical areas and its relationship to cold-temperature indices (Gomez-Acebo et al., 2010).
Previous studies have indicated that the effect of cold temperatures on morbidity and mortality varies by the physical environment. Wichmann et al. (2011) reported that no significant association exists between maximum apparent temperature and hospital admissions for respiratory, cardiovascular, and cerebrovascular diseases in Denmark (Wichmann et al., 2011). Multicity studies reported the cold effects were most significant in warm regions (1997; Langford and Bentham, 1995, Wang et al., 2012) or areas with moderate winter climates (Conlon et al., 2011). Residents in warm regions have less physical, social, and behavioral adaptations to low temperatures. Residing in a subtropical area with high temperatures and high humidity, the population in Taiwan is more susceptible to low temperatures than to high temperatures (Chen et al., 1995, Lin et al., 2011, Wang et al., 2012, Wu et al., 2011, Yang et al., 2009). Therefore, this study aimed to identify cold-temperature indices appropriate to evaluate the association between temperature and health events in Taiwan. This study reported the cumulative relative risks for mortality and outpatient visits of all causes and cardiopulmonary diseases associated with eight standardized cold-temperature indices—average, maximum, and minimum temperatures, and THI, WCI, AT, ET, and NET.
2. Materials and methods
2.1. Study setting
We obtained vital statistics from the Department of Health, Taiwan, universal health insurance claims from the National Health Research Institutes, daily meteorological data from the Central Weather Bureau, Taiwan, and daily air pollution data from Taiwan Environmental Protection Administration, for the period between 2000 and 2008. Representative data of the study population, climate and air pollution in Taiwan were extracted for three major metropolitan areas: Taipei (Taipei City and New Taipei City); Central Taiwan (Taichung, Zhanghua and Nantou); and Southern Taiwan (Kaohsiung and Pingtung), which accounted for 63.7% of Taiwan's total population.
Daily area-specific deaths from all causes (ICD9 000-999), Circulatory diseases (ICD9 390-459), and respiratory diseases (ICD9 460-519), as defined by the 9th Revision of the International Classification of Diseases (ICD9), were compiled for analysis.
The National Health Research Institutes has established a database with insurance claims data for a representative cohort of one million residents, representing all insured residents in Taiwan (Taiwan National Health Insurance Research Database, 2012). Diseases were also coded according to the 9th revision of the International Classification of Diseases with Clinical Modification (ICD9 CM). Daily area-specific outpatient visits for all causes (ICD9 CM 000-999), circulatory (ICD9 CM 390-459), and respiratory (ICD9 CM 460-519) diseases were retrieved from these electronic records.
The Central Weather Bureau provided us the hourly surface weather records (i.e., average, maximum, and minimum temperatures, RH, dew-point temperature, water vapor pressure, and WS), available at 3, 4 and 4 stations in Taipei, Central Taiwan, and Southern Taiwan, respectively (Taiwan Central Weather Bureau, 2012). The Taiwan Air Quality Monitoring Network established by the Taiwan Environmental Protection Administration has accumulated also hourly data of 74 stationary monitoring stations distributed throughout the island since 1993 (Taiwan Environmental Protection Administration, 2012). Concentrations of ambient air pollutants, such as particulate matter less than 10 μm in aerodynamic diameter (PM10), nitrogen dioxide (NO2), and ozone (O3) were available from all stations. This study estimated the daily average values of PM10, O3, and NO2 available from 14, 10, and 13 general air quality stations in Taipei, Central Taiwan, and Southern Taiwan, respectively. A previous study reported the detailed locations of the ambient environment monitoring stations (Lin et al., 2012). The hourly records were used to estimate the area-specific daily ambient environment status.
2.2. Cold-temperature indices
This study evaluates eight cold-temperature indices, including single temperature measurements and composite indices, which have been widely used in studies of the association between temperature and health. Table 1 describes these indices in detail. Briefly, average, maximum, and minimum temperatures were recorded to represent current daily ambient temperatures. The WCI, based on ambient temperature and WS, was used to evaluate the combined effect of temperature and wind, especially during the cold seasons (Roshan et al., 2010). Wind draws heat away from the exposed body, making exposed people feel cold (Siple and Passel, 1945). To assess temperature exposure for humans, Taiwan Central Weather Bureau adopts the THI (Rosenberg et al., 1983), which resembles the thermal discomfort index developed by the US Weather Bureau, and widely used in Europe (Pantavou et al., 2011). The AT, which defines human thermal comfort, can be combined with temperature, atmospheric pressure and WS into one indicator (Steadman, 1984). The ET encompasses air temperature and RH that has been applied as a biometeorological index of man's thermal discomfort (Gonzalez et al., 1974, Hentschel, 1987). The NET uses temperature, RH, and WS as a cooling indicator (Li and Chan, 2000).
Table 1.
Summary of the single and composite cold-temperature indices used in this study.
| Index name | Abbreviation | Variables used | Equation/definition |
|---|---|---|---|
| Daily average temperature | Tavg. | Air temperature (°C) | Daily 24 hour average |
| Daily maximum temperature | Tmax. | Air temperature (°C) | The maximum hourly temperature in a day |
| Daily minimum temperature | Tmin. | Air temperature (°C) | The minimum hourly temperature in a day |
| Temperature humidity index (Rosenberg et al., 1983) | THI | 1. T: air temperature (°C) | |
| 2. tb: dew point temperature (°C) | |||
| Wind chill index(Osczevski and Bluestein, 2005) | WCI | 1.T: air temperature (°C) | WCI = 13.12 + 0.6215T - 11.37vh0.16 + 0.3965T · vh0.16 |
| 2.vh: wind speed (km/h) | |||
| Apparent temperature (Steadman, 1984) | AT | 1. T: air temperature (°C) | AT = − 2.7 + 1.04 × T + 2e − (0.65v) |
| 2. e: water vapor pressure (KPa) | |||
| 3. v: wind speed (m/s) | |||
| Effective temperature (Gonzalez et al., 1974) | ET | 1.T: ambient temperature (°C) | ET = T − 0.4(T − 10)(1 − 0.01H) |
| 2. H: relative humidity (%) | |||
| Net effective temperature (Li and Chan, 2000) | NET | 1.T: ambient temperature (°C) | |
| 2. H: relative humidity (%) | |||
| 3. v: wind speed (m/s) |
2.3. Statistical analysis
We used the locally weighted least square regression smoother (LOESS) to assess each cold-temperature index (original measurements and their standardized values—Z score) for associations with cause-specific mortality and outpatient visits at a 5-day lag. The span was set to 1, and degree was set to 2. The study area (c)-specific cold-temperature index X i,t c (i = 1–8 for eight different cold-temperature indices) on day (t) was transformed into a standardized value (Z i,t c) using the following equation:
where μ i c is the mean and σ i c is the standard deviation of cold-temperature index measured during the cold periods in 2000–2008.
This study estimated cumulative relative risk (RR) and the 95% confidence interval (CI) from lag 0 to lag 25 for temperature–mortality associations and from lag 0 to lag 7 for temperature–outpatient visit associations using the distributed lag non-linear model (DLNM) (Gasparrini et al., 2010). The model for expected deaths and number of outpatient visits at day (t) in each area (c) is:
where Y t c is expected deaths/number of outpatient visits for area c on day t. A linear relationship was assumed between number of deaths/outpatient visits and air pollutants—PM10, O3, and NO2—with zero thresholds and a maximum 5-day lag; AP j,t c represents air pollutants (j = 1–3 for PM10, O3, and NO2) for area c on day t and NS(X i,t c or Z i,t c,5; lag,3) are natural cubic splines of measurements or Z-values for each cold-temperature index i = 1–8, and the lag space was set as natural cubic splines function as well. This study set 5 degrees of freedom (df) for cold-temperature indices and Z-values, and the cold effect was accumulated for 26 days (lag 0 to lag 25) for mortality and for 8 days (lag 0 to 7) for number of outpatient visits under 4 and 3 df lag space, respectively. The smoother time term (time) was set at 3 df per cold period. Moreover, year was treated as an additional categorical variable in models to control for annual variation in number of deaths or outpatient visits (e.g., sudden drop in number of outpatient visits due to the outbreak of severe acute respiratory syndrome in 2003). Other covariates, such as number of daily deaths and outpatient visits for pneumonia and influenza (Flu t c, ICD9 and ICD9 CM codes 480–487), public holiday and day of the week were also adjusted in the models. The Akaike information criterion (AIC) (Akaike, 1973) was adopted for the comparison among models. A lower AIC value indicates a better model fit.
The cold-temperature index varies; it would be unable to estimate the risk of ambient temperature using the same measurement for these 8 cold-temperature indices. Therefore, the cumulative RRs of cause-specific mortality and outpatient visits were estimated by comparing the risk associated with the standardized values (Z) of − 1 and − 2 (i.e., at the 15.9th and 2.3th percentiles, respectively) with that at Z of 0 or 1 (i.e., the 50th and 84.1th percentiles of average temperature in the study cold periods) for each cold-temperature index (the centered values in DLNMs). This method was similar to that used in a previous work to estimate the relative risk of six temperature indices at the 5th percentile (Gomez-Acebo et al., 2010). Data manipulation and all statistical analyses were performed using SAS version 9.1 (SAS Institute, Inc., Cary, NC, USA) and Statistical Environment R 2.12.
3. Results
3.1. Basic environmental and climatic characteristics for study areas
Table 2 summarizes the characteristics of climatic factors and air pollutants in the study areas during November and April in 2000–2008. Average temperature was lower in Northern Taiwan (18.7 °C in Taipei) than in Southern Taiwan (22.7 °C) during the cold period. Average RH across three study areas was approximately 75%, and WS was 0.5–10.6 m/s. Pearson's correlation coefficients measured among these 8 cold-temperature indices were all higher than 0.94 (data not shown). The ambient concentrations of PM10 and O3 were the highest in Southern Taiwan. The Taipei metropolitan area had wider ranges in cold-temperature index values than other areas. Southern Taiwan had higher cold-temperature index values than other areas.
Table 2.
Characteristics of temperatures and air pollutants among study areas during November–April in 2000–2008.
| Covariate | Min | Q1 | Q2 | Q3 | Max | Mean | S.D. |
|---|---|---|---|---|---|---|---|
| Taipei | |||||||
| Tavg. | 7.87 | 16.3 | 18.9 | 21.1 | 28.2 | 18.7 | 3.73 |
| Tmax. | 8.83 | 19.0 | 22.3 | 25.6 | 34.3 | 22.2 | 4.70 |
| Tmin. | 4.07 | 13.7 | 16.0 | 18.4 | 24.7 | 16.0 | 3.49 |
| THI | 8.10 | 16.0 | 18.3 | 20.3 | 26.2 | 18.2 | 3.30 |
| WCI | 6.53 | 16.3 | 19.4 | 22.2 | 30.4 | 19.2 | 4.46 |
| AT | 5.65 | 15.3 | 18.6 | 21.7 | 31.1 | 18.6 | 4.80 |
| ET | 7.94 | 15.7 | 18.1 | 20.2 | 26.2 | 17.9 | 3.38 |
| NET | − 0.31 | 9.74 | 13.0 | 16.1 | 24.5 | 12.9 | 4.78 |
| PM10, μg/m3 | 12.3 | 33.3 | 49.0 | 69.6 | 222 | 54.0 | 26.9 |
| NO2, ppb | 9.53 | 18.8 | 22.7 | 28.8 | 67.1 | 24.5 | 7.82 |
| O3 of 24 h, ppb | 6.21 | 21.0 | 26.1 | 31.9 | 55.5 | 26.7 | 8.04 |
| Relative humidity, % | 51.7 | 72.3 | 79.3 | 85.3 | 98.5 | 78.4 | 8.96 |
| Water pressure, hPa | 7.00 | 14.3 | 17.1 | 19.8 | 28.5 | 17.2 | 4.20 |
| Wind speed, m/s | 0.57 | 1.75 | 2.43 | 3.10 | 5.13 | 2.46 | 0.89 |
| Central Taiwan | |||||||
| Tavg. | 8.50 | 17.0 | 19.4 | 22.0 | 28.2 | 19.5 | 3.61 |
| Tmax. | 9.40 | 21.0 | 23.8 | 26.5 | 33.4 | 23.6 | 4.02 |
| Tmin. | 6.25 | 13.9 | 16.3 | 19.0 | 24.9 | 16.4 | 3.59 |
| THI | 8.89 | 16.6 | 18.8 | 21.0 | 26.3 | 18.8 | 3.18 |
| WCI | 5.87 | 16.9 | 19.9 | 23.0 | 30.3 | 19.8 | 4.51 |
| AT | 4.55 | 15.3 | 18.7 | 22.3 | 30.6 | 18.7 | 5.08 |
| ET | 8.58 | 16.4 | 18.5 | 20.9 | 26.3 | 18.6 | 3.29 |
| NET | − 3.53 | 9.27 | 12.8 | 16.5 | 23.8 | 12.7 | 5.15 |
| PM10, μg/m3 | 14.5 | 55.1 | 74.6 | 96.4 | 227 | 78.0 | 30.4 |
| NO2, ppb | 8.47 | 19.2 | 23.1 | 27.3 | 52.4 | 23.5 | 6.04 |
| O3 of 24 h, ppb | 3.90 | 19.4 | 24.0 | 29.2 | 56.1 | 24.7 | 8.09 |
| Relative humidity, % | 45.5 | 71.5 | 76.5 | 81.0 | 97.0 | 75.9 | 7.74 |
| Water pressure, hPa | 6.55 | 14.6 | 17.2 | 20.3 | 28.8 | 17.5 | 4.32 |
| Wind speed, m/s | 0.50 | 2.40 | 3.40 | 4.60 | 10.6 | 3.57 | 1.43 |
| Southern Taiwan | |||||||
| Tavg. | 13.2 | 20.8 | 22.8 | 24.8 | 28.8 | 22.7 | 2.85 |
| Tmax. | 15.0 | 24.8 | 26.8 | 29.0 | 33.2 | 26.6 | 3.11 |
| Tmin. | 9.55 | 17.7 | 19.9 | 22.0 | 26.4 | 19.7 | 2.93 |
| THI | 13.4 | 19.8 | 21.5 | 23.3 | 27.3 | 21.4 | 2.53 |
| WCI | 12.0 | 21.5 | 23.9 | 26.4 | 31.1 | 23.7 | 3.50 |
| AT | 10.0 | 20.0 | 22.9 | 25.9 | 31.9 | 22.8 | 4.15 |
| ET | 12.7 | 19.5 | 21.3 | 23.2 | 27.3 | 21.2 | 2.64 |
| NET | 4.14 | 14.3 | 17.0 | 19.7 | 24.9 | 16.8 | 3.95 |
| PM10, μg/m3 | 16.6 | 80.5 | 101 | 121 | 212 | 101 | 31.2 |
| NO2, ppb | 8.99 | 20.8 | 25.1 | 29.2 | 44.3 | 24.9 | 5.98 |
| O3 of 24 h, ppb | 2.59 | 22.6 | 30.1 | 37.5 | 66.7 | 30.0 | 10.8 |
| Relative humidity, % | 50.0 | 68.0 | 71.5 | 75.0 | 94.0 | 71.2 | 5.73 |
| Water pressure, hPa | 9.35 | 16.8 | 19.8 | 23.0 | 31.9 | 19.9 | 4.17 |
| Wind speed, m/s | 1.05 | 2.30 | 3.00 | 3.85 | 6.90 | 3.17 | 1.10 |
Note: Tavg.: daily average temperature; Tmax.: daily maximum temperature; Tmin.: daily minimum temperature; THI: temperature humidity index; WCI: wind chill index; AT: apparent temperature; S.D.: standard deviation.
3.2. Associations between cold-temperature indices and all-cause mortality/outpatient visits at a 5-day lag
Lag effects on death could last for several days after exposure to the cold. The strongest association between temperature and all-cause mortality has been estimated at approximately 4–5 lag days in Taiwan. Fig. 1a presents the associations between all-cause mortality and cold-temperature indices using LOESS at a 5-day lag. Generally, the larger variance existed when the original cold-temperature indices were used. However, the variation patterns of regression lines were alike in the association between standardized Z values and daily deaths, within the range of ± 2 standard deviation. Total deaths increased as cold-temperature index values decreased during the cold period. Fig. 1b shows the temperature-all-cause outpatient visit associations revealed by LOESS at a lag of 5 days. The extremely low temperature (Z < − 2) was also associated with an increased number of all-cause outpatient visits; however, the risk varied slightly with cold-temperature indices.
Fig. 1.
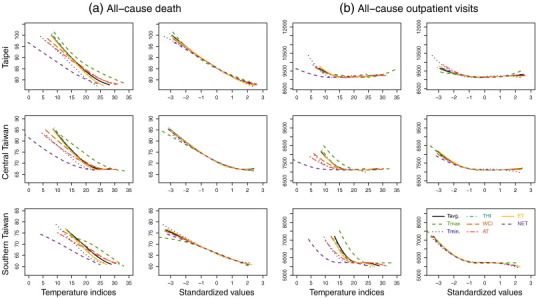
Locally weighted least square regression smoother (LOESS) between (a) all-cause mortality and (b) outpatient visits and (standardized) cold-temperature indices at lag 5 days.
3.3. Associations between cold-temperature indices and mortality/morbidity for cardiopulmonary diseases at a 5-day lag
The temperature–health associations varied with the type of health outcome and the applied cold-temperature indices (Supplementary Fig. 1). Fig. 2 displays the associations between standardized values of cold-temperature index and cause-specific mortality and number of outpatient visits. Mortality from circulatory diseases and number of outpatient visits for respiratory diseases were negatively associated with temperatures in a linear trend. These patterns were similar to the association between temperatures and all-cause mortality. Conversely, this study observed a slightly increased death from respiratory diseases and outpatient visits for circulatory diseases under extremely cold temperatures (i.e., Z < − 2). The associations between health outcomes and standardized cold-temperature indices were consistent among all study areas.
Fig. 2.
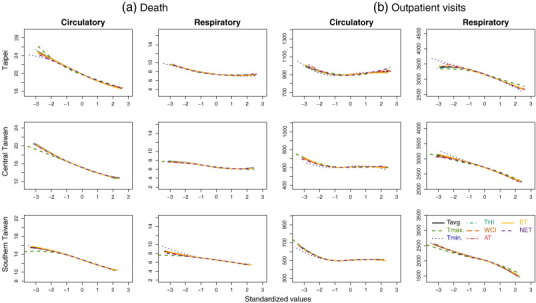
Locally weighted least square regression smoother (LOESS) between (a) mortality from and (b) outpatient visits of circulatory diseases and respiratory diseases and standardized cold-temperature indices at lag 5 days.
3.4. Cumulative relative risk for all-cause mortality/morbidity
Table 3 shows the relative risk of all-cause mortality associated with the 8 cold-temperature indices at − 1 SD and − 2 SD of the temperatures. Based on the selection criteria of lower AIC values, average temperature and ET were the two best cold-temperature indices for associating with all-cause mortality in the three areas (Table 3). However, the AIC values measured in these models were similar. Fig. 2., Fig. 3., Fig. 4. show cumulative 26-day relatively risk of all-cause mortality associated with the original measured cold-temperature indices and their standardized values by area. The lowest mortality risks were observed at Z = 1 (i.e., the 84.1th percentile of average temperature in the cold periods), which was set as baseline value in DLNMs for the study areas (Fig. 2., Fig. 3., Fig. 4.). The cumulative RRs of all-cause mortality had 24%, 17%, and 23% of significant increases in Taipei, Central Taiwan, and Southern Taiwan, respectively, at the average temperature of Z = − 1 (i.e., the 15.9th percentile of average temperature in the cold periods). At the average temperature of Z = − 2 (i.e., the 2.3th percentile of average temperature in the cold periods), the corresponding cumulative RRs increases were 41%, 35%, and 27%, respectively. The overall risk estimates were similar as these eight cold-temperature indices were at Z = − 1; however, these risks varied at Z = − 2.
Table 3.
Relative risks for cold-temperature indices associated with all-cause mortality by distributed lag non-linear model (DLNM).
| Area/cold-temperature index | Reference cold-temperature index* | Relative risk (95% CI)** |
AIC | |
|---|---|---|---|---|
| at − 1 S.D. | at − 2 S.D. | |||
| Taipei | ||||
| Tavg. | 25 | 1.24 (1.14–1.36) | 1.41 (1.28–1.55) | 11778 |
| Tmax. | 29 | 1.21 (1.10–1.33) | 1.40 (1.25–1.55) | 11795 |
| Tmin. | 24 | 1.20 (1.10–1.31) | 1.27 (1.16–1.40) | 11794 |
| THI | 23 | 1.26 (1.16–1.31) | 1.44 (1.30–1.59) | 11780 |
| WCI | 25 | 1.25 (1.14–1.37) | 1.44 (1.30–1.60) | 11781 |
| AT | 25 | 1.32 (1.20–1.45) | 1.51 (1.35–1.70) | 11784 |
| ET | 22 | 1.27 (1.16–1.39) | 1.45 (1.31–1.60) | 11780 |
| NET | 18 | 1.33 (1.21–1.46) | 1.57 (1.40–1.77) | 11787 |
| Central Taiwan | ||||
| Tavg. | 24 | 1.17 (1.07–1.28) | 1.35 (1.22–1.50) | 11369 |
| Tmax. | 27 | 1.11 (1.01–1.22) | 1.25 (1.12–1.38) | 11377 |
| Tmin. | 21 | 1.19 (1.10–1.30) | 1.35 (1.22–1.50) | 11374 |
| THI | 23 | 1.16 (1.06–1.27) | 1.35 (1.22–1.50) | 11371 |
| WCI | 25 | 1.16 (1.05–1.27) | 1.34 (1.21–1.48) | 11372 |
| AT | 25 | 1.14 (1.04–1.26) | 1.37 (1.22–1.53) | 11377 |
| ET | 23 | 1.16 (1.06–1.27) | 1.35 (1.22–1.50) | 11370 |
| 1NET | 19 | 1.12 (1.02–1.24) | 1.32 (1.19–1.47) | 11376 |
| Southern Taiwan | ||||
| Tavg. | 26 | 1.23 (1.12–1.35) | 1.27 (1.15–1.41) | 11310 |
| Tmax. | 30 | 1.23 (1.12–1.36) | 1.28 (1.14–1.43) | 11315 |
| Tmin. | 24 | 1.19 (1.10–1.30) | 1.27 (1.15–1.41) | 11314 |
| THI | 25 | 1.21 (1.10–1.33) | 1.27 (1.15–1.40) | 11308 |
| WCI | 28 | 1.22 (1.11–1.34) | 1.27 (1.15–1.41) | 11310 |
| AT | 28 | 1.18 (1.07–1.30) | 1.27 (1.14–1.42) | 11309 |
| ET | 25 | 1.21 (1.10–1.33) | 1.27 (1.15–1.41) | 11307 |
| NET | 21 | 1.20 (1.09–1.32) | 1.27 (1.15–1.41) | 11311 |
Note: Tavg.: daily average temperature; Tmax.: daily maximum temperature; Tmin.: daily minimum temperature; THI: temperature humidity index; WCI: wind chill index; AT: apparent temperature; ET: effective temperature; NET: net effective temperature.
*Cold-temperature index value with lowest mortality risk in DLNMs (subfigures of temperature indices in Supplementary Figs. 2–4); ** Cumulative 26-day risk estimated based on reference equals to Z = 1 in study area (subfigures of standardized values in Supplementary Figs. 2–4); S.D.: standard deviation; AIC represents Akaike's information criterion values.
The associations measured between the 8 cold-temperature indices and all-cause outpatient visits showed a larger variance, compared with that measured between cold-temperature indices and mortality (Table 4 ). The THI and average temperature were better predictors for all-cause outpatient visits based on their lower AIC values. The lowest risk for outpatient visits was when the temperature indices at Z = 0 or 1 were used as the reference values (Fig. 5., Fig. 6., Fig. 7.). At Z = − 1, the cumulative 8-day RRs of all-cause outpatient visits would have approximately 7%, 3%, and 2% increases in Taipei, Central Taiwan, and Southern Taiwan, respectively. However, when average temperature was at Z = − 2, the cumulative RRs of outpatient visits were not statistically significant.
Table 4.
Relative risks for cold-temperature indices associated with all-cause outpatient visits by distributed lag non-linear model (DLNM).
| Area/cold-temperature index | Reference cold-temperature index* | Relative risk (95% CI)** |
AIC | |
|---|---|---|---|---|
| at − 1 S.D. | at − 2 S.D. | |||
| Taipei | ||||
| Tavg. | 23 | 1.07 (1.07–1.07) | 0.97 (0.97–0.98) | 474126 |
| Tmax. | 24 | 1.02 (1.01–1.02) | 0.92 (0.91–0.92) | 473591 |
| Tmin. | 4 | 1.02 (1.02–1.03) | 1.01 (1.00–1.01) | 475893 |
| THI | 22 | 1.07 (1.07–1.08) | 0.98 (0.97–0.98) | 473905 |
| WCI | 25 | 1.08 (1.07–1.08) | 0.97 (0.97–0.98) | 475594 |
| AT | 25 | 1.07 (1.07–1.08) | 0.98 (0.97–0.98) | 475673 |
| ET | 22 | 1.07 (1.07–1.08) | 0.99 (0.98–0.99) | 476462 |
| NET | 18 | 1.06 (1.05–1.06) | 0.98 (0.97–0.99) | 479716 |
| Central Taiwan | ||||
| Tavg. | 18 | 1.03 (1.03–1.04) | 0.97 (0.97–0.98) | 294469 |
| Tmax. | 22 | 1.00 (0.99–1.00) | 0.95 (0.95–0.96) | 296595 |
| Tmin. | 20 | 1.01 (1.01–1.02) | 1.02 (1.02–1.03) | 296673 |
| THI | 18 | 1.04 (1.03–1.04) | 0.97 (0.97–0.98) | 294370 |
| WCI | 19 | 1.04 (1.03–1.04) | 0.98 (0.97–0.98) | 294503 |
| AT | 18 | 1.04 (1.03–1.04) | 0.98 (0.97–0.98) | 295269 |
| ET | 23 | 1.04 (1.03–1.05) | 0.98 (0.98–0.99) | 295626 |
| NET | 19 | 1.04 (1.04–1.05) | 0.98 (0.98–0.99) | 296493 |
| Southern Taiwan | ||||
| Tavg. | 25 | 1.02 (1.02–1.03) | 1.02 (1.01–1.02) | 222413 |
| Tmax. | 29 | 1.02 (1.01–1.02) | 1.01 (1.01–1.02) | 223067 |
| Tmin. | 22 | 1.02 (1.01–1.02) | 1.04 (1.04–1.05) | 223554 |
| THI | 23 | 1.02 (1.01–1.02) | 1.02 (1.02–1.03) | 222480 |
| WCI | 26 | 1.02 (1.01–1.03) | 1.02 (1.01–1.02) | 222539 |
| AT | 26 | 1.01 (1.01–1.02) | 1.03 (1.02–1.03) | 223396 |
| ET | 25 | 1.02 (1.01–1.03) | 1.03 (1.02–1.03) | 224055 |
| NET | 21 | 1.01 (1.01–1.02) | 1.02 (1.01–1.03) | 224668 |
Note: Tavg.: daily average temperature; Tmax.: daily maximum temperature; Tmin.: daily minimum temperature; THI: temperature humidity index; WCI: wind chill index; AT: apparent temperature; ET: effective temperature; NET: net effective temperature.
*Cold-temperature index value with lowest outpatient visits risk in DLNMs (subfigures of temperature indices in Supplementary Figs. 5–7);** Cumulative 8-day risk estimated based on reference equals to Z = 1 in study area (subfigures of standardized values in Supplementary Figs. 5–7); S.D.: standard deviation; AIC represents Akaike's information criterion values.
3.5. Cumulative relative risk for cause-specific mortality/morbidity
Supplementary Tables 1–2 list the cumulative RRs for mortality from, and outpatient visits of circulatory and respiratory diseases. The AIC values measured for area-specific cold-temperature indices associated with mortality from cardiopulmonary diseases were generally the same (Supplementary Table 1). All cold-temperature indices can be properly used to predict the association between mortality from cardiopulmonary and cold temperature, and average temperature may be the optimal cold-temperature index. Using the standardized temperature at Z = 1 with the lowest mortality as reference, the cumulative RRs for mortality from circulatory diseases increased significantly at the average temperatures of Z = − 1 and − 2 for 48% and 78% in Taipei, 36% and 61% in Central Taiwan, and 49% and 63% in Southern Taiwan, respectively. Cold had no effect on mortality from respiratory diseases.
Minimum temperature was the best to predict the association between cold temperatures and number of outpatient visits. The outpatient visits for respiratory diseases were associated with the extremely low temperatures at Z = − 2 (Supplementary Table 2), with cumulative RRs increased for 18% in Taipei, 25% in Central Taiwan, and 31% in Southern Taiwan, compared with reference set at Z = 1. Cumulative RRs for outpatient visits for circulatory diseases were higher at Z = − 1 than at Z = − 2. Extremely cold temperatures had no effect on outpatient visits for circulatory diseases.
3.6. Delayed effects of low temperature on all-cause mortality
Because of limited space, this study presents only the delayed effects of low temperature on all-cause mortality. Fig. 8., Fig. 9., Fig. 10. show area-specific RR in different lags (left column) and cumulative RRs across lags (right column) for all-cause mortality associated with standardized values of average temperature, i.e. Z = 0, − 1, and − 2. RRs for all-cause mortality were generally peaked at lags 4–5. The prolonged adverse effect of low temperature lasted longer in Central Taiwan than in Taipei and Southern Taiwan, in which the cumulative RRs showed a plateau after 20-day and 10-day lags, respectively.
4. Discussion
This is the first study to assess relationships between cold temperatures and mortality from and outpatient visits for all causes, circulatory diseases, and respiratory diseases using several common cold-temperature indices in Taiwan, which is located in subtropical Asia. Standardization of cold-temperature indices eliminated scale differences of indices, facilitating comparisons among models for the estimated risks. Average temperature is the optimal cold-temperature index in predicting all-cause and cause-specific mortalities. The optimal index for predicting cause-specific outpatient visits varied with disease type. The daily average temperature and composite ET are the best indices for associating all-cause outpatient visits. Minimum temperature is the best index for predicting the number of outpatient visits for respiratory diseases. All-cause mortality was found to have a negative association with temperature that increased by 17–24% when average temperature was at Z = − 1 and by 27–41% when average temperature was at Z = − 2 for the three study areas. The relative risk of all-cause outpatient visits increases slightly by 2–7% at Z = − 1; however, the risk is not significant at Z = − 2. Low temperatures have greater adverse effects on mortality from circulatory diseases and outpatient visits for respiratory diseases than on other health effects.
Previous studies demonstrated that the effects of cold may last for more than 21 days (Braga et al., 2001, Wu et al., 2013, Xie et al., 2013) because of mortality displacement. Xie et al. reported the lag risk of mortality associated with extreme cold event could last for up to 4 weeks for population in southeastern China (Xie et al., 2013); the cumulative RRs generally increase as the cumulative lag days increase in Guangzhou and Taishan, consistent with our findings (Fig. 8., Fig. 9., Fig. 10.).
Health disorders associated with the extreme cold and extreme heat vary among study areas. High temperatures had greater adverse effects on mortality from all causes and cardiopulmonary diseases than cold temperatures in 15 European cities and Beijing (Baccini et al., 2008, Liu et al., 2011). However, a Canadian study concluded that residents experience a greater and longer lasting mortality risk from low temperatures than from high temperatures (Martin et al., 2012). In addition, Ma et al. (2011) found that a cold spell exhibits a greater impact on hospital admissions than a heat wave in Shanghai (Ma et al., 2011). The European 15 cities in the PHEWE study and the 11 cities in eastern United States with warm climate have a large adverse effect on all-cause mortality when it is cold (The Eurowinter Group, 1997, Analitis et al., 2008, Curriero et al., 2002). In Taiwan, studies have also confirmed that low temperature causes greater impact on mortality in comparison with that of high temperature (Lin et al., 2011, Wu et al., 2011).
The adverse health effect of temperature varies with temperature measurements, health outcomes, statistical modeling, and demographic factors (Basu and Samet, 2002, Ye et al., 2012). Our study identified negative linear relationships between cold temperatures and mortality from all causes and circulatory diseases, in agreement with the findings in England and in other 15 European cities (Analitis et al., 2008, Langford and Bentham, 1995). However, in Spain, the mortality risk is apparent only in extremely cold environments (i.e., at temperatures lower than the 5th percentile) (Gomez-Acebo et al., 2010). Although a meta-analysis for 15 European cites indicated that the cold effect was strongest on mortality from respiratory diseases (Analitis et al., 2008), findings obtained by this study are in agreement with results reported in South Korea, Europe, and the World Health Organization project — Multinational MONItoring of trends and determinants in CArdiovascular disease (MONICA project). These studies indicated that low temperatures have greater adverse effects on mortality from cardiovascular disease than on mortality from respiratory diseases (1997; Barnett et al., 2005, Ha et al., 2009, Huynen et al., 2001).
Contradictorily, from the present study it appears that temperature may have a significant relationship with only outpatient visits for respiratory diseases in the 3 study areas and all causes in Southern Taiwan. Cold has no significant relation with outpatient visits of circulatory diseases at temperatures lower than the 5th percentile based on DLNMs. This finding is similar to that obtained by a Hong Kong study, indicating that the relationship between general practitioner consultations for respiratory disease and cold temperature was significant; however, no significant relationship exists between cardiovascular disease and cold temperature (Hajat and Haines, 2002). The incidence and severity of respiratory infections increases when it is cold, leading to increased hospital admission (Mourtzoukou and Falagas, 2007). However, a Shanghai study found increased hospital admissions during cold spells for both cardiovascular and respiratory diseases (Ma et al., 2011). The type of disease and geographic and demographic factors may be attributed to the ecological difference.
Few studies have evaluated morbidity associated with cold temperatures in subtropical areas. Our findings provide useful understanding for cold effect. We recommend that additional studies should be conducted to clarify the relationship between temperature and morbidity in non-temperate countries.
Various temperature indices, including daily average temperature, minimum temperature, and other composite indices, have been used to assess the strength of the association between temperature and adverse health outcomes (Carder et al., 2005, Gomez-Acebo et al., 2010, Ye et al., 2012). However, no methodology has been standardized for the best prediction of the temperature-related health loss. The general population may easily appreciate a single temperature measurement, such as an average temperature, which can be easily measured by the public (1997; Lin et al., 2011, Martin et al., 2012). Europe's PHEWE project adopted maximum 3-hourly apparent temperature (Tappmax) in association with the risks of mortality and hospital admission because Tappmax combines temperature and humidity that consider the effects of evaporation and perspiration in warm environment (Michelozzi et al., 2007). Two studies found that WCI has been concluded as a better marker than other temperature measurements for estimating cold-related health outcomes in two studies (Carder et al., 2005, Kunst et al., 1994). Gomez-Acebo et al. (2010)) found minimum temperature the most sensible measure among all single temperature measurements. However, they concluded that the risk patterns were very similar, regardless of which indicator was used (Gomez-Acebo et al., 2010). A study in Seoul found minor differences in the mortality risks among assessments using average temperatures, minimum temperatures, and the changes of temperatures between days (Ha et al., 2009). After adjusting for humidity, Anderson et al. failed to observe significant differences in temperature–mortality associations measured with metrics of average temperature, maximum temperature, and AT. Barnett et al. (2010) further suggested choosing a temperature indicator based on practical concerns for being able to use the integrated data. Our study suggests that average temperature and ET are two optimal cold-temperature indices for modeling the all-cause mortality relationship with cold temperature. For mortality from cardiopulmonary diseases, average temperature is consistently the optimal cold-temperature index for modeling. However, the optimal cold-temperature index varies with cause-specific outpatient visits. The THI and average temperature are better than the other cold-temperature indices in associating low temperatures with all-cause outpatient visits. For the relationship between cold temperature and respiratory outpatient visits, minimum temperature is the best index (Anderson and Bell, 2009, Barnett et al., 2010).
This study did not evaluate how mortality and outpatient visits may be associated with RH and WS, which are regarded as important variables that could affect perceptions of temperature for exposed population. Some studies suggested RH and WS are worthy of further investigation in temperature-health association studies (Analitis et al., 2008, Michelozzi et al., 2007). However, two studies reported no significant association between RH and mortality at low temperatures (Healy, 2003, Schwartz et al., 2004). On the other hand, WS may enhance the cold effect with the accompaniment of strong winds (Kunst et al., 1993). Because some composite cold-temperature indices have considered the effects of RH and WS, we could not observe whether health events are related to RH and WS in this study.
This study used population-based health insurance claims data and national vital statistics instead of individual medical records. Local weather data of the residential areas are used to link population health events instead of measuring individual's real exposure to the cold. Therefore, we were unable to evaluate the specific personal cold exposure and the specific health event responding to the cold. Furthermore, information on personal lifestyle, socioeconomic status, household heater use (Healy, 2003), and anthropometrical and biochemical measures that may confound temperature–health association are not available to this study.
5. Conclusions
This study demonstrates that low temperatures are associated with elevated risk for mortality and outpatient visits. Risks for mortality from all causes and circulatory diseases increase as temperature decreases. Low temperatures have the greatest adverse association with outpatient visits for respiratory diseases. However, we found no significant association between cold temperatures and mortality from respiratory diseases and outpatient visits for circulatory diseases. Standardization of cold-temperature indices facilitates the evaluation of the relationship between various cold-temperature indices and health risks. This study suggests that average temperature and ET are the two best cold-temperature indices for modeling the low temperature–mortality relationship for population residing in the subtropical environment. The optimal cold-temperature index for predicting cause-specific outpatient visits varies among diseases. The THI and average temperature are optimal indices for modeling the relationship between low temperatures and all-cause outpatient visits. Minimum temperature is the best index for predicting outpatient visits for respiratory diseases.
The following are the supplementary data related to this article.
Supplementary Tables
Locally weighted least square regression smoother (LOESS) between (a) mortality from and (b) outpatient visits of circulatory diseases and respiratory diseases and 8 types of temperature indices at lag 5 days.
Cumulative 26-days (lag 0 to lag 25 days) relative risk for all-cause mortality associated with (standardized) temperature indices in Taipei. Relative risks were estimated using DLNM that included daily city-specific averages of PM10, NO2, and O3, daily mortality from pneumonia and influenza, holiday effects, day of the week, and long-term trends.
Cumulative 26-days (lag 0 to lag 25 days) relative risk for all-cause mortality associated with (standardized) temperature indices in Central Taiwan. Relative risks were estimated using DLNM that included daily city-specific averages of PM10, NO2, O3, and daily mortality from pneumonia and influenza, holiday effects, day of the week, and long-term trends.
Cumulative 26-days (lag 0 to lag 25 days) relative risk for all-cause mortality associated with (standardized) temperature indices in Southern Taiwan. Relative risks were estimated using DLNM that included daily city-specific averages of PM10, NO2, and O3, daily mortality from pneumonia and influenza, holiday effects, day of the week, and long-term trends.
Cumulative 8-days (lag 0 to lag 7 days) relative risk for all-cause outpatient visits associated with (standardized) temperature indices in Taipei. Relative risks were estimated using DLNM that included daily city-specific averages of PM10, NO2, and O3, daily outpatient visits of pneumonia and influenza, holiday effects, day of the week, and long-term trends.
Cumulative 8-days (lag 0 to lag 7 days) relative risk for all-cause outpatient visits associated with (standardized) temperature indices in Central Taiwan. Relative risks were estimated using DLNM that included daily city-specific averages of PM10, NO2, and O3, daily outpatient visits of pneumonia and influenza, holiday effects, day of the week, and long-term trends.
Cumulative 8-days (lag 0 to lag 7 days) relative risk for all-cause outpatient visits associated with (standardized) temperature indices in Southern Taiwan. Relative risks were estimated using DLNM that included daily city-specific averages of PM10, NO2, and O3, daily outpatient visits of pneumonia and influenza, holiday effects, day of the week, and long-term trends.
Associations between all-cause mortality and standardized values (Z) of daily average temperature in Taipei during 2000–2008. Left column: RR of all-cause mortality associated with Z equals to 0 (top row) or − 1 (middle row) or − 2 (bottom row) compared to a centered value Z = 1 on lag 0 to lag 25. Right column: Cumulative RRs for all-cause mortality that were estimated using DLNM and a centered value Z = 1 across lags.
Associations between all-cause mortality and standardized values (Z) of daily average temperature in Central Taiwan during 2000–2008. Left column: RR of all-cause mortality associated with Z equals to 0 (top row) or − 1 (middle row) or − 2 (bottom row) compared to a centered value Z = 1 on lag 0 to lag 25. Right column: Cumulative RRs for all-cause mortality that were estimated using DLNM and a centered value Z = 1 across lags.
Associations between all-cause mortality and standardized values (Z) of daily average temperature in Southern Taiwan during 2000–2008. Left column: RR of all-cause mortality associated with Z equals to 0 (top row) or − 1 (middle row) or − 2 (bottom row) compared to a centered value Z = 1 on lag 0 to lag 25. Right column: Cumulative RRs for all-cause mortality that were estimated using DLNM and a centered value Z = 1 across lags.
Acknowledgments
We appreciate the authorities of the Taiwan Department of Health, Taiwan National Health Research Institute, Taiwan Environmental Protection Administration, and Taiwan Central Weather Bureau for providing the research data. Interpretations and conclusions herein do not represent those of these agencies. Ted Knoy is appreciated for his editorial assistance.
Editor: Lidia Morawska
Footnotes
Authors' contribution: All the authors who participated in this study contributed a remarkable part of it. YK Lin, YC Wang, PL Lin, MH Li and TJ Ho designed the study methods and obtained the research data. YC Wang performed the statistical analyses. YK Lin and YC Wang drafted and finalized the manuscript. All authors have read and approved the final version of the manuscript.
Funding: This work was supported by the National Science Council of Taiwan (NSC 96-3111-B-033-001, NSC 100-2621-M-039-001 and NSC 99-2221-E-033-052) and China Medical University Hospital (grant number 1MS1) and the Taiwan Department of Health Clinical Trial and Research Center for Excellence (grant number DOH101-TD-B-111-004). The funders had no role in the study design, data collection and analysis, decision to publish, or preparation of the manuscript.
References
- Akaike H. 2nd International Symposium on Information Theory. 1973. Information theory and an extension of the maximum likelihood principle; pp. 267–281. [Google Scholar]
- Analitis A., Katsouyanni K., Biggeri A., Baccini M., Forsberg B., Bisanti L. Effects of cold weather on mortality: results from 15 European cities within the PHEWE project. Am J Epidemiol. 2008;168:1397–1408. doi: 10.1093/aje/kwn266. [DOI] [PubMed] [Google Scholar]
- Anderson B.G., Bell M.L. Weather-related mortality: how heat, cold, and heat waves affect mortality in the United States. Epidemiology. 2009;20:205–213. doi: 10.1097/EDE.0b013e318190ee08. [DOI] [PMC free article] [PubMed] [Google Scholar]
- Anderson G.B., Bell M.L. Heat waves in the United States: mortality risk during heat waves and effect modification by heat wave characteristics in 43 U.S. communities. Environ Health Perspect. 2011;119:210–218. doi: 10.1289/ehp.1002313. [DOI] [PMC free article] [PubMed] [Google Scholar]
- Baccini M., Biggeri A., Accetta G., Kosatsky T., Katsouyanni K., Analitis A. Heat effects on mortality in 15 European cities. Epidemiology. 2008;19:711–719. doi: 10.1097/EDE.0b013e318176bfcd. [DOI] [PubMed] [Google Scholar]
- Barnett A.G., Dobson A.J., McElduff P., Salomaa V., Kuulasmaa K., Sans S. Cold periods and coronary events: an analysis of populations worldwide. J Epidemiol Community Health. 2005;59:551–557. doi: 10.1136/jech.2004.028514. [DOI] [PMC free article] [PubMed] [Google Scholar]
- Barnett A.G., Tong S., Clements A.C. What measure of temperature is the best predictor of mortality? Environ Res. 2010;110:604–611. doi: 10.1016/j.envres.2010.05.006. [DOI] [PubMed] [Google Scholar]
- Basu R., Samet J.M. Relation between elevated ambient temperature and mortality: a review of the epidemiologic evidence. Epidemiol Rev. 2002;24:190–202. doi: 10.1093/epirev/mxf007. [DOI] [PubMed] [Google Scholar]
- Braga A.L., Zanobetti A., Schwartz J. The time course of weather-related deaths. Epidemiology. 2001;12:662–667. doi: 10.1097/00001648-200111000-00014. [DOI] [PubMed] [Google Scholar]
- Carder M., McNamee R., Beverland I., Elton R., Cohen G.R., Boyd J. The lagged effect of cold temperature and wind chill on cardiorespiratory mortality in Scotland. Occup Environ Med. 2005;62:702–710. doi: 10.1136/oem.2004.016394. [DOI] [PMC free article] [PubMed] [Google Scholar]
- Chen Z.Y., Chang S.F., Su C.L. Weather and stroke in a subtropical area: Ilan, Taiwan. Stroke. 1995;26:569–572. doi: 10.1161/01.str.26.4.569. [DOI] [PubMed] [Google Scholar]
- Chung J.Y., Honda Y., Hong Y.C., Pan X.C., Guo Y.L., Kim H. Ambient temperature and mortality: an international study in four capital cities of East Asia. Sci Total Environ. 2009;408:390–396. doi: 10.1016/j.scitotenv.2009.09.009. [DOI] [PubMed] [Google Scholar]
- Conlon K.C., Rajkovich N.B., White-Newsome J.L., Larsen L., O'Neill M.S. Preventing cold-related morbidity and mortality in a changing climate. Maturitas. 2011;69:197–202. doi: 10.1016/j.maturitas.2011.04.004. [DOI] [PMC free article] [PubMed] [Google Scholar]
- Curriero F.C., Heiner K.S., Samet J.M., Zeger S.L., Strug L., Patz J.A. Temperature and mortality in 11 cities of the eastern United States. Am J Epidemiol. 2002;155:80–87. doi: 10.1093/aje/155.1.80. [DOI] [PubMed] [Google Scholar]
- Gasparrini A., Armstrong B., Kenward M.G. Distributed lag non-linear models. Stat Med. 2010;29:2224–2234. doi: 10.1002/sim.3940. [DOI] [PMC free article] [PubMed] [Google Scholar]
- Gomez-Acebo I., Dierssen-Sotos T., Llorca J. Effect of cold temperatures on mortality in Cantabria (Northern Spain): a case–crossover study. Public Health. 2010;124:398–403. doi: 10.1016/j.puhe.2010.03.025. [DOI] [PubMed] [Google Scholar]
- Gonzalez R.R., Nishi Y., Gagge A.P. Experimental evaluation of standard effective temperature: a new biometeorological index of man's thermal discomfort. Int J Biometeorol. 1974;18:1–15. doi: 10.1007/BF01450660. [DOI] [PubMed] [Google Scholar]
- Ha J., Yoon J., Kim H. Relationship between winter temperature and mortality in Seoul, South Korea, from 1994 to 2006. Sci Total Environ. 2009;407:2158–2164. doi: 10.1016/j.scitotenv.2008.12.029. [DOI] [PubMed] [Google Scholar]
- Hajat S., Haines A. Associations of cold temperatures with GP consultations for respiratory and cardiovascular disease amongst the elderly in London. Int J Epidemiol. 2002;31:825–830. doi: 10.1093/ije/31.4.825. [DOI] [PubMed] [Google Scholar]
- Hajat S., Kovats R.S., Lachowycz K. Heat-related and cold-related deaths in England and Wales: who is at risk? Occup Environ Med. 2007;64:93–100. doi: 10.1136/oem.2006.029017. [DOI] [PMC free article] [PubMed] [Google Scholar]
- Healy J.D. Excess winter mortality in Europe: a cross country analysis identifying key risk factors. J Epidemiol Community Health. 2003;57:784–789. doi: 10.1136/jech.57.10.784. [DOI] [PMC free article] [PubMed] [Google Scholar]
- Hentschel G. Proc. WMO/HMO/UNEP Symposium on Climate and Human Health. I. WMO; Leningrad: 1987. A human biometeorology classification of climate for large and local scales. [Google Scholar]
- Huynen M.M., Martens P., Schram D., Weijenberg M.P., Kunst A.E. The impact of heat waves and cold spells on mortality rates in the Dutch population. Environ Health Perspect. 2001;109:463–470. doi: 10.1289/ehp.01109463. [DOI] [PMC free article] [PubMed] [Google Scholar]
- Knowlton K., Rotkin-Ellman M., King G., Margolis H.G., Smith D., Solomon G. The 2006 California heat wave: impacts on hospitalizations and emergency department visits. Environ Health Perspect. 2009;117:61–67. doi: 10.1289/ehp.11594. [DOI] [PMC free article] [PubMed] [Google Scholar]
- Kunst A.E., Looman C.W., Mackenbach J.P. Outdoor air temperature and mortality in The Netherlands: a time-series analysis. Am J Epidemiol. 1993;137:331–341. doi: 10.1093/oxfordjournals.aje.a116680. [DOI] [PubMed] [Google Scholar]
- Kunst A.E., Groenhof F., Mackenbach J.P. The association between two windchill indices and daily mortality variation in The Netherlands. Am J Public Health. 1994;84:1738–1742. doi: 10.2105/ajph.84.11.1738. [DOI] [PMC free article] [PubMed] [Google Scholar]
- Langford I.H., Bentham G. The potential effects of climate change on winter mortality in England and Wales. Int J Biometeorol. 1995;38:141–147. doi: 10.1007/BF01208491. [DOI] [PubMed] [Google Scholar]
- Li P.W., Chan S.T. Application of a weather stress index for alerting the public to stressful weather in Hong Kong. Meteorol Appl. 2000;7:369–375. [Google Scholar]
- Lin Y.-K., Ho T.-J., Wang Y.-C. Mortality risk associated with temperature and prolonged temperature extremes in elderly populations in Taiwan. Environ Res. 2011;111:1156–1163. doi: 10.1016/j.envres.2011.06.008. [DOI] [PubMed] [Google Scholar]
- Lin Y.K., Chang C.K., Li M.H., Wu Y.C., Wang Y.C. High-temperature indices associated with mortality and outpatient visits: characterizing the association with elevated temperature. Sci Total Environ. 2012;427–428:41–49. doi: 10.1016/j.scitotenv.2012.04.039. [DOI] [PMC free article] [PubMed] [Google Scholar]
- Liu L., Breitner S., Pan X., Franck U., Leitte A.M., Wiedensohler A. Associations between air temperature and cardio-respiratory mortality in the urban area of Beijing, China: a time-series analysis. Environ Health. 2011;10:51. doi: 10.1186/1476-069X-10-51. [DOI] [PMC free article] [PubMed] [Google Scholar]
- Ma W., Xu X., Peng L., Kan H. Impact of extreme temperature on hospital admission in Shanghai, China. Sci Total Environ. 2011;409:3634–3637. doi: 10.1016/j.scitotenv.2011.06.042. [DOI] [PubMed] [Google Scholar]
- Martin S.L., Cakmak S., Hebbern C.A., Avramescu M.L., Tremblay N. Climate change and future temperature-related mortality in 15 Canadian cities. Int J Biometeorol. 2012;56:605–619. doi: 10.1007/s00484-011-0449-y. [DOI] [PubMed] [Google Scholar]
- McMichael A.J., Wilkinson P., Kovats R.S., Pattenden S., Hajat S., Armstrong B. International study of temperature, heat and urban mortality: the ‘ISOTHURM’ project. Int J Epidemiol. 2008;37:1121–1131. doi: 10.1093/ije/dyn086. [DOI] [PubMed] [Google Scholar]
- Medina-Ramon M., Schwartz J. Temperature, temperature extremes, and mortality: a study of acclimatization and effect modification in 50 United States cities. Occup Environ Med. 2007;64(12):827–833. doi: 10.1136/oem.2007.033175. [DOI] [PMC free article] [PubMed] [Google Scholar]
- Mercer J.B. Cold—an underrated risk factor for health. Environ Res. 2003;92:8–13. doi: 10.1016/s0013-9351(02)00009-9. [DOI] [PubMed] [Google Scholar]
- Michelozzi P., Kirchmayer U., Katsouyanni K., Biggeri A., McGregor G., Menne B. Assessment and prevention of acute health effects of weather conditions in Europe, the PHEWE project: background, objectives, design. Environ Health. 2007;6:12. doi: 10.1186/1476-069X-6-12. [DOI] [PMC free article] [PubMed] [Google Scholar]
- Mourtzoukou E.G., Falagas M.E. Exposure to cold and respiratory tract infections. Int J Tuberc Lung Dis. 2007;11:938–943. [PubMed] [Google Scholar]
- Osczevski R., Bluestein M. The new wind chill equivalent temperature chart. Am Meteorol Soc. 2005;86:1453–1458. [Google Scholar]
- Pantavou K., Theoharatos G., Mavrakis A., Santamouris M. Evaluating thermal comfort conditions and health responses during an extremely hot summer in Athens. Build Environ. 2011;46:339–344. [Google Scholar]
- Rosenberg N.J., Verma S.B., Blad B.L. Human and animal biometeorology. Microclimate: The Biological Environment. 1983:425–467. [Google Scholar]
- Roshan G., Mirkatouli G., Shakoor A., Mohammad-Nejad V. Studying wind chill index as a climatic index effective on the health of athletes and tourists interested in winter sports. Asian J Sports Med. 2010;1:108–116. doi: 10.5812/asjsm.34861. [DOI] [PMC free article] [PubMed] [Google Scholar]
- Schwartz J., Samet J.M., Patz J.A. Hospital admissions for heart disease: the effects of temperature and humidity. Epidemiology. 2004;15:755–761. doi: 10.1097/01.ede.0000134875.15919.0f. [DOI] [PubMed] [Google Scholar]
- Semenza J.C., McCullough J.E., Flanders W.D., McGeehin M.A., Lumpkin J.R. Excess hospital admissions during the July 1995 heat wave in Chicago. Am J Prev Med. 1999;16:269–277. doi: 10.1016/s0749-3797(99)00025-2. [DOI] [PubMed] [Google Scholar]
- Siple P.A., Passel C.F. Measurements of dry atmos-pheric cooling in subfreezing temperatures. Proc Am Phil Soc. 1945;89:177–199. [Google Scholar]
- Steadman R.G. A universal scale of apparent temperature. J Climate Appl Meteorol. 1984:1674–1687. [Google Scholar]
- Taiwan Central Weather Bureau The Central Weather Bureau online information. 2012. http://www.cwb.gov.tw/eng/index.htm Available at. [Accessed Date: 2012/12/25]
- Taiwan Environmental Protection Administration Taiwan air quality monitoring network. 2012. http://taqm.epa.gov.tw/taqm/en/PsiAreaHourly.aspx Available at. [Accessed date: 2012/12/25]
- Taiwan National Health Insurance Research Database 2012. http://w3.nhri.org.tw/nhird/en/Data_Subsets.html#S3 Available at. [Accessed Date: 2012/12/25]
- The Eurowinter Group Cold exposure and winter mortality from ischaemic heart disease, cerebrovascular disease, respiratory disease, and all causes in warm and cold regions of Europe. The Eurowinter Group. Lancet. 1997;349:1341–1346. [PubMed] [Google Scholar]
- Wang Y.C., Lin Y.K., Chuang C.Y., Li M.H., Chou C.H., Liao C.H. Associating emergency room visits with first and prolonged extreme temperature event in Taiwan: a population-based cohort study. Sci Total Environ. 2012;416:97–104. doi: 10.1016/j.scitotenv.2011.11.073. [DOI] [PubMed] [Google Scholar]
- Wichmann J., Andersen Z., Ketzel M., Ellermann T., Loft S. Apparent temperature and cause-specific emergency hospital admissions in Greater Copenhagen, Denmark. PLoS One. 2011;6:e22904. doi: 10.1371/journal.pone.0022904. [DOI] [PMC free article] [PubMed] [Google Scholar]
- Woodall A.A. Winter mortality in elderly people in Britain: outdoor exposure and effect of windchill should be taken into consideration. BMJ. 2004;329:976. doi: 10.1136/bmj.329.7472.976-a. [author reply 977] [DOI] [PMC free article] [PubMed] [Google Scholar]
- Wu P.C., Lin C.Y., Lung S.C., Guo H.R., Chou C.H., Su H.J. Cardiovascular mortality during heat and cold events: determinants of regional vulnerability in Taiwan. Occup Environ Med. 2011;68:525–530. doi: 10.1136/oem.2010.056168. [DOI] [PubMed] [Google Scholar]
- Wu W., Xiao Y., Li G., Zeng W., Lin H., Rutherford S. Temperature–mortality relationship in four subtropical Chinese cities: a time-series study using a distributed lag non-linear model. Sci Total Environ. 2013;449:355–362. doi: 10.1016/j.scitotenv.2013.01.090. [DOI] [PubMed] [Google Scholar]
- Xie H., Yao Z., Zhang Y., Xu Y., Xu X., Liu T. Short-term effects of the 2008 cold spell on mortality in three subtropical cities in Guangdong Province, China. Environ Health Perspect. 2013;121:210–216. doi: 10.1289/ehp.1104541. [DOI] [PMC free article] [PubMed] [Google Scholar]
- Yang T.C., Wu P.C., Chen V.Y., Su H.J. Cold surge: a sudden and spatially varying threat to health? Sci Total Environ. 2009;407:3421–3424. doi: 10.1016/j.scitotenv.2008.12.044. [DOI] [PMC free article] [PubMed] [Google Scholar]
- Ye X., Wolff R., Yu W., Vaneckova P., Pan X., Tong S. Ambient temperature and morbidity: a review of epidemiological evidence. Environ Health Perspect. 2012;120:19–28. doi: 10.1289/ehp.1003198. [DOI] [PMC free article] [PubMed] [Google Scholar]
Associated Data
This section collects any data citations, data availability statements, or supplementary materials included in this article.
Supplementary Materials
Supplementary Tables
Locally weighted least square regression smoother (LOESS) between (a) mortality from and (b) outpatient visits of circulatory diseases and respiratory diseases and 8 types of temperature indices at lag 5 days.
Cumulative 26-days (lag 0 to lag 25 days) relative risk for all-cause mortality associated with (standardized) temperature indices in Taipei. Relative risks were estimated using DLNM that included daily city-specific averages of PM10, NO2, and O3, daily mortality from pneumonia and influenza, holiday effects, day of the week, and long-term trends.
Cumulative 26-days (lag 0 to lag 25 days) relative risk for all-cause mortality associated with (standardized) temperature indices in Central Taiwan. Relative risks were estimated using DLNM that included daily city-specific averages of PM10, NO2, O3, and daily mortality from pneumonia and influenza, holiday effects, day of the week, and long-term trends.
Cumulative 26-days (lag 0 to lag 25 days) relative risk for all-cause mortality associated with (standardized) temperature indices in Southern Taiwan. Relative risks were estimated using DLNM that included daily city-specific averages of PM10, NO2, and O3, daily mortality from pneumonia and influenza, holiday effects, day of the week, and long-term trends.
Cumulative 8-days (lag 0 to lag 7 days) relative risk for all-cause outpatient visits associated with (standardized) temperature indices in Taipei. Relative risks were estimated using DLNM that included daily city-specific averages of PM10, NO2, and O3, daily outpatient visits of pneumonia and influenza, holiday effects, day of the week, and long-term trends.
Cumulative 8-days (lag 0 to lag 7 days) relative risk for all-cause outpatient visits associated with (standardized) temperature indices in Central Taiwan. Relative risks were estimated using DLNM that included daily city-specific averages of PM10, NO2, and O3, daily outpatient visits of pneumonia and influenza, holiday effects, day of the week, and long-term trends.
Cumulative 8-days (lag 0 to lag 7 days) relative risk for all-cause outpatient visits associated with (standardized) temperature indices in Southern Taiwan. Relative risks were estimated using DLNM that included daily city-specific averages of PM10, NO2, and O3, daily outpatient visits of pneumonia and influenza, holiday effects, day of the week, and long-term trends.
Associations between all-cause mortality and standardized values (Z) of daily average temperature in Taipei during 2000–2008. Left column: RR of all-cause mortality associated with Z equals to 0 (top row) or − 1 (middle row) or − 2 (bottom row) compared to a centered value Z = 1 on lag 0 to lag 25. Right column: Cumulative RRs for all-cause mortality that were estimated using DLNM and a centered value Z = 1 across lags.
Associations between all-cause mortality and standardized values (Z) of daily average temperature in Central Taiwan during 2000–2008. Left column: RR of all-cause mortality associated with Z equals to 0 (top row) or − 1 (middle row) or − 2 (bottom row) compared to a centered value Z = 1 on lag 0 to lag 25. Right column: Cumulative RRs for all-cause mortality that were estimated using DLNM and a centered value Z = 1 across lags.
Associations between all-cause mortality and standardized values (Z) of daily average temperature in Southern Taiwan during 2000–2008. Left column: RR of all-cause mortality associated with Z equals to 0 (top row) or − 1 (middle row) or − 2 (bottom row) compared to a centered value Z = 1 on lag 0 to lag 25. Right column: Cumulative RRs for all-cause mortality that were estimated using DLNM and a centered value Z = 1 across lags.