Abstract
Objectives
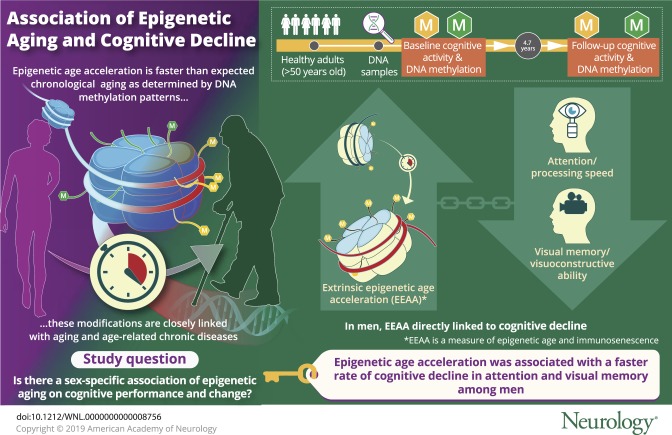
Epigenetic modifications are closely linked with aging, but their relationship with cognition remains equivocal. Given known sex differences in epigenetic aging, we explored sex-specific associations of 3 DNA methylation (DNAm)–based measures of epigenetic age acceleration (EAA) with baseline and longitudinal change in cognitive performance among middle-aged urban adults.
Methods
We used exploratory data from a subgroup of participants in the Healthy Aging in Neighborhoods of Diversity across the Life Span study with complete DNA samples and whose baseline ages were >50.0 years (2004–2009) to estimate 3 DNAm EAA measures: (1) universal EAA (AgeAccel); (2) intrinsic EAA (IEAA); and (3) extrinsic EAA (EEAA). Cognitive performance was measured at baseline visit (2004–2009) and first follow-up (2009–2013) with 11 test scores covering global mental status and specific domains such as learning/memory, attention, visuospatial, psychomotor speed, language/verbal, and executive function. A series of mixed-effects regression models were conducted adjusting for covariates and multiple testing (n = 147–156, ∼51% men, k = 1.7–1.9 observations/participant, mean follow-up time ∼4.7 years).
Results
EEAA, a measure of both biological age and immunosenescence, was consistently associated with greater cognitive decline among men on tests of visual memory/visuoconstructive ability (Benton Visual Retention Test: γ11 = 0.0512 ± 0.0176, p = 0.004) and attention/processing speed (Trail-Making Test, part A: γ11 = 0.219 ± 0.080, p = 0.007). AgeAccel and IEAA were not associated with cognitive change in this sample.
Conclusions
EEAA capturing immune system cell aging was associated with faster decline among men in domains of attention and visual memory. Larger longitudinal studies are needed to replicate our findings.
Human aging involves complex biological and molecular processes whose identification may be key for developing therapies to extend longevity or delay age-associated diseases,1 making its quantification a priority for biomedical and social sciences.1,2 Specifically, epigenetic factors have been linked to neurogenesis,3–5 synaptic plasticity, and long-term memory formation3,6,7 in cognitive aging.
Epigenetics consists of regulatory processes of gene expression, genome integrity, and normal cell function3,8 through heritable changes that are independent of DNA sequence modifications such as mutations. Among 3 epigenetic mediating mechanisms, DNA methylation (DNAm) is the most understood epigenetic marker.3 Hypermethylation generally triggers gene expression silencing, while the reverse is true for hypomethylation.3 Both phenomena are observed in cognitive aging in a gene-specific manner,9 particularly within brain regions involved in memory formation and storage.10
The epigenetic clock derived from DNAm levels is a molecular marker reflecting human cell, tissue, and organ aging, while being highly correlated with age across the life span11 and linked to increased age-related chronic disease and all-cause mortality risk.11–14 While DNAm at specific sites can influence cognitive performance (e.g., global mental status and phonemic fluency),15 few studies have examined the epigenetic clock in relation to cognition,11,15–19 and none have tested sex-specific effects given than men may have faster epigenetic age acceleration (EAA) than women20 and cognitive decline differs by sex.21
We tested sex-specific associations of 3 DNAm-based epigenetic clock measures with cross-sectional and longitudinal cognitive performance using exploratory data from a sample of middle-aged urban adults. We hypothesize that DNAm EAA is directly related to cognitive aging, perhaps differentially by sex.
Methods
Database
Healthy Aging in Neighborhoods of Diversity across the Life Span (HANDLS) is an ongoing prospective cohort study initiated in 2004 aimed at examining racial and socioeconomic disparities in cardiovascular disease and cognitive aging. HANDLS is unique as it recruits an ethnically and socioeconomically diverse sample of African American (AA) and white urban middle-aged adults (baseline age 30–64 years) and collects a range of cognitive measures across time points, as well as clinical and molecular biomarkers spanning multiple physiologic systems. The primary sampling units were 13 Baltimore neighborhoods using an area probability sampling strategy.22
Standard protocol approvals, registrations, and patient consents
The study protocol (09-AG-N248) received approval from the National Institute on Environmental Health Sciences institutional review board (IRB) of the NIH. Upon request, data can be made available to researchers with approved proposals, after they have agreed to confidentiality as required by our IRB. Policies are publicized on handls.nih.gov.
Study sample
The original HANDLS cohort included 3,720 participants (30–65 years, AA and white, phase I, visit 1: 2004–2009). During phase II of visit 1 (also known as the medical research vehicle [MRV] baseline visit: 2004–2009), in-depth examinations were conducted including a fasting blood draw, a physical examination, a dual-energy X-ray absorptiometry scan, an ECG, a cognitive assessment, and a 24-hour dietary recall, followed by a second 24-hour dietary recall telephone interview (3–10 days later). Frozen purified blood mononuclear cells on a subsample of white and AA participants were used to conduct epigenetic analysis. The first follow-up visit (visit 2) was conducted using a similar protocol as the baseline visit (visit 1) during the 2009–2013 period and consisted primarily of an MRV in-depth examination visit. Among participants who completed visit 2, the mean follow-up time was estimated at 4.7 years.
Participant flowchart is presented in figure 1. We included participants >50.0 years of age at baseline (n = 1,670 of 3,720, sample 1a) with cognitive test scores at either visit (baseline age: 30–65 years, visit 1: Nmax = 2,744; visit 2: Nmax = 2,247: excluded from figure 1). Combining both criteria while excluding unreliable cognitive test scores (mainly due to literacy-related or physical/sensory limitations), samples were reduced to 1,219 (visit 1, sample 2a) and 976 (visit 2, sample 2b). Baseline valid and reliable epigenetic data were available for 470 of all baseline ages (30–65 years) and for both white and AA participants (excluded from figure 1). This sample was reduced to 461 for individuals with visit 1 cognitive data and 428 for those with visit 2 cognitive data (excluded from figure 1). Following exclusions of participants ≤50.0 years of age and unreliable or missing cognitive test scores, we attained a sample of N' = 404 observations (207 participants at visit 1 and 197 participants at visit 2; figure e-1, doi.org/10.5061/dryad.6r80s8p: samples 3a and 3b). We further excluded participants with missing covariate data (see Covariates section). As detailed in figure e-1 (doi.org/10.5061/dryad.6r80s8p), samples varied by cognitive test, with up to N' = 304 observations (156 participants [visit 1] and 148 participants [visit 2], samples 5a–5k).
Figure 1. Participant flow chart.
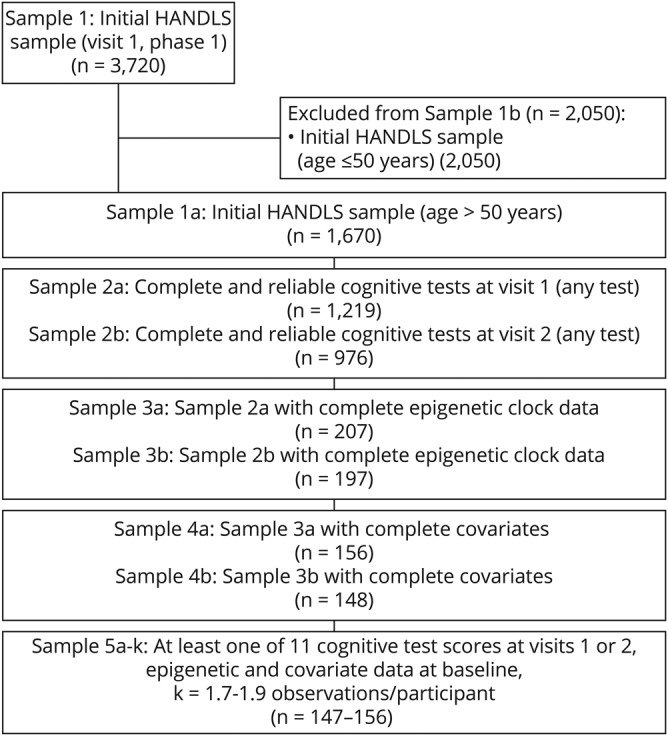
Sample 1 is the initial visit 1, phase 1 selected Healthy Aging in Neighborhoods of Diversity across the Life Span (HANDLS) sample of adults aged 30–64 years (white and African American). Samples 1a and 1b are the subsamples ≤50.0 years and >50.0 years at baseline. Out of sample 1a, sample 2a/2b is the sample of participants with complete and reliable data at visits 1 and 2, respectively, on cognitive test scores. Of those, samples 3a/3b have in addition complete epigenetic data. Finally, excluding those with missing covariates, the result is sample 4a/4b, of whom 147–156 constitute the final analytic sample included in the mixed-effects regression models, k = 1.7–1.9 observations/participant.
Cognitive assessment
Cognitive performance was assessed using 11 derived raw scores from 8 tests, capturing various cognitive domains, as was done in previous studies.23,24 Specifically, the 11 test scores used were as follows: Mini-Mental State Examination (MMSE) total score (global mental status)25; California Verbal Learning Test (CVLT), List A (verbal learning) and delayed free recall (DFR) (verbal memory)26; Benton Visual Retention Test (BVRT)27 (visuospatial/visuoconstruction), total errors; Digit Span Forward and Backward,28 total correct (attention, executive function/working memory); Animal Fluency Test29 (language/verbal fluency), total words minus intrusions/perseverations; Brief Test of Attention (BTA),30 total correct trials of 10; Trail-Making Test (TMT),31 part A (attention) and part B (executive function), number of seconds to completion; and the Clock-Drawing Test32 command total score (0–10) (visuospatial/visuoconstruction). Most cognitive test scores were coded in the direction of higher score reflecting better performance, with the exception of BVRT (total errors), and TMT both parts (expressed in seconds) (e-Methods 1, doi.org/10.5061/dryad.6r80s8p). Following a probe protocol comprehension, HANDLS participants provided informed consent. Although dementia was not diagnosed, participants were screened for cognitive impairment using the MMSE total score.
DNAm and epigenetic clocks
Using a factorial design across sex, race, poverty status, and available DNA samples, a randomly selected sample of 508 participants' DNAm was assessed using 250 ng of DNA extracted from blood and treated with sodium bisulfite as per the manufacturer's protocol (Zymo Research, Orange, CA). Genome-wide DNAm was measured utilizing the Illumina (San Diego, CA) Infinium MethylationEPIC BeadChip. Of the initial 508 participants, 487 had DNAm measures including 12 technical replicates. Briefly, quality control was carried out at the sample and probe levels. At the sample level, 17 samples were excluded due to being outliers, having poor quality methylation values (i.e., a mean detection p value ≥0.01), or having a sex mismatch between their self-report and the methylation prediction. At the probe level, we excluded due to poor quality (mean detection p value ≥0.01), having overlapping single nucleotide polymorphisms (minor allele frequency cutoff = 0.05), cross-hybridizing probes, and probes mapping to the sex chromosomes. Following quality control, DNAm β values were normalized using the normal-exponential out-of-band method33 before calculating DNAm age (epigenetic age/epigenetic clock) for each of the final 470 participants (baseline age 30–65 years). Using DNAm data, proportions of various white blood cell types were also estimated: granulocytes, natural killer cells, monocytes, B cells, CD8+-naive T cells, CD4+ T cells, exhausted CD8+ T cells (CD8+CD28−CD45RA−), plasmablasts, and naive CD8+ T cell (CD8+CD45RA+CCR7+) count.34
DNAm age prediction and EAA measures
DNAm age was computed using the Horvath35 and Hannum et al.36 algorithms using genome-wide selected DNAm β values of 353 and 71 CpGs, respectively. The algorithms were trained and validated using participants with diverse ancestry and DNA derived from multiple tissues including blood. The DNAm age and EAA estimation process is detailed at dnamage.genetics.ucla.edu/home. In brief, the Horvath method predicts age independently of tissue or cell source of DNA and is therefore not dependent on tissue or cell type. In contrast, the Hannum et al. algorithm was developed based on blood DNAm only. Universal EAA (AgeAccel or Epigenetic clock1) are the residuals obtained from regressing DNAm age predicted by the Horvath algorithm on chronological age, with a positive residual value suggesting faster aging and a negative value reflecting slower aging. Two additional EAA measures were used to reflect intrinsic and extrinsic EAA—IEAA (Epigenetic clock 2) and EEAA (Epigenetic clock 3), respectively. Thought to be a measure of a cell's EAA irrespective of white blood cell composition, IEAA is the residual from regressing DNAm age (predicted by the Horvath algorithm) on chronological age and white blood cell proportions (naive CD8+ T cells, exhausted CD8+ T cells, plasmablasts, CD4+ T cells, natural killer cells, monocytes, and granulocytes). EEAA is based on DNAm age predicted by the Hannum et al. algorithm and is thought to be a measure of EAA combined with changes in white blood cell proportions, and thus may indicate immune system cell aging (immunosenescence).12
Covariates
Covariates were selected for their well-established associations with cognitive decline.37–39 Sociodemographic covariates included age at baseline visit, race (white vs AA), sex, marital status (married vs not), educational level (< high school [HS], HS, > HS), poverty status (<125% of federal poverty line for below poverty), employment status (employed vs not), and Wide Range Achievement Test score, which reflects literacy on a continuous scale.40 We also included several lifestyle and health-related factors: body mass index (BMI [kg/m2]), dietary quality, baseline chronic conditions, prescription and over-the-counter nonsteroidal anti-inflammatory drug (NSAID) use over the last 2 weeks, opiate, marijuana, or cocaine use (current vs never or former), smoking status (current vs never or former), and depressive symptoms using the 20-item Center for Epidemiologic Studies–Depression scale (CES-D)41 (e-Methods 1, doi.org/10.5061/dryad.6r80s8p). Dietary quality was operationalized using the Healthy Eating Index (HEI-2010) total score, computed with the mean of two 24-hour dietary recalls that were administered at visit 1, as outlined in appliedresearch.cancer.gov/tools/hei/tools.html and handls.nih.gov/06Coll-dataDoc.html. Baseline chronic conditions included self-reported history of hypertension, dyslipidemia, type 2 diabetes, cardiovascular disease (congestive heart failure, stroke, nonfatal myocardial infarction, or atrial fibrillation), and inflammatory disease (rheumatoid arthritis, gout, multiple sclerosis, systemic lupus, psoriasis, Crohn disease, and thyroid disorder).
Statistical analysis
STATA release 15.0 was utilized for our analyses.42 We estimated population means and proportions with appropriate sampling weights, whereby sex differences were tested using a design-based F-test (svy:tab and svy:reg). We estimated a series of mixed-effects regression models in our primary analysis for each of 11 cognitive test scores as outcomes and each of 3 epigenetic clocks as exposures, yielding a total of 33 models. Each model included years elapsed between visits (time) and interaction terms between time and key exposures as well as covariates. Those interaction terms are interpreted as the effects of exposures and covariates on the slope or annual rate of change in cognitive performance. Main effects of exposures and covariates were also included in each model and are interpreted as fixed effects of exposures and outcome on baseline performance. Repeated outcome measures ranged between 1.7 and 1.9 visits per participant. We assumed the unavailability of outcomes to be missing at random (e-Methods 2, doi.org/10.5061/dryad.6r80s8p).43
To aid in the interpretation of our findings, we plotted our results over time (years) and stratified by standardized epigenetic clock levels (−1 = mean − 1 SD, 0 = mean, +1 = mean + 1 SD). Models were presented for the overall eligible sample and stratified by sex, while statistically testing for moderating effects of sex through the addition of 2- and 3-way interaction terms between exposure, the effect modifier, and time. Covariates included in the overall model and sex-stratified models were the same (with the exclusion of sex in the stratified models) and are listed under the Covariates section. Continuous covariates were centered at their means. A sensitivity analysis was conducted on selected models with significant findings whereby covariates were reduced to those with at least one measure with associated p < 0.10, using a backward elimination process.
Selection bias triggered by systematic differences in key characteristics between selected and excluded samples of the target population may occur. To account for this bias, we conducted a 2-stage Heckman selection process applied to the main mixed-effects regression models. In stage 1, a probit model was used to regress a binary selection variable on sex, race, baseline age, poverty status, and educational attainment. The conditional predicted probability of selection was then utilized to calculate an inverse mills ratio, which at the second stage was entered into the main causal models as a covariate.44
We considered 0.05 and 0.10 as type I errors for main effects and interaction terms, respectively,45 prior to multiple testing adjustment. This adjustment was carried out using a familywise Bonferroni approach while considering cognitive test multiplicity and assuming that each exposure was a distinctive substantive hypothesis.46 Thus significance levels for main effects were p < 0.0045 (0.05/11), p values of 0.10/11 = 0.0090 for 2-way interaction terms, and p values of 0.05 for 3-way interaction terms. This approach is similar to other published works.47
Data availability
Data access request can be sent to principal investigators (PIs) or the study manager, Jennifer Norbeck, at norbeckje@mail.nih.gov. These data are owned by the National Institute on Aging at the NIH. The PIs have made the data restricted to the public for 2 main reasons: “(1) The study collects medical, psychological, cognitive, and psychosocial information on racial and poverty differences that could be misconstrued or willfully manipulated to promote racial discrimination; and (2) Although the sample is fairly large, there are sufficient identifiers that the PIs cannot guarantee absolute confidentiality for every participant as we have stated in acquiring our confidentiality certificate.”23
Results
Compared to those excluded (>50.0 years at baseline), the final analytic sample (i.e., N' = 304 observations) had more men and AA participants, and fewer participants living above the poverty line, based on a probit model that included age, sex, race, education, and poverty status as predictors for sample selectivity. This sample selectivity was adjusted for in our final models using a 2-stage Heckman selection procedure (see Statistical analysis section). When making bivariate baseline comparisons between selected participants (table e-1, doi.org/10.5061/dryad.6r80s8p) (>50.0 years of age, at least one baseline cognitive test performance, DNAm data, and covariates; n = 156) and the remaining sample >50.0 years (n = 1,107), mean ages ± SE were 56.25 ± 0.13 and 57.04 ± 0.13, respectively (p = 0.030, t test); percent male was 53.9 and 42.6, respectively (p = 0.008, χ2 test); percent AA was 51.3 and 57.5, respectively (p = 0.14, χ2 test). Finally, in terms of socioeconomic differences, percent > HS was 30.1 and 36.3, respectively (p = 0.029, χ2 test) and percent above poverty was 51.9 and 64.6, respectively (p = 0.002, χ2 test). Similarly, for visit 2, the selected group had a lower proportion AA (50.7% vs 60.4%, p = 0.026), a lower proportion above poverty (52.0% vs 66.8%, p = 0.001), and a higher proportion of men (54.7% vs 39.8%, p = 0.001), compared to the unselected group.
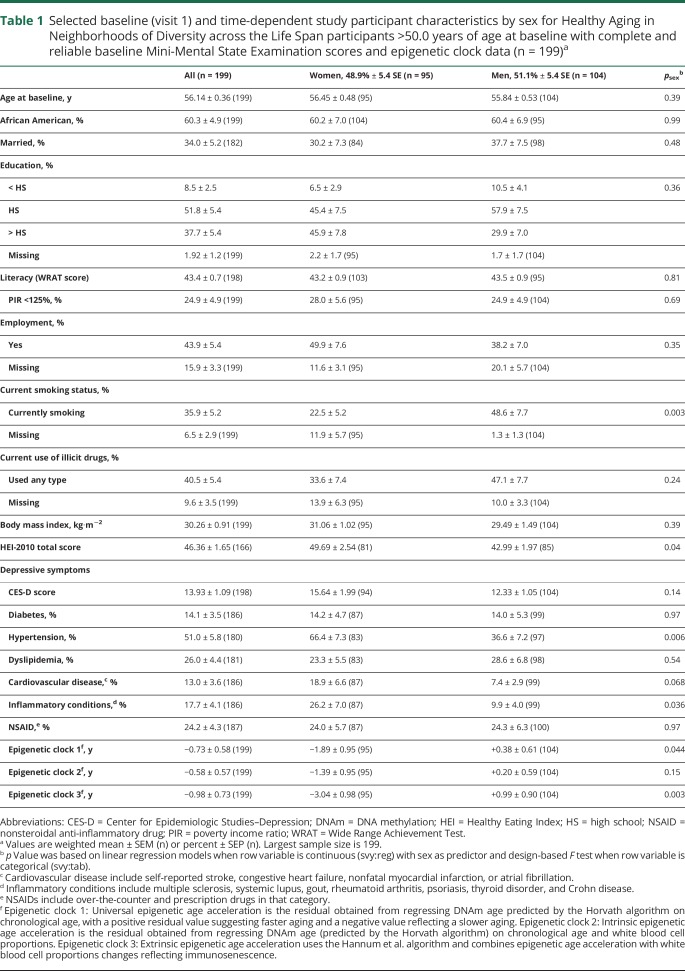
Table 1 displays descriptive measures of selected baseline study characteristics in the total eligible population (>50.0 years at baseline with complete MMSE data and DNAm data at baseline, i.e., sample 2a in figure 1 for MMSE total score) and stratifying by sex. While men were more likely to be current smokers and to have poorer dietary quality than women, prevalent hypertension and inflammatory conditions were higher among women than men. Critically, accelerated aging was higher among men for 2 DNAm measures, namely epigenetic clocks 1 and 3.
Table 1.
Selected baseline (visit 1) and time-dependent study participant characteristics by sex for Healthy Aging in Neighborhoods of Diversity across the Life Span participants >50.0 years of age at baseline with complete and reliable baseline Mini-Mental State Examination scores and epigenetic clock data (n = 199)a
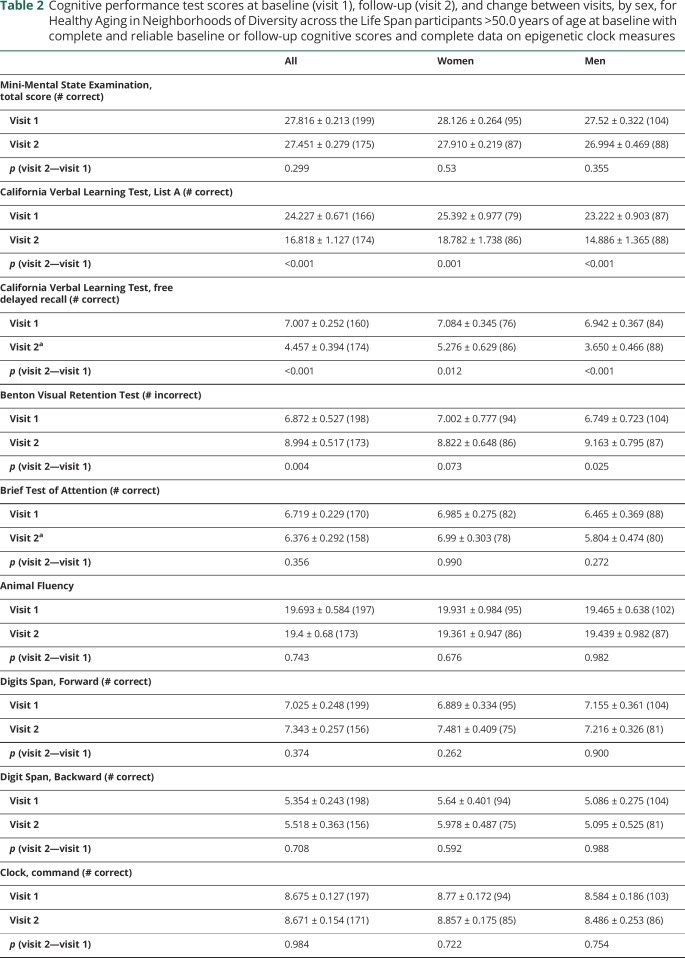
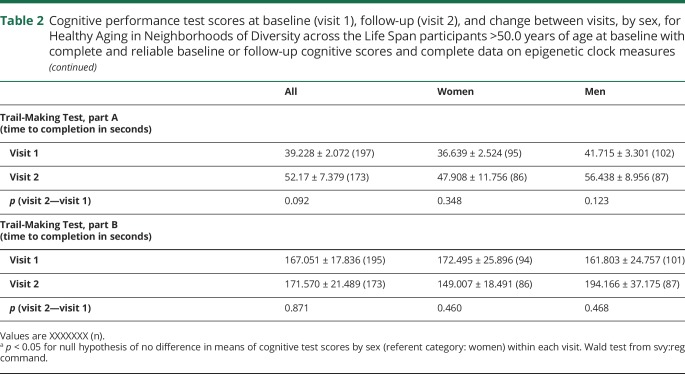
Table 2 displays sex differences in cognitive performance within each data time point, in addition to differences across time points. We noted sex differences at visit 2 in CVLT-DFR and BTA performance, where performance was better among women in the former and among men in the latter. Both men and women exhibited a decline on CVLT List A, CVLT-DFR, and BVRT test performance over time, while a marginally significant decline in performance on the TMT part A was noted in the full sample.
Table 2.
Cognitive performance test scores at baseline (visit 1), follow-up (visit 2), and change between visits, by sex, for Healthy Aging in Neighborhoods of Diversity across the Life Span participants >50.0 years of age at baseline with complete and reliable baseline or follow-up cognitive scores and complete data on epigenetic clock measures
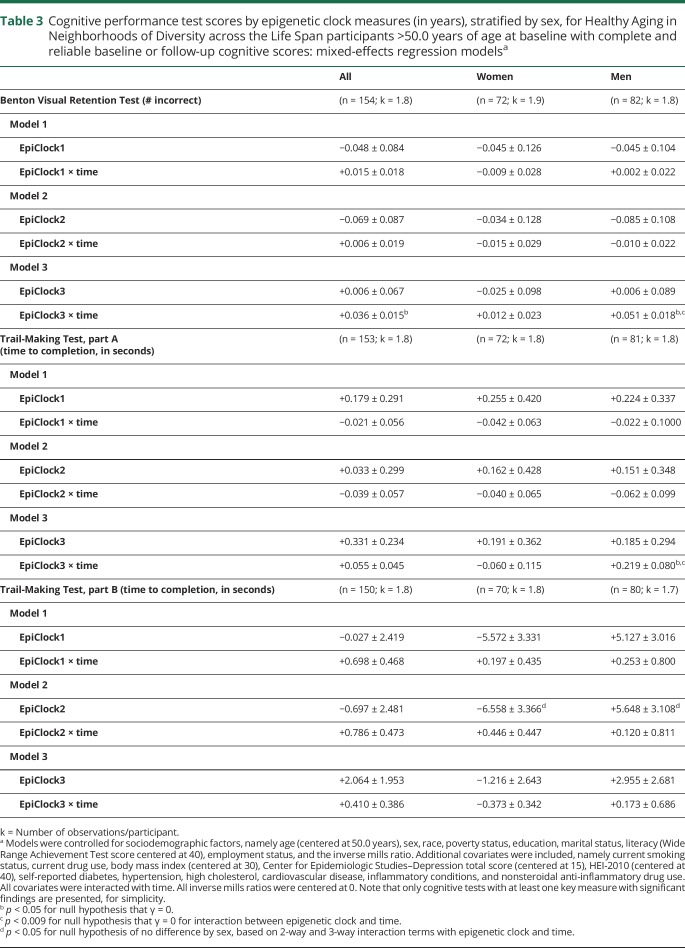
In order to test our main hypotheses, we conducted a series of multiple mixed-effects regression models to test cross-sectional and longitudinal associations between baseline EAA measures and cognitive performance (table 3 and table e-2, doi.org/10.5061/dryad.6r80s8p). We were particularly interested in the longitudinal associations with age-related cognitive decline. After adjusting for multiple testing, among men, epigenetic clock 3 was consistently associated with faster cognitive decline on tests of visual memory/visuoconstructive ability (BVRT: γ11 = 0.0512 ± 0.0176, p = 0.004) and attention/processing speed (TMT, part A: γ11 = 0.219 ± 0.080, p = 0.007). The 3-way interaction among exposure, time, and sex indicated that there was no heterogeneity in the effect of this exposure (epigenetic clock 3) on cognitive change in BVRT or TMT part A that was detected between men and women. Nevertheless, the effect was only significant in men. These findings are illustrated using predictive margins from the respective mixed-effects regression models among men, adjusting for potentially confounding covariates, including baseline chronological age, sex, race, poverty status, education, and various lifestyle and health-related factors (see Covariates section) (figures 2 and 3). None of the other associations, particularly those testing the main hypotheses, passed correction for multiple testing. In a sensitivity analysis that retained only significant covariates in selected models with positive findings, results remained somewhat unaltered. Specifically, for key finding 1 (EEAA, BVRT in men), we excluded the following covariates: education, hypertension, smoking, current drug use, and NSAID use. In that mixed-effects linear regression model with 99 participants and 179 observations, k = 1.8, the key measure (EpiClock3 × time) remained statistically significant at a type I error of 0.05 (γ11 = +0.037 ± 0.015, p = 0.012), though without passing correction for multiple testing. Similarly, for key finding 2 (EEAA, TMT part A, in men), the reduced model excluded the following covariates: poverty status, education, smoking, current drug use, BMI, CES-D, HEI, hypertension, dyslipidemia, NSAID use, inflammation, and the inverse mills ratio. The results remained virtually unaltered with p value = 0.003 for the EpiClock3 × time measure (γ11 = +0.198 ± 0.068).
Table 3.
Cognitive performance test scores by epigenetic clock measures (in years), stratified by sex, for Healthy Aging in Neighborhoods of Diversity across the Life Span participants >50.0 years of age at baseline with complete and reliable baseline or follow-up cognitive scores: mixed-effects regression modelsa
Figure 2. Predictive margins for Benton Visual Retention Test (BVRT) by epigenetic clock 3 in male participants: mixed-effects regression model.
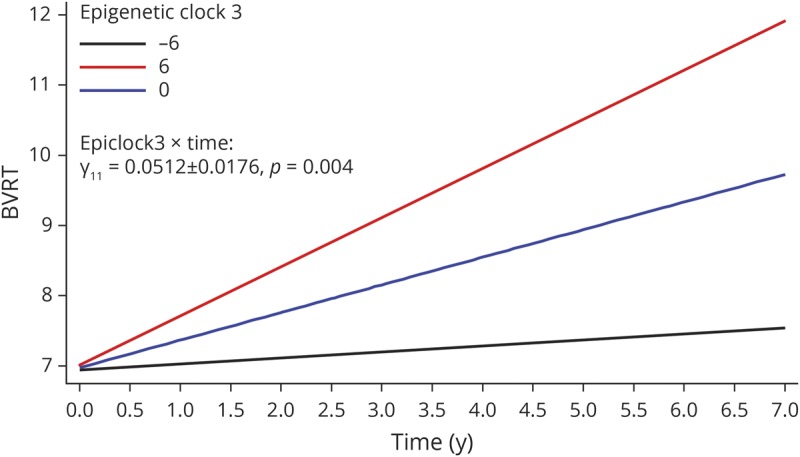
Epigenetic clock 3: extrinsic epigenetic age acceleration uses the Hannum et al. algorithm and combines epigenetic age acceleration with white blood cell proportion changes reflecting immunosenescence. Model 3 for BVRT (# incorrect), among men, table 3. 1 SD EpiClock3 ∼6.2 years.
Figure 3. Predictive margins for Trail-Making Test (TMT), part A, by epigenetic clock 3 in male participants: mixed-effects regression model.
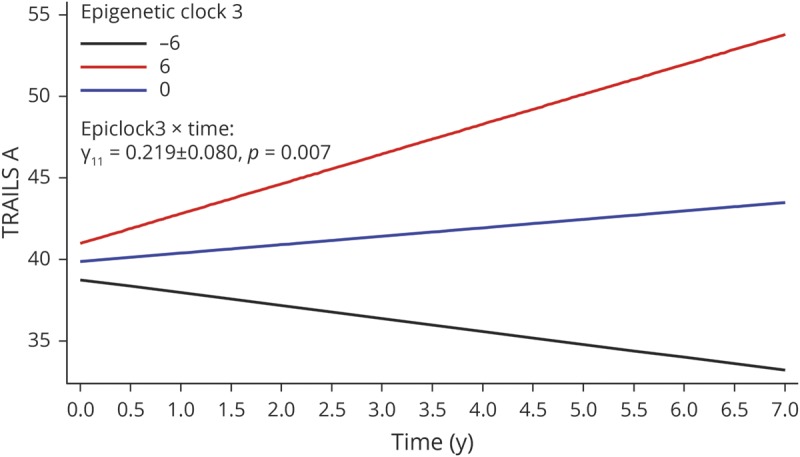
Epigenetic clock 3: extrinsic epigenetic age acceleration uses the Hannum et al. algorithm and combines epigenetic age acceleration with white blood cell proportion changes reflecting immunosenescence. Model 3 for TMT, part A (time to completion, in seconds), among men, table 3. 1 SD EpiClock3 ∼6.2 years.
Discussion
Our study is among the first to examine longitudinal associations between EAA and cognitive decline in a socioeconomically and racially diverse sample of middle-aged urban adults. Three baseline DNAm-based epigenetic clocks were estimated on a subsample, using both the Horvath and Hannum et al. algorithms. After rigorous adjustment, primary findings indicated that among men, epigenetic clock 3, a measure of both biological age acceleration and immunosenescence using the Hannum et al. algorithm, was consistently associated with faster decline on tests of visual memory/visuoconstructive ability (BVRT: γ11 = 0.0512 ± 0.0176, p = 0.004) and attention/processing speed (TMT part A: γ11 = 0.219 ± 0.080, p = 0.007).
Only a few studies thus far have examined the DNAm–cognition relation.1,14–18 Among those that have, few examined a wide range of cognitive outcomes14,15,18 and longitudinally measured cognitive decline,1,14,18 with most assessing global cognition, using a single test or creating a composite score from multiple cognitive tests1,14,16,18 and one in addition examining multiple brain MRI measures.16 Finally, one study used a proxy outcome for Alzheimer disease (AD) by examining risk factors of AD in relation to DNAm age.17 In a substudy of the Whitehall II cohort that included imaging data (n = 48, 24 cognitively impaired), researchers identified 8 differentially methylated regions known to be involved in the immune response that can possibly alter transcription directly linked to performance on the Montreal Cognitive Assessment. These results are consistent with our findings but not directly related to the EAA measures. Results from analyses of the epigenetic clocks were inconsistent, with EEAA (i.e., Hannum et al. algorithm) showing a paradoxical relationship with increased fractional anisotropy (FA) and reduced mean diffusivity (MD), a finding that contradicts previous studies of aging.16 In fact, most studies have shown no change or decreased FA and increased MD in preclinical familial AD.16 Our findings are at odds with these results, given that we have detected the epigenetic clock using the Hannum et al. algorithm to be related to cognitive change over time among men, in at least 2 domains of cognition, namely attention and visuospatial/visuoconstruction ability.
Another larger cohort study examined both cross-sectional and longitudinal associations (6-year follow-up) between an epigenetic clock using the Horvath algorithm and cognitive fitness, using a composite measure of 6 nonverbal tests from the Wechsler Adult Intelligence Scale–3.14 The authors found that higher DNAm age acceleration was linked to poorer cognitive performance at one point in time, without predicting rate of cognitive decline.14 Using epigenetic clocks that utilized both Horvath and Hannum et al. algorithms, a longitudinal study of 486 middle-aged monozygotic twins found that chronological age and not biological age could predict cognitive abilities.18 This result is consistent with ours, given that we have not detected an association between epigenetic clocks 1 or 2 (using Horvath algorithm) and cognitive decline. Similarly, a large study of Scottish adults (n = 5,100) examined both of these clocks in relation to modifiable risk factors of AD and found that the EEAA (i.e., Hannum et al. algorithm) was associated cross-sectionally with lower education and a measure of socioeconomic deprivation, higher blood pressure, higher BMI, and more pack-years of cigarette smoking. In addition to its association with higher BMI and smoking, IEAA was linked with a higher atherogenicity as measured by total:high-density lipoprotein cholesterol ratio.17 Moreover, a recent meta-analysis of epigenome-wide association studies using blood DNAm (n = 6,809 healthy, older adults, 11 cohorts, 7 cognitive tests; white and AA), found that after multiple covariate adjustment and correction for multiple testing, performance on the MMSE was linked to cg12507869 (located on chromosome 12), while phonemic fluency was associated with cg12507869 (INPP5A gene located on chromosome 10), indicating the significant role of DNAm in cognitive function. While the methylation levels of both CpGs in blood were associated with DNAm levels in the brain, specifically within the ventral temporal cortex, neither was related to longitudinal changes in white matter brain MRI measures. It was thus concluded that most of variation in cognitive ability is ascribed to environmental factors.15 Finally, among 964 individuals followed from birth to midlife, 11 markers of biological aging were measured, including telomeres, epigenetic clock, and biomarker-composite quantifications.1 Given their poor intercorrelation, none of the measures of biological aging was strongly associated with health span–related characteristics (i.e., balance, grip strength, motor coordination, physical limitations, cognitive decline, self-rated health, and facial aging).1 More specifically, however, The 71–CpG epigenetic clock and biomarker composites were consistently related to these aging-related outcomes, including cognitive function and decline at age 38, based on an intelligence quotient score and its change since childhood. However, effect sizes were modest.1 This is in line with our findings, specifically with respect to the Hannum et al. algorithm and among men.
Several forms of epigenetic modification vary during the aging process. These variations, collectively termed epigenetic drift, can negatively influence gene expression in the brain, potentially mediating cognitive aging and neurodegeneration.3 Specific alternations in the epigenetic modifications can affect the expression of certain genes that are important for memory formation.48 Animal studies of learning and memory deficits indicated that dynamic methylation changes occur at various loci linked with synaptic plasticity and cognition, which include BDNF, protein phosphatase 1 (a memory suppressor), BDNF, and reelin (both memory promoters).3 Therefore, altered DNAm due to aging or as a results of environmental exposure could affect cognitive function. De novo and maintenance DNAm are mediated by DNA methyltransferases (DNMTs): DNMT1, in cooperation with UHRF1, is involved in maintenance methylation (copies preexisting methyl marks), whereas DNMT3A and DNMT3B catalyze de novo methylation at the developmental or other stages. Demethylation is catalyzed by several enzymes, including 10–11 translocation family enzymes (TET1, TET2, and TET3).49 Expression changes in these enzymes or gene mutations can result in DNAm loss, which has been linked to tissue aging and cognitive deficits in mice.10 Our main findings indicate a role played by immunosenescence in cognitive decline, given that only epigenetic clock 3 included immunosenescence as part of the measure (unlike epigenetic clocks 1 and 2). Aging of natural killer (NK) cells resulting in changes in their compartment may contribute to the lower capacity of elderly individuals to fight against pathogens and tumors. In AD, despite the fact that NK cell frequency is not altered, NK cells tend to have an exaggerated response to cytokines, thus dysregulating signaling pathways that lead to altered behaviors linked to AD.50 This finding, however, was restricted to men in our sample, suggesting that immunosenescence may not be an equally important factor in women, as implicated in a recent study.51 In that latter study, women older than 70 years exhibited a higher immature CD56 (bright) NK cells to mature CD56 (dim) NK cells ratio compared to their male counterparts.51 Similarly, mature NK cells among women showed robust cytotoxic granule responses to K562 leukemia cells and interferon-γ responses to NKp46 crosslinking that was less shown in men.51 Moreover, female NK cells produced MIP-1β to a greater extent than male NK counterparts in response to various stimuli. Thus, it was concluded that sex can influence NK cell activity in older adults. Nevertheless, more studies are needed to replicate our findings and subsequently uncover mechanisms behind those differences.51 It is also worth noting that in our study, 2 of 3 epigenetic clocks indicated accelerated aging among men, including epigenetic clock 3, as was shown in at least one previous study.20 This accelerated aging that involves immunosenescence in men may be driving cognitive aging to a much greater extent than in women.
Our study has several notable strengths including having an adequately sized sample with balanced baseline characteristics, a longitudinal study design in order to ascertain temporality of relationships, and the use of cognitive tests spanning multiple cognitive domains. We used mixed-effects linear regression adjusted for potential confounders that considered sample selectivity.
Nonetheless, our study is not without limitations; elements of our findings should be interpreted with caution. Despite covariate adjustment, residual confounding may persist, particularly with regards to other socioeconomic variables not measured by poverty, education, and literacy. Only 2 time points were available for the cognitive outcomes of interest. Although we found statistically significant results among men, this could be due to random variations in cognitive performance rather than significant over-time decline. Again, studies with more than 2 repeated measures on outcome variables would help resolve this concern. Moreover, although the effect sizes detected in our 2 main findings were large as depicted in the predictive margins plots, absolute decline on these tests was smaller, likely due to our start point of middle-aged individuals (>50.0 years). Given the larger sample size among men, a relatively less powered analysis among women could explain sex differences in the association between epigenetic clock 3 and decline on Trails A and BVRT tests over time. It is worth noting that variability in this epigenetic clock was comparable between sexes (SD 9.17 among men and 9.55 among women). Similarly, variability in Trails A and BVRT were also comparable across sexes, although men experienced greater decline in BVRT over time compared to women, which may impart a greater statistical power to observe differences by epigenetic clock 3, all else kept equal. Finally, given the limited sample size for participants and observations, future studies are needed to replicate our preliminary findings, possibly by undertaking a meta-analysis.
Our study findings show that EAA related to immunosenescence was associated with a faster rate of cognitive decline among men, specifically within domains of attention, processing speed, and visual memory. These results highlight the role of immune function decline on cognitive decline. Interventions to slow epigenetic changes related to immunosenescence may also slow the rate of cognitive decline, particularly among middle-aged men. Further longitudinal studies would be useful to expand on and corroborate our findings.
Glossary
- AA
African American
- AD
Alzheimer disease
- BMI
body mass index
- BTA
Brief Test of Attention
- BVRT
Benton Visual Retention Test
- CES-D
Center for Epidemiologic Studies–Depression scale
- CVLT
California Verbal Learning Test
- DFR
delayed free recall
- DNAm
DNA methylation
- EAA
epigenetic age acceleration
- EEAA
extrinsic epigenetic age acceleration
- FA
fractional anisotropy
- HANDLS
Healthy Aging in Neighborhoods of Diversity across the Life Span
- HEI
Healthy Eating Index
- HS
high school
- IEAA
intrinsic epigenetic age acceleration
- IRB
institutional review board
- MD
mean diffusivity
- MMSE
Mini-Mental State Examination
- MRV
medical research vehicle
- NK
natural killer
- NSAID
nonsteroidal anti-inflammatory drug
- PI
principal investigator
- TMT
Trail-Making Test
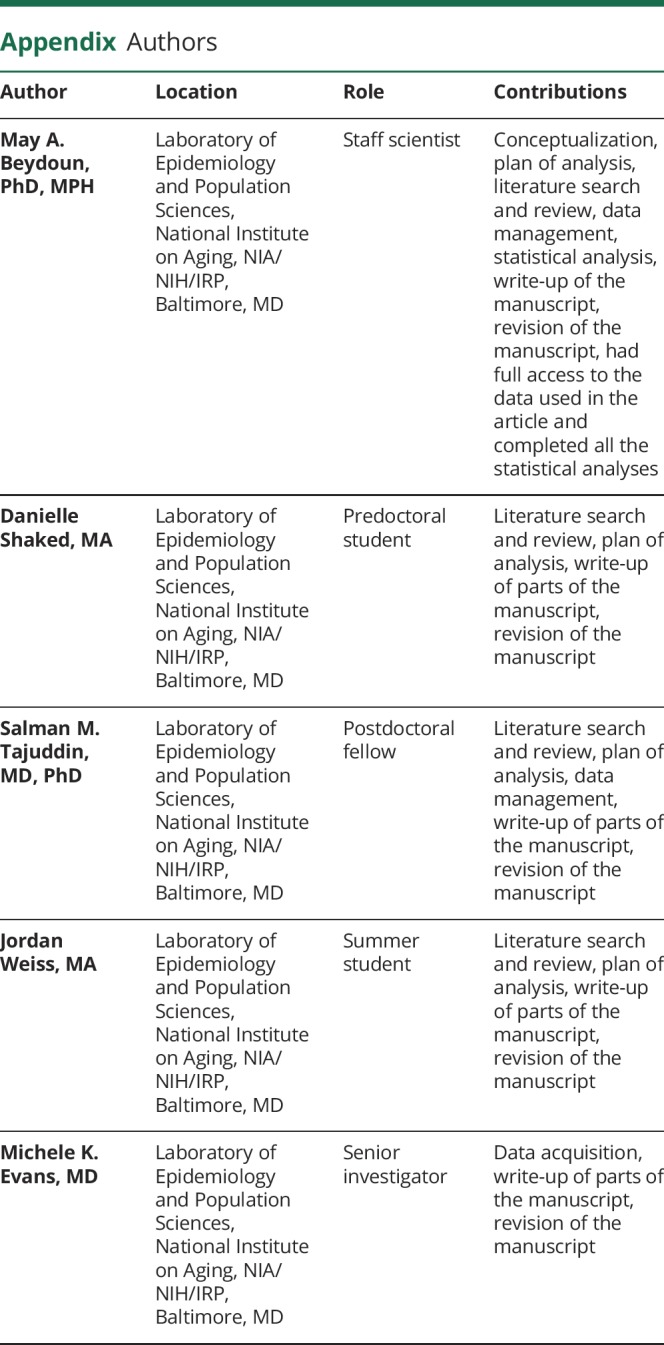
Appendix. Authors
Study funding
This research was supported entirely by the Intramural Research Program of the NIH, National Institute on Aging.
Disclosure
The authors report no disclosures relevant to the manuscript. Go to Neurology.org/N for full disclosures.
References
- 1.Belsky DW, Moffitt TE, Cohen AA, et al. Eleven telomere, epigenetic clock, and biomarker-composite quantifications of biological aging: do they measure the same thing? Am J Epidemiol 2018;187:1220–1230. [DOI] [PMC free article] [PubMed] [Google Scholar]
- 2.Shanahan MJ, Mortimer JT, Johnson MK, eds. Does the Body Forget? Adult Health, Life Course Dynamics, and Social Change. London: International Publishing; 2016. [Google Scholar]
- 3.Mather KA, Kwok JB, Armstrong N, Sachdev PS. The role of epigenetics in cognitive ageing. Int J Geriatr Psychiatry 2014;29:1162–1171. [DOI] [PubMed] [Google Scholar]
- 4.Sanosaka T, Namihira M, Nakashima K. Epigenetic mechanisms in sequential differentiation of neural stem cells. Epigenetics 2009;4:89–92. [DOI] [PubMed] [Google Scholar]
- 5.Ma DK, Marchetto MC, Guo JU, Ming GL, Gage FH, Song H. Epigenetic choreographers of neurogenesis in the adult mammalian brain. Nat Neurosci 2010;13:1338–1344. [DOI] [PMC free article] [PubMed] [Google Scholar]
- 6.Barrett RM, Wood MA. Beyond transcription factors: the role of chromatin modifying enzymes in regulating transcription required for memory. Learn Mem 2008;15:460–467. [DOI] [PMC free article] [PubMed] [Google Scholar]
- 7.Jiang Y, Langley B, Lubin FD, et al. Epigenetics in the nervous system. J Neurosci 2008;28:11753–11759. [DOI] [PMC free article] [PubMed] [Google Scholar]
- 8.Veerappan CS, Sleiman S, Coppola G. Epigenetics of Alzheimer's disease and frontotemporal dementia. Neurotherapeutics 2013;10:709–721. [DOI] [PMC free article] [PubMed] [Google Scholar]
- 9.Graff J, Mansuy IM. Epigenetic dysregulation in cognitive disorders. Eur J Neurosci 2009;30:1–8. [DOI] [PubMed] [Google Scholar]
- 10.Xu X. DNA methylation and cognitive aging. Oncotarget 2015;6:13922–13932. [DOI] [PMC free article] [PubMed] [Google Scholar]
- 11.Marioni RE, Shah S, McRae AF, et al. The epigenetic clock is correlated with physical and cognitive fitness in the Lothian Birth Cohort 1936. Int J Epidemiol 2015;44:1388–1396. [DOI] [PMC free article] [PubMed] [Google Scholar]
- 12.Chen BH, Marioni RE, Colicino E, et al. DNA methylation-based measures of biological age: meta-analysis predicting time to death. Aging 2016;8:1844–1865. [DOI] [PMC free article] [PubMed] [Google Scholar]
- 13.Lin Q, Weidner CI, Costa IG, et al. DNA methylation levels at individual age-associated CpG sites can be indicative for life expectancy. Aging 2016;8:394–401. [DOI] [PMC free article] [PubMed] [Google Scholar]
- 14.Marioni RE, Shah S, McRae AF, et al. DNA methylation age of blood predicts all-cause mortality in later life. Genome Biol 2015;16:25. [DOI] [PMC free article] [PubMed] [Google Scholar]
- 15.Marioni RE, McRae AF, Bressler J, et al. Meta-analysis of epigenome-wide association studies of cognitive abilities. Mol Psychiatry 2018;23:2133–2144. [DOI] [PMC free article] [PubMed] [Google Scholar]
- 16.Chouliaras L, Pishva E, Haapakoski R, et al. Peripheral DNA methylation, cognitive decline and brain aging: pilot findings from the Whitehall II imaging study. Epigenomics 2018;10:585–595. [DOI] [PMC free article] [PubMed] [Google Scholar]
- 17.McCartney DL, Stevenson AJ, Walker RM, et al. Investigating the relationship between DNA methylation age acceleration and risk factors for Alzheimer's disease. Alzheimers Dement 2018;10:429–437. [DOI] [PMC free article] [PubMed] [Google Scholar]
- 18.Starnawska A, Tan Q, Lenart A, et al. Blood DNA methylation age is not associated with cognitive functioning in middle-aged monozygotic twins. Neurobiol Aging 2017;50:60–63. [DOI] [PubMed] [Google Scholar]
- 19.Levine ME, Lu AT, Bennett DA, Horvath S. Epigenetic age of the pre-frontal cortex is associated with neuritic plaques, amyloid load, and Alzheimer's disease related cognitive functioning. Aging 2015;7:1198–1211. [DOI] [PMC free article] [PubMed] [Google Scholar]
- 20.Horvath S, Gurven M, Levine ME, et al. An epigenetic clock analysis of race/ethnicity, sex, and coronary heart disease. Genome Biol 2016;17:171. [DOI] [PMC free article] [PubMed] [Google Scholar]
- 21.McCarrey AC, An Y, Kitner-Triolo MH, Ferrucci L, Resnick SM. Sex differences in cognitive trajectories in clinically normal older adults. Psychol Aging 2016;31:166–175. [DOI] [PMC free article] [PubMed] [Google Scholar]
- 22.Evans MK, Lepkowski JM, Powe NR, LaVeist T, Kuczmarski MF, Zonderman AB. Healthy Aging in Neighborhoods of Diversity across the Life Span (HANDLS): overcoming barriers to implementing a longitudinal, epidemiologic, urban study of health, race, and socioeconomic status. Ethn Dis 2010;20:267–275. [PMC free article] [PubMed] [Google Scholar]
- 23.Beydoun MA, Weiss J, Obhi HK, et al. Cytokines are associated with longitudinal changes in cognitive performance among urban adults. Brain Behav Immun 2019;80:474–487. [DOI] [PMC free article] [PubMed] [Google Scholar]
- 24.Beydoun MA, Hossain S, Fanelli-Kuczmarski MT, et al. Vitamin D status and intakes and their association with cognitive trajectory in a longitudinal study of urban adults. J Clin Endocrinol Metab 2018;103:1654–1668. [DOI] [PMC free article] [PubMed] [Google Scholar]
- 25.Folstein MF, Folstein SE, McHugh PR. “Mini-mental state”: a practical method for grading the cognitive state of patients for the clinician. J Psychiatr Res 1975;12:189–198. [DOI] [PubMed] [Google Scholar]
- 26.Delis DC, Freeland J, Kramer JH, Kaplan E. Integrating clinical assessment with cognitive neuroscience: construct validation of the California Verbal Learning Test. J Consult Clin Psychol 1988;56:123–130. [DOI] [PubMed] [Google Scholar]
- 27.Benton AL, ed. Revised Visual Retention Test, 5th ed. New York: The Psychological Corportation; 1974. [Google Scholar]
- 28.Wechsler D. WAIS-R Manual. Cleveland: The Psychological Corporation; 1981. [Google Scholar]
- 29.Morris JC, Heyman A, Mohs RC, et al. The consortium to establish a registry for Alzheimer's disease (CERAD): part I: clinical and neuropsychological assessment of Alzheimer's disease. Neurology 1989;39:1159–1165. [DOI] [PubMed] [Google Scholar]
- 30.Schretlen D, Bobholz JH, Brandt J. Development and psychometric properties of the brief test of attention. Clin Neuropsychol 1996;10:80–89. [Google Scholar]
- 31.Reitan R. Trail Making Test: Manual for Administration and Scoring. Tucson: Reitan Neuropsychological Laboratory; 1992. [Google Scholar]
- 32.Rouleau I, Salmon DP, Butters N, Kennedy C, McGuire K. Quantitative and qualitative analyses of clock drawings in Alzheimers and Huntingtons disease. Brain Cogn 1992;18:70–87. [DOI] [PubMed] [Google Scholar]
- 33.Triche TJ Jr, Weisenberger DJ, Van Den Berg D, Laird PW, Siegmund KD. Low-level processing of Illumina Infinium DNA methylation BeadArrays. Nucleic Acids Res 2013;41:e90. [DOI] [PMC free article] [PubMed] [Google Scholar]
- 34.Houseman EA, Accomando WP, Koestler DC, et al. DNA methylation arrays as surrogate measures of cell mixture distribution. BMC Bioinformatics 2012;13:86. [DOI] [PMC free article] [PubMed] [Google Scholar]
- 35.Horvath S. DNA methylation age of human tissues and cell types. Genome Biol 2013;14:R115. [DOI] [PMC free article] [PubMed] [Google Scholar]
- 36.Hannum G, Guinney J, Zhao L, et al. Genome-wide methylation profiles reveal quantitative views of human aging rates. Mol Cell 2013;49:359–367. [DOI] [PMC free article] [PubMed] [Google Scholar]
- 37.Barnes DE, Yaffe K. The projected effect of risk factor reduction on Alzheimer's disease prevalence. Lancet Neurol 2011;10:819–828. [DOI] [PMC free article] [PubMed] [Google Scholar]
- 38.Gimeno D, Kivimaki M, Brunner EJ, et al. Associations of C-reactive protein and interleukin-6 with cognitive symptoms of depression: 12-year follow-up of the Whitehall II study. Psychol Med 2009;39:413–423. [DOI] [PMC free article] [PubMed] [Google Scholar]
- 39.Bettcher BM, Wilheim R, Rigby T, et al. C-reactive protein is related to memory and medial temporal brain volume in older adults. Brain Behav Immun 2012;26:103–108. [DOI] [PMC free article] [PubMed] [Google Scholar]
- 40.Wilkinson GS. Wide Range Achievement Test–Revision 3. Wilmington: Jastak Association; 1993. [Google Scholar]
- 41.Nguyen HT, Kitner-Triolo M, Evans MK, Zonderman AB. Factorial invariance of the CES-D in low socioeconomic status African Americans compared with a nationally representative sample. Psychiatry Res 2004;126:177–187. [DOI] [PubMed] [Google Scholar]
- 42.Statistics/Data Analysis: Release 15.0 [computer program]. College Station, TX: Stata Corporation; 2017. [Google Scholar]
- 43.Ibrahim JG, Molenberghs G. Missing data methods in longitudinal studies: a review. Test 2009;18:1–43. [DOI] [PMC free article] [PubMed] [Google Scholar]
- 44.Beydoun MA, Beydoun HA, Kitner-Triolo MH, Kaufman JS, Evans MK, Zonderman AB. Thyroid hormones are associated with cognitive function: moderation by sex, race, and depressive symptoms. J Clin Endocrinol Metab 2013;98:3470–3481. [DOI] [PMC free article] [PubMed] [Google Scholar]
- 45.Selvin S. Statistical Analysis of Epidemiologic Data, 3rd ed. Oxford: Oxford University Press; 2004. [Google Scholar]
- 46.Hochberg Y, Tamhane AC. Multiple Comparison Procedures. New York: Wiley; 1987. [Google Scholar]
- 47.Beydoun MA, Canas JA, Dore GA, et al. Serum uric acid and its association with longitudinal cognitive change among urban adults. J Alzheimers Dis 2016;52:1415–1430. [DOI] [PMC free article] [PubMed] [Google Scholar]
- 48.Franklin TB, Mansuy IM. The prevalence of epigenetic mechanisms in the regulation of cognitive functions and behaviour. Curr Opin Neurobiol 2010;20:441–449. [DOI] [PubMed] [Google Scholar]
- 49.Cui D, Xu X. DNA methyltransferases, DNA methylation, and age-associated cognitive function. Int J Mol Sci 2018;19:1315. [DOI] [PMC free article] [PubMed] [Google Scholar]
- 50.Solana C, Tarazona R, Solana R. Immunosenescence of natural killer cells, inflammation, and Alzheimer's disease. Int J Alzheimers Dis 2018;2018:3128758. [DOI] [PMC free article] [PubMed] [Google Scholar]
- 51.Al-Attar A, Presnell SR, Peterson CA, Thomas DT, Lutz CT. The effect of sex on immune cells in healthy aging: elderly women have more robust natural killer lymphocytes than do elderly men. Mech Ageing Dev 2016;156:25–33. [DOI] [PubMed] [Google Scholar]
Associated Data
This section collects any data citations, data availability statements, or supplementary materials included in this article.
Data Availability Statement
Data access request can be sent to principal investigators (PIs) or the study manager, Jennifer Norbeck, at norbeckje@mail.nih.gov. These data are owned by the National Institute on Aging at the NIH. The PIs have made the data restricted to the public for 2 main reasons: “(1) The study collects medical, psychological, cognitive, and psychosocial information on racial and poverty differences that could be misconstrued or willfully manipulated to promote racial discrimination; and (2) Although the sample is fairly large, there are sufficient identifiers that the PIs cannot guarantee absolute confidentiality for every participant as we have stated in acquiring our confidentiality certificate.”23


