

Summary
The intestine contains some of the most diverse and complex immune compartments in the body. Here we describe a method for isolating human gut-associated lymphoid tissues (GALT) which allows unprecedented profiling of the adaptive immune system in submucosal and mucosal isolated lymphoid follicles (SM-ILF and M-ILF), as well as in GALT-free intestinal lamina propria (LP). SM-ILF and M-ILF showed distinct patterns of distribution along the length of the intestine, were linked to the systemic circulation through MAdCAM1+ high endothelial venules and efferent lymphatics, and had immune profiles consistent with immune inductive sites. IgA sequencing analysis indicated that human ILF are sites where intestinal adaptive immune responses are initiated in an anatomically restricted smanner. Our findings position ILF as key inductive hubs for regional immunity in the human intestine and the methods presented will allow future assessment of these compartments in health and disease.
eTOC
Our understanding of the function of lymphoid follicles in the human intestine remains limited. Here, Fenton et al. describe a method for identifying and isolating lymphoid follicles along the length of the human intestine and use it to show a role for these structures in regionalized adaptive immune responses.
Introduction
The intestine consists of several anatomically and functionally specialized segments with distinct environmental pressures that include variations in bacterial load and diversity, nutrient concentrations and microbiota-derived metabolites. Given these challenges it is perhaps unsurprising that the intestine contains the greatest number and diversity of immune cells in the body. Crosstalk between these cells and their local environment is essential for the development and function of the immune system and alterations in this communication can rewire immune cell behavior and contribute to the development and chronicity of a wide range of disorders (Durack and Lynch, 2019).
The intestine contains numerous immune niches including the gut associated lymphoid tissues (GALT), which are thought to serve as sites of adaptive immune cell priming and differentiation. Conversely, the intestinal epithelium and lamina propria (LP) are sites where antigen-experienced lymphocytes accumulate and can persist long-term as committed effector or regulatory cells. Murine GALT include the macroscopically visible Peyer’s patches (PP) of the ileum and colonic patches, together with the far more numerous solitary isolated lymphoid tissues (SILT) that are distributed throughout the small and large intestine. SILT encompass a spectrum of maturation states from immature cryptopatches (CP) that contain lymphoid tissue inducer cells (LTi) and dendritic cells, to mature, B cell rich, isolated lymphoid follicles (ILF) (Hamada et al., 2002; Kanamori et al., 1996; Knoop et al., 2011; McDonald et al., 2010; Pabst et al., 2006). While murine SILT contain few T cells and may contribute to T cell-independent IgA responses (Tsuji et al., 2008; Wang et al., 2006), murine PP and caecal patches are thought to represent major sites of T-dependent IgA responses (Craig and Cebra, 1971). Murine PP were recently implicated in the generation of IgA+ plasmablasts destined for the small intestine (SI), whereas caecal patches were shown to generate IgA+ plasmablasts destined for both the SI and colon (Masahata et al., 2014). Whether such regionalized immune responses occur in the human intestine and how distinct compartments of the human GALT contribute to intestine-wide or region-specific immunity remains unclear.
Current understanding of human GALT is derived primarily from immunohistochemistry and electron microscopy studies. Human PP develop in utero (Hoorweg and Cupedo, 2008) and consist of distinct B follicles interspersed with T cell-rich inter-follicular regions (Farstad et al., 2000), a sub-epithelial dome (SED) region (Brandtzaeg and Bjerke, 1990) and a microfold (M) cell-containing follicle-associated epithelium (FAE) (Owen and Jones, 1974). Human PP may consist of several hundred follicles (Cornes, 1965a), although their size varies, peaking during adolescence and declining steadily thereafter (Cornes, 1965b). They constitutively contain germinal centers (GC) and the B cells present in PP share clonal overlap with SI plasma cells (PC) (Dunn-Walters et al., 1997), indicating that they likely represent inductive sites for the generation of intestinal PC. Structures resembling ILF have also been observed throughout the human intestine (Buettner and Lochner, 2016; Dukes and Bussey, 1926), although their frequency may vary with age and between intestinal segments (Moghaddami et al., 1998; O’Leary and Sweeney, 1986; Senda et al., 2019; Spencer et al., 2019). ILF in both SI and colon express AICDA mRNA (Barone et al., 2009), which encodes activation induced cytidine deaminase (AID) required for class switch recombination. Some human ILF also contain GC (Meier et al., 2014; Moghaddami et al., 1998; O’Leary and Sweeney, 1986), together indicating that these structures may serve as immune inductive sites. Serial sectioning of intestinal tissues suggests that human ILF can be located entirely within the LP (henceforth termed mucosal ILF (MILF)), or can extend through the muscularis mucosa to encompass both the LP and the submucosa (henceforth termed submucosal ILF (SM-ILF) (Moghaddami et al., 1998; O’Leary and Sweeney, 1986; Senda et al., 2019; Spencer et al., 2019). While human colon M-ILF have an overlying M cell-containing dome-like FAE (Jacob et al., 1987; O’Leary and Sweeney, 1986), the FAE of SM-ILF appears to be hidden within clefts of normal epithelium (O’Leary and Sweeney, 1986). Despite these anatomical insights, the immune composition and function of distinct human GALT remains unknown due to an inability to dissect and characterize these structures in isolation from surrounding mucosa (Junker et al., 2009; Meier et al., 2014; Spencer et al., 2019). Furthermore, as current protocols used to isolate and study immune cells within the LP invariably contain contaminating ILF, the specific immunological properties of these distinct immune niches remain unclear.
Given their proposed role as adaptive immune inductive sites and their potential contributions to the initiation of ierntestinal pathology (Gullberg and Söderholm, 2006; Rickert and Carter, 1980), we here developed a technique for isolating human GALT, including M-ILF and SM-ILF, as well as GALT-free LP. We demonstrate the distinct distribution of these structures along the length of the intestine and provide adaptive immune profiling of these structures and of GALT-free LP. In this way, we identify niche-specific adaptations and a role for human ILF in region-specific adaptive immune responses.
Results
Human ILF can be visualized in intestinal tissues following separation of mucosa from submucosa
Given prior studies suggesting the presence of GALT structures in the human submucosa (SM) and mucosa (O’Leary and Sweeney, 1986), we attempted to separate these layers in human colon resections under a dissecting microscope and found it possible to peel SM from the overlying mucosa (Video S1). After removal of SM, holes were observed in the remaining mucosal tissue (Video S1, Figure 1A, arrows) that we hypothesized represented the location of GALT that had remained embedded within the peeled SM. Indeed, methylene blue staining of isolated SM identified spherical structures with an appearance consistent with lymphoid follicles (Video S2, Figure 1B, arrows). H&E and immunohistochemical staining of serial sections of intact colon confirmed the presence of lymphoid aggregates and demonstrated that the majority of these structures extended from the SM across the muscularis mucosae to the overlying epithelium (Figure 1C and data not shown). These structures consisted of an inner core of B cells surrounded by T cells and a sub-epithelial region enriched in CD11c+ cells (Figure 1D). Analysis of resected tissues taken from the ileum, caecum, proximal, transverse and sigmoid colon, and rectum (Table S1) demonstrated SM-GALT to be present at a constant frequency throughout the large intestine (Figure 1E) but rarely in the ileum (data not shown). While most SM-GALT consisted of single isolated lymphoid follicles (SM-ILF), some patients displayed irregular or multi-follicular GALT (Figure S1A-C), and these made up a larger proportion of the total GALT area in the proximal compared to distal colon (Figure 1F). The size of SM-ILF appeared consistent along the length of the colon, although there was a trend towards smaller SM-ILF in the rectum (Figures 1G and H).
Figure 1. Identification of isolated lymphoid follicles in human intestine.
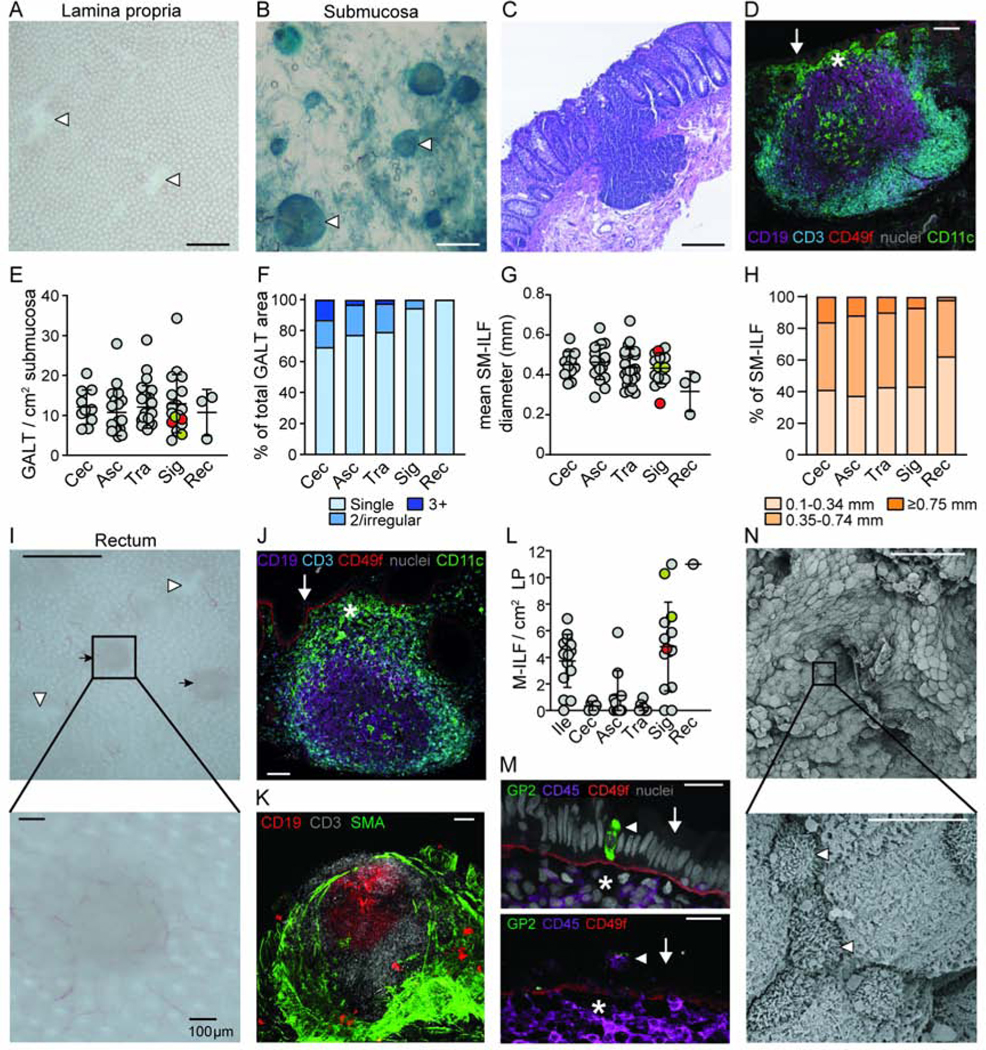
(A) Mucosal tissue showing holes (white arrow heads) in the colon LP after removal of SM. Scale bar, 1mm. (B) Lymphoid follicles (white arrow heads) were identified in the SM after counterstaining with methylene blue. Scale bar, 1mm. (C) H&E and (D) immunofluorescence analysis of SM follicles of full-thickness colon sections. Scale bar, (C) 200μm and (D) 100μm. (D) SM follicles comprise a central follicle of CD19+ B cells (purple) surrounded by CD3+ T cells (blue), a sub-epithelial dome (SED, star) containing CD11c+ cells (green) and an overlying CD49f+ epithelial basement membrane (red). Arrow indicates epithelium. Grey, nuclei stain. (E) Quantification of SM-GALT in indicated tissue. Each dot represents the mean number of GALT from a single patient, based on at least 2.5 cm2 of SM. Grey circles, uninvolved colorectal cancer, red circles, volvulus and orange circles, diverticulitis patients. Bars, mean ± 1SD. (F) Percentage of total GALT surface covered by the different kinds of GALT structures. Mean of 3–15 patients per site. (G) Diameter of SM-ILF within indicated tissue. Each dot represents the mean SM-ILF diameter from a single patient based on at least 2.5 cm2 of SM. Grey circles, uninvolved colorectal cancer, red circles, volvulus and orange circles, diverticulitis patients. Bars, mean ± 1SD. (H) Size distribution of SM-ILF within indicated tissue. Mean of 3–15 patients per site. (I) Mucosa after removal of SM showing the presence of M-ILF (black arrows) and holes left behind by SM-ILF (white arrow heads). Scale bar, 1mm (upper panel) and 100μm (lower panel). (J and K) Immunofluorescence staining of full-thickness sigmoid colon tissue showed M-ILF to contain a central follicle containing CD19+ B cells (purple) surrounded by CD3+ T cells (blue), a SED (star) containing CD11c+ cells (green) and overlying CD49f+ epithelial basement membrane (red). Grey, nuclei stain. Arrow indicates epithelium. Scale bar, 100μm. (K) M-ILF do not penetrate the smooth muscle actin (SMA) expressing muscularis mucosa. (L) Quantification of M-ILF in indicated tissues. Each dot represents the mean number of M-ILF from a single patient based on at least 2.5 cm2 of peeled LP. Grey circles, uninvolved colorectal cancer, red circles, volvulus and orange circles, diverticulitis patients. Bars, mean ± 1SD. (M) The follicle associated epithelium (FAE, arrow) of M-ILF showing a CD45+ lymphocyte filled pockets (lower panel, arrow head) and GP-2 expressing M cells (upper panel, arrow head). Scale bar, 20μm (upper panel) and 40μm (lower panel). Representative images of at least 3 donors. Star depicts SED. Grey, nuclei stain. (N) Scanning electron micrographs depicting cells with M-cell like morphology (white arrow heads) in the FAE of SM-ILF. Scale bar, 50μm (upper panel) and 5μm (lower panel). Representative images of 3 patients. Cec, caecum; Asc, ascending colon; Tra, transverse colon; Sig, sigmoid colon; Rec, rectum. See also Figure S1.
To determine whether GALT structures existed in the mucosa, SM-free mucosa was treated with EDTA to remove epithelium. Thereafter small lymphoid aggregates could be identified within the mucosa of the ileum and distal colon but rarely in the proximal colon (Video S3, Figure 1I, J) and always consisted of a single follicle. To confirm that these aggregates were not remnants of SM-ILF that had been broken in two during removal of the SM, immunohistochemical analysis on serial sections of 1cm2 pieces of unpeeled ileum from 3 patients was performed and 9 of the 10 ILF identified were located solely within the mucosa. We termed these structures mucosal-ILF (M-ILF) to distinguish them from SM-ILF. M-ILF contained organized T and B cell areas and a sub-epithelial region enriched in CD11c+ cells (Figure 1K), but they failed to penetrate the muscularis mucosae (Figure 1L).
A feature of GALT-associated epithelium is the presence of M cells that can transport antigens from the lumen to underlying immune cells. Electron microscopy studies have indicated that the FAE of human ILF contain M cells (Fujimura et al., 1992; Jacob et al., 1987) and to investigate whether both M-ILF and SM-ILF contain M cells, we analyzed serial sections of ILF by immunohistochemistry. Large SM-ILF that were visible under a stereo microscope were excised from minimally processed intestinal tissue to ensure they contained an intact FAE, while M-ILF were processed from tissues where SM, but not epithelium, had been removed. The FAE of M-ILF contained occasional CD45+ cell filled M-cell like ‘pockets’ and some cells expressed the mature M cell marker, glycoprotein-2 (GP-2) (Figure 1M). Such cells were not observed in the FAE of 4 serial sectioned SM-ILF (data not shown), although cells with M-cell like morphology could be detected in the FAE of SM-ILF by scanning electron microscopy (Figure 1N). Collectively these findings suggest that both M-ILF and SM-ILF are organized adaptive immune inductive sites.
The T cell composition of human ILF indicates they function as adaptive immune inductive sites
To determine whether our technique could be used to assess the adaptive immune composition of GALT and GALT-free LP, ILF and GALT-free LP were isolated from distal colon resection material (Videos S2 and S3) and digested separately. Flow cytometry-based t-distributed stochastic neighbor embedding (tSNE) analysis of cell suspensions of colonic tissue prepared using conventional methods showed the presence of plasma cells (PC) and naïve (IgD+CD19+CD20+) B and (CD45RA+CCR7+CD3+) T cells (Figure S1D). However, when the different compartments were isolated and digested separately, it became clear that naïve T and B cells were restricted to ILF (Figure S1E), while PC were present in GALT-free LP and not in ILF (Figure S1D).
To assess whether the adaptive immune composition of GALT and GALT-free LP differed along the length of the intestine, ileal PP, ileal M-ILF, GALT-free ileal LP, proximal colon SM-ILF, and GALT-free proximal colon LP cell suspensions were prepared from each patient and analyzed by flow cytometry. The majority of cells in PP, M-ILF and SM-ILF were CD45+ (Figure S2A). As well as CD19+ B cells (Figure S2B), all GALT contained a large proportion of T cells (Figure S2C), contrasting with the B cell dominance of murine ILF (Hamada et al., 2002). All GALT structures had higher proportions of CD4+ T cells than the equivalent LP samples, and more of these in GALT had the CCR7+CD45RA− phenotype of central memory T cells (Tcm) compared with LP (Figure 2A-C). Conversely, ileal and colonic LP had higher proportions of CCR7−CD45RA− effector or effector memory CD4+ T cells (Tem) (Figure 2B and C). Notably, colonic SM-ILF was the only tissue which contained substantial proportions of CCR7+CD45RA+ naive CD4+ T cells (Figure 2B and C). Similar patterns were seen for CD8+ T cells in the various tissues, with Tem dominating all compartments with the exception of SM-ILF, where there were sizeable fractions of both naive and Tcm CD8+ T cells (Figure 2D and E). Minor populations of CCR7-CD45RA+ putative Temra were also seen within CD8+ T cells of all compartments (Figure 2E).
Figure 2. The T cell composition of human ILF indicates they function as adaptive immune inductive sites.
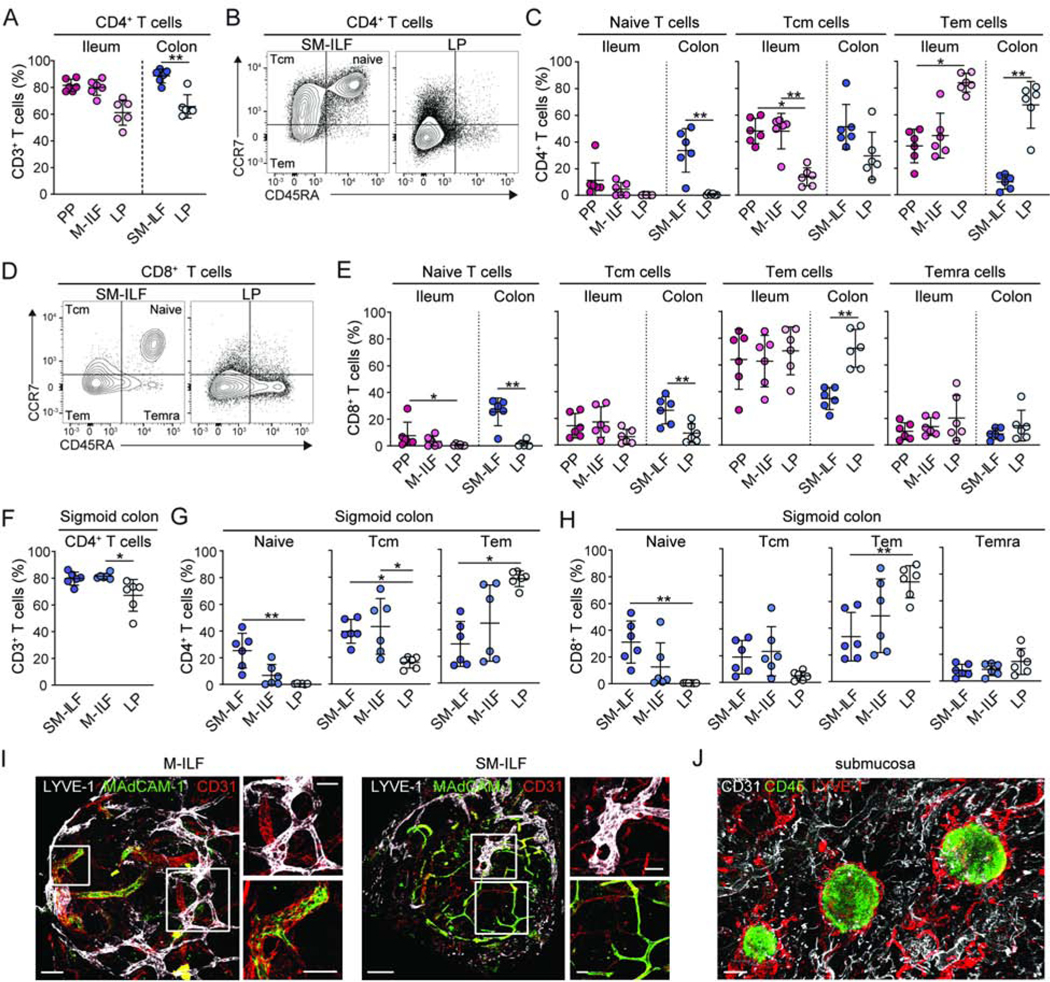
(A–E) T cell populations in single-cell suspensions of indicated paired tissues from right-sided hemi-colectomy resections were analyzed by flow cytometry. (A) CD4+ T cell frequency among CD3+ T cells from indicated compartments. (B, C) Representative gating (B) and quantification (C) of naïve, central memory (Tcm) and effector or effector memory (Tem) CD4+ T cells in indicated compartments. (D–E) Representative gating (D) and quantification (E) of naïve, Tcm, Tem and CD45RA+effector memory (Temra) CD8+ T cells in indicated compartments. (F) CD4+ T cell frequency of total CD3+ T cells, (G) CD4+ T cell and (H) CD8+ T cell composition of indicated compartments in the sigmoid colon. (A-H) PP, Peyer’s patch; SM-ILF, submucosal follicle; M-ILF, mucosal follicle; LP, lamina propria. Each circle represents an individual donor, matched between each of the sites, with SM-ILF and M-ILF data from at least 5 pooled follicles. Bars, mean ± 1SD. Statistical significance between paired samples was determined using the paired Friedman test with Dunn’s multiple comparisons *p<0.05, **p<0.01, ***p<0.001. (I and J) Immunofluorescence staining of (I) SM-ILF and M-ILF and (J) whole-mount SM. (I) LYVE-1+ lymphatics (white) and MAdCAM-1+CD31+ vascular endothelial cells (green). Scale bar, 100μm (M-ILF, left panel), 200μm (SM-ILF, left panel) and 50μm (right panels). (J) CD45+ cells (green), LYVE-1+ lymphatics (red) CD31+ endothelial cells (white). Scale bar, 300μm. Representative images from at least 3 donors. See also Figure S2.
To assess whether the distinct composition of colonic SM-ILF reflected differences between the colon and ileum, or correlated with the location of ILF within the intestinal wall, we compared the composition of M-ILF and SM-ILF in the sigmoid colon, a site containing both structures (Figure 1H and N). As in ileal and proximal colon GALT, T cells in sigmoid colon GALT were predominantly CD4+ T cells (Figure 2F). Further, the T cell subset composition of GALT and LP differed in the sigmoid colon in a manner similar to that seen in the ileum and proximal colon (Figure 2G and H). Notably, SM-ILF in the sigmoid colon contained a higher proportion of naïve T cells than sigmoid colon M-ILF, suggesting this is determined by location within the intestinal wall rather than the segment of the intestine (Figure 2G and H). Despite these differences, the T cell zone of both M-ILF and SM-ILF contained MAdCAM-1+ high endothelial venules (HEV) (Figure 2I) and both structures were surrounded by a network of LYVE-1+ lymphatic vessels (Figure 2J), indicating that adaptive immune cells have routes of entry and exit in such structures.
Thus, the T cell composition of GALT is distinct from that of LP along the length of the intestine and SM-ILF contain a greater proportion of naive T cells than other GALT.
Antigen experienced CD4+ T cells in GALT and LP are functionally distinct
Previous studies have suggested that antigen experienced CD4+ T cells in lymphoid tissues are functionally distinct from those in peripheral tissues (Sathaliyawala et al., 2013), and that the SI and colon LP of mice contain different proportions of antigen experienced CD4+ T cell subsets (for review see Agace and McCoy, 2017). To assess whether the function of antigen experienced CD4+ T cells differed between immune compartments, single-cell suspensions were stimulated overnight with PMA and ionomycin and the expression of a range of cell surface markers and intracellular cytokines (see Key Resource Table) was assessed by mass cytometry (CyTOF). As expression of CD4 and CD8 was reduced upon stimulation, dimensionality reduction of CD3+ T cells with uniform manifold approximation and projection (UMAP) was used to distinguish CD4+ from CD8+ T cells (Figure S3A and B, see STAR methods). The validity of this approach was confirmed by the fact that it showed CD154 and CD103 to be expressed preferentially by the putative CD4+ and CD8+ T cell clusters, respectively, mirroring the pattern found using flow cytometry (Figure S3C and D). UMAP clustering also allowed distinct clusters of naïve, Tcm, and Tem cells to be identified amongst CD4+ T cells (Figure S3E and F).
tSNE dimensionality reduction was used to define distinct clusters within Tcm and Tem cells. Fourteen distinct clusters of CD4+ Tcm cells could be identified (Figure 3A) and many of these showed distinctive patterns of distribution between GALT and LP (Figure 3B–D and Figure S3G). Clusters C2 and C9, which represented two of the largest Tcm cell clusters in GALT (Figure 3C and D), expressed low or no cytokines (Figure 3E), while cluster 14, which represented one of the largest Tcm cell clusters in LP (Figure 3C and D), was the major cytokine producing Tcm cell population (Figure 3E). Twenty-two distinct clusters of CD4+ Tem cells could be identified (Figure 3F), with the proportions again varying depending on immune compartment (Figure 3G–I and Figure S3G). The clusters that were particularly enriched in GALT lacked cytokine expression but included a small population of CD57hiPD-1hi follicular helper T cell (Tfh)-like cells (cluster E1), as well as CD4+CD25+CD127−IL2− putative regulatory T (Treg) cells (clusters E3 and E5) (Figure 3I and J, Figure S3G). Consistent with this, the CD4+CD25+CD127− Tem cells in SM-ILF expressed FOXP3 (Figure S3H). The clusters enriched in colon LP compared with colon SMILF were major cytokine producing clusters (cluster E17 and E21) (Figure 3I and J). We also noted some minor differences in CD4+ Tem cell subset composition between PP and colon SM-ILF, with PP showing enhanced proportions of the cytokine producing clusters (Figure S3I), indicating that the functional status of PP and SM-ILF was partially distinct. Only minor differences in the composition of antigen experienced CD4+ T cell subsets were observed between ileal and colonic LP (Figure S3J). Finally, we noted that many of the Tcm and Tem cell clusters had similar features (Figure 3E and J), indicating considerable functional overlap between these populations.
Figure 3. Antigen experienced CD4+ T cells in GALT and LP are functionally distinct.
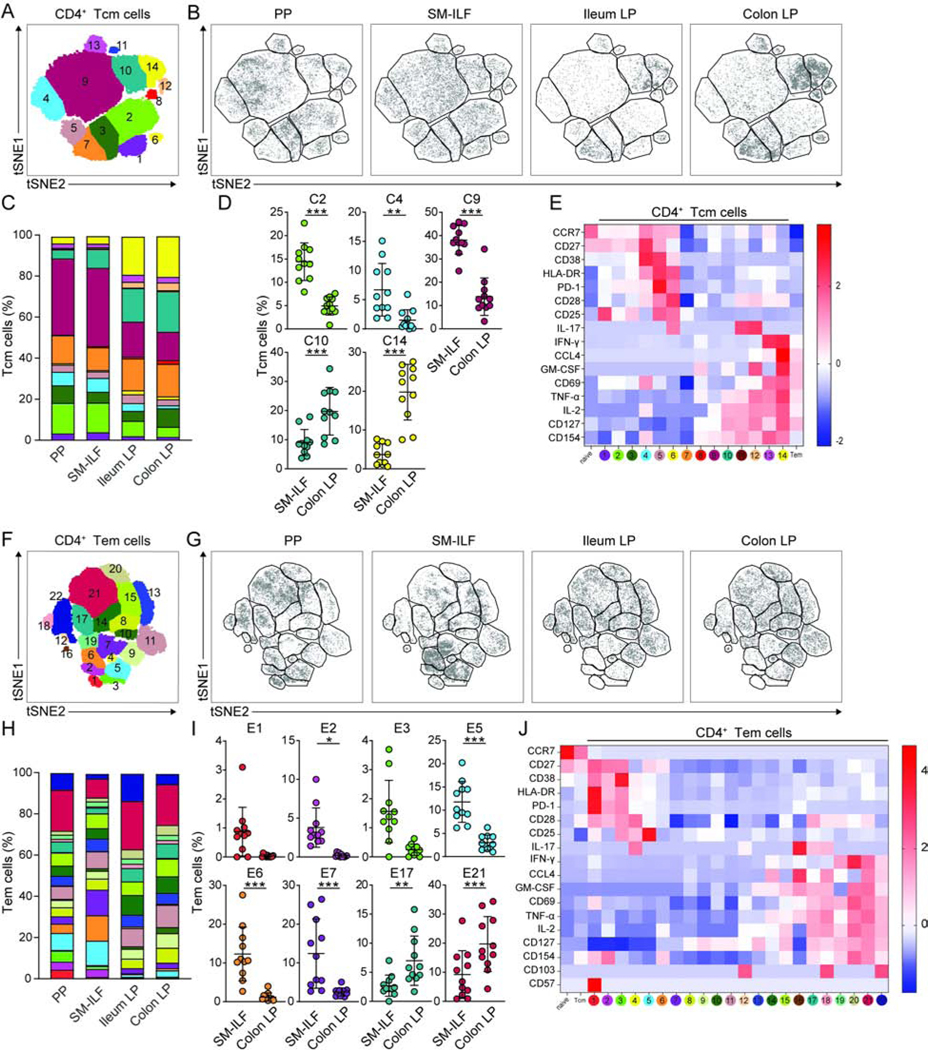
(A–K) Cell suspensions from indicated tissues were stimulated with PMA and ionomycin and analyzed by CyTOF. (A and F) 2D tSNE plots of total (A) CD45RA−CCR7+ CD4+ Tcm cells and (F) CD45RA−CCR7− effector or effector memory CD4+ Tem cells. (B and G) 2D tSNE plots of (B) Tcm and (G) Tem cells within indicated immune niche. Data are concatenated from 6–11 patients. (C and H) Bar charts showing mean cluster frequencies of (C) Tcm and (H) Tem cells. (D and I) Frequency of (D) Tcm and (I) Tem cell clusters within SM-ILF and colon LP. Clusters showing differences between sites are shown. Each circle represents an individual donor with samples paired from 11 patients; SM-ILF data is from at least 20 pooled follicles per patient. Bars, mean ± 1SD. (E and J) Heatmaps of (C) Tcm and (H) Tem cell cluster phenotypes showing Z-score of intensity of each marker, normalized by row. MFI of total naïve and Tcm or Tem cell populations is included for comparison. PP, Peyer’s patch; SM-ILF, submucosal isolated lymphoid follicle; LP, lamina propria. Statistical significance was determined using paired 2-way ANOVA, false discovery rate was corrected with the twostage step-up method of Benjamini, Krieger and Yekutieli, *p<0.05, **p<0.01, ***p<0.001. See also Figure S3.
Collectively these findings demonstrate that antigen experienced CD4+ T cells in the intestine are highly heterogeneous, with GALT and GALT-free LP containing functionally distinct subsets, but with few differences between GALT or between LP sites.
ILF are sites of GC-based B cell priming
IgA plays important roles in intestinal homeostasis (Macpherson et al., 2018; Spencer et al., 2012) and it is known that human PP are key sites of IgA+ plasmablast generation in the small intestine (Brandtzaeg and Johansen, 2005; Spencer and Sollid, 2016). However, less is known of the processes underlying IgA production in the human colon, or of what roles ILF might play in the generation of human IgA responses. Therefore, we first compared B cell subset composition in the PP, ileal M-ILF and ileal LP with that of proximal colon SM-ILF and LP. Although there was considerable variation between individual patients, naïve (CD19+IgD+) B cells were readily detected in all GALT, but not in GALT-free LP (Figure 4A, for gating see Figure S4A). Conversely, PC were present in GALT-free LP but not in GALT (Figure 4B, for gating see Figure S4B). Memory B cells were present in all sites, although they represented a very minor population of cells in the LP compared with GALT (Figure 4C, for gating see Figure S4A). GC B cells were present in ileum and colonic GALT but not in LP (Figures 4D and E). The proportion of GC B cells within GALT differed markedly between patients and between individual ILF from the same patient (Figure 4E and F), with bigger ILF having higher proportions of GC B cells (Figure S4C). CD21+CD35+ follicular dendritic cells were present in both M-ILF and SM-ILF (Figures 4G). Additionally, AICDA mRNA was detected in SM-ILF and PP, but not in the LP (Figure 4H), while SCD1 mRNA, encoding the PC-associated marker CD138, was expressed in LP but was barely detected in GALT (Figure 4I). M-ILF and SM-ILF from the sigmoid colon had a similar B cell subset composition to ileal M-ILF and proximal colon SM-ILF (Figure 4J). Taken together, these data suggest that M-ILF and SM-ILF function as sites of GC-based B cell priming along the length of the intestine. Notably, GC B cells expressing IgM, IgG, IgA1, or IgA2 were found in PP, M-ILF and SM-ILF, suggesting that all GALT compartments can support switching to both IgG and the two IgA subclasses (Figure 4K, for gating see Figure S4D). While there were no major differences in Ig isotype expression by GC B cells from the different types of GALT, Ig isotype usage varied markedly between GALT types within an individual patient (Figure 4K), consistent with local immune activation events. IgM+, IgG+, IgA1+, and IgA2+ memory B cells were also found within all GALT and at similar proportions across GALT within an individual patient (Figure 4L for gating see Figure S4D), suggesting these cells represent a memory B cell pool that re-circulates between GALT along the length of the intestine.
Figure 4. B cell subset composition of human GALT is distinct from LP.

(A-E) B cell populations in indicated tissues were assessed by flow cytometry. (A) Naïve IgD+CD19+ B cell frequency of total CD45+ cells. (B) CD20−CD38+ PC frequency of total CD45+ cells. (C) CD38−CD10- memory B cell frequency amongst total CD45+ T cells. Each circle represents an individual donor, matched between each of the sites, with SM-ILF and M-ILF data from at least 5 pooled follicles. Bars, mean ± 1SD. (D–E) Representative contour plots (D) and frequency (E) of CD20hiCD10+ GC B cells amongst total CD45+ cells. (F) CD20hiCD10+ GC B cell frequency amongst total CD45+ cells in individual SM-ILF from 5 different donors. Each circle represents a single follicle. Bars, mean ± 1SD. (G) Whole-mount immunofluorescence stain of distal colon M-ILF and SM-ILF showing CD21+CD35+ follicular dendritic cells (green or yellow) within a CD19+ B cell follicle (red) surrounded by CD3+ T cells (white). Arrow depicts location of epithelium and star location of sub-epithelial dome. Scale bars, 100μm. (H and I) Expression of (H) AICDA and (I) SDC1 mRNA in indicated tissues as assessed by qPCR. Each circle represents a single follicle (PP or ILF) or LP sample (LP) and data are from 4 patients. Bars, mean ± 1SD. (J) B cell populations in indicated sites of the sigmoid colon. Each circle represents an individual donor with paired samples. SM-ILF and M-ILF data are from at least 5 pooled follicles per patient. Bars, mean ± 1SD. Pooled data of indicated Ig isotype expression by (K) GC and (L) memory B cells in PP, M-ILF and SM-ILF. Each circle represents an individual donor with lines joining paired samples. SM-ILF and M-ILF data are from least 5 pooled ILF per patient. Bars, mean ± 1SD. PP, Peyer’s patch; SM-ILF, submucosal follicle; M-ILF, mucosal follicle; LP, lamina propria. Statistical significance was determined using the paired Friedman test with Dunn’s multiple comparisons *p<0.05, **p<0.01, ***p<0.001. See also Figure S4.
Isolated lymphoid follicles contribute to region-specific adaptive immune responses
As expected, the overwhelming majority of PC in the ileal and colonic LP were IgA+ (Figure 5A), and almost all IgA+ cells in the LP were PC (Figure 5B). As distinct GALT structures have been suggested to contribute to the regionalized distribution of IgA+ PC along the murine intestine (Masahata et al., 2014), we hypothesized that PP and colonic ILF may play similar anatomically restricted roles in the human intestine. To test this hypothesis, 6 pieces of GALT-free ileum LP, 6 pieces of proximal colon LP, 6 individual PP follicles and 6 colonic SM-ILF were isolated from each of 3 individual patients, and IgA heavy chain variable region libraries from each tissue were amplified by PCR (Wu et al., 2010). Igs were defined as originating from the same germline B cell clone when they had the same CDR3 length and a weighted nucleotide difference between CDR3s of < 0.4 (Zhao et al., 2018) (Figure S5A). Across all samples, we identified a total of 13,351 IgA clones with ≥ 10 reads for patient one, 14,761 clones for patient two and 7,872 clones for patient three. V gene usage was similar between patients and tissue site, with the expected skewing towards IGHV3 (Finlay and Almagro, 2012), followed by IGHV4 and IGHV1 (Figure S5B, data not shown). Within each patient, the number of IgA+ clones present in LP samples was consistently higher than that observed in GALT samples (Figure S5C). Furthermore, we found that large clones made up a greater fraction of the total clonal abundance in GALT when compared to LP samples (Figure S5D). The Morisita-Horn index (MHI), which considers the overlap between clonally related sequences and their relative frequency, was next used to determine IgA repertoire similarity between different samples. All ileal LP samples within each patient displayed a high MHI score and were thus highly related to one another, as were all proximal colon LP samples (Figure 5C). In contrast, ileal LP samples showed a low MHI score when compared with proximal colon LP samples (Figure 5C), demonstrating highly distinct IgA repertoires between these sites. The MHI score between PP and SM-ILF and between individual PP follicles or individual SM-ILF was also low (Figure 5D), even when taking into account only the most abundant 100 clones within each site (Figure S5E), demonstrating that each GALT follicle contains a largely distinct IgA repertoire.
Figure 5. Isolated lymphoid follicles contribute to region-specific adaptive immune responses.

(A) Proportion of LP PC expressing IgA and (B) proportion of LP IgA+ cells that were PC in indicated tissue. Each circle represents an individual donor with paired samples. (C–G) The IgA repertoire in ileum and proximal colon GALT and LP was determined in 3 individual donors. (C and D) The Morisita-Horn similarity index (MHI) between (C) six individual cLP and siLP samples and (D) six individual PP and colon SM-ILF follicles, collected from each of the three patients analyzed. (E) Percentage of the most dominant GALT IgA clones in indicated LP samples. The 100 most abundant clones within each PP follicle (n=6) and SM-ILF (n=6) were pooled (PP: 471–583; SM-ILF: 521–570 clones) and the percentage of these clones that were present with ≥10 reads in each of the ileum and colon LP samples assessed. (F) Percentage of top 100 clones present in each individual GALT sample (X axis) from patient 3 that were present with ≥10 reads in each LP sample. (G) Proportion of the IgA repertoire in each LP sample that was covered by the dominating 100 clones in the 6 pooled SM-ILF (521–570 clones) or 6 pooled PP follicles (471–583 clones). Data from each of the three patients (X axis) is shown. (E-G) Bars represent boxplots with 1st, median and 3rd quartile. (H) Representative flow cytometry plots and (I) pooled analysis of intestinal homing receptor expression by IgA+ PC in indicated tissue. Each circle represents an individual donor with paired samples. PP, Peyer’s patch; SM-ILF, submucosal follicle; M-ILF, mucosal follicle; LP, lamina propria; GALT, gut-associated lymphoid tissue. See also Figure S5.
To assess whether PP and colonic SM-ILF may contribute to regionalized IgA PC distribution within the human intestine, we determined how the largest IgA+ clones present in PP and colonic SM-ILF were distributed within the ileum and colon LP from each patient. For this we identified and pooled the 100 largest clones from each of the six individual SM-ILF samples (patient one, 570 clones; patient two, 539 clones; patient three, 521 clones) or individual PP follicles (patient one, 583 clones; patient two, 519 clones, patient three, 473 clones) and assessed the proportions of these clones that were present in the ileal and colonic LP. For each of the 3 patients, a higher proportion of the dominant SM-ILF clones were found in all 6 colonic LP samples compared with the 6 ileal LP samples (Figure 5E). Conversely, a higher proportion of the dominant PP clones were present in all 6 ileal LP samples compared with the 6 colonic LP samples (Figure 5E). When separately assessing how the 100 dominant clones from each individual SM-ILF and PP follicle were represented within each of the six individual colonic and ileal LP sample, clones present in each individual SM-ILF were present in higher proportions in all 6 colonic LP samples compared with ileal LP samples, while the reverse was true for clones present in individual PP follicles (Figure 5F). Dominant clones present in SM-ILF also made up a greater fraction of the total clonal repertoire in proximal colon LP (cross-patient mean 14.69%) compared with the ileum (cross-patient mean 3.1%), and the reverse was true for clones present in PP (Figure 5G). Collectively, these results indicate that colonic SM-ILF serve as important adaptive immune inductive sites for the colon, while PP represent key inductive sites for the ileum.
The entry of adaptive immune cells into different regions of the intestine is mediated by distinct sets of homing receptors, with chemokine receptor 9 (CCR9) implicated in mediating lymphocyte entry into the small intestine and G-coupled protein receptor (GPR)15 mediating entry into the colon (Hieshima et al., 2004; Kunkel et al., 2000; Nguyen et al., 2015; Svensson et al., 2002). We thus assessed the expression of CCR9, GPR15, CCR10, a receptor reported to be expressed on all IgA+ PC (Kunkel et al., 2003), and the intestinal homing integrin α4β7, on IgA+ PC in the colonic and ileal LP by flow cytometry (Fig 5H and I). While IgA+ PC in the ileum and proximal colon LP expressed similar amounts of CCR10 and similar proportions co-expressed the α4 and β7 integrin chains, IgA+ PC in the ileal but not colonic LP expressed CCR9, while those present in the colonic LP expressed GPR15 (Fig 5H and I). These results suggest that differential homing receptor expression likely contributes to the distinct distribution of IgA+ PC clones between the ileum and proximal colon.
IgA isotype is related to clonality with little evidence of sequential IgA1 to IgA2 switching
Assessment of the distribution of IgA subclasses within individual clones across patients and samples demonstrated that the overwhelming majority of IgA clones were either IgA1+ or IgA2+ (see STAR methods, Figure 6A). Consistent with prior studies (Crago et al., 1983; Kett et al., 1986), IgA2+ clones dominated over IgA1+ clones in the colon LP and at a similar ratio in all 3 patients examined (Figure 6A). In contrast, a higher proportion of IgA1+ clones were found in the ileal LP compared with the proximal colon LP of the same patient, although the exact IgA1:IgA2 ratio in the ileum varied between patients (Figure 6A). Consistent with this, flow cytometry analysis of paired patient samples demonstrated that the IgA+ PC pool in the proximal colon LP consistently contained a higher proportion of IgA2+ PC compared with the ileal LP, with the IgA1:IgA2 ratio in the ileal LP also showing more variation between patients (Figure 6B).
Figure 6. IgA isotype is related to clonality with little evidence of sequential IgA1 to IgA2 switching.
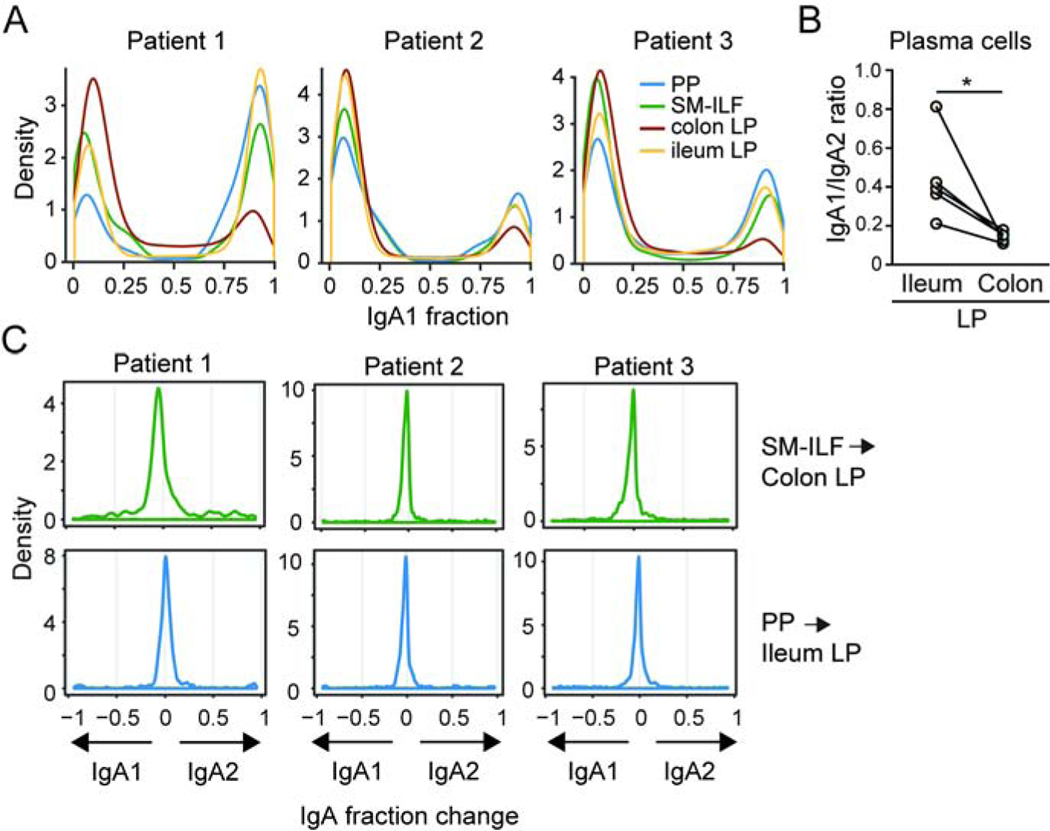
(A) The distribution of the IgA1:IgA2 ratio per clone (IgA1+ ~1.0; IgA2+ ~0.0) in indicated samples (see STAR methods). (B) IgA1:IgA2 ratio of LP PC in ileum and proximal colon LP as assessed by flow cytometry. Each circle represents a single patient with paired samples. *p<0.05, paired student’s t test. (C) Distribution of change in IgA isotype for the top 100 GALT clones showing ≥ 10 reads within the LP. Clones of each GALT sample were compared to each LP sample. The change in IgA isotype of a specific clone was calculated by subtracting the IgA1 fraction of the clone in LP from the IgA1 fraction of the clone in GALT. Displayed are the change in fraction of each clone from IgA2 to IgA1 (negative values) or from IgA1 to IgA2 (positive values). Top panels, SM-ILF clones in colonic LP, lower panels PP clones in ileal LP. PP, Peyer’s patch; SM-ILF, submucosal follicle; LP, lamina propria.
It has been suggested that IgA1+ cells may undergo sequential class switch recombination to express IgA2 subsequent to their entry into the LP (He et al., 2007). To explore this idea, we identified IgA1+ clones from paired samples of colonic SM-ILF or PP and assessed whether there was evidence of switching to IgA2 by clones with the overlapping sequence in the matched samples of colonic or ileal LP, respectively. Using this approach, we observed little evidence of sequential switching from IgA1 to IgA2 in the LP (Figure 6C), indicating that, if such a process occurs, it is a rare event. As expected, there was also no evidence of IgA2+ clones in SM-ILF or PP switching to the production of IgA1 in the LP.
Collectively our results indicate that human ILF play an important role in the initiation of regionalized adaptive immune responses along the intestine and we provide methods for detailed analysis of these structures in health and disease.
Discussion
Here we described methods to identify, isolate and analyze human GALT and GALT-free LP, allowing in-depth profiling of these distinct immune compartments. We identified two major types of ILF, mucosal-ILF and submucosal-ILF, which displayed a distinct distribution along the length of the intestine. Both structures consisted of a CD11c+ cell-enriched subepithelial region, distinct T and B cell zones, a central follicular dendritic cell network, T zone-associated MAdCAM-1+ HEV, and a network of surrounding lymphatics, suggesting they serve as adaptive immune inductive sites. The T and B cell composition of M-ILF and SM-ILF was highly distinct from that of GALT-free LP, while IgA sequencing provided evidence that human ILF contribute to region-specific immune responses in the intestine.
Previous studies examining lymphoid structures within the human intestine have relied almost exclusively on histochemical and electron microscopic techniques (Fujimura et al., 1992; Jacob et al., 1987; Moghaddami et al., 1998; O’Leary and Sweeney, 1986; Senda et al., 2019). Despite these limitations, lymphoid aggregates have been identified both within the mucosa alone and extending through the muscularis mucosae into the SM (Moghaddami et al., 1998; O’Leary and Sweeney, 1986). While lymphoid follicles associated with the SM have been documented in the human colon (Dukes and Bussey, 1926; O’Leary and Sweeney, 1986), their presence in the small intestine has remained unclear (Junker et al., 2009; Meier et al., 2014; Moghaddami et al., 1998; Spencer et al., 2019). In contrast, lymphoid follicles situated within the mucosa alone have been identified within the ileum and rectum (Moghaddami et al., 1998; O’Leary and Sweeney, 1986). Here, we extended these findings describing the distribution of M-ILF and SM-ILF along the length of the human intestine and providing evidence that both structures serve as important adaptive immune inductive sites. The presence of M cells and a SED rich in CD11c+ cells suggests that M-ILF and SM-ILF are capable of taking up and responding to luminal-derived antigen. The presence of MAdCAM-1+ HEV and a surrounding lymphatic network indicates that adaptive immune cells can enter both types of structures and, following activation, are able to disseminate via lymphatics into the circulation to carry out effector functions in distant locations. The distribution profile of SM-ILF and M-ILF suggests that SM-ILF are the main adaptive immune inductive sites of the cecum and proximal and transverse colon, while M-ILF may collaborate with PP and SM-ILF to serve such functions in the ileum and distal colon or rectum respectively. These findings highlight the importance of taking M-ILF and SM-ILF into separate consideration when assessing regional intestinal immune homeostasis and pathology in humans. A potential caveat to our analysis is that it is based on intestinal tissues from elderly CRC patients. It will thus be important in future studies to compare GALT distribution and composition in healthy intestine from both old and young cohorts. Whether this technique is applicable to more proximal segments of the small intestine also remains to be determined.
A major technical advantage of our isolation protocol is that it allows for a more accurate assessment of immune subset composition between distinct immune compartments of the intestine when compared with current methods. Indeed, while previous studies have suggested that naïve T and B cells may be present within the LP (Elgbratt et al., 2010; Horjus Talabur Horje et al., 2017), we showed here that these cells were restricted to LP-free GALT. Furthermore, we were able to highlight the distinct phenotype and function of antigen-experienced CD4+ T cells within GALT and GALT-free LP, with the latter enriched in cytokine producing, poly-functional T cells. Our methods also allowed us to show that antigen-experienced CD4+ T cell subsets in GALT-free LP compartments of the ileum and proximal colon are largely similar, contrasting with previous findings in mice (Agace and McCoy, 2017). Collectively, these results provide important insights into the activity of these distinct immune compartments and highlight the importance of studying these tissues in isolation from one another.
As with previous studies in mice (Lindner et al., 2012) and humans (Boursier et al., 2005), we found the IgA repertoire of PC in the human ileal and colonic LP to be distinct. The Ig repertoire of human PP overlaps with that of the small intestinal LP (Dunn-Walters et al., 1997) and consistent with these findings, we observed a higher overlap between IgA clones present in PP follicles with the ileal LP compared with colonic LP. Conversely, IgA clones present in SM-ILF were enriched in the colonic LP compared with the ileal LP. Such findings strongly suggest that GALT structures located in distinct segments of the human intestine promote regionalized adaptive immune responses. In mice, tissue-specific localization of adaptive immune cells is driven, at least in part, through the selective acquisition of region-specific homing molecules during priming in regional lymph nodes (Campbell and Butcher, 2002; Houston et al., 2016; Svensson et al., 2002). Our findings that IgA+ PC present in the ileal LP selectively expressed the small intestinal homing receptor CCR9, while those in the colon LP expressed the colon homing receptor GPR15, suggest similar processes occur in humans and likely contribute to the differential distribution of IgA+ PC clones in the ileal and colonic LP. Notably, we also found that GALT structures in the ileum contained proportionally greater numbers of GC B cells than those in the proximal and distal colon, indicating differences in the overall immune activation status between ileal and colonic GALT. In mice, intestinal inductive sites were recently shown to generate distinct types of adaptive immune responses, depending on their location along the length of the intestine (Esterházy et al., 2019) and additional in-depth profiling of human GALT should help determine whether similar processes occur in humans.
The distinct location of M-ILF and SM-ILF within the mucosa and submucosa respectively, also begs the question of whether these structures generate different types of adaptive immune response, irrespective of their location along the intestine. While the adaptive immune cell composition of M-ILF and SM-ILF appeared broadly similar, we noted several differences between these compartments. First, consistent with previous reports (O’Leary and Sweeney, 1986), the overlying FAE of SM-ILF was buried between epithelial crypts rather than having the clear dome-like structure seen in PP and M-ILF. Second, GP2+ epithelial cells were present in the FAE of M-ILF and PP, but not SM-ILF. Third, SM-ILF contained larger proportions of naïve CD4+ and CD8+ T cells than M-ILF. Whether such differences influence the type of adaptive immune responses generated in M-ILF and SM-ILF remains unclear and further profiling of M-ILF and SM-ILF should help address this question.
Consistent with previous studies (Crago et al., 1983; Kett et al., 1986), the ratio of IgA1:IgA2 producing PC decreased between the ileum and proximal colon LP. It has been unclear whether IgA2+ PC are generated via sequential switching from IgA1+ cells or by direct switching from IgM to IgA2. Furthermore it is controversial whether class switching to IgA can occur in the intestinal LP and if this might include switching from IgA1 to IgA2 (Barone et al., 2009; Bergqvist et al., 2010; Fagarasan et al., 2001; He et al., 2007; Lin et al., 2014; Shikina et al., 2004). Assessment of our unique GALT and GALT-free LP material demonstrated that the overwhelming majority of IgA clones were either IgA1+ or IgA2+, indicating that IgA isotypes are primarily determined during initial B cell priming in GALT. Moreover, we found little evidence that IgA1+ clones present in GALT switched to IgA2 in the intestinal LP suggesting that, if this occurs, it is a rare event, although additional longitudinal studies are needed to confirm this observation. We hypothesize that the bias toward IgA2+ PC in the intestine, in particular in the colon, LP thus reflects events occurring during B cell priming in GALT, potentially through preferential switching to IgA2 or differential acquisition of tissue homing receptors by IgA1+ and IgA2+ plasmablasts (Pakkanen et al., 2010). The different LP sites may also foster distinct mechanisms for the subsequent maintenance of recruited plasmablasts of different IgA isotypes.
In summary, the current study provides unique insights into the diversity, distribution, anatomy and function of GALT alongs the length of the human intestine, highlighting a role for ILF as inductive sites for region specific immune responses. The methods we describe should pave the way for more precise dissection of the human intestinal immune system and for assessing the role of ILF in intestinal immune homeostasis and disease.
STAR Methods
LEAD CONTACT AND MATERIALS AVAILABILITY
Further information and requests for resources and reagents should be directed to and will be fulfilled by the Lead Contact, Dr WW Agace (wiag@dtu.dk). This study did not generate new unique reagents.
EXPERIMENTAL MODEL AND SUBJECT DETAILS
Human subjects
Samples were taken from 99 patients after informed consent was obtained, as approved by the Videnskabsetiske Komité for Region Hovedstaden, ethical permission H-3–2013-118. See table S1 for full patient information.
METHOD DETAILS
Tissue processing
Resected intestinal tissues were processed within 2 h of removal from the patient. For colorectal cancer tissues, samples were taken at least 10 cm distant from the tumor. The muscularis externa was first removed with scissors, the remaining tissue was incubated in a 370rpm shaking incubator twice for 10 min at 37°C in RPMI-5 (RPMI containing 5% FCS and 1% penicillin and streptomycin) containing 4 mM DTT to remove mucus, before macroscopically visible submucosa (SM) was removed with scissors. The mucosa was then separated from the underlying SM under a stereo microscope using forceps (see Video S1). For isolation of GALT-free LP and M-ILF, epithelial cells were removed from the mucosa by shaking mucosa four times in Ca2+ and Mg2+ -free HBSS containing 1% penicillin and streptomycin and 5 mM EDTA at 37oC for 10 min. Any M-ILF present were then dissected from the remaining LP under a stereo microscope with a scalpel (see Video S2) and the remaining GALT-free LP was cut into 2–4 mm2 pieces prior to digestion. For isolation of SMILF, SM was stained with 0.1% methylene blue for 2 min, then washed twice for 5 min in PBS and twice in 5 mM EDTA in PBS. SM-ILF were then dissected from SM with a scalpel or 1 mm biopsy punch under a stereo microscope (see Video S3). Single-cell suspensions of isolated GALT and GALT-free LP were generated by shaking tissues at 370 rpm in a 37°C incubator in RPMI-5 containing 30 μg/ml DNase and 5 mg/ml collagenase D or 2.5 mg/ml Liberase TM for 45 min at 37°C.
Flow cytometry
Cell suspensions were stained with the antibodies indicated (Table S2) in Brilliant stain buffer (BD Biosciences) containing 4% normal mouse serum according to standard techniques. The cells were stained with 7-AAD and analyzed on an LSR Fortessa 2 (BD Biosciences) using Flowjo software (Treestar). For FOXP3 staining, cells were stained with the zombie UV fixable viability dye and surface antigens as above, fixed using the FOXP3 staining buffer set (eBioscience) and stained with FOXP3 antibody for 30 minutes on ice, before washing twice with FOXP3 permeabilization buffer (eBioscience).
Tissue imaging and staining
Tissues were fixed in 4% paraformaldehyde (PFA), mounted in paraffin, sectioned on a Tissue Tek Prisma Plus (Sakura) and stained with hematoxylin and eosin using standard protocols.
Scanning electron microscopy
Samples were fixed at room temperature for at least 24 h in 0.05 M phosphate buffer containing 2% glutaraldehyde, washed 3 times for 10 min in 0.1 M sodium cacodylate, and incubated for 2 h in 0.1 M sodium cacodylate containing 1% OsO4 to fix lipids. Samples were washed briefly 3 times in distilled H2O and dehydrated by incubation in 25% ethanol for 10 min followed by sequential washes at room temperature in 50%, 70%, 80%, 95% ethanol, each with two washes of 10 min, followed by three final 10 min washes in 100% ethanol. Samples were dried in a CPD-030 critical point drier (Balzers), mounted with silver glue, and sputter-coated with 6 nm gold using an EM ACE200 (Leica). Samples were imaged with an FEI Quanta 3D FEG scanning electron microscope (Thermofisher).
Immunofluorescence staining
SM, M-ILF and SM-ILF were fixed for 2h at 4°C in 4% PFA under constant agitation. Fixed ILF were either embedded in 4% low melting agarose in PBS and cut with a swinging blade microtome (Vibratome Series 3000 Plus) into 50 μm sections or incubated overnight at 4°C in 35% sucrose, frozen in Tissue-Tek OCT and cut into 20 μm sections with a cryostat (Leica CM1950). Microtome sections or whole mount tissues were blocked in PBS containing 5% FCS, 5% normal mouse serum and 0.1% Triton X-100 overnight. Cryostat sections were incubated for 30 min in PBS containing 0.5% saponin, 2% BSA, 1% FCS, and 1% donkey or goat serum. For staining, tissues were incubated overnight with the indicated primary antibodies at 4°C, and, if applicable, with secondary antibodies for 1–12 h, depending on respective antibodies and sectioning technique. Nuclei were stained using 4′,6-diamidino-2phenylindole (DAPI) or SYTOX Blue. Tissues were subsequently washed and mounted in ProLong Gold. To image ILF in whole mount SM, tissue was incubated overnight at 4°C with the indicated antibodies and washed as described above. Finally, stained SM was cleared in Iohexol overnight at 4°C and imaged. Images were acquired using an LSM-710 confocal microscope (Carl Zeiss) or using the spectral imaging mode of an LSM-780 (Carl Zeiss). Images were processed using Zen v2.3 (Carl Zeiss), Imaris version 8 (Bitplane) and Photoshop CS6 (Adobe).
Mass cytometry (CyTOF)
Mass cytometry analysis of single-cell suspensions of digested tissue was carried out as previously described (Rubin et al., 2019). Frozen single cell suspensions of digested tissues were thawed in RPMI-10 (RPMI containing 10% FCS and 1% penicillin and streptomycin) with 25 U/ml benzonase, washed twice in RPMI-10 with benzonase, once in RPMI-10, and 1 million cells were rested in RPMI-10 in a 96-well deep well plate for 2–3 h at 37°C, before stimulation with 10 ng/ml PMA and 1 μg/ml ionomycin in the presence of 5 μg/ml brefeldin A and 5 μg/ml monensin for 4 h. 2 mM EDTA was then added for 15 min at room temperature, before washing twice with CyFACS buffer containing 0.1% BSA, 2 mM EDTA and 0.05% sodium azide). Cells were incubated with a 70μL cocktail of antibodies against cell surface antigens in CyFACS buffer for 45 min on ice, washed twice with CyFACS buffer and resuspended in CyPBS (100 μL) containing 1:3000 maleimide-DOTA and 115Indium for 30 min on ice. Cells were washed thrice in CyFACS buffer, resuspended in 100 μL CyPBS containing 2% PFA and incubated overnight at 4°C. After washing in 1X permeabilization buffer, cells were incubated with a 70 μL cocktail of antibodies against intracellular antigens in CyFACS buffer for 45 min on ice. After washing thrice in CyFACS buffer, cells were incubated in 100 μL CyPBS containing 1:2000 Ir-Intercalator and 2% PFA for 20 min at room temperature, washed twice in CyFACS followed by MilliQ water thrice, spiked with beads according to the manufacturer’s instructions, and resuspended in 1–1.5 mL MilliQ water for analysis. Bead normalized files were obtained from the Helios instrument using on-board software. The data were analyzed in FlowJo (Treestar) as follows; cells were first gated as viable CD45+ CD3+ non-doublet events, before CD4+ and CD8+ T cells were distinguished using a UMAP plot in Flowjo on all events with nearest neighbors = 20, minimum distance = 0.1, clustering channels = IFNγ, CD69, CD56, IL-17, IL-2, CD27, CD154, PD-1, CD103, CD28, CD38, HLA-DR, CD127, Perforin, CD57, CCL4, TNFα, GM-CSF, Granzyme B, NKG2C, CD25. After separating CD4+ and CD8+ T cells, a second UMAP was used to separate naïve, CD4+ Tcm and Tem by running a UMAP on all CD4+ T cells with nearest neighbors = 20, minimum distance = 0.1, clustering channels = CD69, CD27, CD154, PD1, CD103, CD45RA, CD38, CD127, CD57, CCR7. Finally, tSNE plots were used to identify cytokine producing clusters separately within CD4+ Tcm and Tem using iterations = 1500, perplexity = 50, clustering channels = IFN-γ, CD69, IL-17, IL-2, CD27, CD154, PD1, CD103, CD45RA, CD38, CD127, CD57, CCL4, TNFα, GM-CSF, CCR7. Clusters were gated manually based on cytokine and surface marker expression. The identity of each cluster was displayed as a heatmap of the z-score of median fluorescence intensity for each marker, except CD25, for which the z-score of mean fluorescence intensity was used. Clusters in the heatmap were ordered manually from least to most active, and marker expression of total naïve and Tem or Tcm were included in Tcm and Tem heatmaps, respectively.
Sequencing of immunoglobulins
Intestinal tissues were processed as above until the SM separation stage. For PP, individual follicles were identified in the periphery of the PP under a stereo microscope and excised using a scalpel, taking care to remove attached villi. For SM-ILF, large follicles (>0.75 mm diameter) could be identified while peeling SM from LP and were isolated as described above. For ileum and proximal colon LP samples, 3 mm punch biopsies of LP were taken at least 1cm apart from different areas of GALT free mucosa. Samples were disrupted and homogenized in RLT buffer using a TissueLyser (Qiagen) and 5 mm stainless steel beads. RNA was extracted with an RNeasy Micro kit according to the manufacturer’s instructions (Qiagen) and cDNA synthesis was performed with a SuperScript IV First-strand synthesis system (Thermofisher). Immunoglobulin genes were amplified from the cDNA using an isotype-specific multiplex polymerase chain reaction with the Multiplex PCR kit (Qiagen). Six forward primers: IGHV1–6 and one reverse primer: CHA for IgA or CHM for IgM (Wu et al., 2010) were used for each reaction. After purification with Agencourt AMPure XP beads (Beckman Coulter), PCR products were processed into Illumina NGS compatible libraries using the QIAseq 1-step amplicon library kit (Qiagen). After analysis with High Sensitivity DNA BioAnalyzer chips (Agilent), the 24 IgA and 3 IgM individual libraries obtained for each patient were pooled at equimolar concentrations. The pooled libraries from each patient were then concentrated and re-purified after electrophoresis in agarose gel using the QIAquick gel extraction kit (Qiagen) and sequenced at the SNP&SEQ Technology platform (Uppsala University). Each pooled patient library was paired-end sequenced (2×300bp) on an Illumina Miseq using one lane per patient.
Analysis of immunoglobulin sequences
Processing of raw IgA and M reads
Read pairs were assembled using PEAR version 0.9.6, requiring an assembly p-value < 0.01 and a minimum overlap between the reads of 50 base pairs. Successfully assembled reads had a minimum Phred quality score of 20 and an average of 37 (Illumina 1.9 encoding). The assembled reads were then annotated using IgBLAST version 1.10.0, using a personalized V gene database for each of the three patients assessed (See Methods; Patient-specific V gene database construction) and universal D- and J gene databases downloaded from IMGT. Downstream analysis was performed on the IgA and M sequences that were assigned a single top V gene annotation, a single top J gene annotation and a CDR3 annotation by IgBLAST. The Ig sequences were then deduplicated based on their unique combination of V gene, J gene and nucleotide CDR3, noting the abundance, i.e. number of observations, of each combination per sample.
Construction of clones by similarity clustering
For the clonal construction, all unique V gene, J gene and nucleotide CDR3 combinations (VJCDR3) across all samples for each specific patient were collected, while keeping track of the sample-specific abundances per VJCDR3. These VJCDR3 combinations were then divided into clonal groups using an approach similar to (Zhao et al., 2018). Briefly, the VJCDR3s were divided into initial groups, if they had the same V gene and J gene annotation, and the same CDR3 nucleotide length, which had to be divisible by three. The VJCDR3 were divided further by hierarchically clustering using Ward’s method each initial group, measuring the distance between the VJCDR3s by the number of CDR3 nucleotide differences between them, weighted by the SF5 model of somatic hypermutation targeting and substitution (Yaari et al., 2013). Hierarchical trees were constructed for each initial group and cut at a distance threshold of 0.4, hereby creating the final clones. A clone was accepted if it consisted of at least five CDR3 sequences. The threshold distance of 0.4 was determined using manual inspection of distance-to-nearest-plots, as described in (Zhao et al., 2018). The abundance count of a clone is the sum of the abundance of each VJCDR3 combination assigned to it.
Patient-specific V gene database construction
Three IgM repertoires from each patient were analyzed using IgDiscover in order to generate patient-specific V gene databases (Corcoran et al., 2016). The default IgDiscover settings were used, changing the V gene coverage to 80, J gene coverage to 60, D gene coverage to 30 and allowing stop codons. These changes were necessary due to the primer panel used for Ig sequencing, as the forward primer was positioned within the V gene, causing a lower gene coverage and detection of stop codons, when the reading frame was naively determined by IgDiscover. IMGT V-, D- and J gene databases were used as starting databases for IgDiscover while the patient-specific databases were sourced from the IMGT V genes that were detected in each patient by IgDiscover.
Annotation of IgA isotypes
Read pairs successfully assembled by PEAR (See Methods; Processing of raw IgA and M reads) were analyzed with the MiXCR align function (Bolotin et al., 2015). Samples were handled separately. For each group of Ig sequences that had the same unique combination of V gene, J gene and nucleotide CDR3 (VJCDR3), the fraction of IgA1 sequences was calculated as:
where N_IgA1VJCDR3 is the number of VJCDR3-containing Ig sequences assigned an IgA1 constant chain and N_IgA2VJCDR3 is the number of VJCDR3-containing Ig sequences assigned an IgA2 constant chain. Each clone consists of multiple unique nucleotide CDR3s, but the same V and J gene (See Methods; Construction of clones by similarity clustering). The fraction of IgA1 within each clone was calculated using the weighted average of the VJCDR3-specific IgA1 fractions that had been assigned to the specific clone. The average was weighted by the abundance of each VJCDR3 combination per sample.
Change in IgA isotype
The top 100 clones from a specific GALT sample which had ≥ 10 counts in the paired LP sample were assessed for IgA1 isotype change. The change in IgA isotype of a specific clone was calculated by subtracting the IgA1 fraction of the clone in LP from the IgA1 fraction of the clone in GALT, producing a value between −1 and 1. A value of 1 represents a complete change from IgA1 to IgA2, while a value of −1 represents a complete change from IgA2 to IgA1.
Ig analysis visualization. Scatterplots, kneeplots, boxplots and heatmaps were constructed in R (R Core Team, 2018) using the packages gplots (Warnes et al., 2016) and ggplot2 (Wickham, 2017).
Quantitative PCR
RNA extraction and cDNA synthesis was performed as for IgA analysis. Quantitative PCR was performed using Ssofast EvaGreen Supermix (Bio-Rad) in a Bio-Rad CFX96 Real Time System according to the manufacturer’s instructions. Bio-Rad CFX Manager was used to extract Ct values and process the data. Quantification of each mRNA was performed using the comparative Ct method and normalized to the combined housekeeping genes (ACTG1 and RPS27). Each sample was analyzed in technical duplicates. Sequences of the primers used for qPCR are listed in Table S2.
QUANTIFICATION AND STATISTICAL ANALYSIS
All statistical analyses apart from IgA sequencing analysis (detailed in methods) were performed in Prism software (GraphPad). Details for the statistical tests used in each experiment can be found in figure legends. Statistical significance was defined as *p<0.05, **p<0.01, ***p<0.001.
DATA AND CODE AVAILABILITY
The IgA and IgM sequencing data generated during this study is available at the European Nucleotide Archive, accession number PRJEB36054. This study did not generate code.
Supplementary Material
Video S1 Peeling submucosa from LP reveals SM-ILF embedded in the submucosa, related to Figure 1
Video S2 Cutting SM-ILF from methylene blue-stained submucosa after peeling away from LP, related to Figure 1
Video S3 Cutting M-ILF out from LP after submucosa is peeled away, related to Figure 1
Highlights.
Novel methods for isolatings human M-ILF, SM-ILF, and GALT-free intestinal LP
Human M-ILF and SM-ILF are highly organized sites of adaptive immune induction
An adaptive immune roadmap of human GALT and GALT-free LP
Human ILF contribute to regionalized adaptive immune responses
Acknowledgements
We thank all patients and collaborating staff at Herlev hospital and in particular the Gastroenterology Team (Department of Pathology) for help in providing tissue samples, the Core Facility for Integrated Microscopy (University of Copenhagen) for scanning electron microscopy, and the Stanford Human Immune Monitoring Center (National Institutes of Health S10 Shared Instrumentation Grant (S10RR027431–01)) for access to mass cytometers and H. Maecker and S. Gupta for mass cytometry expertise. Sequencing was performed at the National Genomics Infrastructure (NGI) and Science for Life Laboratory SNP&SEQ Technology Platform in Uppsala (supported by the Swedish Research Council and the Knut and Alice Wallenberg Foundation). We thank Dr A. Mowat (Glasgow University) for valuable feedback during preparation of the manuscript. This work was supported by grants from the Lundbeck Foundation (R155–2014-4184), Denmark, the Swedish Research Council (2017–02072) and the Swedish Cancerfonden (18 0598) to W.W.A and from the N.I.H (R01 DK101119) to A.H.
Footnotes
Declaration of interests
The authors declare no competing interests.
Publisher's Disclaimer: This is a PDF file of an unedited manuscript that has been accepted for publication. As a service to our customers we are providing this early version of the manuscript. The manuscript will undergo copyediting, typesetting, and review of the resulting proof before it is published in its final form. Please note that during the production process errors may be discovered which could affect the content, and all legal disclaimers that apply to the journal pertain.
References
- Agace WW, and McCoy KD (2017). Regionalized Development and Maintenance of the Intestinal Adaptive Immune Landscape. Immunity 46, 532–548. [DOI] [PubMed] [Google Scholar]
- Barone F, Patel P, Sanderson JD, and Spencer J. (2009). Gut-associated lymphoid tissue contains the molecular machinery to support T-cell-dependent and T-cell-independent class switch recombination. Mucosal Immunol. 2, 495–503. [DOI] [PubMed] [Google Scholar]
- Bergqvist P, Stensson A, Lycke NY, and Bemark M. (2010). T Cell-Independent IgA Class Switch Recombination Is Restricted to the GALT and Occurs Prior to Manifest Germinal Center Formation. J. Immunol 184, 3545–3553. [DOI] [PubMed] [Google Scholar]
- Bolotin DA, Poslavsky S, Mitrophanov I, Shugay M, Mamedov IZ, Putintseva EV, and Chudakov DM (2015). MiXCR: software for comprehensive adaptive immunity profiling. Nat. Methods 12, 380–381. [DOI] [PubMed] [Google Scholar]
- Boursier L, Gordon JN, Thiagamoorthy S, Edgeworth JD, and Spencer J. (2005). Human Intestinal IgA Response Is Generated in the Organized Gut-Associated Lymphoid Tissue but Not in the Lamina Propria. Gastroenterology 128, 1879–1889. [DOI] [PubMed] [Google Scholar]
- Brandtzaeg P, and Bjerke K. (1990). Immunomorphological Characteristics of Human Peyer’s Patches. Digestion 46, 262–273. [DOI] [PubMed] [Google Scholar]
- Brandtzaeg P, and Johansen FE (2005). Mucosal B cells: Phenotypic characteristics, transcriptional regulation, and homing properties. Immunol. Rev 206, 32–63. [DOI] [PubMed] [Google Scholar]
- Buettner M, and Lochner M. (2016). Development and Function of Secondary and Tertiary Lymphoid Organs in the Small Intestine and the Colon. Front. Immunol 7, 342. [DOI] [PMC free article] [PubMed] [Google Scholar]
- Campbell DJ, and Butcher EC (2002). Rapid acquisition of tissue-specific homing phenotypes by CD4(+) T cells activated in cutaneous or mucosal lymphoid tissues. J. Exp. Med 195, 135–141. [DOI] [PMC free article] [PubMed] [Google Scholar]
- Corcoran MM, Phad GE, Bernat NV, Stahl-Hennig C, Sumida N, Persson MAA, Martin M, and Hedestam GBK (2016). Production of individualized V gene databases reveals high levels of immunoglobulin genetic diversity. Nat. Commun 7, 13642. [DOI] [PMC free article] [PubMed] [Google Scholar]
- Cornes JS (1965a). Number, size, and distribution of Peyer’s patches in the human small intestine: Part I The development of Peyer’s patches. Gut 6, 225–229. [DOI] [PMC free article] [PubMed] [Google Scholar]
- Cornes JS (1965b). Number, size, and distribution of Peyer’s patches in the human small intestine: Part II The effect of age on Peyer’s patches. Gut 6, 230–233. [DOI] [PMC free article] [PubMed] [Google Scholar]
- Crago SS, Kutteh WH, Prince SJ, Radl J, Haaijman JJ, and Mestecky J. (1983). Distribution of IgA1 and IgA2 subclasses in human tissue: Correlation with the presence of J-chain. Ann. N. Y. Acad. Sci 409, 803–805. [Google Scholar]
- Craig SW, and Cebra JJ (1971). Peyer’s patches: an enriched source of precursors for IgA-producing immunocytes in the rabbit. J. Exp. Med 134, 188–200. [DOI] [PMC free article] [PubMed] [Google Scholar]
- Dukes C, and Bussey HJR (1926). The number of lymphoid follicles of the human large intestine. J. Pathol. Bacteriol 29, 111–116. [Google Scholar]
- Dunn-Walters DK, Isaacson PG, and Spencer J. (1997). Sequence analysis of human IgV(H) genes indicates that ileal lamina propria plasma cells are derived from Peyer’s patches. Eur. J. Immunol 27, 463–467. [DOI] [PubMed] [Google Scholar]
- Durack J, and Lynch SV (2019). The gut microbiome: Relationships with disease and opportunities for therapy. J. Exp. Med 216, 20–40. [DOI] [PMC free article] [PubMed] [Google Scholar]
- Elgbratt K, Kurlberg G, Hahn-Zohric M, and Hörnquist EH (2010). Rapid migration of thymic emigrants to the colonic mucosa in ulcerative colitis patients. Clin. Exp. Immunol 162, 325–336. [DOI] [PMC free article] [PubMed] [Google Scholar]
- Esterházy D, Canesso MCC, Mesin L, Muller PA, de Castro TBR, Lockhart A, ElJalby M, Faria AMC, and Mucida D. (2019). Compartmentalized gut lymph node drainage dictates adaptive immune responses. Nature 569, 126–130. [DOI] [PMC free article] [PubMed] [Google Scholar]
- Fagarasan S, Kinoshita K, Muramatsu M, Ikuta K, and Honjo T. (2001). In situ class switching and differentiation to IgA-producing cells in the gut lamina propria. Nature 413, 639–643. [DOI] [PubMed] [Google Scholar]
- Farstad IN, Carlsen H, Morton HC, and Brandtzaeg P. (2000). Immunoglobulin A cell distribution in the human small intestine: phenotypic and functional characteristics. Immunology 101, 354–363. [DOI] [PMC free article] [PubMed] [Google Scholar]
- Finlay WJJ, and Almagro JC (2012). Natural and man-made V-gene repertoires for antibody discovery. Front. Immunol 3, 342. [DOI] [PMC free article] [PubMed] [Google Scholar]
- Fujimura Y, Hosobe M, and Kihara T. (1992). Ultrastructural study of M cells from colonic lymphoid nodules obtained by colonoscopic biopsy. Dig. Dis. Sci 37, 1089–1098. [DOI] [PubMed] [Google Scholar]
- Gullberg E, and Söderholm JD (2006). Peyer’s patches and M cells as potential sites of the inflammatory onset in Crohn’s disease. Ann. N. Y. Acad. Sci 1072, 218–232. [DOI] [PubMed] [Google Scholar]
- Hamada H, Hiroi T, Nishiyama Y, Takahashi H, Masunaga Y, Hachimura S, Kaminogawa S, Takahashi-Iwanaga H, Iwanaga T, Kiyono H, et al. (2002). Identification of Multiple Isolated Lymphoid Follicles on the Antimesenteric Wall of the Mouse Small Intestine. J. Immunol 168, 57–64. [DOI] [PubMed] [Google Scholar]
- He B, Xu W, Santini PA, Polydorides AD, Chiu A, Estrella J, Shan M, Chadburn A, Villanacci V, Plebani A, et al. (2007). Intestinal Bacteria Trigger T Cell-Independent Immunoglobulin A2 Class Switching by Inducing Epithelial-Cell Secretion of the Cytokine APRIL. Immunity 26, 812–826. [DOI] [PubMed] [Google Scholar]
- Hieshima K, Kawasaki Y, Hanamoto H, Nakayama T, Nagakubo D, Kanamaru A, and Yoshie O. (2004). CC Chemokine Ligands 25 and 28 Play Essential Roles in Intestinal Extravasation of IgA Antibody-Secreting Cells. J. Immunol 173, 3668–3675. [DOI] [PubMed] [Google Scholar]
- Hoorweg K, and Cupedo T. (2008). Development of human lymph nodes and Peyer’s patches. Semin. Immunol 20, 164–170. [DOI] [PubMed] [Google Scholar]
- Horjus Talabur Horje CS, Smids C, Meijer JWR, Groenen MJ, Rijnder MK, van Lochem EG, and Wahab PJ (2017). High endothelial venules associated with T cell subsets in the inflamed gut of newly diagnosed inflammatory bowel disease patients. Clin. Exp. Immunol 188, 163–173. [DOI] [PMC free article] [PubMed] [Google Scholar]
- Houston SA, Cerovic V, Thomson C, Brewer J, Mowat AM, and Milling S. (2016). The lymph nodes draining the small intestine and colon are anatomically separate and immunologically distinct. Mucosal Immunol. 9, 468–478. [DOI] [PubMed] [Google Scholar]
- Jacob E, Baker SJ, and Swaminathan SP (1987). “M” cells in the follicle-associated epithelium of the human colon. Histopathology 11, 941–952. [DOI] [PubMed] [Google Scholar]
- Junker Y, Bode H, Wahnschaffe U, Kroesen a, Loddenkemper, Duchmann R, Zeitz M, and Ullrich R (2009). Comparative analysis of mononuclear cells isolated from mucosal lymphoid follicles of the human ileum and colon. Clin. Exp. Immunol 156, 232–237. [DOI] [PMC free article] [PubMed] [Google Scholar]
- Kanamori Y, Ishimaru K, Nanno M, Maki K, Ikuta K, Nariuchi H, and Ishikawa H. (1996). Identification of novel lymphoid tissues in murine intestinal mucosa where clusters of c-kit+ IL-7R+ Thy1+ lympho-hemopoietic progenitors develop. J. Exp. Med 184, 1449–1459. [DOI] [PMC free article] [PubMed] [Google Scholar]
- Kett K, Brandtzaeg P, Radl J, and Haaijman JJ (1986). Different subclass distribution of IgA-producing cells in human lymphoid organs and various secretory tissues. J. Immunol 136, 3631–3635. [PubMed] [Google Scholar]
- Knoop K. a., Butler BR, Kumar N, Newberry RD, and Williams IR (2011). Distinct developmental requirements for isolated lymphoid follicle formation in the small and large intestine: RANKL is essential only in the small intestine. Am. J. Pathol 179, 1861–1871. [DOI] [PMC free article] [PubMed] [Google Scholar]
- Kunkel EJ, Campbell JJ, Haraldsen G, Pan J, Boisvert J, Roberts AI, Ebert EC, Vierra MA, Goodman SB, Genovese MC, et al. (2000). Lymphocyte Cc Chemokine Receptor 9 and Epithelial Thymus-Expressed Chemokine (Teck) Expression Distinguish the Small Intestinal Immune Compartment. J. Exp. Med 192, 761–768. [DOI] [PMC free article] [PubMed] [Google Scholar]
- Kunkel EJ, Kim CH, Lazarus NH, Vierra MA, Soler D, Bowman EP, and Butcher EC (2003). CCR10 expression is a common feature of circulating and mucosal epithelial tissue IgA Ab-secreting cells. J. Clin. Invest 111, 1001–1010. [DOI] [PMC free article] [PubMed] [Google Scholar]
- Lin M, Du L, Brandtzaeg P, and Pan-Hammarström Q. (2014). IgA subclass switch recombination in human mucosal and systemic immune compartments. Mucosal Immunol. 7, 511–520. [DOI] [PubMed] [Google Scholar]
- Lindner C, Wahl B, Föhse L, Suerbaum S, Macpherson AJ, Prinz I, and Pabst O. (2012). Age, microbiota, and T cells shape diverse individual IgA repertoires in the intestine. J. Exp. Med 209, 365–377. [DOI] [PMC free article] [PubMed] [Google Scholar]
- Macpherson AJ, Yilmaz B, Limenitakis JP, and Ganal-Vonarburg SC (2018). IgA Function in Relation to the Intestinal Microbiota. Annu. Rev. Immunol 36, 359–381. [DOI] [PubMed] [Google Scholar]
- Masahata K, Umemoto E, Kayama H, Kotani M, Nakamura S, Kurakawa T, Kikuta J, Gotoh K, Motooka D, Sato S, et al. (2014). Generation of colonic IgA-secreting cells in the caecal patch. Nat. Commun 5, 3704. [DOI] [PubMed] [Google Scholar]
- McDonald KG, McDonough JS, Dieckgraefe BK, and Newberry RD (2010). Dendritic cells produce CXCL13 and participate in the development of murine small intestine lymphoid tissues. Am. J. Pathol 176, 2367–2377. [DOI] [PMC free article] [PubMed] [Google Scholar]
- Meier D, Docena GH, Ramisch D, Toscanini U, Berardi G, Gondolesi GE, and Rumbo M. (2014). Immunological status of isolated lymphoid follicles after intestinal transplantation. Am. J. Transplant 14, 2148–2158. [DOI] [PubMed] [Google Scholar]
- Moghaddami M, Cummins a, and Mayrhofer G (1998). Lymphocyte-filled villi: comparison with other lymphoid aggregations in the mucosa of the human small intestine. Gastroenterology 115, 1414–1425. [DOI] [PubMed] [Google Scholar]
- Nguyen LP, Pan J, Dinh TT, Hadeiba H, O’hara E, Ebtikar A, Hertweck A, Gökmen MR, Lord GM, Jenner RG, et al. (2015). Role and species-specific expression of colon T cell homing receptor GPR15 in colitis. Nat. Immunol 16, 207–213. [DOI] [PMC free article] [PubMed] [Google Scholar]
- O’Leary a D, and Sweeney EC (1986). Lymphoglandular complexes of the colon: structure and distribution. Histopathology 10, 267–283. [DOI] [PubMed] [Google Scholar]
- Owen RL, and Jones AL (1974). Epithelial cell specialization within human Peyer’s patches: an ultrastructural study of intestinal lymphoid follicles. Gastroenterology 66, 189–203. [PubMed] [Google Scholar]
- Pabst O, Herbrand H, Friedrichsen M, Velaga S, Dorsch M, Berhardt G, Worbs T, Macpherson AJ, and Förster R. (2006). Adaptation of solitary intestinal lymphoid tissue in response to microbiota and chemokine receptor CCR7 signaling. J. Immunol 177, 6824–6832. [DOI] [PubMed] [Google Scholar]
- Pakkanen SH, Kantele JM, Moldoveanu Z, Hedges S, Hakkinen M, Mestecky J, and Kantele A. (2010). Expression of Homing Receptors on IgA1 and IgA2 Plasmablasts in Blood Reflects Differential Distribution of IgA1 and IgA2 in Various Body Fluids. Clin. Vaccine Immunol 17, 393–401. [DOI] [PMC free article] [PubMed] [Google Scholar]
- R Core Team (2018). R: A Language and Environment for Statistical Computing. Rickert RR, and Carter HW. (1980). The “early” ulcerative lesion of Crohn’s disease: correlative light- and scanning electron-microscopic studies. J. Clin. Gastroenterol 2, 11–19. [PubMed] [Google Scholar]
- Rubin SJS, Bai L, Haileselassie Y, Garay G, Yun C, Becker L, Streett SE, Sinha SR, and Habtezion A. (2019). Mass cytometry reveals systemic and local immune signatures that distinguish inflammatory bowel diseases. Nat. Commun 10, 2686. [DOI] [PMC free article] [PubMed] [Google Scholar]
- Sathaliyawala T, Kubota M, Yudanin N, Turner D, Camp P, Thome JJC, Bickham KL, Lerner H, Goldstein M, Sykes M, et al. (2013). Distribution and Compartmentalization of Human Circulating and Tissue-Resident Memory T Cell Subsets. Immunity 38, 187–197. [DOI] [PMC free article] [PubMed] [Google Scholar]
- Senda T, Dogra P, Granot T, Furuhashi K, Snyder ME, Carpenter DJ, Szabo PA, Thapa P, Miron M, and Farber DL (2019). Microanatomical dissection of human intestinal T-cell immunity reveals site-specific changes in gut-associated lymphoid tissues over life. Mucosal Immunol. 12, 378–389. [DOI] [PMC free article] [PubMed] [Google Scholar]
- Shikina T, Hiroi T, Iwatani K, Jang MH, Fukuyama S, Tamura M, Kubo T, Ishikawa H, and Kiyono H. (2004). IgA Class Switch Occurs in the Organized Nasopharynx- and Gut-Associated Lymphoid Tissue, but Not in the Diffuse Lamina Propria of Airways and Gut. J. Immunol 172, 6259–6264. [DOI] [PubMed] [Google Scholar]
- Spencer J, and Sollid LM (2016). The human intestinal B-cell response. Mucosal Immunol. 9, 1113–1124. [DOI] [PubMed] [Google Scholar]
- Spencer J, Klavinskis LS, and Fraser LD (2012). The human intestinal IgA response; burning questions. Front. Immunol 3, 108. [DOI] [PMC free article] [PubMed] [Google Scholar]
- Spencer J, Siu JHY, and Montorsi L. (2019). Human intestinal lymphoid tissue in time and space. Mucosal Immunol. 12, 296–298. [DOI] [PubMed] [Google Scholar]
- Svensson M, Marsal J, Ericsson A, Carramolino L, Brodén T, Márquez G, and Agace WW (2002). CCL25 mediates the localization of recently activated CD8αβ+ lymphocytes to the small-intestinal mucosa. J. Clin. Invest 110, 1113–1121. [DOI] [PMC free article] [PubMed] [Google Scholar]
- Tsuji M, Suzuki K, Kitamura H, Maruya M, Kinoshita K, Ivanov II, Itoh K, Littman DR, and Fagarasan S. (2008). Requirement for Lymphoid Tissue-Inducer Cells in Isolated Follicle Formation and T Cell-Independent Immunoglobulin A Generation in the Gut. Immunity 29, 261–271. [DOI] [PubMed] [Google Scholar]
- Wang C, McDonald KG, McDonough JS, and Newberry RD (2006). Murine isolated lymphoid follicles contain follicular B lymphocytes with a mucosal phenotype. Am. J. Physiol. Liver Physiol 291, G595–G604. [DOI] [PMC free article] [PubMed] [Google Scholar]
- Warnes GR, Bolker B, Bonebakker L, Gentleman R, Liaw WHA, Lumley T, Maechler M, Magnusson A, Moeller S, Schwartz M, et al. (2016). Package “gplots”: Various R programming tools for plotting data. R Packag. Version 2.17.0. Wickham H (2017). ggplot2: Elegant Graphics for Data Analysis. J. Stat. Softw [Google Scholar]
- Wu Y-C, Kipling D, Leong HS, Martin V, Ademokun AA, and Dunn-Walters DK (2010). High-throughput immunoglobulin repertoire analysis distinguishes between human IgM memory and switched memory B-cell populations. Blood 116, 1070–1078. [DOI] [PMC free article] [PubMed] [Google Scholar]
- Yaari G, Vander Heiden JA, Uduman M, Gadala-Maria D, Gupta N, Stern JNH, O’Connor KC, Hafler DA, Laserson U, Vigneault F, et al. (2013). Models of somatic hypermutation targeting and substitution based on synonymous mutations from high-throughput immunoglobulin sequencing data. Front. Immunol 4, 358. [DOI] [PMC free article] [PubMed] [Google Scholar]
- Zhao Y, Uduman M, Siu JHYY, Tull TJ, Sanderson JD, Wu Y-CB, Zhou JQ, Petrov N, Ellis R, Todd K, et al. (2018). Spatiotemporal segregation of human marginal zone and memory B cell populations in lymphoid tissue. Nat. Commun 9, 3857. [DOI] [PMC free article] [PubMed] [Google Scholar]
Associated Data
This section collects any data citations, data availability statements, or supplementary materials included in this article.
Supplementary Materials
Video S1 Peeling submucosa from LP reveals SM-ILF embedded in the submucosa, related to Figure 1
Video S2 Cutting SM-ILF from methylene blue-stained submucosa after peeling away from LP, related to Figure 1
Video S3 Cutting M-ILF out from LP after submucosa is peeled away, related to Figure 1
Data Availability Statement
The IgA and IgM sequencing data generated during this study is available at the European Nucleotide Archive, accession number PRJEB36054. This study did not generate code.