

Abstract
Background
With the rising rates of obesity and associated metabolic disorders, there is a growing need for effective long-term weight-loss strategies, coupled with an understanding of how they interface with human physiology. Interest is growing in the potential role of gut microbes as they pertain to responses to different weight-loss diets; however, the ways that diet, the gut microbiota, and long-term weight loss influence one another is not well understood.
Objectives
Our primary objective was to determine if baseline microbiota composition or diversity was associated with weight-loss success. A secondary objective was to track the longitudinal associations of changes to lower-carbohydrate or lower-fat diets and concomitant weight loss with the composition and diversity of the gut microbiota.
Methods
We used 16S ribosomal RNA gene amplicon sequencing to profile microbiota composition over a 12-mo period in 49 participants as part of a larger randomized dietary intervention study of participants consuming either a healthy low-carbohydrate or a healthy low-fat diet.
Results
While baseline microbiota composition was not predictive of weight loss, each diet resulted in substantial changes in the microbiota 3-mo after the start of the intervention; some of these changes were diet specific (14 taxonomic changes specific to the healthy low-carbohydrate diet, 12 taxonomic changes specific to the healthy low-fat diet) and others tracked with weight loss (7 taxonomic changes in both diets). After these initial shifts, the microbiota returned near its original baseline state for the remainder of the intervention, despite participants maintaining their diet and weight loss for the entire study.
Conclusions
These results suggest a resilience to perturbation of the microbiota's starting profile. When considering the established contribution of obesity-associated microbiotas to weight gain in animal models, microbiota resilience may need to be overcome for long-term alterations to human physiology. This trial was registered at clinicaltrials.gov as NCT01826591.
Keywords: microbiome, obesity, diet, low-fat, low-carbohydrate, weight loss
Introduction
Current rates of obesity are alarmingly high and continue to increase each year (1), a trend that was originally confined to more affluent societies but has now begun to spread to the developing world (2). Diseases associated with obesity include heart disease, diabetes, and respiratory conditions, all of which contribute to lower life expectancy and quality of life. Countries faced with these trends have not been able to reverse them, despite large-scale public health and medical efforts for weight management. In order to combat these rising health concerns, and to circumvent the need for medication, many turn to diet as a way to target weight loss. However, in the context of obesity, weight modulation through diet has been largely ineffective for long-term weight management for a variety of reasons (3–5).
Previous work has established a relation between obesity and the microbiome, including the causal role of obesity-associated microbiotas to confer weight gain when transplanted into lean mice (6–11) and weight-associated taxa in humans (12). The microbiota can impact energy extraction from dietary intake (7), fat storage in adipose tissue (13), and intestinal permeability (14), all of which can contribute to obesity and associated inflammation. In humans, obesity and long-term dietary patterns are associated with microbiome composition (15, 16), as well as predictive of weight regain (6). Due to the malleability and interindividual variance in the microbiota, as well as its impact on host physiology, diets based on an individual's microbiome may be a path forward in identifying more effective weight-loss strategies in humans.
The Diet Intervention Examining The Factors Interacting with Treatment Success (DIETFITS) clinical trial compared a healthy low-carbohydrate (low-carb) with a healthy low-fat approach to weight loss, in a year-long dietary intervention study (17). The original objective of the parent trial was to observe how host factors, such as a metabolism-related genotype and insulin resistance, affected the success of the 2 diets as measured by weight loss. It was shown that, while participants did lose a significant amount of weight over a period of 12-mo, neither diet was universally superior and specific aspects of host genotype or insulin resistance were unable to predict diet-specific weight-loss success.
Here we explore another individual-specific factor, the microbiome, in diet-specific weight loss from a subset of participants in the DIETFITS trial. In this exploratory analysis of the microbiome in the DIETFITS weight-loss diet study, our primary objective was to determine if baseline microbiota composition or diversity was associated with weight-loss success. Our secondary objective was to examine the relation more broadly between 12-mo changes in individual components of microbiome composition, diet, and weight.
Methods
Study design
The detailed methods for the main DIETFITS randomized trial were previously described (17, 18). Briefly, 609 generally healthy, nondiabetic participants [BMI (kg/m2): 28–40] were randomly assigned in equal proportions in a parallel-design weight-loss diet study to 1 of 2 diets: healthy low-carb or healthy low-fat. Enrollment for the first participant in the first cohort started in January 2013 and follow-up for the last participant in the last cohort was completed in May 2016. Randomization was performed using an allocation sequence determined by computerized random-number generation in block sizes of 8 (4/diet group). There were no exclusions for antibiotics. Medication exclusions included lipid-lowering, antihypertensive medications, and those known to affect weight/energy expenditure, and psychiatric medications. The CONSORT flow diagram has been published previously (17).
Intervention strategy—Limbo/Titrate/Quality, taught by health educators
The intervention strategy for changing dietary behaviors in accordance with treatment assignments involved 22 evening sessions of 15–20 participants per class taught by health educators over the 12-mo protocol. In the first 8 wk participants were instructed to work toward limiting either fat or carbohydrates (specific to diet group assignment) to 20 g/d (“Limbo” phase) and then try to maintain that for at least a few weeks. At that point, they were allowed to add small amounts of fat or carbohydrate back to their diet, specifically with the goal of seeking the lowest level they could achieve and felt realistically could be maintained as a lifelong eating pattern, should the diet enable weight loss (“Titrate” phase). The “lowest they could go” was determined individually between each participant and their assigned health educator, with the stated objective of identifying a level that could be maintained even after the study ended (i.e., in contrast to simply following a diet they would go off of once the study ended). Throughout the study both diet groups were told to maximize vegetable and whole-food intake and minimize or eliminate added sugars and refined grains; this was intended to help both groups focus on high “Quality” diets. Diet group–specific quality aspects included other recommendations such as steel-cut oats for the healthy low-fat group, and avocados for the healthy low-carb group.
Participants were encouraged to use paper and pen or any of the available app-based diet-tracking tools (e.g., MyFitnessPal), as needed, and to share the results and review them periodically with their health educator. Additional support came from fellow participants where strategies for success were shared either in the class setting, in group e-mails, or in some cases, Facebook groups that were set up for this purpose by the participants themselves.
Dietary assessment, study subsample, and database management
Dietary intake at each time point was assessed using 3 unannounced 24-h multiple-pass recall interviews (2 on weekdays and 1 on a weekend day). The 24-h recalls were administered by trained dietitians, over the phone, using Nutrition Database System for Research (NDS-R) software (17). Data collection intervals were at prerandomization baseline, 3-mo, 6-mo, and 12-mo. Weight was measured by digital scale at the Stanford Clinical Translational Research Unit.
Due to the large size of the study sample, participants were enrolled in 5 cohorts of ∼120 participants per cohort, with a new cohort starting approximately once every 6-mo. The analysis described here is taken from a subset of participants (n = 49) from whom stool samples were collected (Figure 1A, Supplemental Table 1), all of whom were volunteers from what is referred to as “cohort 3” (17). Analyses for this study were done using data generated by those volunteers who provided ≥3 of the 5 possible stool samples; of the 49 participants, 27 submitted samples and complete sequencing data from all 5 time points, 21 were complete for 4 out of 5 time points, and 1 was complete for 3 out of 5 time points. Baseline demographics and dietary changes across 12-mo were comparable between the subset of the microbiome analyses and the larger parent study population (Supplemental Tables 2 and 3).
FIGURE 1.
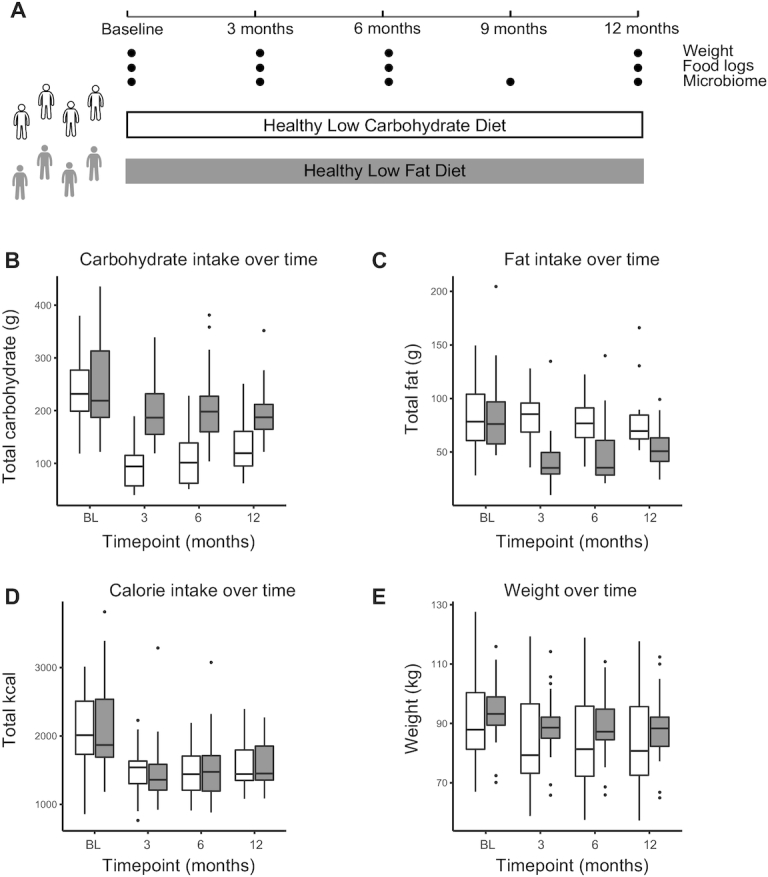
One year of a low-carbohydrate or low-fat diet results in specific dietary alterations and weight loss. Twelve-month study design for 2 diet groups: healthy low-carbohydrate (white) and healthy low-fat (gray). A: Weight, food-intake assessment, and stool for microbiome analysis were collected at the indicated sampling times. B–E: Levels of carbohydrate intake (B; grams), fat intake (C; grams), calorie intake (D; kilocalories), and weight (E; kilograms) over time for participants, separated by diet group. White: low-carbohydrate; gray: low-fat. Significant differences were assessed using a Wilcoxon paired test, adjusted P value <0.05 (Benjamini-Hochberg). Low-fat: n = 24; low-carbohydrate: n = 25. Significant differences in panel B: low-fat BL vs. 3-mo, BL vs. 6-mo, BL vs. 12-mo; low-carbohydrate BL vs. 3-mo, BL vs. 6-mo, BL vs. 12-mo, 3-mo vs. 12-mo; in panel C: low-fat BL vs. 3-mo, BL vs. 6-mo, BL vs. 12-mo, 3-mo vs. 12-mo; in panel D: low-fat BL vs. 3-mo, BL vs. 6-mo, BL vs. 12-mo, 3-mo vs. 12-mo; low-carbohydrate BL vs. 3-mo, BL vs. 6-mo, BL vs. 12-mo; in panel E: low-fat BL vs. 3-mo, BL vs. 6-mo, BL vs. 12-mo; low-carbohydrate BL vs. 3-mo, BL vs. 6-mo, BL vs. 12-mo, 3-mo vs. 12-mo, 6-mo vs. 12-mo. P values are listed in Supplemental Table 4. BL, baseline.
Study data were collected and managed using Research Electronic Data Capture (REDCap) electronic data capture tools hosted at Stanford University (Research IT grant support Stanford CTSA award number UL1 TR001085 from NIH/National Center for Research Resources). REDCap is a secure, Web-based application designed to support data capture for research studies (19). The procedures followed were in accordance with the ethical standards of the institution or regional committee on human experimentation and that approval was obtained from the relevant committee on human subjects.
Stool collection and 16S ribosomal RNA gene amplicon sequencing
Stool samples were collected at 5 time points over the course of the study for this cohort: prerandomization baseline, 3-mo, 6-mo, 9-mo, and 12-mo. Participants were provided with stool collection kits. All stool samples were kept in participants’ home freezers (−20˚C) wrapped in ice packs, until they were transferred on ice to the research laboratory and stored at −80˚C. There were no intentional freeze–thaw cycles and all samples were sequenced together. DNA was extracted using the MoBio PowerSoil kit according to the Earth Microbiome Project's protocol (20) and amplified at the V4 region of the 16S ribosomal RNA (rRNA) subunit gene and 250 nucleotides (nt) paired-end Illumina sequencing reads were generated. Forward reads were trimmed at 250 bp and reverse reads were trimmed at 175 bp. An average of 16,121 reads were used as input, with an average of 9374 reads recovered after filtering, denoising, merging forward and reverse reads, and removing chimeras.
Statistical analysis
16S rRNA gene amplicon sequencing data were demultiplexed using the QIIME pipeline version 1.8. Amplicon sequence variants (ASVs) were identified with a learned sequencing error correction model (DADA2 method) (21), using the dada2 package in R. ASVs were assigned taxonomy using the GreenGenes database (version 13.8). Data were rarefied to 5882 reads per sample using the phyloseq package in R (version 3.4.0). Subsequent analyses including diversity analysis were performed using the phyloseq package in R. ɑ Diversity was quantified as the number of observed ASVs in a rarefied sample. Taxonomic abundance was calculated by taking the number of reads of each taxon (phylum, class, order, family, genus levels) and dividing them by the total number of reads per sample.
Statistical comparisons for bacterial abundances were performed using the significance analysis of microarrays (SAM) algorithm (22) using the siggenes package in R. While initially developed for microarrays, SAM is generalizable to other high-dimensional biological data (23). SAM assigns a score to each tested feature based on the change in the feature relative to the SD of repeated measurements, then determines a false discovery rate (FDR) by permutation testing. Significance was determined as q value < 0.05 (q value is the P value analog for FDR). Changes were assessed using paired participant data, using each participant's own baseline as a reference sample. Due to missing data (either where a stool sample was not collected or sequencing did not yield enough reads), we randomly selected the same number of participants from each diet (sample function without replacement in the R base package) based on the diet group with the fewest samples when comparing a given time point to ensure statistical comparability between diet groups (3-mo: n = 22; 6-mo: n = 18; 9-mo: n = 23; 12-mo: n = 21).
An elastic net (EN) algorithm was applied to determine if the participant-specific genera abundance at baseline could predict total weight loss at the end of the dietary study. In this microbiome data set, taxonomic abundance is highly correlated by nature and the EN was used to eliminate redundant parameters, while maintaining interrelated parameters. The sparse regression, cross-validated model split into 75% of the participants as the training set and the remaining 25% as the test set. The model was run 3 times: 1) predict weight loss of all participants from baseline genera abundance, 2) predict weight loss of only the healthy low-fat diet participants, and 3) predict weight loss of only the healthy low-carb diet participants.
Relations between bacterial abundances and weight were assessed using a linear mixed-effects model using the nlme package in R; we included a participant term in the model to address autocorrelation of multiple samples from the same participant over time. P values were adjusted for multiple hypothesis testing using a Benjamini-Hochberg correction.
Results
Changes in diet and weight
Participants following the low-carb diet significantly decreased their carbohydrate consumption compared with baseline at every time point (Figure 1B, Supplemental Table 4). The low-fat-diet participants also modestly but significantly decreased carbohydrate consumption at all time points relative to baseline (adjusted P < 0.05). Similarly, participants in the low-fat diet significantly decreased their fat intake compared with baseline at every time point (Figure 1C, Supplemental Table 4). There was no significant change in fat intake in the low-carb diet group. Furthermore, there was no significant change in protein intake for either diet group at any time (Supplemental Figure 1, Supplemental Table 4). Participants in both diets reported lowering their calorie intake by ∼30%, and maintaining those calorie levels for the duration of the study (Figure 1D, Supplemental Table 4).
On average, both groups successfully decreased in weight over the course of 12-mo ( Figure 1E, Supplemental Table 4). There was no significant difference in mean weight loss between the 2 groups, with large interparticipant variance (mean ± SD change: −5.1 ± 6.7 kg for the low-carb diet and −5.6 ± 5.7 kg for the low-fat diet over 12-mo; Supplemental Figure 2). In general, weight loss was maintained over the course of the study, with a small amount of weight regain observed in the low-carb group (adjusted P < 0.05 between 6-mo and 12-mo; Supplemental Figure 2). Interestingly, there was no significant relation found between weight loss and degree of calorie restriction ( Supplemental Figure 3).
Baseline microbiome composition does not predict weight loss
In order to determine whether baseline microbiota composition was an indicator of general or diet-specific weight loss, we identified microbial taxa by 16S rRNA gene amplicon sequencing from participant stool samples. We could not build a significant cross-validated model to predict weight loss from baseline microbiome composition, as described by either taxonomic summaries or by ASVs (EN model and random forest). Similarly, diet-specific weight loss could not be predicted from composition at baseline (Supplemental Figure 4). In addition, no significant model could be built from composition at 3-mo, indicating that early changes to the microbiota were not predictive of total weight loss. When participants were divided into 2 groups based on vsupper and lower quartiles of weight loss in each cohort, these binned groups could not be identified based on differences in baseline composition or ɑ diversity. Taken together, neither baseline nor early microbiota composition was an indicator of total weight loss.
Microbial composition exhibits resilience after initial shift
We also examined the effects of dietary intervention and weight loss on the microbiome. To determine how microbial composition changed over the length of the dietary intervention, we assessed the abundance of the observed taxa at the phylum, class, order, family, and genus level for each participant over time. Interestingly, for each diet, we observed changes at 3-mo relative to baseline; however, these changes were not sustained throughout the remainder of the study, with the exception of 1 taxonomic change at 6-mo [6-mo, 9-mo, 12-mo, SAM 2-class paired (22); Supplemental Table 5; specific changes are discussed later in the article]. The same trend was seen when testing individual ASVs despite participants maintaining their diet and lower weight throughout the course of the study (Supplemental Table 6).
To determine how the microbiota as a whole shifted at different times in the study, Bray-Curtis dissimilarity was used to show the amount of shared “species” (ASVs) between samples. The first principal component of BC-distance was plotted per participant and showed a distinct shift at 3-mo compared with the remaining time points (Figure 2). This shift was observed in both diets, but most clearly in the low-carb group, with the 3-mo sample being the left-most point for nearly every participant, and with a significantly larger distance between baseline and 3-mo as compared with baseline and 6-mo (Supplemental Figure 5). The return of microbiota composition toward baseline status at 6- and 12-mo occurred despite participants continuing their assigned diet and maintaining weight loss beyond the 3-mo period.
FIGURE 2.
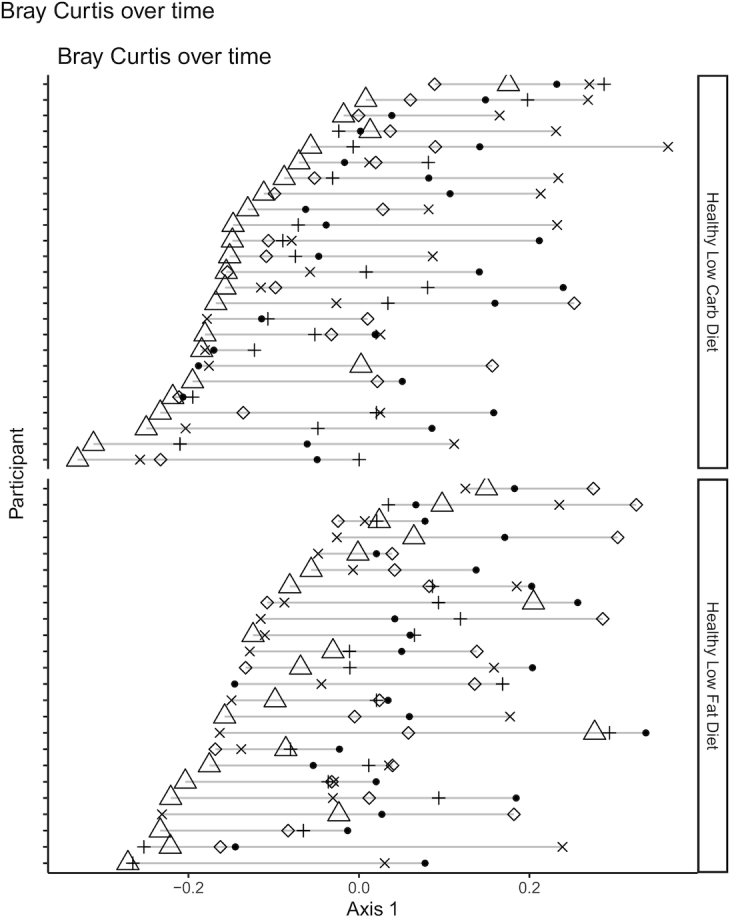
Evidence that gut microbiota composition is perturbed by diet but exhibits resilience over time. Bray-Curtis distance between all samples was calculated, and principal coordinate analysis was used to find new axes that captured the most variance across sample distance. Values for principal coordinate 1 (PC1) of Bray-Curtis distance was plotted, grouped by participant and by diet. Filled black circles, baseline sample; open triangles, 3-mo sample; +, 6-mo sample; x, 9-mo sample; open diamond, 12-mo sample. Low-fat: n = 24; low-carbohydrate: n = 25. Carb, carbohydrate.
Each diet results in distinct changes to the microbiota during the first 3-mo
To better understand the microbiota compositional shift that occurred at 3-mo, we identified specific taxa that changed in relative abundance in each diet group. Each diet had a unique set of taxa that significantly changed across the cohort in the first 3-mo. Importantly, no differences in taxa were found between the 2 diet groups at baseline. In the low-carb diet, changes were found in taxa from the Proteobacteria, Bacteroidetes, and Firmicutes phyla (Figure 3A). In the low-fat diet, changes were found in the taxa from the Actinobacteria and the Firmicutes phyla (Figure 3B). Several of these changes in each diet group occurred at several taxonomic levels, or in closely related genera such as Bilophila and Desulfovibrio in the low-carb diet group (both in the Desulfovibrionaceae family), or Dorea and Blautia (both in the Lachnospiraceae family) in the low-fat diet group. Interestingly, all changes specific to the low-carb diet were increases in relative abundance, whereas all low-fat–specific changes were decreases in relative abundance; there were no uniform decreases or increases, respectively, indicating that the compensatory changes in abundance varied by participant. There were no observed changes in ɑ diversity (i.e., within individual) in either diet, at any time point (Supplemental Figure 6).
FIGURE 3.

Each diet results in distinct changes in the gut microbiota composition after 3-mo. Diet-specific compositional changes at 3-mo on low-carbohydrate (A) or low-fat (B) diets. Fractional abundances of taxa that significantly changed between the baseline sample and 3-mo sample exclusively in either diet group are shown. Significance calculated as adjusted q value <0.05 (SAM 2-class paired). Plots colored by phylum—in panel A: white, Proteobacteria; light gray, Bacteroidetes; dark gray, Firmicutes; in panel B: light gray, Actinobacteria; dark gray, Firmicutes. Gray boxes denote shared lineage. Significant changes found in both groups are shown in Figure 4A. “x_” indicates phylogenetic level where x = p, phylum; c, class; o, order; f, family; g, genus. Number of samples used was based on the lowest number of samples available in low-fat or low-carbohydrate per time point: BL vs. 3-mo: n = 22/diet; BL vs. 6-mo: n = 18/diet; BL vs. 9-mo: n = 23/diet; BL vs. 12-mo: n = 21/diet. BL, baseline; SAM, significance analysis of microarrays.
Finally, the difference in taxonomic abundance was calculated for all dietary intervention time points to the baseline time point for each participant, and an unpaired analysis was used to compare the healthy low-carb with healthy low-fat diets using the value for difference. Despite the many significant within-group differences noted above, no between-diet group differences were detected; this should be interpreted cautiously because of the extensive variability among participants, and therefore the limited statistical power to detect between-diet group differences in the relatively small subset of participant from the main weight-loss trial available for this exploratory study.
Microbial compositional changes in response to both diets correlate with weight
In addition to the diet-specific changes observed at 3-mo, several taxa changed in relative abundance in both diets, all of which were in the Bacteroidetes phylum (Figure 4A). We hypothesized that, because these changes were shared by both diets, they could be due to a physiological shift in the host (i.e., weight loss, calorie intake) rather than a direct consequence of a differential dietary makeup. We modeled the relation between weight and each taxonomic abundance separately for the entire study duration (confined to taxa whose abundance is >1% in ≥5% of the samples), using linear mixed-effects models to account for participant autocorrelation, and assessed significance after correcting for multiple-hypothesis testing (see Methods). Five of the 7 taxa identified as shared changes at 3-mo were significantly negatively associated with weight (Figure 4B). In addition, the genera Lachnospira and Oscillospira were negatively associated with weight, whereas Faecalibacterium, Clostridiales, and Clostridium were positively associated with weight. Additionally, analysis was completed using calories rather than weight and no taxa were significantly associated with calorie intake using this analysis.
FIGURE 4.

Changes observed in both diets correlate with weight. A: Compositional changes at 3-mo shared between the low-carbohydrate diet and low-fat diet. Abundances of taxa that significantly changed between the baseline sample and 3-mo sample on both diets are shown (all participants plotted). Significance calculated as adjusted q value <0.05 (SAM 2-class paired). White, healthy low-carbohydrate; gray, healthy low-fat. All taxa shown share the same phylogeny (Bacteroidetes phylum). Diet-specific changes are shown in Figure 3. “x_” indicates phylogenetic level where x = p, phylum; c, class; o, order; f, family; g, genus. Number of samples used was based on the lowest number of samples available in low-fat or low-carbohydrate per time point: BL vs. 3-mo: n = 22/diet; BL vs. 6-mo: n = 18/diet; BL vs. 9-mo: n = 23/diet; BL vs. 12-mo: n = 21/diet. B: Modeling results of taxonomic abundance and weight. Linear mixed-effects models were optimized per taxa, with taxa significantly associated with weight listed in the table (adjusted P value <0.05, Benjamini-Hochberg). Taxa were tested whose abundance was >1% in ≥5% of the samples. *Denotes taxa that were identified in Figure 4A. Low-fat: n = 24, low-carbohydrate: n = 25. BL, baseline; SAM, significance analysis of microarrays.
Discussion
In this work, we examine the dynamics of the microbiome in the context of weight loss and dietary change. Investigation of the microbiome is of emerging interest considering the rising rates of obesity and general failure of current diet-based strategies for long-term weight loss. The original parent study did not find an association with either insulin resistance or genotype pattern and weight loss, which led to an interest in exploring whether other factors, such as the microbiome, predisposed certain individuals to lose more weight on specific diets. We did not find an association between baseline microbiome composition and weight loss on either diet. This finding suggests that, in our cohort, microbiome composition does not help predict the degree of weight loss on either a low-carb or low-fat diet. This conclusion contrasts with recent work that found personalized glycemic responses to specific diets, predicted in part by microbiome composition (24), as well as studies that predict diet-specific weight loss from Bacteroides to Prevotella ratio (25, 26). Study size and diet type are important factors in the sensitivity of these analyses, so it is possible that future studies will reveal additional microbiome predictors of weight loss.
While we did not find an association between baseline microbiome composition and weight loss, we did observe high variance in weight loss among individuals in the study, suggesting that there are likely host factors that predispose individuals to weight loss that have yet to be elucidated. We did not find a statistically significant relation between the degree of calorie restriction and the amount of weight loss, which could suggest that more nuanced diets rather than nonspecific calorie restriction may be important for successful, sustained weight reduction. Alternatively, a true relation may exist between calorie restriction and weight loss that was masked by inaccuracies in self-reported diet data, which are well established (27). This observation presents an opportunity for personalized diets that better suit an individual's starting state, although substantial investigation is required to study both relevant host factors and aspects of diet that can be used as levers to impact host physiology.
While we did not find microbiome signatures predictive of weight loss, we did observe substantial but transient changes to the microbiome during the first 3-mo of the intervention. We found that there were 2 forces affecting the microbiome: the change in diet (i.e., specific changes in macronutrient availability) and the host physiological changes associated with weight loss. While it is difficult to disentangle these effects, mouse models have shown obesity-independent effects of a high-fat diet on the microbiome, demonstrating that host physiology and diet can exert separate and independent effects on the microbiota. We identified changes from baseline to 3-mo in bacterial taxa that included a subset that were shared between the 2 diet groups and a subset that were exclusive to 1 diet group. On the low-carb diet, participants had increases in the relative abundance of taxa in the Proteobacteria, Bacteroidetes, and Firmicutes phyla after 3-mo. In contrast, participants following the low-fat diet exhibited decreases in Actinobacteria and Firmicutes after 3-mo. This result is consistent with previous work that observed an obesity-independent increase in Firmicutes in mice fed a high-fat diet (28), as well as higher levels of Firmicutes found in humans consuming a high-fat diet (15).
Among the changes that were shared between the 2 diets was an increase in Bacteroidetes relative abundance. Lower Bacteroidetes abundance has been observed in obese relative to lean mice and humans (7, 8). In addition, a small cohort (n = 12) of individuals following either a carbohydrate- or fat-restricted diet exhibited an increase in Bacteroidetes abundance that correlated with weight loss (8). Our hypothesis that these shared changes in both diets are due to weight loss rather than specific dietary changes was supported by our finding that these taxa correlated with weight throughout the study. Oscillospira and Lachnospira abundances were negatively associated with weight, consistent with a reported association of Oscillospira with leanness (12) and lower levels of Lachnospira in obesity (29). In contrast, Firmicutes and members of its lineage were positively associated with weight, which is consistent with the Firmicutes to Bacteroidetes ratio being higher in obese individuals (8).
The changes in the microbiota described here were confined to the first 3-mo of the intervention: these taxa were statistically indistinguishable between baseline and 1 y. This was despite participants largely maintaining their weight loss and maintaining statistically and clinically meaningful dietary changes relative to baseline (17). These data suggest a resilience of the microbiota to dietary and host physiological change after an initial change, perhaps due to host physiological factors that exert a homeostatic corrective force on the microbial community to return to a long-established state. Interestingly, previous work identified a microbiome-based “memory” of obesity (6), which may explain the phenomenon of individuals regaining lost weight despite maintaining a previously effective diet (2–5). The resilience we observed may be an instance of the same phenomenon, and further work is needed to explore strategies to overcome microbial resilience in this context. Notably, there was some recidivism in intake of micronutrients (either fat or carbohydrates) at 1 y, which could explain some of the resilience of the microbiome; however, this return of microbiome state was observed as early as 6-mo, when participants continued to maintain low levels of macronutrients.
This study has several limitations. The microbiome profiles presented here represent 16S rRNA gene amplicon data; however, the addition of functional features of the microbiome (i.e., metagenomics, SCFA, metabolites, etc.) would allow for deeper mechanistic insight. This study also did not include a control group, either with no diet change or a weight-maintaining diet, which would have given useful insight into how the microbiome naturally changes over time and how these changes compare with diet-induced changes. Our sampling of the microbiota was confined to 3-mo intervals, which restricts our understanding of the full dynamics of microbiome composition. While we see changes that occur at 3-mo post–diet intervention that are no longer present at 6-mo, it is not possible to determine when those changes first began nor when they start to disappear, as well as whether there were further oscillations not captured. Additionally, because this was a secondary analysis and therefore the study was not designed with this aim, the lack of predictive power of baseline microbiome signatures to predict weight loss could have been from insufficient statistical power, which can be tested in future studies with larger participant populations. In addition, these diets were not specifically designed to target the microbiota but rather were selected based on their prevalence as diets for weight loss. Future studies using diets that have been shown to modulate the microbiota, such as those high in dietary fiber (30, 31), may shed further light on the interaction between diet, the microbiome, and weight loss. Finally, while we assess weight as our main outcome, we do not profile other elements of host health such as inflammation and immune status, which are likely affected by diet and the microbiome (32).
In light of the rising rates of obesity and the accompanying morbidities, along with our current failures thus far in reversing such trends, there is a moral imperative to identify long-term effective solutions for weight loss. The recalcitrant nature of diet effectiveness leaves many individuals at a loss for solutions, and to bear not only the burden of their health concerns but also a misplaced sense of failure in personal responsibility that often is perpetuated by the medical community (33). This limited long-term efficacy points to gaps in our understanding of the interplay between specific diets and host factors, such as inflammatory and metabolic state, and the microbiome. This work identifies distinct but transient effects of diet and host physiological state on the gut microbiota in humans. Future work is needed to understand mechanisms of microbiota resilience, including microbial functionality and interaction with host factors such as inflammation. Weight-loss trial designs that incorporate microbiota monitoring and implement microbiota-targeting diets are a logical step toward addressing the individual and global health burden of the obesity epidemic.
Supplementary Material
Acknowledgments
We thank to Erin Avery and Audrey Southwick for sample collection and data generation.
The authors’ responsibilities were as follows—GKF and HCW: performed the data analysis and wrote the manuscript; JLR: generated data and edited the manuscript; EDS: advised analysis and edited the manuscript; CDG and JLS: designed the study, advised analysis, edited the manuscript, and have primary responsibility for the final content; and all authors: read and approved the final manuscript. The authors report no conflicts of interest.
Notes
GKF was supported by NIH T32 AI 7328-29 and the Stanford Dean's Postdoctoral Fellowship. HCW was supported by the National Science Foundation Graduate Student Fellowship. This work was funded by grants from the NIH National Institute of Diabetes and Digestive and Kidney Diseases (R01-DK091831 to CDG) and generous donations to the Center for Human Microbiome Research, and from the Nutrition Science Initiative (NuSI). This work was also supported by a NIH National Center for Advancing Translational Science Clinical and Translational Science Award (UL1TR001085) and a Sean N. Parker Center Seed Grant Award. JLS is a Chan Zuckerberg Biohub Investigator. The content is solely the responsibility of the authors and does not necessarily represent the official views of the NIH.
GKF and HCW contributed equally to this work.
Supplemental Tables 1–6 and Supplemental Figures 1–6 are available from the “Supplementary data” link in the online posting of the article and from the same link in the online table of contents at https://academic.oup.com/ajcn/.
The data will be made publicly and freely available without restriction.
Abbreviations used: ASV, amplicon sequence variant; DIETFITS, Diet Intervention Examining The Factors Interacting with Treatment Success; EN, elastic net; low-carb, low-carbohydrate; FDR, false discovery rate; REDCap, Research Electronic Data Capture; rRNA, ribosomal RNA; SAM, Significance analysis of microarrays.
References
- 1. Ng M, Fleming T, Robinson M, Thomson B, Graetz N, Margono C, Mullany EC, Biryukov S, Abbafati C, Abera SF et al.. Global, regional, and national prevalence of overweight and obesity in children and adults during 1980–2013: a systematic analysis for the Global Burden of Disease Study 2013. Lancet. 2014;384:766–81. [DOI] [PMC free article] [PubMed] [Google Scholar]
- 2. Seidell JC, Halberstadt J. The global burden of obesity and the challenges of prevention. Ann Nutr Metab. 2015;66(Suppl 2):7–12. [DOI] [PubMed] [Google Scholar]
- 3. Anastasiou CA, Karfopoulou E, Yannakoulia M. Weight regaining: from statistics and behaviors to physiology and metabolism. Metabolism. 2015;64:1395–407. [DOI] [PubMed] [Google Scholar]
- 4. Dulloo AG, Montani JP. Pathways from dieting to weight regain, to obesity and to the metabolic syndrome: an overview. Obes Rev. 2015;16(Suppl 1):1–6. [DOI] [PubMed] [Google Scholar]
- 5. Fothergill E, Guo J, Howard L, Kerns JC, Knuth ND, Brychta R, Chen KY, Skarulis MC, Walter M, Walter PJ et al.. Persistent metabolic adaptation 6 years after “The Biggest Loser” competition. Obesity (Silver Spring). 2016;24:1612–9. [DOI] [PMC free article] [PubMed] [Google Scholar]
- 6. Thaiss CA, Itav S, Rothschild D, Meijer M, Levy M, Moresi C, Dohnalova L, Braverman S, Rozin S, Malitsky S et al.. Persistent microbiome alterations modulate the rate of post-dieting weight regain. Nature. 2016;540(7634):544–51. [DOI] [PubMed] [Google Scholar]
- 7. Turnbaugh PJ, Ley RE, Mahowald MA, Magrini V, Mardis ER, Gordon JI. An obesity-associated gut microbiome with increased capacity for energy harvest. Nature. 2006;444:1027–31. [DOI] [PubMed] [Google Scholar]
- 8. Ley RE, Turnbaugh PJ, Klein S, Gordon JI. Microbial ecology: human gut microbes associated with obesity. Nature. 2006;444:1022–3. [DOI] [PubMed] [Google Scholar]
- 9. Turnbaugh PJ, Hamady M, Yatsunenko T, Cantarel BL, Duncan A, Ley RE, Sogin ML, Jones WJ, Roe BA, Affourtit JP et al.. A core gut microbiome in obese and lean twins. Nature. 2009;457:480–4. [DOI] [PMC free article] [PubMed] [Google Scholar]
- 10. Ley RE. Obesity and the human microbiome. Curr Opin Gastroenterol. 2010;26:5–11. [DOI] [PubMed] [Google Scholar]
- 11. Backhed F, Manchester JK, Semenkovich CF, Gordon JI. Mechanisms underlying the resistance to diet-induced obesity in germ-free mice. Proc Natl Acad Sci. 2007;104:979–84. [DOI] [PMC free article] [PubMed] [Google Scholar]
- 12. Tims S, Derom C, Jonkers DM, Vlietinck R, Saris WH, Kleerebezem M, de Vos WM, Zoetendal EG. Microbiota conservation and BMI signatures in adult monozygotic twins. ISME J. 2013;7:707–17. [DOI] [PMC free article] [PubMed] [Google Scholar]
- 13. Backhed F, Ding H, Wang T, Hooper LV, Koh GY, Nagy A, Semenkovich CF, Gordon JI. The gut microbiota as an environmental factor that regulates fat storage. Proc Natl Acad Sci. 2004;101:15718–23. [DOI] [PMC free article] [PubMed] [Google Scholar]
- 14. Cani PD, Possemiers S, Van de Wiele T, Guiot Y, Everard A, Rottier O, Geurts L, Naslain D, Neyrinck A, Lambert DM et al.. Changes in gut microbiota control inflammation in obese mice through a mechanism involving GLP-2-driven improvement of gut permeability. Gut. 2009;58:1091–103. [DOI] [PMC free article] [PubMed] [Google Scholar]
- 15. Wu GD, Chen J, Hoffmann C, Bittinger K, Chen YY, Keilbaugh SA, Bewtra M, Knights D, Walters WA, Knight R et al.. Linking long-term dietary patterns with gut microbial enterotypes. Science. 2011;334:105–8. [DOI] [PMC free article] [PubMed] [Google Scholar]
- 16. Losasso C, Eckert EM, Mastrorilli E, Villiger J, Mancin M, Patuzzi I, Di Cesare A, Cibin V, Barrucci F, Pernthaler J et al.. Assessing the influence of vegan, vegetarian and omnivore oriented westernized dietary styles on human gut microbiota: a cross sectional study. Front Microbiol. 2018;9:317. [DOI] [PMC free article] [PubMed] [Google Scholar]
- 17. Gardner CD, Trepanowski JF, Del Gobbo LC, Hauser ME, Rigdon J, Ioannidis JPA, Desai M, King AC. Effect of low-fat vs low-carbohydrate diet on 12-month weight loss in overweight adults and the association with genotype pattern or insulin secretion: the DIETFITS randomized clinical trial. JAMA. 2018;319:667–79. [DOI] [PMC free article] [PubMed] [Google Scholar]
- 18. Stanton MV, Robinson JL, Kirkpatrick SM, Farzinkhou S, Avery EC, Rigdon J, Offringa LC, Trepanowski JF, Hauser ME, Hartle JC et al.. DIETFITS study (Diet Intervention Examining The Factors Interacting With Treatment Success)—study design and methods. Contemp Clin Trials. 2017;53:151–61. [DOI] [PMC free article] [PubMed] [Google Scholar]
- 19. Harris PA, Taylor R, Thielke R, Payne J, Gonzalez N, Conde JG. Research electronic data capture (REDCap)—a metadata-driven methodology and workflow process for providing translational research informatics support. J Biomed Inform. 2009;42:377–81. [DOI] [PMC free article] [PubMed] [Google Scholar]
- 20. Gilbert JA, Jansson JK, Knight R. The Earth Microbiome project: successes and aspirations. BMC Biol. 2014;12:69. [DOI] [PMC free article] [PubMed] [Google Scholar]
- 21. Callahan BJ, McMurdie PJ, Rosen MJ, Han AW, Johnson AJ, Holmes SP. DADA2: High-resolution sample inference from Illumina amplicon data. Nat Methods. 2016;13:581–3. [DOI] [PMC free article] [PubMed] [Google Scholar]
- 22. Tusher VG, Tibshirani R, Chu G. Significance analysis of microarrays applied to the ionizing radiation response. Proc Natl Acad Sci. 2001;98:5116–21. [DOI] [PMC free article] [PubMed] [Google Scholar]
- 23. Bruggner RV, Bodenmiller B, Dill DL, Tibshirani RJ, Nolan GP. Automated identification of stratifying signatures in cellular subpopulations. Proc Natl Acad Sci USA. 2014;111:E2770–7. [DOI] [PMC free article] [PubMed] [Google Scholar]
- 24. Zeevi D, Korem T, Zmora N, Israeli D, Rothschild D, Weinberger A, Ben-Yacov O, Lador D, Avnit-Sagi T, Lotan-Pompan M et al.. Personalized nutrition by prediction of glycemic responses. Cell. 2015;163:1079–94. [DOI] [PubMed] [Google Scholar]
- 25. Hjorth MF, Christensen L, Kjølbæk L, Larsen LH, Roager HM, Kiilerich P, Kristiansen K, Astrup A. Pretreatment Prevotella-to-Bacteroides ratio and markers of glucose metabolism as prognostic markers for dietary weight loss maintenance. Eur J Clin Nutr. 2019;74:338–47. [DOI] [PubMed] [Google Scholar]
- 26. Christensen L, Roager HM, Astrup A, Hjorth MF. Microbial enterotypes in personalized nutrition and obesity management. Am J Clin Nutr. 2018;108:645–51. [DOI] [PubMed] [Google Scholar]
- 27. Forster JL, Jeffery RW, VanNatta M, Pirie P. Hypertension prevention trial: do 24-h food records capture usual eating behavior in a dietary change study?. Am J Clin Nutr. 1990;51:253–7. [DOI] [PubMed] [Google Scholar]
- 28. Hildebrandt MA, Hoffmann C, Sherrill-Mix SA, Keilbaugh SA, Hamady M, Chen YY, Knight R, Ahima RS, Bushman F, Wu GD. High-fat diet determines the composition of the murine gut microbiome independently of obesity. Gastroenterology. 2009;137:1716–24., e1711–2. [DOI] [PMC free article] [PubMed] [Google Scholar]
- 29. Zhang H, DiBaise JK, Zuccolo A, Kudrna D, Braidotti M, Yu Y, Parameswaran P, Crowell MD, Wing R, Rittmann BE et al.. Human gut microbiota in obesity and after gastric bypass. Proc Natl Acad Sci. 2009;106:2365–70. [DOI] [PMC free article] [PubMed] [Google Scholar]
- 30. Sonnenburg ED, Zheng H, Joglekar P, Higginbottom SK, Firbank SJ, Bolam DN, Sonnenburg JL. Specificity of polysaccharide use in intestinal bacteroides species determines diet-induced microbiota alterations. Cell. 2010;141:1241–52. [DOI] [PMC free article] [PubMed] [Google Scholar]
- 31. Zhao L, Zhang F, Ding X, Wu G, Lam YY, Wang X, Fu H, Xue X, Lu C, Ma J et al.. Gut bacteria selectively promoted by dietary fibers alleviate type 2 diabetes. Science. 2018;359:1151–6. [DOI] [PubMed] [Google Scholar]
- 32. Arpaia N, Campbell C, Fan X, Dikiy S, van der Veeken J, deRoos P, Liu H, Cross JR, Pfeffer K, Coffer PJ et al.. Metabolites produced by commensal bacteria promote peripheral regulatory T-cell generation. Nature. 2013;504:451–5. [DOI] [PMC free article] [PubMed] [Google Scholar]
- 33. Fang V, Gillespie C, Crowe R, Popeo D, Jay M. Associations between medical students’ beliefs about obesity and clinical counseling proficiency. BMC Obes. 2019;6:5. [DOI] [PMC free article] [PubMed] [Google Scholar]
Associated Data
This section collects any data citations, data availability statements, or supplementary materials included in this article.