

Abstract
Chloroquine has been used for the treatment of malaria for > 70 years; however, chloroquine pharmacokinetic (PK) and pharmacodynamic (PD) profile in Plasmodium vivax malaria is poorly understood. The objective of this study was to describe the PK/PD relationship of chloroquine and its major metabolite, desethylchloroquine, in a P. vivax volunteer infection study. We analyzed data from 24 healthy subjects who were inoculated with blood‐stage P. vivax malaria and administered a standard treatment course of chloroquine. The PK of chloroquine and desethylchloroquine was described by a two‐compartment model with first‐order absorption and elimination. The relationship between plasma and whole blood concentrations of chloroquine and P. vivax parasitemia was characterized by a PK/PD delayed response model, where the equilibration half‐lives were 32.7 hours (95% confidence interval (CI) 27.4–40.5) for plasma data and 24.1 hours (95% CI 19.0–32.7) for whole blood data. The estimated parasite multiplication rate was 17 folds per 48 hours (95% CI 14–20) and maximum parasite killing rate by chloroquine was 0.213 hour−1 (95% CI 0.196–0.230), translating to a parasite clearance half‐life of 4.5 hours (95% CI 4.1–5.0) and a parasite reduction ratio of 400 every 48 hours (95% CI 320–500). This is the first study that characterized the PK/PD relationship between chloroquine plasma and whole blood concentrations and P. vivax clearance using a semimechanistic population PK/PD modeling. This PK/PD model can be used to optimize dosing scenarios and to identify optimal dosing regimens for chloroquine where resistance to chloroquine is increasing.
Study Highlights.
WHAT IS THE CURRENT KNOWLEDGE ON THE TOPIC?
☑ Chloroquine has been extensively used for > 70 years; however, the relationship between chloroquine pharmacokinetic (PK) and parasite killing has not been quantified using semimechanistic population PK/pharmacodynamic (PD) modeling.
WHAT QUESTION DID THIS STUDY ADDRESS?
☑ This study investigated the PK/PD relationship between chloroquine plasma and whole blood concentrations and P. vivax killing effect in a volunteer infection study using an induced blood‐stage malaria model.
WHAT DOES THIS STUDY ADD TO OUR KNOWLEDGE?
☑ This is the first study characterizing the PK/PD relationship of chloroquine plasma and whole blood concentrations on clearance of P. vivax parasites. This study demonstrates the importance of biological matrices in chloroquine PK monitoring and found a delayed effect of chloroquine on killing of P. vivax parasites.
HOW MIGHT THIS CHANGE CLINICAL PHARMACOLOGY OR TRANSLATIONAL SCIENCE?
☑ The developed PK/PD model provides a valuable in silico prediction tool for determining dosing strategies that reduce the development of resistance and ensure chloroquine therapeutic effect against P. vivax with decreased sensitivity to chloroquine.
Globally, 225 million cases of malaria have been reported with 7.5 million cases due to Plasmodium vivax. 1 Malaria causes an estimated 405,000 deaths worldwide in which 67% involve children aged under 5 years. 1 Chloroquine was the cornerstone of malaria treatment but the spread of drug resistance has rendered chloroquine ineffective for the treatment of P. falciparum malaria in almost all regions of the world. However, chloroquine remains a valuable antimicrobial agent for the treatment of P. vivax malaria in most countries because of its low cost and well‐understood safety profile.
Chloroquine resistance to P. vivax emerged in Papua New Guinea in the late 1980s, 2 , 3 and evidence of reduced chloroquine efficacy has been reported in other malaria endemic countries. 4 , 5 Evaluating the efficacy of antimalarial drugs in P. vivax malaria is difficult due to lack of a continuous in vitro P. vivax culture system, and by the inability of molecular genotyping to discriminate between recrudescence (i.e., blood‐stage treatment failures), relapse, and new infections.
Inadequate chloroquine dosing leads to subtherapeutic exposure and increased risk of treatment failure and resistance development. The pharmacokinetic (PK) and pharmacodynamic (PD) properties of chloroquine and its active metabolite, desethylchloroquine, in P. vivax malaria have been characterized in only a few studies. 6 , 7 , 8 , 9 , 10 , 11 , 12 , 13 , 14 Of note, the relationship between the PK profile of chloroquine and parasite killing has not been described using semimechanistic PK/PD modeling approaches. Knowledge on the PK profile of chloroquine and its metabolite, as well as their antimalarial effect against P. vivax, would provide a valuable tool for clinical prediction of the efficacy of various dosing regimens, and for optimizing the current dosing regimen, particularly to combat rising resistance to chloroquine.
In this study, we investigated the PK/PD relationship of chloroquine and desethylchloroquine by analyzing data from a volunteer infection study (VIS) using the P. vivax induced blood‐stage malaria model. 15 We used nonlinear mixed effects modeling to characterize the PK and PD properties of chloroquine and desethylchloroquine. The results from our modeling will help optimizing chloroquine dosing regimens in P. vivax malaria field studies.
METHODS
Study design and subjects
Study design, procedure, and main results were described in detail elsewhere. 15 Briefly, the study was a phase Ib, single‐center, open‐label trial (ACTRN12616000174482) in three cohorts of eight subjects each. The 24 healthy subjects were inoculated with ~ 564 viable P. vivax‐infected erythrocytes administered intravenously on day 0. Chloroquine was administered as chloroquine phosphate tablet (Avloclor). Subjects received a total chloroquine dose of 1.55 g base for ≥ 60 kg adults or 25 mg base/kg for < 60 kg adults orally over 3 days on day 8, 9, or 10. The study was approved by the QIMR Berghofer Medical Research Institute Human Research Ethics Committee and the Australian Defence Human Research Ethics Committee. All subjects provided written informed consent before participating.
Samples for measuring chloroquine and desethylchloroquine concentrations in plasma and whole blood were collected before chloroquine administration and at 1, 2, 3, 4, 6, 12, 24, 48, 72, 96, 168, 240, and 480 hours after first dose administration. Blood samples for P. vivax counts were collected before inoculation, daily from day 4 until parasitemia was detected, twice‐daily thereafter until treatment day, before first dose on treatment day, and at 2, 4, 8, 12, 16, 24, 30, 36, 48, 60, 72, 96, 120, 168, 240, and 480 hours after the first dose.
Chloroquine and desethylchloroquine concentrations were measured using liquid chromatography tandem mass spectrometry. The lower limit of quantification (LLOQ) was 1.35 µg/L for chloroquine plasma, 1.0 µg/L for whole blood chloroquine, 1.3 µg/L for plasma desethylchloroquine, and 1.75 µg/L for whole blood desethylchloroquine concentrations. P. vivax parasitemia was measured using quantitative real‐time polymerase chain reaction targeting the 18S rRNA gene. 16 The limit of detection (LOD) was 10 parasites/mL.
Data used for analysis
The population PK/PD analyses included 1,084 drug concentration measurements (271 for each chloroquine and desethylchloroquine in plasma and whole blood) and 619 P. vivax parasitemia measurements. Of these measurements, 8.9% of chloroquine plasma, 11.8% of desethylchloroquine plasma, 8.9% of chloroquine whole blood, and 10% of desethylchloroquine whole blood concentrations were below the LLOQ. Chloroquine and desethylchloroquine concentrations in erythrocytes were calculated and correlations between drug concentrations in whole blood and erythrocytes were determined (see Supplementary Material S1 ). Approximately 25.5% of parasitemia levels were below the LOD, of which 26% were from measurements taken before chloroquine treatment. The remainder of parasitemia levels below the LOD (74%) occurred at median of 66 hours (range 24–120) after the first dose of chloroquine. Recrudescence was not observed in any subject over the study period.
Pharmacometric modeling
Nonlinear mixed effects modeling was performed using Monolix version 4.3.3 (Lixoft, Antony, France). For data programming, preprocessing and postprocessing of the modeling, and simulations MATLAB R2015b (MathWorks, Natick, MA) and the MATLAB toolbox IQMtools version 1.2.2.2 (IntiQuan GmbH, Basel, Switzerland) was used. The graphic processing of the Monolix output for the final model was performed with R (version 3.5.1) 17 and ggplot2 (version 3.0.0). 18
Pharmacokinetic modeling
Chloroquine and desethylchloroquine plasma and whole blood concentrations were converted into molar units using the molecular masses of 319.8 and 291.8 g/mol, respectively. The chloroquine phosphate doses were converted to the equivalent (base) chloroquine dose by multiplying chloroquine phosphate by 0.62 and converted into molar units. Correlations between chloroquine (Spearman’s rho = 0.99) and desethylchloroquine (Spearman’s rho = 0.98) whole blood and erythrocyte concentrations were high (Figure S1 ). Given the strong relationship between whole blood and erythrocyte concentrations, whole blood concentration was used as a surrogate for the parasite killing effect. PK modeling was conducted separately for plasma and whole blood concentration‐time data. First, a population PK model of chloroquine was developed and then the PK model was extended to describe concurrent PK of chloroquine and desethylchloroquine. Desethylchloroquine is known to have a killing activity against chloroquine‐sensitive P. falciparum strains. 19 , 20 , 21 , 22 Based on the assumption that desethylchloroquine antimalarial activity is similar against P. vivax, desethylchloroquine PK data were incorporated into the PK model with the aim to be used in the PK/PD model. Data below the LLOQ were treated using the left‐censoring method, by maximizing the likelihood of the data being below LLOQ. 23
One‐compartment, two‐compartment, and three‐compartment PK models with different absorption (zero‐order, first‐order, and simultaneous and sequential mixed zero‐order and first‐order with or without lag time) and elimination (linear and parallel linear and saturable) models were tested. Interindividual variability (IIV) was assumed to be log‐normally distributed. Correlations between PK parameters were evaluated by estimating the off‐diagonal components of the variance‐covariance matrix. Interoccasion variability related to was tested for the second, third, and fourth doses vs. the first dose. Additive, proportional, and combined error models were tested to explain random unexplained variability (see Supplementary Material S1 ).
Age, sex, and body weight were tested during covariate model building. Effect of covariates on PK parameters was evaluated with a stepwise forward‐addition (P < 0.05) and backward‐deletion (P < 0.01) approach. Continuous covariates were modeled as power function and categorical covariates as linear function (see Supplementary Material S1 ). Covariates were selected based on biological plausibility, statistical significance, and clinical relevance. A covariate was retained in the final model if its contribution was clinically important, which was defined as 95% confidence interval (CI) of the covariate effect lying completely outside of a predetermined limit (±20%).
Pharmacokinetic‐pharmacodynamic modeling
Each P. vivax parasitemia measurement was quantified in replicate per time points and log10‐transformed. The mean of the log10‐transformed parasitemia per time point per subject was used in the analysis. A sequential PK/PD modeling approach was used in which the empirical Bayes estimates of individual PK parameters from plasma and whole blood samples were used as regression parameters. The initial aim was to include the antimalarial effect of desethylchloroquine in the PK/PD model; however, desethylchloroquine was excluded from the analysis as it was assumed that its contribution to the parasite killing effect was minor based on its low concentrations in both plasma and whole blood. The low exposures of desethylchloroquine relative to chloroquine suggest that chloroquine contributes most to the antimalarial effect. The left censoring method was used for parasitemia below the LOD.
As the maximum parasite killing rate of chloroquine ( ) is independent of whether plasma or whole blood concentrations were measured in describing the parasite killing effect, a common parameter was used to fit the two models simultaneously. To technically enable the simultaneous fit, the observed parasitemia levels were duplicated to link each set separately to the empirical Bayes estimates of the PK parameters for plasma or whole blood concentrations. We tested several PD models, including a direct effect ( ), a turnover, and an effect compartment model (see Supplementary Material S1 ). The IIV of each PD parameter was described using a log‐normal variance model, except for the log10‐transformed baseline parasitemia, for which a normal distribution was assumed. An additive error model was used to present the residual random unexplained variability in the log10 parasitemia measurements. Secondary parameters, such as parasite multiplication rate over 48 hours ( ), parasite reduction ratio over 48 hours ( ), parasite clearance half‐life ( ), and time above chloroquine plasma and whole blood concentration at half of maximum effect ( ) were estimated using individual PD parameters obtained via empirical Bayes estimates (see Supplementary Material S1 ).
Model evaluation
The appropriateness of the model was evaluated using basic goodness‐of‐fit diagnostics and visual predictive check (VPC). A VPC was performed by simulating 1,000 observations at each time point and 95% CI of the 5th, 50th, and 95th simulated percentiles were plotted against observations. In addition, successful convergence of the minimization routine, reasonable physiological plausibility, and precision of parameter estimates were also taken into account during the model development.
Simulations of chloroquine resistance
Simulations were performed to evaluate different mechanisms of chloroquine resistance on treatment success at day 28 by varying , , and values (see Supplementary Material S1 ).
RESULTS
All subjects from the previously reported clinical trial (three cohorts, n = 8 per cohort) were included in the analysis. 15 Table 1 shows the demographic characteristics of the subjects, chloroquine dose, and treatment day. The majority of the subjects (91.7%) received 1,000 mg chloroquine phosphate initially, followed by 500 mg or 375 mg at 6, 24, and 48 hours after the first dose administration. Chloroquine treatment commenced on day 8 for cohort 1 and on day 10 for cohorts 2 and 3, except for one subject (subject 205) who commenced treatment on day 9. Plasma, whole blood, and erythrocyte concentrations of chloroquine and desethylchloroquine time profiles are presented in Figure S1 .
Table 1.
Demographic characteristics, treatment day, and chloroquine dose for all subjects
| Characteristics | Subjects analyzed (n = 24) |
|---|---|
| Sex, n (%) | |
| Male | 13 (54.2) |
| Female | 11 (45.8) |
| Age, years | |
| Mean (SD) | 25.6 (6.6) |
| Range | 19–44 |
| Race, n (%) | |
| White | 21 (87.5) |
| Indigenous aboriginal | 1 (4.2) |
| Latino | 1 (4.2) |
| Asian | 1 (4.2) |
| Weight, kg | |
| Mean (SD) | 73.3 (10.8) |
| Range | 57.2–99.5 |
| Height, cm | |
| Mean (SD) | 175.8 (9.8) |
| Range | 156–190 |
| Body mass index, kg/m2 | |
| Mean (SD) | 23.7 (2.7) |
| Range | 19.1–29.5 |
| Treatment day, n (%) | |
| Day 8 | 8 (33.3) |
| Day 9 | 1 (4.2) |
| Day 10 | 15 (62.5) |
| CQ base doses a | |
| 0 hours | 620 mg (n = 24) |
| 6 hours | 310 mg (n = 24) |
| 24 hours | 310 mg (n = 23), 232.5 mg (n = 1) |
| 48 hours | 310 mg (n = 22), 232.5 mg (n = 2) |
| Hematocrit | |
| Mean (SD) | 0.4 (0.03) |
| Range | 0.31–0.51 |
CQ, chloroquine.
Chloroquine was administered as chloroquine phosphate (Avloclor). The chloroquine phosphate doses were converted to chloroquine base dose by multiplying with 0.62.
Population pharmacokinetic modeling
Chloroquine plasma and whole blood PK profiles were characterized by a two‐compartment model with first‐order absorption and elimination and a proportional residual error. Desethylchloroquine plasma and whole blood PK profiles were described by a two‐compartment model, with a first‐order input from the chloroquine central compartment and first‐order elimination (Figure 1 ). Chloroquine whole blood concentrations were ~ 5.9‐fold (range 0.3–58.8) higher than plasma concentrations, whereas desethylchloroquine whole blood concentrations were ~ 7.3‐fold (range 1.5–45) higher than plasma concentrations. These results suggest a major effect of the sampling matrix analyzed. The fraction of chloroquine metabolized to desethylchloroquine (FM) and the fraction of chloroquine eliminated by other pathways (1‐FM) were not known. To allow model identifiability in this drug‐metabolite PK model, it was assumed that 18% of chloroquine is converted to desethylchloroquine, based on published estimates of the desethylchloroquine fraction of the total chloroquine dose recovered in urine. 9 , 12
Figure 1.
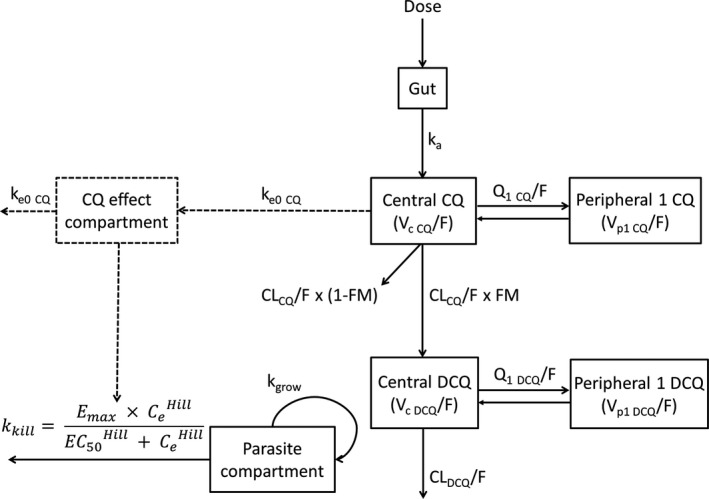
Final structural population pharmacokinetic‐pharmacodynamic model of chloroquine and desethylchloroquine in healthy subjects inoculated with blood‐stage Plasmodium vivax. , the concentration of the drug in the hypothetical effect compartment; , apparent clearance of chloroquine; , apparent clearance of desethylchloroquine; CQ, chloroquine; DCQ, desethylchloroquine; , the drug concentration producing 50% of the ; , maximum parasite killing attributable to the drug; FM, fraction of chloroquine metabolized to desethylchloroquine; , relative bioavailability of first‐order absorption; , the Hill coefficient; , rate constant of absorption; , transfer rate constant from effect compartment of chloroquine; , growth rate of P. vivax; , killing rate of P. vivax by the drug; , apparent inter‐compartmental clearance between central compartment of chloroquine and peripheral compartment 1 of chloroquine; , apparent intercompartmental clearance between central compartment of desethylchloroquine and peripheral compartment one of desethylchloroquine; , apparent volume of distribution for central compartment of chloroquine; , apparent volume of distribution for central compartment of desethylchloroquine; , apparent volume of distribution for peripheral compartment one of chloroquine; , apparent volume of distribution for peripheral compartment one of desethylchloroquine.
Table 2 summarizes PK parameter estimates and their associated IIV. The differences observed in the parameter estimates for the volumes of distribution and clearances for plasma and whole blood samples are explained by the 6‐fold to 7‐fold average difference in concentrations derived from these sampling matrices. The elimination rate constants of chloroquine from the central compartment were similar. No covariate was included in the final PK model (see Supplementary Material S1 ).
Table 2.
Chloroquine and desethylchloroquine parameter estimates from the final population pharmacokinetic models
| Parameters | Plasma samples | Whole blood samples | |||||||
|---|---|---|---|---|---|---|---|---|---|
| Estimate | RSE (%) | 95% CI | Shrinkage (%) | Estimate | RSE (%) | 95% CI | Shrinkage (%) | ||
| Pharmacokinetic parameters | |||||||||
| , hour−1 | 0.943 | 21 | 0.551–1.335 | — | 0.574 | 18 | 0.378–0.770 | — | |
| (%) | 100 (fixed) | — | — | — | 100 (fixed) | — | — | — | |
| , L/h | 54.6 | 5 | 49.7–59.6 | — | 8.96 | 5 | 8.10–9.82 | — | |
| , L | 2,930 | 7 | 2,558–3,302 | — | 560 | 9 | 456–664 | — | |
| , L/h | 47.2 | 9 | 38.8–55.6 | — | 38.5 | 11 | 30.1–46.9 | — | |
| , L | 4,700 | 7 | 4,053–5,347 | — | 1,230 | 6 | 1,079–1,381 | — | |
| , L/h | 37.6 | 6 | 32.9–42.3 | — | 4.42 | 6 | 3.87–4.97 | — | |
| , L | 40.0 | 39 | 8.6–71.4 | — | 16.1 | 14 | 11.6–20.6 | — | |
| , L/h | 36.3 | 11 | 28.7–43.9 | — | 4.46 | 12 | 3.40–5.52 | — | |
| , L | 2,840 | 13 | 2,134–3,546 | — | 259 | 12 | 196–322 | — | |
| Interindividual variability | |||||||||
|
|
0.662 | 24 | 0.348–0.976 | 18 | 0.467 | 26 | 0.232–0.702 | 22 | |
|
|
0.192 | 18 | 0.125–0.259 | 6 | 0.215 | 17 | 0.144–0.286 | 5 | |
|
|
0.084 | 36 | 0.025–0.143 | 28 | 0.117 | 24 | 0.062–0.172 | 23 | |
|
|
0.179 | 27 | 0.085–0.273 | 25 | 0.228 | 29 | 0.097–0.359 | 18 | |
|
|
0.197 | 25 | 0.101–0.293 | 21 | 0.219 | 21 | 0.129–0.309 | 13 | |
|
|
— | — | — | — | 0.384 | 32 | 0.149–0.619 | 32 | |
| Random unexplained variability | |||||||||
|
|
0.243 | 5 | 0.219–0.267 | — | 0.221 | 5 | 0.199–0.243 | — | |
|
|
0.347 | 5 | 0.314–0.380 | — | 0.253 | 5 | 0.228–0.278 | — | |
| Secondary pharmacokinetic parameters a , b | |||||||||
| CQ , µmol/L | 0.72 (0.25–1.38) | 2.83 (1.29–4.49) | |||||||
| CQ , hour | 4.0 (2.0–4.8) | 4.0 (2.0–5.5) | |||||||
| CQ , µmol∙h/L | 80 (56–126) | 509 (326–856) | |||||||
| CQ , hour | 149 (136–163) | 156 (124–212) | |||||||
| DCQ , µmol/L | 0.08 (0.03–0.22) | 0.39 (0.16–0.82) | |||||||
| DCQ , hour | 3.3 (2.0–5.3) | 4.0 (2.0–5.7) | |||||||
| DCQ , µmol∙h/L | 21 (13–39) | 233 (96–683) | |||||||
| DCQ , hour | 104 (96–137) | 83 (71–99) | |||||||
, area under the concentration‐time curve from zero to infinity; CI, confidence interval; , apparent clearance of chloroquine; , apparent clearance of desethylchloroquine; , maximum concentration; CQ, chloroquine; DCQ, desethylchloroquine; , relative bioavailability of first‐order absorption; , rate constant of absorption; , apparent inter‐compartmental clearance between central compartment of chloroquine and peripheral compartment 1 of chloroquine; , apparent inter‐compartmental clearance between central compartment of desethylchloroquine and peripheral compartment 1 of desethylchloroquine; RSE, relative standard error; , elimination half‐life; , time to reach maximum concentration; , apparent volume of distribution for central compartment of chloroquine; , apparent volume of distribution for central compartment of desethylchloroquine; , apparent volume of distribution for peripheral compartment 1 of chloroquine; , apparent volume of distribution for peripheral compartment 1 of desethylchloroquine.
Secondary pharmacokinetic parameters were calculated from the empirical Bayesian post hoc estimates.
All values are given as median (range) unless stated otherwise.
When the observed concentrations were compared with population and individual predicted concentrations, there was a small underprediction of the higher chloroquine and desethylchloroquine concentrations in both plasma and whole blood samples (Figures S2 –S5 ). The distributions of population and individual weighted residuals (PWRES and IWRES, respectively) and normalized prediction distribution errors (NPDEs) over time showed bias in first 100 hours of drug administration (Figures S2 and S3 ), possibly due to difficulty in modeling the absorption process using plasma data. The scatter plots of the PWRES, IWRES, and NPDE vs. population predictions (Figures S2 and S3 ) showed positive weighted residual in the lowest population predictions, indicating a slight overprediction of the lower chloroquine and desethylchloroquine plasma concentrations. VPCs indicate that the PK models are able to reproduce the observed data (Figure 2 ).
Figure 2.
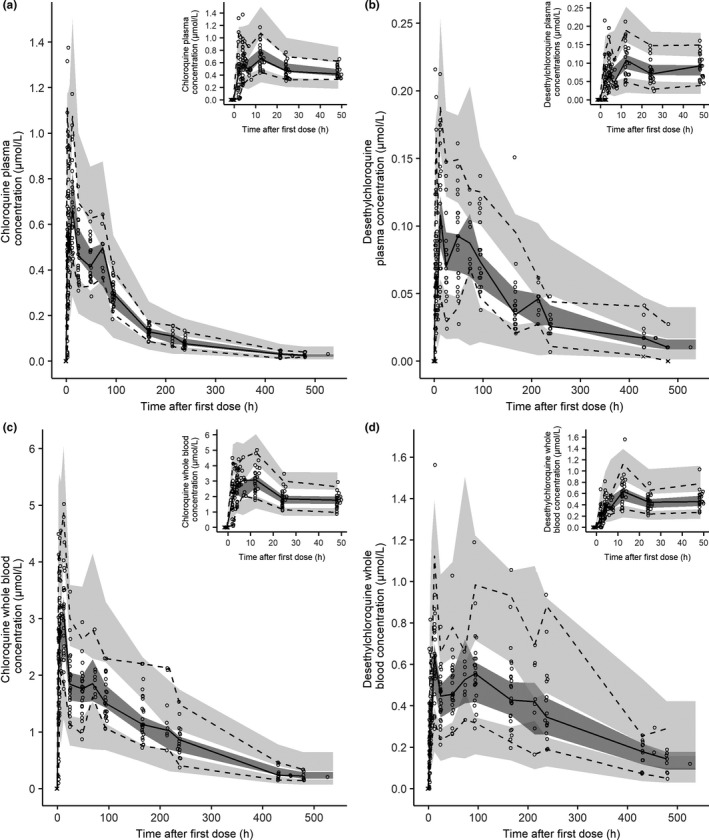
Visual predictive check of the final pharmacokinetic model of (a) chloroquine plasma, (b) desethylchloroquine plasma, (c) chloroquine whole blood, and (d) desethylchloroquine whole blood concentrations. The insets show chloroquine and desethylchloroquine simulations at 0–48 hours. The circles represent the observed data, the crosses represent the simulated values below the lower limit of quantification concentrations, the solid lines represent the 50th percentile of the observed data, the dashed lines represent the 50th and 95th percentiles for the observed data, the dark grey shaded areas represent the 95% confidence intervals for 50th percentile and the light grey shaded area the 95% confidence interval for the 5th and 95th percentiles derived from 1,000 stochastic profiles simulated from the final population pharmacokinetic model.
Population pharmacokinetic/pharmacodynamic modeling
Individual empirical Bayesian estimates of PK parameters from plasma and whole blood data were used simultaneously to describe the drug concentration‐effect relationship. Parasite killing was described by a delayed effect of chloroquine concentration on the parasite. The equilibration half‐life for chloroquine in plasma was 32.7 hours (95% CI 27.4–40.5) and in whole blood 24.1 hours (95% CI 19.0–32.7), indicating that chloroquine concentration in the effect compartment takes some time to reach equilibrium with levels measured in plasma and whole blood. The PD parameters and their IIVs were estimated with a reasonable precision (Table 3 ). The was estimated to be 0.213 hour−1 (95% CI 0.196–0.230).
Table 3.
Chloroquine parameter estimates from the final population pharmacodynamic model
| Parameter | Estimate | RSE (%) | 95% CI | Shrinkage (%) | |
|---|---|---|---|---|---|
| Pharmacodynamic parameters | |||||
| , log10 parasite/mL | ‒3.36 | 9 | ‒3.97 to (‒2.75) | — | |
| , hour−1 | 0.059 | 3 | 0.056–0.062 | — | |
| , hour−1 | 0.213 | 4 | 0.196–0.230 | — | |
| , µmol/L | 0.047 (fixed) | — | — | — | |
| , µmol/L | 0.28 (fixed) | — | — | — | |
|
|
2.5 (fixed) | — | — | — | |
|
|
2.5 (fixed) | — | — | — | |
| , hour−1 | 0.0212 | 10 | 0.0171–0.0253 | — | |
| , hour−1 | 0.0288 | 14 | 0.0212–0.0364 | — | |
| Interindividual variability | |||||
|
|
1.47 | 22 | 0.843–2.097 | 11 | |
|
|
0.137 | 18 | 0.090–0.184 | 13 | |
|
|
0.193 | 7 | 0.168–0.218 | 4 | |
|
|
0.3 (fixed) | — | — | — | |
|
|
0.3 (fixed) | — | — | — | |
|
|
0.1 (fixed) | — | — | — | |
|
|
0.1 (fixed) | — | — | — | |
| Random unexplained variability | |||||
|
|
0.378 | 2 | 0.365–0.391 | — | |
|
|
0.379 | 3 | 0.357–0.401 | — | |
| Secondary pharmacodynamics parameters a | |||||
| Geometric mean (95% CI) | Median (range) | ||||
| , parasite/48 h | 17.4 (14.3–20.4) | 16.1 (10.3–41.0) | |||
| , log10 difference | 2.6 (2.5–2.7) b | 2.7 (2.3–2.9) | |||
| , log10 difference | 2.6 (2.5–2.7) b | 2.6 (2.2–2.8) | |||
| , hour | 4.5 (4.1–5.0) | 4.7 (2.2–6.7) | |||
| Time above , days | 14.3 (13.5–15.1) | 14.2 (10.7–17.3) | |||
| Time above , days | 18.3 (17.0–19.6) | 18.1 (14.4–26.3) | |||
CI, confidence interval; CQ, chloroquine; , chloroquine concentration in biological matrix that produces 50% of the Emax; , maximum parasite killing rate by chloroquine; , Hill coefficient reflecting the steepness of the chloroquine concentration in biological matrix‐effect relationship; , transfer rate constant to and from effect compartment of chloroquine in biological matrix; , parasite growth rate; , parasite clearance half‐life; , parasitemia level at baseline; , parasite multiplication rate per 48 hours; , parasite reduction ratio in biological matrix per 48 hours; RSE, relative standard error.
Secondary pharmacodynamic parameters were calculated from the empirical Bayesian post hoc estimates.
Values are arithmetic mean (95% CI).
Sensitivity analysis revealed that the estimates of some parameters changed substantially with different initial condition values: , ; transfer rate constant of chloroquine plasma, and whole blood concentration from and to the central compartment and an effect compartment ( , ). These parameters were difficult to estimate because none of the subjects had recrudescence. As a result, we fixed to 0.28 μmol/L, a value previously reported in the literature based on relapse data. 14 We assumed that the is six folds lower than , based on the whole blood‐to‐plasma ratio of chloroquine concentrations in this study. The geometric mean of estimated was 17.4‐fold per 48 hours (95% C: 14.3–20.4). The arithmetic mean of was the same between plasma and whole blood (2.6; 95% CI 2.5–2.7), corresponding to a PRR of 400 every 48 hours (95% CI 320–500). The geometric mean of estimated was 4.5 hours (95% CI 4.1–5.0). The geometric mean of estimated time above was 14.3 days (95% CI 13.5–15.1) and time above was 18.3 days (95% CI 17.0–19.6).
The goodness‐of‐fit plots did not show any systematic deviation between observed parasitemia and population and individual predicted parasitemias (Figure S7 ). The distributions of PWRES, IWRES, and NPDE plotted against population prediction and time after first chloroquine dose were homogenous around the zero line, with exception of a few observations, mainly data below the LOD that lay outside the −2 to 2 range. The major contributor of these observations was subject 205, who received his first dose of chloroquine on day 9. The estimated for this subject is higher than the rest of subjects (0.365 hour−1 vs. others: 0.172–0.292 hour−1). The model predictive performance was confirmed with VPC plots (Figure 3 ) in which the 5th, 50th, and 95th percentiles were within the 95% CI for both plasma and whole blood data.
Figure 3.
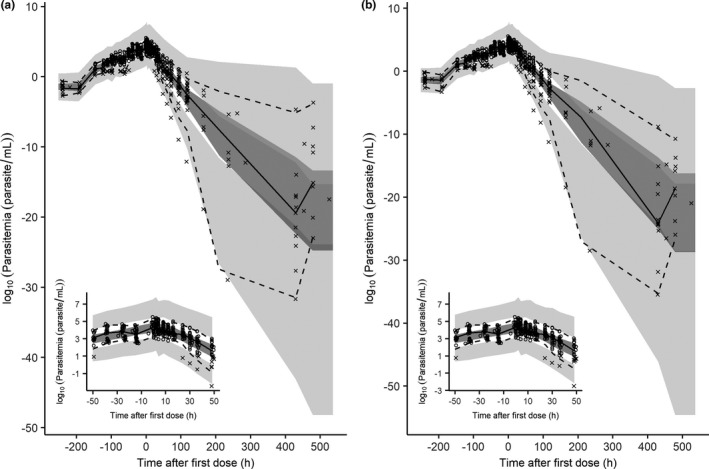
Visual predictive check of the final pharmacodynamic model of Plasmodium vivax parasitemia for chloroquine (a) plasma and (b) whole blood data. The insets show parasitemia simulations at −48 to 48 hours. The circles represent the observed data, the crosses represent the simulated values below the lower limit of quantification concentrations, the solid lines represent the 50th percentile of the observed data, the dashed lines represent the 50th and 95th percentiles for the observed data, the dark grey shaded areas represent the 95% confidence intervals for 50th percentile, and the light grey shaded area the 95% confidence interval for the 5th and 95th percentiles derived from 1,000 stochastic profiles simulated from the final population pharmacokinetic/pharmacodynamic model.
Simulations of chloroquine resistance
Two scenarios of chloroquine resistance were considered. In the first scenario, simulations were performed by varying the while holding constant the . Figure 4a demonstrates that the treatment success rate at day 28 decreased as decreased. The treatment success rate fell below 90% when fell below 0.16 hour−1 for chloroquine plasma data, and to 0.184 hour−1 for chloroquine whole blood data. In the second scenario, the changes in parasite sensitivity to chloroquine was investigated by increasing the while holding constant the (Figure 4b ). As expected, the treatment success rate at day 28 decreased as the increased. To achieve a treatment success rate above 90%, an of ≤ 19.5 µg/L (0.061 µmol/L) was required when using chloroquine plasma data, and of ≤ 146 µg/L (0.456 µmol/L) when using chloroquine whole blood data.
Figure 4.
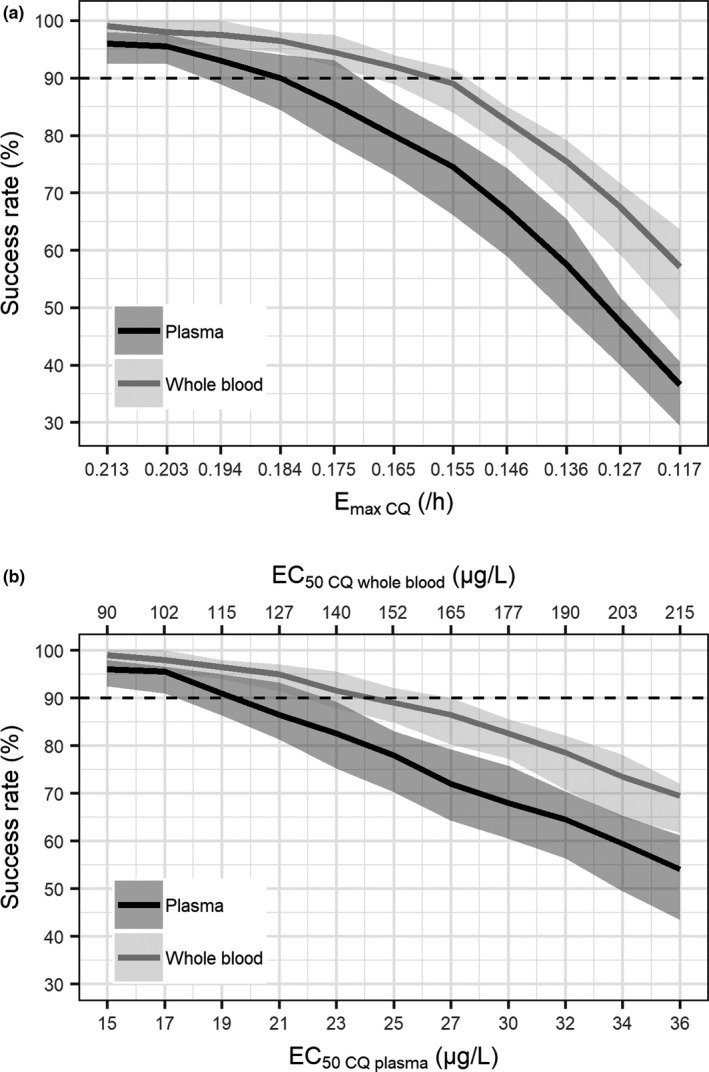
Simulated treatment success rate with (a) decreasing maximum parasite killing rate of chloroquine ( ) and (b) increasing chloroquine concentration at 50% of maximum killing rate ( ). The black solid lines represent the median of simulated treatment success for chloroquine plasma data, the grey solid line represent the median of simulated treatment success for chloroquine whole blood data, the light grey shaded areas represent the simulated 95% confidence interval for the median of chloroquine plasma data, and the dark grey shaded areas represent the simulated 95% confidence interval for the median of chloroquine whole blood data.
DISCUSSION
This is the first study characterizing the PK/PD relationship of chloroquine plasma and whole blood concentrations on clearance of P. vivax parasites using a semimechanistic population PK/PD modeling. The final population PK model for plasma and whole blood samples was a two‐compartment model for both chloroquine and desethylchloroquine, with first‐order absorption and elimination. A delayed effect model was used to describe the effect of chloroquine on the P. vivax kinetics with equilibration half‐life of at least 24 hour. Given chloroquine’s long half‐life, this delayed effect is not clinically relevant in uncomplicated malaria. However, a delayed effect is undesirable for property of drugs used for treating severe malaria or for antimalarials with short half‐lives. 24
The structural PK model described in this study was similar to two published studies. 9 , 13 However, another published study indicated a preference for one transit compartment absorption model over the first‐order absorption. 12 Differences in sampling time points during the absorption phase may contribute to this discrepancy. These three published PK models were based on chloroquine and desethylchloroquine plasma concentrations. 9 , 12 , 13 The PK parameter estimates of plasma samples in this study are slightly different in terms of volume of distribution and clearance with those previously reported. 9 , 12 , 13 The apparent central volume of distribution ( values reported in the published studies varied from 6.7–60.3 L/kg for chloroquine, and from 0.03–1.3 L/kg for desethylchloroquine (assuming a 70 kg individual). These values were comparable to the values estimated in this study ( = 41.9 L/kg; 95% CI 36.5–47.2; L/kg; = 0.6 L/kg; 95% CI 0.1–1.0 L/kg). The apparent clearance of chloroquine estimated in this study was slightly higher at 0.78 L/h/kg (95% CI 0.71–0.85 L/h/kg) L/h/kg than the published values (range 0.09–0.5 L/h/kg; assuming a 70 kg individual). The apparent clearance of desethylchloroquine ( ) value from literature ranged between 0.03 and 0.65 L/h/kg, which is within the range of the value estimated in this study (0.54 L/h/kg; 95% CI 0.47–0.60 L/h/kg; assuming a 70 kg individual). This discrepancy may be attributable to different study populations, extensive PK sampling time points, differences in parasitemia levels, and use of concomitant antimalarial therapy. Published data on the population PK of hydroxychloroquine (a treatment currently being evaluated in clinical trials for the treatment of patients with coronavirus disease 2019 (COVID‐19)) are limited, with two studies reporting a one‐compartment PK model, probably due to limited sampling 25 , 26 and another study reporting a two‐compartment model. 27 Compared with our estimates of the PK parameters, hydroxychloroquine has a smaller total apparent volume of distribution but was similar in regard to absorption and elimination parameters.
The analysis presented in this report represents the first attempt to develop a PK model of chloroquine and desethylchloroquine using whole blood concentrations. PK parameter estimates of whole blood samples were generally lower than that of plasma samples. This is due to differences in the partitioning of chloroquine and desethylchloroquine between erythrocytes and plasma. In this study, chloroquine and desethylchloroquine whole blood concentrations were higher than in plasma, which is in accordance with the results of other studies. 28 , 29 , 30 , 31 Consequently, the volume of distribution and clearance of chloroquine were sixfolds lower in whole blood than in plasma. Given the differences in PK parameter estimates between whole blood and plasma, the choice of biological matrix is important for monitoring chloroquine concentration. The World Health Organization recommendations are that whole blood be the preferred biological matrix for measurement of chloroquine levels, as it is more convenient to collect and process than packed red cells, plasma, or serum. 32 Furthermore, factors such as the interval from sampling to centrifugation, duration, and force of centrifugation, do not influence chloroquine concentrations in whole blood. 30 , 33
The delay between appearance of chloroquine in plasma and whole blood and parasite killing was described using an effect compartment model. The utility of this delayed response model has been reported in modeling of P. falciparum malaria in patients receiving oral artesunate therapy. 34 The PK/PD model developed in this study assumed that chloroquine is active against all asexual lifecycle stages of parasites. However, there is emerging evidence that P. vivax trophozoites and schizonts are insensitive to chloroquine. 35 , 36 , 37 No recrudescence was observed for any subject, rendering the estimation of chloroquine difficult. Chloroquine for whole blood was fixed to a value previously reported in the literature based on the assumption that the drug sensitivity of parasites at the time of recrudescence is similar to that calculated from relapse data. 14 was assumed to be six folds lower than the based on whole blood to plasma ratio of chloroquine concentrations. Despite these limitations, this is the first study to characterize PK/PD relationship of chloroquine plasma and whole blood concentrations on clearance of P. vivax parasites. This is also the first time that the parasite killing effect of chloroquine was investigated in a P. vivax induced blood stage VIS.
The time above was used as a PK determinant of chloroquine therapeutic outcome. With a log10 PRR48 of 2.6 (95% CI 2.5–2.7), 10 days are required for chloroquine to clear parasites in a hypothetical patient with a baseline parasitemia of 10. 12 As chloroquine concentrations remain above for 14–18 days, this ensures that all asexual parasites are removed from circulation, thereby curing the blood‐stage infection. The estimated log10 PRR48 in this study is similar to the reported values of chloroquine‐sensitive isolates (range 2.6–3.6), 38 , 39 mefloquine (2.6), 38 and halofantrine (2.3). 38 However, the log10 PRR48 estimated for chloroquine is lower than artesunate (3.2), 38 artemether (3.2), 38 artefenomel (range 4.6–6.3), 40 and ganaplacide (range 3.1–3.8), 41 but higher than primaquine (1.0), 38 quinine (2.0), 38 DSM265 (range 0.8–1.5), 42 and sulfadoxine‐pyrimethamine (range 1.2–1.5) 38 in patients with P. vivax malaria. Simulations showed that chloroquine efficacy was sensitive to changes in . An reduction of 14% for plasma samples and 25% for whole blood samples resulted in treatment success rate of < 90%. In other reported in silico simulations, changes in were also found to have the largest effect on treatment outcome. 43 Increasing the chloroquine dose in adults could restore the treatment success rate in areas with emerging chloroquine resistance but with an increased risk of development of toxicity. Of note, simulations of treatment success in this study were based on recrudescence within 28 days of follow‐up, and relapse within the treatment interval by reactivation of dormant hypnozoites was not taken into consideration.
In conclusion, we have successfully developed a population PK/PD model describing the PK and PD properties of chloroquine treatment in a VIS using the P. vivax induced blood‐stage malaria model. This model improves our understanding of the concentration‐effect relationship of chloroquine in P. vivax malaria and can be applied to optimize chloroquine dosing regimens. The PK/PD model of chloroquine developed, which includes estimation of parasite growth from samples collected pretreatment, can be used within a simulation framework to explore a range of scenarios. These include varying dosing schemes for chloroquine resistant P. vivax infection by varying the or , the effect of incomplete adherence to the standard 3‐day dosing regimen on outcome, or varying the dosage schedule so as to minimize drug toxicity, which is primarily related to peak plasma concentration ( ) could be simulated. Another model applicability, particularly the PK model, is the prediction of chloroquine dosing regimens for treatment of COVID‐19. Simulations of various dosing schemes using the developed PK model to achieve exposure above in vitro inhibition of 1.13–7.36 µM 44 , 45 , 46 at multiplicities of infection of 0.01–0.8 (assuming these values correspond to total plasma values) and putative whole blood in vivo of 6.78–44.16 µM (based on whole blood‐to‐plasma ratio of 6:1 in this study), as well as prediction of chloroquine concentrations in the lungs (assuming similar lung‐to‐plasma correlations in animal studies 47 , 48 ) could be performed.
FUNDING
This study was funded by Medicines for Malaria Venture (MMV). MMV is funded by a number of donors including USAID, Bill and Melinda Gates Foundation, UK Department for International Development, Norwegian Agency for Development Cooperation, Irish Aid, Newcrest Mining Limited, Australian Aid, Swiss Agency For Development and Co‐Operation, and Wellcome Trust. These funders had no role in the design, conduct, or analysis of the trial. J.S.M. was supported by an Australian National Health and Medical Research Foundation Practitioner Fellowship. J.A.S. is funded by an Australian National Health and Medical Research Council Senior Research Fellowship 1104975. This work was supported in part by the Australian Centre for Research Excellence in Malaria Elimination, funded by the NHMRC (1134989).
Conflict of Interest
N.G., S.C., and J.J.M. are employees of Medicines for Malaria Venture (MMV); all other authors declared no competing interests for this work.
Author Contributions
A.N.A.R., J.A.S., and J.S.M. wrote the manuscript. S.C., J.J.M., and J.S.M. designed the research. J.S.M. performed the research. A.N.A.R., L.M., N.G., and A.K. analyzed the data.
Supporting information
Fig S1
Fig S2
Fig S3
Fig S4
Fig S5
Fig S6
Fig S7
Supplementary Material
Acknowledgments
The authors thank Claire Wang and all the staff at QPID Laboratory involved in the qPCR analysis, and Brett McWhinney for plasma and whole blood PK analysis. We thank Jacinda Wilson and Dr. Laura Cascales for medical writing services.
References
- 1. World Health Organization . World Malaria Report 2019 <https://www.who.int/malaria/publications/world‐malaria‐report‐2019/en/>. (2019).
- 2. Rieckmann, K.H. , Davis, D.R. & Hutton, D.C. Plasmodium vivax resistance to chloroquine? Lancet 2, 1183–1184 (1989). [DOI] [PubMed] [Google Scholar]
- 3. Whitby, M. , Wood, G. , Veenendaal, J.R. & Rieckmann, K. Chloroquine‐resistant Plasmodium vivax. Lancet 334, 1395 (1989). [DOI] [PubMed] [Google Scholar]
- 4. Price, R.N. , von Seidlein, L. , Valecha, N. , Nosten, F. , Baird, J.K. & White, N.J. Global extent of chloroquine‐resistant Plasmodium vivax: a systematic review and meta‐analysis. Lancet Infect. Dis. 14, 982–991 (2014). [DOI] [PMC free article] [PubMed] [Google Scholar]
- 5. Commons, R.J. et al. The Vivax Surveyor: online mapping database for Plasmodium vivax clinical trials. Int. J. Parasitol. Drugs Drug Resist. 7, 181–190 (2017). [DOI] [PMC free article] [PubMed] [Google Scholar]
- 6. Edwards, G. , Looareesuwan, S. , Davies, A.J. , Wattanagoon, Y. , Phillips, R.E. & Warrell, D.A. Pharmacokinetics of chloroquine in Thais: plasma and red‐cell concentrations following an intravenous infusion to healthy subjects and patients with Plasmodium vivax malaria. Br. J. Clin. Pharmacol. 25, 477–485 (1988). [DOI] [PMC free article] [PubMed] [Google Scholar]
- 7. Na‐Bangchang, K. , Limpaibul, L. , Thanavibul, A. , Tan‐Ariya, P. & Karbwang, J. The pharmacokinetics of chloroquine in healthy Thai subjects and patients with Plasmodium vivax malaria. Br. J. Clin. Pharmacol. 38, 278–281 (1994). [DOI] [PMC free article] [PubMed] [Google Scholar]
- 8. Lee, S.J. et al. Chloroquine pharmacokinetics in pregnant and nonpregnant women with vivax malaria. Eur. J. Clin. Pharmacol. 64, 987–992 (2008). [DOI] [PubMed] [Google Scholar]
- 9. Karunajeewa, H.A. et al. Pharmacokinetics of chloroquine and monodesethylchloroquine in pregnancy. Antimicrob. Agents Chemother. 54, 1186–1192 (2010). [DOI] [PMC free article] [PubMed] [Google Scholar]
- 10. Kadam, P.P. , Gogtay, N.J. , Karande, S. , Shah, V. & Thatte, U.M. Evaluation of pharmacokinetics of single‐dose chloroquine in malnourished children with malaria‐ a comparative study with normally nourished children. Indian J. Pharmacol. 48, 498–502 (2016). [DOI] [PMC free article] [PubMed] [Google Scholar]
- 11. Pereira, D. et al. Safety, efficacy and pharmacokinetic evaluations of a new coated chloroquine tablet in a single‐arm open‐label non‐comparative trial in Brazil: a step towards a user‐friendly malaria vivax treatment. Malar J 15, 477 (2016). [DOI] [PMC free article] [PubMed] [Google Scholar]
- 12. Hoglund, R. , Moussavi, Y. , Ruengweerayut, R. , Cheomung, A. , Abelo, A. & Na‐Bangchang, K. Population pharmacokinetics of a three‐day chloroquine treatment in patients with Plasmodium vivax infection on the Thai‐Myanmar border. Malar. J. 15, 129–137 (2016). [DOI] [PMC free article] [PubMed] [Google Scholar]
- 13. Salman, S. et al. Optimal antimalarial dose regimens for chloroquine in pregnancy based on population pharmacokinetic modelling. Int. J. Antimicrob. Agents 50, 542–551 (2017). [DOI] [PubMed] [Google Scholar]
- 14. Watson, J. , Chu, C.S. , Tarning, J. & White, N.J. Characterizing blood‐stage antimalarial drug MIC values in vivo using reinfection patterns. Antimicrob. Agents Chemother. 62, e02476–e2517 (2018). [DOI] [PMC free article] [PubMed] [Google Scholar]
- 15. Collins, K.A. et al. A Plasmodium vivax experimental human infection model for evaluating the efficacy of interventions. J. Clin. Invest.. doi: 10.1172/JCI134923. [epub ahead of print]. [DOI] [PMC free article] [PubMed] [Google Scholar]
- 16. McCarthy, J.S. et al. Experimentally induced blood‐stage Plasmodium vivax infection in healthy volunteers. J. Infect. Dis. 208, 1688–1694 (2013). [DOI] [PMC free article] [PubMed] [Google Scholar]
- 17. R Core Team . R: A language and environment for statistical computing. (R Foundation for Statistical Computing, Vienna, Austria, 2018). [Google Scholar]
- 18. Wickham, H. ggplot2: Elegant graphics for data analysis <https://ggplot2‐book.org/> (2016).
- 19. Aderounmu, A.F. In vitro assessment of the antimalarial activity of chloroquine and its major metabolites. Ann. Trop. Med. Parasitol. 78, 581–585 (1984). [DOI] [PubMed] [Google Scholar]
- 20. Fu, S. , Bjorkman, A. , Wahlin, B. , Ofori‐Adjei, D. , Ericsson, O. & Sjoqvist, F. In vitro activity of chloroquine, the two enantiomers of chloroquine, desethylchloroquine and pyronaridine against Plasmodium falciparum. Br. J. Clin. Pharmacol. 22, 93–96 (1986). [PMC free article] [PubMed] [Google Scholar]
- 21. Geary, T.G. , Divo, A.A. & Jensen, J.B. Activity of quinoline‐containing antimalarials against chloroquine‐sensitive and ‐resistant strains of Plasmodium falciparum in vitro. Trans. R. Soc. Trop. Med. Hyg. 81, 499–503 (1987). [DOI] [PubMed] [Google Scholar]
- 22. Verdier, F. , Le Bras, J. , Clavier, F. & Hatin, I. Blood levels and in vitro activity of desethylchloroquine against Plasmodium falciparum. Lancet 1, 1186–1187 (1984). [DOI] [PubMed] [Google Scholar]
- 23. Beal, S.L. Ways to fit a PK model with some data below the quantification limit. J. Pharmacokinet. Pharmacodyn. 28, 481–504 (2001). [DOI] [PubMed] [Google Scholar]
- 24. Khoury, D.S. , Cromer, D. , Mohrle, J.J. , McCarthy, J.S. & Davenport, M.P. Defining the effectiveness of antimalarial chemotherapy: investigation of the lag in parasite clearance following drug administration. J. Infect. Dis. 214, 753–761 (2016). [DOI] [PMC free article] [PubMed] [Google Scholar]
- 25. Carmichael, S.J. , Charles, B. & Tett, S.E. Population pharmacokinetics of hydroxychloroquine in patients with rheumatoid arthritis. Ther. Drug Monit. 25, 671–681 (2003). [DOI] [PubMed] [Google Scholar]
- 26. Morita, S. , Takahashi, T. , Yoshida, Y. & Yokota, N. Population pharmacokinetics of hydroxychloroquine in Japanese patients with cutaneous or systemic lupus erythematosus. Ther. Drug Monit. 38, 259–267 (2016). [DOI] [PubMed] [Google Scholar]
- 27. Lim, H.S. et al. Pharmacokinetics of hydroxychloroquine and its clinical implications in chemoprophylaxis against malaria caused by Plasmodium vivax. Antimicrob. Agents Chemother. 53, 1468–1475 (2009). [DOI] [PMC free article] [PubMed] [Google Scholar]
- 28. Frisk‐Holmberg, M. , Bergqvist, Y. , Termond, E. & Domeij‐Nyberg, B. The single dose kinetics of chloroquine and its major metabolite desethylchloroquine in healthy subjects. Eur. J. Clin. Pharmacol. 26, 521–530 (1984). [DOI] [PubMed] [Google Scholar]
- 29. Nosal, R. , Ericsson, O. , Sjoqvist, F. & Durisova, M. Distribution of chloroquine in human blood fractions. Meth. Find Exp. Clin. Pharmacol. 10, 581–587 (1988). [PubMed] [Google Scholar]
- 30. Bergqvist, Y. & Domeij‐Nyberg, B. Distribution of chloroquine and its metabolite desethyl‐chloroquine in human blood cells and its implication for the quantitative determination of these compounds in serum and plasma. J. Chromatogr. 272, 137–148 (1983). [DOI] [PubMed] [Google Scholar]
- 31. Gustafsson, L.L. et al. Disposition of chloroquine in man after single intravenous and oral doses. Br. J. Clin. Pharmacol. 15, 471–479 (1983). [DOI] [PMC free article] [PubMed] [Google Scholar]
- 32. World Health Organization . Methods and techniques for assessing exposure to antimalarial drugs in clinical field studies <https://www.who.int/malaria/publications/atoz/9789241502061/en/> (2011).
- 33. Rombo, L. , Ericsson, O. , Alvan, G. , Lindstrom, B. , Gustafsson, L.L. & Sjoqvist, F. Chloroquine and desethylchloroquine in plasma, serum, and whole blood: problems in assay and handling of samples. Ther. Drug Monit. 7, 211–215 (1985). [DOI] [PubMed] [Google Scholar]
- 34. Lohy Das, J.P. et al. Population pharmacokinetic and pharmacodynamic properties of artesunate in patients with artemisinin sensitive and resistant infections in Southern Myanmar. Malar. J. 17, 126 (2018). [DOI] [PMC free article] [PubMed] [Google Scholar]
- 35. Russell, B. et al. Determinants of in vitro drug susceptibility testing of Plasmodium vivax. Antimicrob. Agents Chemother. 52, 1040–1045 (2008). [DOI] [PMC free article] [PubMed] [Google Scholar]
- 36. Sharrock, W.W. et al. Plasmodium vivax trophozoites insensitive to chloroquine. Malar. J. 7, 94 (2008). [DOI] [PMC free article] [PubMed] [Google Scholar]
- 37. Kerlin, D.H. et al. An analytical method for assessing stage‐specific drug activity in Plasmodium vivax malaria: implications for ex vivo drug susceptibility testing. PLoS Negl. Trop. Dis. 6, e1772 (2012). [DOI] [PMC free article] [PubMed] [Google Scholar]
- 38. Pukrittayakamee, S. et al. Therapeutic responses to different antimalarial drugs in vivax malaria. Antimicrob. Agents Chemother. 44, 1680–1685 (2000). [DOI] [PMC free article] [PubMed] [Google Scholar]
- 39. Phan, G.T. et al. Artemisinin or chloroquine for blood stage Plasmodium vivax malaria in Vietnam. Trop. Med. Int. Health 7, 858–864 (2002). [DOI] [PubMed] [Google Scholar]
- 40. Phyo, A.P. et al. Antimalarial activity of artefenomel (OZ439), a novel synthetic antimalarial endoperoxide, in patients with Plasmodium falciparum and Plasmodium vivax malaria: an open‐label phase 2 trial. Lancet Infect. Dis. 16, 61–69 (2016). [DOI] [PMC free article] [PubMed] [Google Scholar]
- 41. White, N.J. et al. Antimalarial activity of KAF156 in falciparum and vivax malaria. N. Engl. J. Med. 375, 1152–1160 (2016). [DOI] [PMC free article] [PubMed] [Google Scholar]
- 42. Llanos‐Cuentas, A. et al. Antimalarial activity of single‐dose DSM265, a novel plasmodium dihydroorotate dehydrogenase inhibitor, in patients with uncomplicated Plasmodium falciparum or Plasmodium vivax malaria infection: a proof‐of‐concept, open‐label, phase 2a study. Lancet Infect. Dis. 18, 874–883 (2018). [DOI] [PMC free article] [PubMed] [Google Scholar]
- 43. Winter, K. & Hastings, I.M. Development, evaluation, and application of an in silico model for antimalarial drug treatment and failure. Antimicrob. Agents Chemother. 55, 3380–3392 (2011). [DOI] [PMC free article] [PubMed] [Google Scholar]
- 44. Liu, J. et al. Hydroxychloroquine, a less toxic derivative of chloroquine, is effective in inhibiting SARS‐CoV‐2 infection in vitro. Cell Discov 6, 16 (2020). [DOI] [PMC free article] [PubMed] [Google Scholar]
- 45. Wang, M. et al. Remdesivir and chloroquine effectively inhibit the recently emerged novel coronavirus (2019‐nCoV) in vitro. Cell Res. 30, 269–271 (2020). [DOI] [PMC free article] [PubMed] [Google Scholar]
- 46. Yao, X. et al. In vitro antiviral activity and projection of optimized dosing design of hydroxychloroquine for the treatment of severe acute respiratory syndrome coronavirus 2 (SARS‐CoV‐2). Clin. Infect. Dis. 10.1093/cid/ciaa237 [DOI] [PMC free article] [PubMed] [Google Scholar]
- 47. Adelusi, S.A. & Salako, L.A. Kinetics of the distribution and elimination of chloroquine in the rat. Gen. Pharmacol. 13, 433–437 (1982). [DOI] [PubMed] [Google Scholar]
- 48. Adelusi, S.A. & Salako, L.A. Tissue and blood concentrations of chloroquine following chronic administration in the rat. J. Pharm. Pharmacol. 34, 733–735 (1982). [DOI] [PubMed] [Google Scholar]
Associated Data
This section collects any data citations, data availability statements, or supplementary materials included in this article.
Supplementary Materials
Fig S1
Fig S2
Fig S3
Fig S4
Fig S5
Fig S6
Fig S7
Supplementary Material