

Summary
In the absence of a dominant driving mutation other than uniformly present TP53 mutations, deeper understanding of the biology driving ovarian high-grade serous cancer (HGSC) requires analysis at a functional level, including post-translational modifications. Comprehensive proteogenomic and phosphoproteomic characterization of 83 prospectively collected ovarian HGSC and appropriate normal precursor tissue samples (fallopian tube) under strict control of ischemia time reveals pathways that significantly differentiate between HGSC and relevant normal tissues in the context of homologous repair deficiency (HRD) status. In addition to confirming key features of HGSC from previous studies, including a potential survival-associated signature and histone acetylation as a marker of HRD, deep phosphoproteomics provides insights regarding the potential role of proliferation-induced replication stress in promoting the characteristic chromosomal instability of HGSC and suggests potential therapeutic targets for use in precision medicine trials.
Keywords: proteogenomics, ovarian cancer, phosphoproteomics, proteomics, fallopian tube, homologous repair deficiency, replication stress
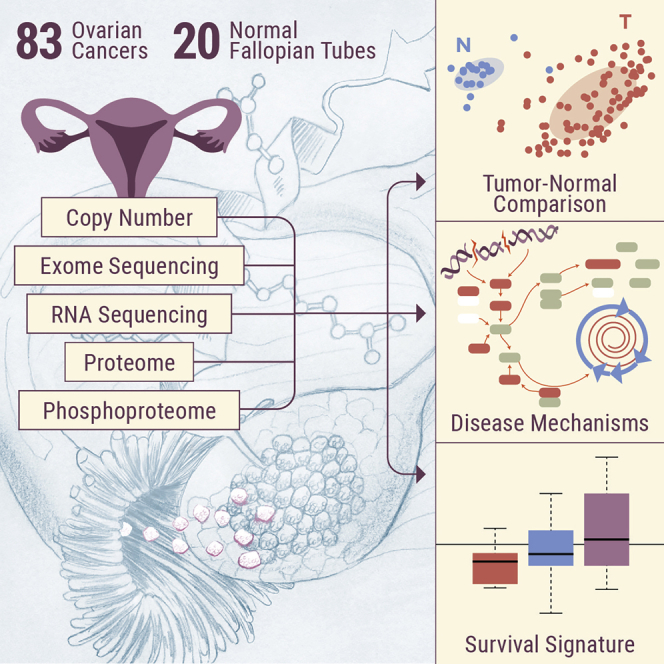
Graphical Abstract
Highlights
Comparison of ovarian cancer and normal precursors identifies key signaling pathways
Mitotic and cyclin-dependent kinases emerge as potential therapeutic targets
Previously identified hallmarks of homologous repair status and survival are confirmed
Replication stress appears to drive increased chromosomal instability
McDermott et al. present the proteogenomic analysis of prospectively collected ovarian high-grade serous cancer samples and appropriate normal precursor samples under tight ischemic control. They identify tumor-associated signaling pathways and mitotic and cyclin-dependent kinases as key oncogenic drivers potentially related to chromosomal instability.
Introduction
High-grade serous cancer (HGSC), the most prevalent histotype of ovarian cancer, has the lowest survival rates1 and is the leading cause of gynecological cancer-related deaths in the developed world.2 HGSC is characterized by the presence of nearly universal TP53 mutations, diverse and widespread chromosomal instability, and a general shortage of targetable driving mutations.3 Given this genomic heterogeneity, the standard of care for HGSC is surgical debulking, followed by combination chemotherapy with platinum-based agents and microtubule inhibitors such as cisplatin-paclitaxel. Despite an initial clinical response in most patients, recurrence is frequent, with current 5-year survival rates for stage IV HGSC of <20%.4 Thus, the major clinical needs in HGSC include the identification of alternative therapeutic targets and an improved understanding of the mechanisms driving chromosomal heterogeneity.
HGSC has been the focus of numerous genomic investigations and was among the first cancers studied by The Cancer Genome Atlas (TCGA).3 Recently, we reported a comprehensive proteogenomic and phosphoproteomic characterization of 174 ovarian cancer samples previously analyzed by TCGA.5 While the availability of outcomes data allowed us to stratify TCGA patients into short-term survivors (<2 years) and long-term survivors (>3 years) and identify proteomic features associated with survival, the absence of appropriate normal control tissues for proteomic analysis precluded the identification of pathways specifically associated with carcinogenesis.
In this study, we prospectively collected 83 new ovarian HGSC samples and 20 normal precursor tissue samples (fallopian tube, FT) for deep characterization at the genomic, transcriptomic, proteomic, and phosphoproteomic levels; 10 of the 20 normal FT samples were matched with tumor samples from the same patient. We were also able to obtain cytobrush samples of FT epithelium (FTE) and provide an extensive comparison of HGSC and FT proteomes and phosphoproteomes, using surgical specimens rather than cell lines. The ability to compare tumor and normal precursor tissues provided biological insights regarding the role of increased proliferation in promoting replication stress in a DNA repair-deficient background, potentially explaining the high degree of chromosomal instability associated with HGSC. Our collection protocols were specifically designed to minimize the effect of ischemia on protein phosphorylation, which has been identified as a significant confounding variable.6 Thus, we were able to identify signaling interactions that would have been lost in the background of ischemic stress, most notably the activation of cyclin-dependent kinase 4 (CDK4) and CDK7. Widespread increases in protein phosphorylation and pathway activation in tumors compared to normal tissues, particularly in the proliferation-associated CDK-RB (retinoblastoma protein) and aurora kinase A (AURKA) pathways that are targetable by US Food and Drug Administration (FDA)-approved inhibitors, provide a rational basis for the use of these therapeutics in ovarian cancer. Phosphosite-specific analysis of CDKs and Fanconi anemia complementation group D (FANCD) was consistent with an elevated response to replication stress, potentially induced by proliferative signals. In addition, pathway-level observations from the retrospective TCGA cohort were conserved in the prospective cohort, including histone acetylation marks associated with homologous repair deficiency (HRD). The survival signature observed in the retrospective TCGA cohort was found to be lowest (consistent with short-term survival) in tumors from patients who were deceased at the 1-year follow-on time point and highest in the normal tissues (consistent with long-term survival), providing preliminary support for the survival signature in an independent cohort.
Results
Proteogenomic Profiling
We prospectively collected tumor specimens, appropriate non-tumor tissues (FT), and blood samples from 83 patients with ovarian HGSC. All of the tissue samples were subjected to mass spectrometry (MS)-based integrated global proteomics and phosphoproteomics analysis using 10-plexed isobaric tandem mass tag (TMT) labeling with extensive fractionation and concatenation (Figure S1A). The clinical and pathological characteristics of the cohort are shown in Table S1. The relative abundances of the proteins and phosphopeptides across the tumor and normal tissue samples were quantified using a universal reference strategy as reported recently,5,7 applying a stringent 1% false discovery rate (FDR) cutoff at the protein level. Inference of the parsimonious protein set resulted in a total of 10,706 proteins and a total of 49,616 phosphopeptides identified. The processed proteomics data tables are available in Table S2; subsets of data used in the different statistical analyses were described in the respective sections or STAR Methods. The raw proteomic data are available via the Clinical Proteomic Tumor Analysis Consortium (CPTAC) Data Portal (https://cptac-data-portal.georgetown.edu/cptac/study/disclaimer;jsessionid=3725434E55F3889301A71D9F76AAE3C6?accNum=S038). In addition, HGSC tissue samples were analyzed by whole-exome sequencing (WXS) and mRNA sequencing (RNA-seq). Raw genomic data associated with this study (harmonized to the GRCh38 reference genome) have been released at the Genomic Data Commons (https://gdc.cancer.gov) and are accessible via the database of Genotypes and Phenotypes (dbGaP) Study Accession: phs000892; the processed RNA-seq data are available in Table S3.
The identification and quantification results and normalization methods were carefully evaluated to confirm the data quality (Figures S1B–S1D; STAR Methods). The consistency of the proteomics pipeline was evident in both the protein sequence coverage (Figure S1B) and the quantitation reproducibility in the external quality controls comparing two breast cancer patient-derived xenograft samples analyzed alongside the ovarian tumors and normal tissue samples (Figure S1C; STAR Methods). The proteomics and phosphoproteomics data also readily separated the tumors from the normal FT tissues (Figure S1D). Principal-component analysis (PCA) on both the proteomic and phosphoproteomic data indicated that there was no clear separation of the tumor phosphopeptide data by either anatomic site of the tumor sample (ovary versus omentum, right panel in Figure S1E) or tumor site of origin (FT versus peritoneum, right panel in Figure S1F). However, the global proteomics data showed a clear separation between the ovary and all of the other anatomic sites of tumor samples (left panel in Figure S1E).
Mutational Landscape of HGSC
The 83 HGSC tumors in our prospective cohort displayed a wide range of somatic mutations, from a high of 7,195 to a low of 10; 93% of tumors had >50 mutations (Figure 1A). A modest increase in average mutational load compared to TCGA was observed, which may relate to advances in WXS technologies. Specifically, missense mutations were 61.0% in our cohort versus 48.6% in TCGA, frameshift indel 22.1% versus 24.7%, splice site 6.5% versus 11.1%, nonsense 6.5% versus 10.7%, and inframe indel 3.9% versus 4.9%. As reported by TCGA, >92% of the HGSC samples had somatic mutations in TP53; 47 samples had missense mutations, while 30 had various deletions, insertions, and splice variants (Figure 1B). When frequently mutated genes (FLAG), which are known to be frequently mutated in many cancers simply as a function of size,8 were eliminated, we observed 5 other genes that were mutated in 4%–7% of samples (Figure 1B).
Figure 1.

Mutational Profiles of Prospective HGSC Samples
(A) Distribution of the total number of variants in each of the 83 tumor samples across the prospective cohort. Each bar depicts the number of mutations in that sample. Samples are ordered by the number of variants. Missense mutations are in blue, whereas all other mutations are in gray. The first four samples with substantially more variants are shown separately.
(B) Mutational landscape of the prospective HGSC cohort, including mutation frequency and type.
See also Figure S2.
Numerous arm-level and focal somatic copy number alterations (SCNAs) were identified from high-resolution exome sequence data using the Genomic Identification of Significant Targets in Cancer (GISTIC) 2.0 algorithm9, including 18 arm-level events at a false discovery rate (FDR) < 0.05 (Figure S2A; Table S4). The significant arm-level amplifications and deletions identified in the prospective HGSC cohort substantially replicated those previously reported by TCGA.10 In addition, GISTIC detected regions of significant focal SCNAs across the genome, including 50 focal amplifications and 63 focal deletions (Figure S2B; Table S4). Direct comparisons of focal SCNAs between the retrospective TCGA cohort and the present cohort are complicated by the use of different platforms (Affymetrix Genome-Wide Human SNP Array 6.0 in TCGA versus WXS in the prospective cohort) to define SCNAs, resulting in an increased number of focal SCNAs in the prospective cohort; focal SCNAs from TCGA were generally detectable in the prospective samples.
The high number of SCNAs observed in both the retrospective TCGA cohort and our prospective cohort confirms the status of HGSC as predominantly a disease of “broken chromosomes” with high rates of faulty DNA repair. Calculations of the Chromosomal Instability Index (CIN) in the prospective cohort using the same algorithms described in the retrospective study5 indicated that the instability was widely dispersed over all chromosomes (Figure S2C). Statistical analysis of proteins whose abundance correlated highly with the CIN score demonstrated substantial overlap with a similar analysis performed on the retrospective TCGA samples (Figure 2A). Among the proteins most significantly associated with the CIN index were PARP1 (polyadenosine diphosphate [ADP]-ribose polymerase I), GTF2I (general transcription factor II-I, involved in cell growth and division), GMPS (guanine monophosphate synthase, involved in nucleotide metabolism), and XPO1 (exportin 1-chromosomal maintenance factor 1, which regulates the nuclear transport of cyclin B, mitogen-activated protein kinase [MAPK], and nuclear factor of activated T cells [NFATs]).
Figure 2.

Correlates of Homologous Repair Deficiency in Prospective HGSC Samples
(A) Proteins associated with chromosomal instability in prospective HGSC samples.
(B and C) Boxplots of acetylation on histone H4 lysine K12 (B) and dual acetylation on K12 and K16 (C) as a function of HRD status (16 of 83 patients were HRD+, as indicated by BRCA1/2 mutation or PTEN deletion).
See also Figure S2.
The impact of SCNAs on mRNA and protein expression (Figures S3A and S3B) was explored by computing Spearman rank correlation across all of the tumors for each gene with SCNA measurements and available mRNA and/or protein abundances (Method Details); 475,448 of ∼102 million CNA-protein pairs (0.46%) and 742,678 of 102 million equivalent CNA-mRNA pairs (0.73%) were significantly correlated at an adjusted p < 0.05. Positive correlations along the diagonal indicate strong cis effects of SCNAs on the abundance of mRNAs (Figure S3A) and proteins (Figure S3B) for cognate genes within the altered locus, as previously reported in the retrospective HGSC cohort. We also identified multiple chromosomal loci where changes in copy number affect the abundance of mRNA and proteins encoded by genes located elsewhere in the genome (i.e., effects in trans), including SCNA hotspots on chromosomes 1, 16, and 19, with strong effects on protein abundance in trans (Figure S3B). Although the hotspots on chromosomes 2, 20, and 22 observed in the retrospective cohort5 were not prominent in the prospective cohort at either the mRNA or protein levels, gene set enrichment analysis (GSEA)11 of the trans-affected proteins in the prospective cohort showed substantial enrichment of proteins associated with immune regulation (e.g., acute immune response, regulation of humoral immune response, regulation of immune effector process; Figure S3C), confirming the apparent selection for proteins associated with immune function observed in the retrospective cohort. In general, however, the increased resolution of focal areas provided by the use of WXS to identify CNAs resulted in a dilution of the trans effect, while a positive correlation between copy number and cis effects on mRNA and protein abundance was consistently observed.
Histone H4 Acetylation as an Indicator of HRD Status
In our retrospective analysis, HGSC samples were deliberately chosen to represent HRD+ and homologous repair proficient (HRD−) genotypes, based on mutations in BRCA1, BRCA2, and/or deletion of PTEN, to identify proteomic signatures associated with HRD status that may be used to stratify women for treatment with PARP inhibitors. In the retrospective study, we reported that the acetylation of two specific lysine residues of histone H4 (K12 and K16) was statistically significantly decreased in patients who were HRD+,5, and these acetylation events were orthogonally validated by immunoblot and parallel reaction monitoring MS in a subsequent publication.12 Genomic analysis of the prospective HGSC samples for either somatic or germline mutations of BRCA1 or BRCA2 indicated that 16 of 83 patients were HRD+. Comparison of histone H4 K12 and K16 acetylation in these samples showed a statistically significant decrease in the acetylation of K12 in histone H4 (Figure 2B) and a similar but less significant decrease in dual acetylation of K12 and K16 (Figure 2C). These results suggest that histone acetylation marks may have potential utility as an indicator of HRD status.
Consistency of mRNA-Protein Correlations by Gene Family
While within-sample correlations of mRNA and protein measurements are fairly consistent, across-sample mRNA-protein correlations for each gene-protein pair are known to be more variable, potentially reflecting gene-specific post-transcriptional regulatory mechanisms.13 When we calculated the correlation between each protein and its cognate mRNA across all 83 tumors (Figure S4A), the results were consistent with our previous report on HGSC5 and with proteogenomic analyses of breast and colorectal cancers,7,14,15 suggesting that there is functional significance to the degree of correlation between cognate mRNA and proteins across multiple cancer types. Briefly, we observed a range of correlations between paired mRNA and protein values, with a median correlation of 0.35 across all 83 samples (Figure S4A). A comparison of the genes representing the top and bottom 10% of correlation values from this study and previous studies is shown in Figure S4B. As observed previously, functional enrichment analysis indicated that genes for nucleotide and amino acid metabolism and interferon response showed good correlation between mRNA and protein, while genes for such housekeeping functions as ribosomes, oxidative phosphorylation, mRNA splicing, and the complement and coagulation cascade were relatively poorly correlated.
Comparison of Protein Expression in Ovarian HGSC and Normal Precursor Tissues
A substantial limitation of the prior proteogenomic analysis of HGSC samples from the TCGA cohort was the absence of an appropriate control for tumor versus normal comparisons at the protein level. In this prospective study, phenotypically normal FT was collected when feasible at the time of surgery, as there is substantial evidence that serous tubal intra-epithelial carcinoma (STIC) lesions in the FT are the dominant precursor lesions for HGSC.16,17 Twenty normal FT samples were characterized, 10 of which were matched with tumor samples from the same patient. Distal fimbrae from uninvolved, phenotypically normal FTs were collected under tight ischemia control of ≤30 min in recognition of the observed effects of ischemia times on the phosphorylation of stress-related kinases.6 As shown in Figure S5A, this tightened control of ischemia time substantially reduced the number of patients with artifactual phosphorylation of p38/MAPK and other stress-responsive pathways. Figure S5B demonstrates that there was no significant difference in the levels of phosphorylation as a function of ischemia time up to 30 min, as determined by PCA.
The availability of prospectively collected FT samples allowed us to interrogate the proteomic dataset for differences in protein expression patterns in HGSC compared to the normal precursor tissue. We identified 509 proteins differentially abundant (log2 fold-change > 2, FDR < 0.05) in HGSC compared to normal tissue (Figure 3A; Table S5). The major difference observed was in proteins that were under-expressed in HGSC compared to FT; 489 proteins were statistically more abundant in FT, compared to 20 that were statistically more abundant in HGSC. As a quality control, we compared protein identifications in HGSC samples, normal FT samples harvested surgically within the prospective cohort, and FTE cell-enriched samples prepared by scraping the mucosal surface of healthy FTs at the time of surgery for benign conditions (cytobrush FTE). Overlap between the surgical FT and cytobrush FTE samples was >50% (3,894 of 7,599 proteins observed in surgical FT were also observed in the cytobrushed samples; Figure S5C), and both samples contained known markers of secretory epithelial cells, most notably oviductal glycoprotein-1 (OGP-1). GSEA analysis indicated that processes associated with DNA repair and DNA replication (e.g., interstrand crosslink repair, regulation of DNA damage response, negative regulation of telomere maintenance, DNA-dependent DNA replication maintenance of fidelity, homologous recombination) were modestly increased in HGSC tissues, while FT appeared to be enriched in proteins associated with muscle processes, immune function, and signaling pathways associated with reproductive and neurological processes (Figure 3B; Table S6), consistent with the histological composition of the FT. To control for proteins associated with non-epithelial components of the FT, we repeated the analysis using only those proteins also observed in the cytobrush FTE preparations (Figure S5D) and still observed an enrichment for immune functions and developmental processes in normal FT compared to tumors.
Figure 3.

Comparison of Protein Abundance in HGSC and Normal FT
(A) Volcano plot representation of differential protein expression in tumor versus normal FT. Proteins with significantly increased or decreased (±2-fold change, Benjamini-Hochberg adjusted p < 0.05) expression in 83 tumors compared to 18 normals are colored red and blue, respectively. The lighter colors are the significantly differential proteins at a lower fold-change threshold of ±1.5. Differentially expressed proteins with the largest fold-changes are labeled. An interactive version of this plot is available at https://doi.org/10.25584/cptac/1601822.
(B) GSEA of Gene Ontology biological process gene sets for cancer versus normal protein differential expression. The clusterProfiler dot plot visualization shows enriched terms as dots, in which the size of the dot represents the gene count and the color corresponds to the statistical significance of the enrichment. The x axis is the proportion of genes that are annotated to a term.
See also Figures S1 and S5.
Enrichment of Proliferation-Associated Kinase Activity in HGSC
We analyzed and compared the phosphoproteomes of the tumor and normal FT samples by assessing the differences in phosphopeptide abundance between the two groups, with and without normalization to changes in protein abundance. Differential phosphoproteomic analysis identified 593 phosphopeptides with higher abundance (2-fold change, Benjamini-Hochberg adjusted p < 0.05) in the HGSC samples, whereas 383 phosphopeptides were found to be more highly abundant in FT samples, indicating that the tumor samples displayed a generalized increase in phosphorylation, and thus increased pathway activation, compared to normal tissues (Figure 4A; Table S5). We examined the differences in pathway representation between tumor and normal FT in both the proteomics and phosphoproteomics data (Figure 4B) and found, similar to our previous observations,5 that phosphoproteomics provided much more robust pathway enrichment than proteomics. However, many identified pathways were significant at both the protein and phosphopeptide levels, including the multifunctional RhoA regulatory pathway. Many of the pathways that were differentially active in tumor versus normal were also previously observed to be more active in short-term survivors compared to long-term survivors (e.g., RhoA, Notch, integrin-like kinase, Rac1).5
Figure 4.

Comparison of Protein Phosphorylation and Kinase Activity in HGSC and Normal FT
(A) Volcano plot of tumor-normal differences in peptide phosphorylation. Phosphopeptides with significantly increased or decreased (±2-fold change, Benjamini-Hochberg adjusted p < 0.05) abundance in tumors compared to normal FT are colored red and blue, respectively. The lighter colors are the significantly differential phosphopeptides at a lower fold-change threshold of ±1.5. An interactive version of this plot is available at https://doi.org/10.25584/cptac/1601822.
(B) Pathway components were compared (2-sided t test) between tumor and normal FT samples for differences in protein and phosphorylation abundance. The top 10 most significant pathways in terms of Benjamini-Hochberg adjusted p value for proteomics and phosphoproteomics data are shown. These pathways exhibit increased phosphorylation in tumors. The notch, integrin-like kinase, and RhoA regulatory pathways emerged as the most activated in this analysis.
(C) Inference of kinase activity in tumors compared to normal using KSEA on phosphopeptides for known kinase substrates. The bar plot shows the relative activity of kinases in tumors versus normal FT. The Z scores are a measure of the enrichment for phosphorylated substrates of a given kinase, with higher scores corresponding to greater activity in the tumors. Kinases with significant (FDR < 0.05) increases in tumors are in red, whereas those with significantly lower activity in tumors are in blue. Darker colors are used for kinases for which phosphorylation changes are independent of abundance changes.
(D) Comparison of DAPK1 phosphorylation at residue S289 in tumor and normal samples.
See also Figures S1 and S5.
We used kinase substrate enrichment analysis (KSEA) to characterize differences in the relative phosphoproteomic profiles of the tumors with respect to the normal tissues (Figure 4C). KSEA is a computational framework for inferring the activation status of signaling kinases from quantitative phosphoproteomic datasets through the changes in the phosphorylation levels of their respective substrates.18,19 Analysis of substrate phosphorylation using KSEA revealed significantly increased activity of CDK1, CDK2, CDK7, and CDK4; the mitotic kinase AURKA; and the mRNA processing-associated kinase CLK1 in tumors. Given the existence of FDA-approved drugs targeting Aurora kinases and CDKs, these results suggest possible therapeutic strategies for HGSC. Normal FT showed increased activation of multiple kinases associated with stress responses and homeostatic regulation. The inferred activation in normal FT of JNK1 kinase (MAPK8) and adrenergic β receptor kinase (ADRBK), a G-protein coupled receptor kinase associated with homeostatic regulation, was significant both as phosphopeptides and as phosphopeptides normalized to protein abundance (Figure 4C; Table S7).
To evaluate the impact of the more tightly controlled ischemia times in the prospective cohort, we repeated KSEA on phosphopeptides that had been filtered conservatively to remove phosphosites known to be affected by ischemia (Figure S5E) using a procedure previously described.5,6 The differences observed between Figures 4C and S5E indicate that improved ischemia control increases the biological insights from the analysis of the prospectively collected samples, specifically in regard to processes that are enriched in the normal FT samples. Of the 22 kinases identified as activated in FT without using the ischemia filter, only 2 kinases, calcium/calmodulin-dependent protein kinase II α (CAMK2A) and protein kinase cyclic adenosine monophosphate-activated catalytic subunit α (PRKACA), passed the ischemia filter. While many of the kinases lost from the analysis are related to the p38-MAPK stress-activated pathway, information regarding the activation of p21-activated protein kinase 2 (PAK2) and rho-associated protein kinase 1 (ROCK1), kinases associated with organization of the actin cytoskeleton and cell motility, would have been lost.
While KSEA identifies high-level pathway alterations, additional biology can be discerned by focusing the analysis of phosphoproteomics data on known phosphorylation sites linked to kinase activity. Significantly differential phosphopeptides were filtered using the PhosphoSitePlus database,20 which highlights modifications known to affect protein function (Table S8). Multiple differential phosphorylation sites with relevant functional consequences were identified in this analysis. For example, increased phosphorylation of death-associated protein kinase 1 (DAPK1) in tumors is relevant to the consistent observation of suppressed apoptosis in cancer (Figure 4D). DAPK1 is a serine-threonine kinase involved in multiple pathways related to cell survival, apoptosis, and autophagy.21 We observed significantly increased phosphorylation in tumors relative to FT at S289 of DAPK1, a site known to suppress apoptosis induced by DAPK1.22
Cell-Cycle Control and Replication Stress in HGSC
KSEA revealed substantial increases in the inferred activity of multiple kinases associated with cell-cycle control, including CDK1, CDK2, AURKA, CDK7, and CDK4 (Figure 4C). This observation prompted a closer look at the possible role of cell-cycle dysregulation and replication stress in HGSC.
RB1 is a tumor suppressor that is frequently deleted in cancer23; unphosphorylated RB1 suppresses proliferation by sequestering the E2F transcription factor, which is released upon phosphorylation.24 Phosphorylated RB1 also promotes apoptosis in response to replication stress and DNA damage.25 Although 70% of SCNAs in HGSC involving RB1 were associated with chromosomal losses, we found only a modest positive correlation of RB1 SCNAs and RB1 protein levels (Pearson correlation r = 0.51); RB1 hyperphosphorylation correlated positively with protein abundance (Pearson correlation r = 0.74), but was largely independent of SCNAs (Pearson correlation r = 0.27; Figure 5A), indicating a general downregulation of the tumor suppressor activities of RB1 in HGSC, mediated at the protein phosphorylation level (Figure 5B; mean average fold-change 1.5; p value 3.7e−27). This observation highlights the power of phosphoproteomics to identify functional changes independent of protein or mRNA abundance.
Figure 5.

Assessment of Relation between SCNA and Protein Levels and RB1 Hyperphosphorylation in HGSC
(A) RB1 was consistently hyperphosphorylated independent of SCNAs. RB1 phosphorylation (boxplots) in all of the samples is shown ordered by the relative abundance of RB1 protein (red dots), and SCNA levels (purple dots). RB1 phosphorylation is correlated with protein abundance (r = 0.74) but is not well correlated with the RB1 SCNA level (r = 0.27).
(B) RB1 phosphorylation level was higher in tumor (n = 83) relative to normal FT tissue (n = 18).
One well-known driver of increased RB1 hyperphosphorylation is the cyclin E-CDK2 complex.26 In our analysis of HGSC, mean CDK2 activity inferred from known substrate phosphorylation levels after removing the contribution from RB1 phosphosites was significantly correlated with mean RB1 phosphorylation (Pearson correlation r = 0.53, p value 7e−7; Figure 6A), similar to observations in colorectal cancer.15 However, examination of individual CDK2 phosphosites in HGSC compared to normal FT showed significantly increased phosphorylation of the two major phosphorylation sites CDK2-Y15 and CDK2-T160 in HGSC (Figure 6B). These two sites have opposing roles in CDK2 function, with Y15 being inhibitory and T160 activating the kinase.27 Although increased phosphorylation at Y15 in tumors would appear to be counterintuitive, there is evidence that distinct subpopulations of CDK2 could be inhibited by Y15 phosphorylation even if the overall CDK2 activity is increased.27 In addition, increased phosphorylation of CDK2 on Y15 has been associated with cell-cycle exit in response to replication stress28,29 and could conceivably constitute a response to mutant TP53-associated replication stress in HGSC. We observed a highly statistically significant correlation between the phosphorylation of CDK2-Y15 and the phosphorylation of RB1-S249 (r = 0.56, p = 0.00054) and RB1-T356 (r = 0.60, p = 0.0002). While these RB1 sites are known to be activating, they have not been previously linked to CDK2 activity.
Figure 6.

Phosphosite Analysis Provides Evidence of Increased Proliferation and Replication Stress in HGSC Compared to Normal FT Tissues
(A) Correlation of mean CDK2 activity inferred from known substrate phosphorylation levels after removing the contribution from RB1 phosphosites, with mean RB1 phosphorylation level.
(B) Comparison of phosphorylation at specific CDK2 phosphosites in tumors (teal; n = 83) versus normal FT (red; n = 18).
(C) Assessment of abundance of FANCD2 phosphosites. Distribution of abundance of phosphosites of FANCD2 in tumors versus normal FT.
(D) Diagram of pathways linking DNA damage, cell-cycle regulation, and replication stress found to be activated in HGSC. As indicated in the figure, proteins colored in salmon are significantly upregulated in tumors, and phosphosites indicated in red are also significantly increased in tumors. The red arrows indicate that the known substrates of the identified kinase show significant increases in phosphorylation.
Examining other cellular components associated with replication stress, we found statistically significant increases in the abundance of FANCD, PARP, CHK1, CDK1, and CDK2; we also observed modest (but not statistically significant) increases in the kinase activity of both ataxia telangiectasia mutated (ATM) and ATM and RAD3-related (ATR) (Z scores are 0.56 and 0.40, respectively), key regulators of DNA repair in response to replication stress.30 FANCD2 is a key component of the Fanconi anemia homologous DNA repair complex,31 and an examination of FANCD2 revealed both increased overall abundance and concomitant phosphorylation at S590 and S592 in HGSC tumors compared to normal FT samples (Figure 6C). At present, very little is known about the functional consequences of specific phosphorylation sites on FANCD2, although its partner FANC1 is known to be activated by phosphorylation.32 We also observed previously undescribed associations between the phosphorylation of CDK2-T160 and the phosphorylation of PARP-S257 (r = 0.79, p = 0.039), and between CDK2-Y15 and 2 sites on nucleophosmin 1 (NPM1) (S243, r = 0.57, p = 0.002; S254, r = 0.58, p = 0.0009). These phosphoproteomics results suggest a possible regulatory mechanism for homologous repair that deserves further investigation.
The activity of the mRNA processing-associated kinase CLK1 was also significantly higher in HGSC compared to that in the normal FT tissues (Figure 4C). In breast cancer, CLK1/4 kinases are involved in the regulation of the alternative splicing of TP53.33 CLK1 also plays a role in the response to replication stress,34 and CLK1 and CLK2 inhibitors have been screened for use in triple-negative breast cancer (TNBC) through compromising the G1-S checkpoint,35 suggesting the potential utility of CLK1 inhibitors in HGSC. Figure 6D illustrates the connections between these activated kinases and the regulation of cell-cycle transit, DNA repair, and replication stress.
Survival Signature from Retrospective HGSC Samples Correlates with Preliminary Survival Data in Prospective Cohort
A key finding of our previous study of retrospective HGSC samples was a regression model-based minimal protein signature capable of predicting overall survival in a held-out test set of patients; “low” scores correlated with decreased survival time.5 The utility of such signatures can only be established by validation in an independent sample set such as the prospective cohort in this study. During the first year of clinical follow-up, there were seven deaths reported within the cohort. In the present study, we applied our 90-protein signature to produce scores for each tumor.
We found that the mean score was lowest (indicative of short survival) in the seven deceased patients, intermediate in the currently surviving patients with tumors, and highest in the normal FT tissues (Figure 7). The difference between the deceased group and the living group was statistically significant (p = 0.03), despite the small number of samples. These results support the ability of our signature to discriminate between short- and long-surviving patients with HGSC at the time of tumor resection, although further mortality data from this cohort will shed more light on the efficacy of the signature.
Figure 7.

Survival Signature Predicts Tumor Status
The survival signature identified in our previous study using retrospective HGSC samples was applied to proteomics data from the present study showing that it significantly discriminated between deceased and surviving patients and had a significantly different profile in normal tissues.
We also examined the possibility that other clinical covariates may be associated with survival status in our current cohort. In our retrospective study, we analyzed the contribution of these clinical variables in a Kaplan-Meier survival model. However, as described previously, the survival analysis for the present study was precluded due to the limited follow-up data available (1 year). Accordingly, we tested for association using a t test for continuous variables (age) and Fisher’s exact test for categorical variables (site of disease, anatomic site of tumor, tumor stage, tumor grade, tumor residual disease, race, weight of tissue sample) in the seven deceased patients versus the other living patients (Table S9), but we found that these variables did not statistically affect mortality (p < 0.05) in this small subset of patients.
Discussion
The most significant opportunity presented in this study of prospectively collected HGSC is the ability to compare the tumor proteome and phosphoproteome with an appropriate normal control for the tissue of origin, in this case FT, based on the current consensus that fallopian STIC lesions are the precursor of HGSC.36,37 Here, we provide an extensive comparison of HGSC and FT at the proteome level and the phosphoproteome level using surgical specimens rather than cell lines. Because TCGA tumor samples were collected with a focus on genomic analyses, DNA from peripheral blood monocytic cells (PBMCs) was used as the “normal control” and somatic mutations in the tumor were identified by comparison to the patient’s own germline DNA from PBMCs. There was no attempt to collect normal adjacent tissue from the same organ as the tumor in most TCGA studies. In addition to germline DNA for the assessment of somatic mutations, we compared tumor tissue to two normal tissue controls, FT and FTE. HGSC showed reduced diversity of the global proteome compared to normal FT; specifically, normal FT featured a higher abundance of proteins associated with immune regulation, including both innate and adaptive immune responses, as well as neutrophil- and leukocyte-mediated immunity. This enrichment was preserved when the comparison was limited to proteins observed in FTE samples obtained by cytobrushing to control for proteins associated with non-epithelial tissue layers (e.g., muscularis, serosa). Although it may seem counterintuitive to observe an increase in immune-associated protein expression in the normal FT compared to the HGSC tumor, several recent proteomic studies have identified “immune desert” subtypes, specifically renal clear cell carcinoma,38 breast cancer,39 and head and neck cancer.40 It is possible that HGSC is dominated by an immune desert phenotype, potentially contributing to the poor prognosis for HGSC patients.
Gain-of-function events in the tumors were most evident in the phosphoproteome and were characterized by a marked increase in relative phosphorylation across multiple phosphoproteins, particularly CDKs and mitotic kinases. Many of the pathways upregulated in association with short survival in retrospective HGSC samples were also enriched in HGSC compared to FT, specifically RhoA, Notch, integrin-like kinase, and Rac. These observations suggest a continuum of pathway activations from normal FT through HGSC, associated with long-term survival, to the most aggressive forms of HGSC, associated with short-term survival. The observed changes are consistent with the upregulation of proteins associated with the cancer hallmarks of proliferation (CDKs and AURKA) and motility and invasion (RhoA and Rac) as well as cell-cell communication (Notch and integrin-like kinase).
In our prior retrospective study of HGSC,5 we derived a survival-associated signature based on differential trans-regulated protein abundance in short-term versus long-term survivors. Using survival data for the first year of clinical follow-up available for patients in the prospective cohort, we determined that tumors from the seven deceased patients had significantly worse survival scores than those from surviving patients, and the normal tissues from all of the patients had better survival scores than from either set of tumors. Further development of these models could promote their use in a precision medicine context to guide the use of targeted therapies either in conjunction with initial platinum treatment or after recurrence. A second clinically relevant observation was the association of decreased histone H4 acetylation, specifically on K12 and K16, with positive HRD status; this observation was confirmed in the prospective cohort. Given the preliminary success of PARP inhibitor therapies in TNBC,41 a robust biomarker for HRD status independent of known pathogenomic mutations in BRCA1 and BRCA2 could be a useful adjunct to guide therapy choices in women with HGSC.
The control of ischemia time in the prospective sample collection process enabled a deeper analysis of the phosphoproteomic data. This stringent criterion allowed us to include the ischemia-responsive p38 and other stress kinases in the analysis of the phosphoproteome. Use of KSEA to infer kinase activity from the phosphorylation status of known kinase substrates indicated significantly increased activation in HGSC of the mitotic kinase AURKA, CDK1, CDK2, CDK4, and CDK7, and the mRNA processing-associated kinase CLK1. All of these kinases are potential targets of therapeutic intervention in HGSC, particularly given the availability of FDA-approved inhibitors for CDKs and Aurora kinases.
In addition to opening the prospect of additional therapeutic strategies for HGSC, characterizing the phosphorylation status of specific, well-annotated phosphosites has the potential to provide insight into HGSC biology. This work shows that RB1 is consistently hyperphosphorylated in HGSC, largely independent of changes in RB1 copy number, thus facilitating a general increase in proliferation that is consistent with the increased phosphorylation of the AURKA mitotic kinase. Comparison of specific phosphorylation sites on CDK2 shows increased phosphorylation of CDK2-T160, which is consistent with increased proliferation and increased phosphorylation of CDK2-Y15. Phosphorylation at this site has been associated with cell-cycle exit in response to replication stress. The latter observation, together with the observed increase in CLK1 activity, suggest a general response to increased replication stress in HGSC that is borne out through the phosphoproteome, as evidenced by increased phosphorylation of PARP, FANCD, and NPM.
Finally, we hypothesize that phosphoproteomics reveals a potential mechanism to explain the high degree of chromosomal instability characteristic of HGSC (Figure 6D). Increased proliferation driven by mitotic kinase activation and RB1 hyperphosphorylation induces a state of replication stress, evidenced by CDK2-pY15, increased CLK1 activity, and increased activity of ATR and ATM. In the presence of impaired capabilities for DNA repair resulting from breast cancer gene 1 and 2 (BRCA1 and 2) mutations or dysregulation of PARP and FANCD, this could result in increased non-homologous end-joining and chromosomal translocations. This pattern of oncogene-driven increased proliferation leading to replicative stress and genomic instability is increasingly recognized as a novel hallmark of cancer.40,42 Therapies that break this cycle by targeting cyclin-dependent kinases or that leverage damaged DNA repair to induce apoptosis (e.g., use of PARP inhibitors) may prove particularly effective in HGSC when used in conjunction with DNA-damaging platinum-based therapies. Although additional research will be required to build a prognostic marker, it is possible that proteomic indicators of replication stress and mitotic kinase activation could eventually be applied to HGSC tissues at the time of cytoreduction, providing guidance on the adjuvant use of targeted therapies with traditional platinum-based therapies.
In conclusion, analysis of prospectively collected HGSC samples from 83 patients provided significant insights stemming from direct comparisons to normal precursor tissues. Key elements of the prior retrospective study were confirmed, including the variation in mRNA-protein correlation by functional group, the consistent enrichment of immune regulatory pathways despite heterogeneity in the focal sites of SCNA, and the performance of a protein abundance-based survival signature to discriminate between short-term survivors (currently deceased) and longer-term survivors (currently alive). Histone H4 acetylation remains a promising indicator of HRD status. Comprehensive analysis of kinase activity, inferred from the phosphorylation of known kinase substrates, suggests a key role for cell-cycle control and replication stress in HGSC, and the identification of multiple CDKs with increased activity in tumors compared to normal tissue suggests a potential application for FDA-approved CDK inhibitors in ovarian cancer.
Consortia
The members of the National Cancer Institute Clinical Proteomic Tumor Analysis Consortium are: Jasmin Bavarva, Emily Boja, Melissa Borucki, Shuang Cai, Steven A. Carr, Daniel Chan, Xian Chen, Karl R. Clauser, Sherri R. Davies, Li Ding, Nathan J. Edwards, Kimberly Elburn, Matthew J. C. Ellis, David Fenyo, Michael A. Gillette, Linda Hannick, Tara Hiltke, Andrew Hoofnagle, Karen A. Ketchum, Christopher R. Kinsinger, Eric Kuhn, Douglas A. Levine, Daniel C. Liebler, Tao Liu, Subha Madhavan, D. R. Mani, Jason E. McDermott, Peter B. McGarvey, Philip Mertins, Mehdi Mesri, Mauricio Oberti, Akhilesh Pandey, Amanda Paulovich, Samuel H. Payne, David F. Ransohoff, Robert C. Rivers, Karin D. Rodland, Henry Rodriguez, Paul A. Rudnick, Kelly Ruggles, Melinda E. Sanders, Zhiao Shi, Ie-Ming Shih, Steven J. Skates, Robert J. C. Slebos, Richard D. Smith, Michael Snyder, Stephen E. Stein, David L. Tabb, Ratna R. Thangudu, Mathangi Thiagarajan, R. Reid Townsend, Negin Vatanian, Yue Wang, Mark Watson, Forest M. White, Jeffery Whiteaker, Gordon A. Whiteley, Bing Zhang, Hui Zhang, Zhen Zhang, Yingming Zhao, Heng Zhu, and Lisa J. Zimmerman.
STAR★Methods
Key Resources Table
| REAGENT or RESOURCE | SOURCE | IDENTIFIER |
|---|---|---|
| Biological Samples | ||
| Primary tumor and normal tissue samples | CPTAC Biospecimen Core Resource | See Experimental Model and Subject Details |
| Patient-derived xenograft tissue samples | Washington University in St. Louis | See Method Details |
| Critical Commercial Assays | ||
| Illumina Barcoded Paired-End Library Preparation Kit | Illumina | Cat#PE-410-1001 |
| Illumina’s Infinium LCG Quad Assay | Illumina | Cat#15025908 |
| TruSeq Stranded RNA Sample Preparation Kit | Illumina | Cat#RS-122-2103 |
| TruSeq Small Total RNA Sample Prep Kit | Illumina | Cat#RS-200-0048 |
| Sequencing grade modified trypsin | Promega | Cat#V517 |
| Tandem mass tags - 10plex | Thermo Scientific | Cat#90110 |
| Ni-NTA Superflow agarose beads | QIAGEN | Cat#30410 |
| Deposited Data | ||
| CPTAC Ovarian raw genomic data | database of Genotypes and Phenotypes (dbGaP) | https://www.ncbi.nlm.nih.gov/gap/, phs000892 |
| Proteomic data | CPTAC Data Portal | https://cptac-data-portal.georgetown.edu/cptac/study/disclaimer?accNum=S038 |
| Software and Algorithms | ||
| mzRefinery | 43 | https://omics.pnl.gov/software/mzrefinery |
| MASIC | 44 | https://github.com/PNNL-Comp-Mass-Spec/MASIC/releases |
| MS-GF+ | 45 | https://omics.pnl.gov/software/ms-gf |
| ProteoWizard | 46 | http://proteowizard.sourceforge.net |
| COSMIC | 47 | https://cancer.sanger.ac.uk/cosmic |
| SomaticWrapper | N/A | https://github.com/ding-lab/somaticwrapper |
| Mutect1 | 48 | https://software.broadinstitute.org/cancer/cga/mutect |
| Strelka1 | 49 | https://github.com/Illumina/strelka |
| VarScan2 | 50 | https://dkoboldt.github.io/varscan/ |
| Pindel | 51 | https://github.com/genome/pindel |
| dbSNP | 52 | https://www.ncbi.nlm.nih.gov/snp |
| CrossMap | 53 | http://crossmap.sourceforge.net/ |
| GermlineWrapper | N/A | https://github.com/ding-lab/germlinewrapper |
| GATK | 54 | https://gatk.broadinstitute.org |
| Variant Effect Predictor (VEP) | 55 | https://uswestembl.org/info/docs/tools/vep/index.html |
| CharGer | 56 | https://github.com/ding-lab/CharGer |
| ExAC | 57 | http://exac.broadinstitute.org/ |
| ClinVar | 58 | https://www.ncbi.nlm.nih.gov/clinvar/ |
| gnomAD | 57 | https://gnomad.broadinstitute.org/ |
| SIFT | 59 | N/A |
| PolyPhen | 60 | N/A |
| Integrative Genomics Viewer (IGV) | 61 | https://software.broadinstitute.org/software/igv/ |
| GISTIC 2.0 | 9 | N/A |
| MultiOmicsViz | 62 | 10.18129/B9.bioc.multiOmicsViz |
| clusterProfiler | 63 | 10.18129/B9.bioc.clusterProfiler |
| limma | 64 | 10.18129/B9.bioc.limma |
| KSEAapp | 19 | https://cran.r-project.org/web/packages/KSEAapp/index.html |
Lead Contact and Materials Availability
Further information and requests for resources and reagents should be directed to and will be fulfilled by the Lead Contact, Karin Rodland (karin.rodland@pnnl.gov). This study did not generate new unique reagents.
Experimental Model and Subject Details
Specimens and Clinical Data
Ovarian tumor, normal Fallopian tube (FT), and blood samples were collected from 100 women between the ages of 36 and 86. Tissues were collected at twelve Tissue Source Sites (TSS) in strict accordance to the CPTAC-2 ovarian cancer procurement protocol, and institutional review boards at each TSS reviewed protocols and consent documentation, in adherence to Clinical Proteomic Tumor Analysis Consortium (CPTAC) guidelines. Of the 100 HGSC cases collected, 83 had both tumor and FT that passed molecular qualification, while ten patients provided FT only, as the tumor failed molecular qualification, due to insufficient yield, poor gel scores, or RIN values below 7, as described in more detail below. The inclusion criteria encompassed newly diagnosed, untreated patients undergoing primary surgery for high grade serous adenocarcinoma of the ovary. Patients with prior history of other malignancies within twelve months, any systematic chemotherapy, endocrine or biological therapy as well as prior radiation therapy to the abdomen or pelvis for any cancer type were excluded from the study. Required clinical information regarding patient history and status of surgery along with relevant diagnostic information were collected using case reports forms. One-year follow-up information and updated history after completion of the initial treatment regimen were also collected through follow-up forms. De-identified pathology reports and representative diagnostic slide images were utilized to review and qualify cases for this study. Peripheral venous blood was collected from each patient prior to administration of anesthesia. Segments from qualified tumor specimens were greater than 300 mg in mass with at least 60% tumor cell nuclei and less than 20% necrosis. Tissue and the adjacent normal specimens were collected with less than 30 min total ischemic time and embedded in optimal cutting temperature (OCT) compound for processing at a common CPTAC-2 Biospecimen Core Resource (BCR) center. Pathologically-qualified cases underwent further molecular qualification for extraction and co-isolation of nucleic acids. Tissue segments that passed pathology and molecular qualifications were shipped to proteomic characterization centers. DNA and RNA from the same tumor segment and DNA from germline blood were further aliquoted and quantified per protocol. DNA quality was confirmed using gel electrophoresis and Nano drop methods. RNA quality was confirmed using Nano drop and Agilent bioanalyzer. Sufficient yield, a good gel score and a RIN value of 7 or greater qualified the DNA and RNA for sequencing, respectively. Analytes were then shipped to the sequencing center. Corresponding clinical data were formatted and distributed through the CPTAC data coordinating center (https://cptac-data-portal.georgetown.edu/cptac/study/disclaimer?accNum=S038) and are summarized in Table S1.
Method Details
Protein Extraction and Tryptic Digestion
The tumor and normal Fallopian tube tissue samples were obtained as pulverized OCT-embedded tissues through the CPTAC BCR. Approximately 50 mg of each of the samples were homogenized separately in 600 μL of lysis buffer (8 M urea, 100 mM NH4HCO3, pH 7.8, 0.1% NP-40, 0.5% sodium deoxycholate, 10 mM NaF, phosphatase inhibitor cocktail 2, phosphatase inhibitor cocktail 3, 20 μM PUGNAc). Lysates were precleared by centrifugation at 16,500 g for 5 min at 4°C and protein concentrations were determined by BCA assay (Pierce). Proteins were reduced with 5 mM dithiothreitol for 1 h at 37°C and subsequently alkylated with 10 mM iodoacetamide for 1 h at 25°C in the dark. Samples were diluted 1:2 with 100 mM NH4HCO3, 1 mM CaCl2 and digested with sequencing-grade modified trypsin (Promega) at 1:50 enzyme-to-substrate ratio. After 4 h of digestion at 37°C, samples were diluted 1:4 with the same buffers and another aliquot of the same amount of trypsin was added to the samples and further incubated at 25°C overnight (∼16 h). The digested samples were then acidified with 10% trifluoroacetic acid to ∼pH 2. Tryptic peptides were desalted on strong cation exchange SPE (Supelco) and reversed phase C18 SPE columns (Supelco) and dried using Speed-Vac.
TMT-10 Labeling of Peptides
Desalted peptides from each sample were labeled with 10-plex Tandem Mass Tag (TMT) reagents according to the manufacturer’s instructions (ThermoScientific). Peptides (300 μg) from each of the samples were dissolved in 300 μL of 50 mM HEPES, pH 8.5, and mixed with 3 units of TMT reagent that was dissolved freshly in 123 μL of anhydrous acetonitrile. Channel 131 was used for labeling the internal reference sample (pooled from all tumor and normal samples with equal contribution) throughout the sample analysis. After 1 h incubation at RT, 24 μL of 5% hydroxylamine was added and incubated for 15 min at RT to quench the reaction. Peptides labeled by different TMT reagents were then mixed, dried using Speed-Vac, reconstituted with 3% acetonitrile, 0.1% formic acid, and desalted on C18 SPE columns.
Peptide Fractionation by Basic Reversed-phase Liquid Chromatography
Approximately 2.5 mg of 10-plex TMT-labeled sample was separated on a Waters reversed-phase XBridge C18 column (250 mm × 4.6 mm column containing 5-μm particles, and a 4.6 mm × 20 mm guard column) using an Agilent 1200 HPLC System. After sample loading, the C18 column was washed for 35 min with solvent A (5 mM ammonium formate, pH 10.0), before applying a 100-min LC gradient with solvent B (5 mM ammonium formate, pH 10, 90% acetonitrile). The LC gradient began with a linear increase of solvent A to 10% B in 2 min, then linearly increased to 45% B in 78 min, 10 min to 42.5% B, 10 min to 100% B. The gradient then resolved to 100% solvent A in ten minutes. The flow rate was 0.5 mL/min. A total of 96 fractions were collected into a 96-well plate throughout the LC gradient. These fractions were concatenated into 24 fractions by combining four fractions that are 24 fractions apart (i.e., combining fractions #1, #25, #49, and #73; #2, #26, #50, and #74; and so on). For proteome analysis, 5% of each concatenated fraction was dried and resuspended in 2% acetonitrile, 0.1% formic acid to a peptide concentration of 0.1 μg/μL for LC-MS/MS analysis. The remainder of the concatenated fractions (95%) were further concatenated into twelve fractions by combining two concatenated fractions (i.e., combining concatenated fractions #1 and #13; #3 and #15; and so on), dried, and subjected to immobilized metal affinity chromatography (IMAC) for phosphopeptide enrichment.
Phosphopeptide Enrichment Using IMAC
Fe3+-NTA-agarose beads were freshly prepared using Ni-NTA Superflow agarose beads (QIAGEN) for phosphopeptide enrichment. For each of the twelve fractions, peptides were reconstituted in 400 μL IMAC binding/wash buffer (80% acetonitrile, 0.1% formic acid) and incubated with 20 μL of the 50% bead suspension for 30 min at RT. After incubation, the beads were washed two times each with 100 μL of wash buffer on the stage tip packed with two discs of Empore C18 material. Phosphopeptides were eluted from the beads on C18 using 70 μL of Elution Buffer (500 mM K2HPO4, pH 7.0). 50% acetonitrile, 0.1% formic acid was used to elute phosphopeptides from the C18 stage tips. Samples were dried using Speed-Vac and later reconstituted with 10 μL of 3% acetonitrile, 0.1% formic acid for LC-MS/MS analysis.
LC-MS/MS for Global Proteome Analysis
The global proteome fractions were separated using a nanoAquity UPLC system (Waters Corporation) by reversed-phase HPLC. The analytical column was manufactured in-house using ReproSil-Pur 120 C18-AQ 1.9 μm stationary phase (Dr. Maisch GmbH) and slurry packed into a 30-cm length of 360 μm o.d. x 75 μm i.d. fused silica containing a 3-mm sol-gel frit. The trapping column was manufactured in-house using Jupiter 300 C18 5-um stationary phase (Phenomenex) and slurry packed into a 4-cm length of 360 μm o.d. x 150 μm i.d. fused silica with the final column being sol-gel fritted on both ends. The analytical column was heated to 50°C using an AgileSLEEVE column heater (Analytical Sales and Services, Inc.). The analytical column was equilibrated to 95% Mobile Phase A (MP A, 0.1% formic acid in water) and 5% Mobile Phase B (MP B, 0.1% formic acid in acetonitrile) and maintained at a constant column flow of 200 nL/min. The injected sample (5 μL) was trapped using 100% MP A for 10 min at flow rate of 3 μL/min before being placed in-line with the analytical column and subjected to the gradient profile (min:%MP B): 0:5, 1:8, 44:15, 85:30, 94:55, 102:70, 105:95, 108:95, 115:5, 150:5.
MS analysis was performed using a Q-Exactive Plus mass spectrometer (Thermo Scientific, San Jose, CA). Electrospray voltage (2.2 kV) was applied at a carbon composite union (Valco Instruments Co. Inc.) between the analytical column and electrospray emitter (chemically etched 360-um o.d. x 20-um i.d.). The ion transfer tube was set at 250°C. Following a 15-min delay from the end of sample trapping, Orbitrap precursor spectra (AGC 1x10⁶) were collected from 300-1800 m/z for 120 min at a resolution of 70K along with the top twelve data-dependent Orbitrap HCD MS/MS spectra at a resolution of 35K (AGC 1x10⁵) and max ion time of 100 msec. Masses selected for MS/MS were isolated at a width of 0.7 m/z and fragmented using a normalized collision energy of 32%. Peptide match was set to ‘”preferred,” exclude isotopes was set to ”on,” and charge state screening was enabled to reject unassigned 1+, 7+, 8+, and > 8+ ions with a dynamic exclusion time of 20 s to discriminate against previously analyzed ions.
LC-MS/MS for Phosphoproteome Analysis
Phosphoproteome fractions were separated using a nanoAquity UPLC system by reversed-phase HPLC. The analytical column was manufactured in-house using ReproSil-Pur 120 C18-AQ 1.9 μm stationary phase and slurry packed into a 35-cm length of 360 μm o.d. x 50 μm i.d. fused silica picofrit capillary tubing (New Objective, Inc.). The trapping column was manufactured in-house using Jupiter 300 C18 5-μm stationary phase (Phenomenex) and slurry packed into a 4-cm length of 360 μm o.d. x 150 μm i.d. fused silica, with the final column being sol-gel fritted on both ends. The analytical column was heated to 50°C using an AgileSLEEVE column heater. The analytical column was equilibrated to 98% MP A and 2% MP B and maintained at a constant column flow of 120 nL/min. The injected sample (5 μL) was trapped using 100% MP A for 5 min at flow rate of 3 μL/min before being placed in-line with the analytical column and subjected to the gradient profile (min:%MP B): 0:2, 8:4, 50:15, 85:35, 94:60, 95:95, 105:95, 115:2, 170:2.
MS analysis was performed using an Orbitrap Fusion Lumos mass spectrometer (Thermo Scientific). Electrospray voltage (1.8 kV) was applied at a Valco carbon composite union coupling a 360 μm o.d. x 20 μm i.d. fused silica extension from the LC gradient pump to the analytical column and the ion transfer tube was set at 250°C. Following a 40-min delay from the end of sample trapping, Orbitrap precursor spectra (AGC 4x10⁵) were collected from 350-1800 m/z for 120 min at a resolution of 60K along with data-dependent Orbitrap HCD MS/MS spectra (centroided) at a resolution of 50K (AGC 1x10⁵) and max ion time of 105 msec for a total duty cycle of 2 s. Masses selected for MS/MS were isolated (quadrupole) at a width of 0.7 m/z and fragmented using a collision energy of 30%. Peptide mode was selected for monoisotopic precursor scan and charge state screening was enabled to reject unassigned 1+, 7+, 8+, and > 8+ ions with a dynamic exclusion time of 45 s to discriminate against previously analyzed ions between ± 10 ppm.
Construction and Utilization of the Comparative Reference Samples
As a quality control measure, two “Comparative Reference” (“CompRef”) samples were generated as previously described65,66 and used to monitor the longitudinal performance of the proteomics workflow throughout the course of this study. Briefly, patient-derived xenograft (PDX) tumors from established basal and luminal breast cancer intrinsic subtypes were raised subcutaneously in 8-week old NOD.Cg-Prkdcscid Il2rgtm1Wjl/SzJ mice (Jackson Laboratories, Bar Harbor, ME) using procedures reviewed and approved by the Institutional Animal Care and Use Committee at Washington University in St. Louis. Xenografts were grown in multiple mice, pooled, and cryopulverized to provide a sufficient amount of uniform material for the duration of the study. Full proteome and phosphoproteome process replicates of each of the two CompRef samples were prepared and analyzed as standalone 10-plex TMT experiments alongside every four TMT-10 experiments of the study samples, using the same analysis protocol as the patient samples. These interstitially analyzed CompRef samples were evaluated for depth of proteome and phosphoproteome coverage and for consistency in quantitative comparison between the basal and luminal models (i.e., basal/luminal ratios across different replicates and batches; Figure S1C).
Global Proteome Analysis of Fallopian Tube Epithelial Cells
Ten Fallopian tube epithelial (FTE) cell samples were freshly collected using cytobrush techniques at University of Connecticut Health Center (Dr. Molly Brewer) from patients undergoing surgery for benign gynecological conditions. The cell pellets were lysed in 50 mM NH4HCO3, pH 7.8 with intermittent sonication on ice. Trifluoroethanol (TFE) was then added to the samples at 50% (v/v) concentration and incubated at 60°C for 2 h. After being reduced with 2 mM dithiothreitol for 1 h at 37°C, the samples were diluted 1:5 with 50 mM NH4HCO3 (i.e., 10% TFE) and digested with sequencing grade modified trypsin (Promega) at 1:50 enzyme-to-substrate ratio for 3 h at 37°C. The resulting tryptic peptides were concentrated using Speed-Vac, and the peptide concentration was measured using the BCA assay. Two pooled samples, each with 100 μg of total peptides, were created by equally mixing five samples and subjected to fractionation via bRPLC as described above, generating 24 fractions for each pooled sample. Each fraction was analyzed by LC-MS/MS using conditions similar to those in the ovarian cancer tissue global proteome analysis (described above), except for a resolution of 35,000 at the MS level and 17,500 at the MS/MS level and an isolation window of 2.0 m/z that were used in the label-free analysis of the FTE cell samples. The resulting data were searched against the same protein sequence database and filtered in the same fashion for assembling the final list of protein identifications.
Genotyping Array Analysis
Genomic DNA samples were prepared according to the Illumina Infinium LCG Quad Assay manual protocol. Processed samples were loaded on HumanOmni5-Quad BeadChips and run on the HiScan platform. SNP and SCNA genotyping were performed with the Genome Studio Genotyping Module. Although these data were not used in the final analysis due to limited dynamic range, the data are publicly accessible through the Data Coordinating Center.
Whole Exome Sequencing
Genomic DNA samples were used to prepare indexed libraries using the Nextera Rapid Capture Exome kit from Illumina. Library preparation was performed using a semi-automated 96-well plate method, with washing and clean-up/concentration steps performed on the Beckman Coulter Biomek NXP platform and with ZR-96 DNA Clean & Concentrator-5 plates, respectively. Libraries were quantified using the Agilent 2100 Bioanalyzer. Pooled libraries were run on HiSeq4000 (2x150 paired end runs) to achieve a minimum of 150x on target coverage per each sample library. The raw Illumina sequence data were demultiplexed and converted to fastq files, and adaptor and low-quality sequences were trimmed. Whole exome sequencing (WXS) data were used for somatic mutation detection, germline variant detection, pathogenicity annotation of germline variants, and somatic copy number alteration (SCNA) analysis as described below.
Somatic Mutation Detection
We used SomaticWrapper (available on GitHub at https://github.com/ding-lab/somaticwrapper) to perform somatic mutation calling. In SomaticWrapper, we incorporated four mutation callers, Mutect1 (3.1-0-g72492bb), Strelka1 (1.0.14), VarScan2 (2.3.8) and Pindel (0.2.5b9-20160729). The raw calls were subjected to individual somatic filtering steps. We removed germline variants by filtering variants that exist in dbSNP but not in the COSMIC database. We used GATK (3.7-0-gcfedb67) to combine variants from different callers. For single nucleotide variants (SNVs), only the calls called by more than two out of three callers (Strelka1, VarScan2, and Pindel) were retained. For insertions and deletions (INDELs), only those called by more than two out of three callers (Strelka1, VarScan2, and Pindel) were retained. We later applied tumor variant allele frequency (VAF) filtering (> = 5%) and normal VAF filtering (≤2%) on the merged mutation calls. To obtain high-quality somatic indel calls, we restricted the indel size to less than 100 nts. Finally, the genomic coordinates of the mutation calls were lifted over from hg19 to hg38 by CrossMap v0.3.3 using UCSC chain file hg19ToHg38.over.chain.gz.
Germline Variant Detection
We used the GermlineWrapper pipeline (available on GitHub at https://github.com/ding-lab/germlinewrapper) to call germline variants. In GermlineWrapper, we used GATK (3.7-0-gcfedb67), VarScan2 (2.3.8), and Pindel (0.2.5b9-20160729) to call germline variants from normal samples. For single nucleotide polymorphism (SNPs), we took the union of calls from both GATK and VarScan2. Finally, we retained on those indels called by both GATK and VarScan or by Pindel. Cutoffs of a minimum of 10X coverage and 20% VAF were used in the final step to report the high-quality germline variants.
Pathogenicity Annotation of Germline Variants
Germline variants were annotated using the Ensembl Variant Effect Predictor (VEP)55 (version 85 with default parameters, except where–everything). Pathogenicity of germline variants was determined with our automatic pipeline CharGer56 (https://github.com/ding-lab/CharGer), which annotates and prioritizes variants based on AMP-ACMG guidelines.67 This pipeline implements twelve pathogenic and four benign evidence levels using several datasets, including ExAC and ClinVar (parsed through MacArthur lab ClinVar; https://github.com/macarthur-lab/clinvar), and computational tools including SIFT59 and PolyPhen.60 The detailed implementation and score of each evidence level are as previously described.68
Variants prioritized by CharGer were further filtered for rare variants with ≤ 0.05% allele frequency in ExAC (release r0.3.1) and gnomAD (release 2.1). We then selected for cancer-relevant pathogenic and likely pathogenic variants, based on whether they were found in the curated cancer variant database or in the curated list of 152 cancer predisposition genes compiled as previously described.68 Special focus was given to variants in genes of interest to ovarian cancer, such as BRCA1 and BRCA2, as well as Fanconi Anemia-related genes. Resulting variants were manually reviewed using Integrative Genomics Viewer (IGV) software61 (version 2.4.18) using both normal and tumor data. Variants that passed manual review with low allele frequencies (MAF < 0.05%) were further evaluated for loss-of-heterozygosity (LOH) by comparing VAF in tumor and normal samples using a Fisher’s exact test. LOH was considered significant at p value ≤ 0.05.
Somatic Copy Number Alteration Analysis
We used the GATK (version 4. beta.5) CNV workflow to detect somatic copy number variations in WXS data. This platform initially collects proportional coverage using target intervals and WXS BAM files. GC-correction was applied to the derived coverage using the CorrectGCBias module, and a CNV panel of normals was created to remove the batch effect from the tumor samples. The resulting coverage data were then normalized and segmented. Finally, our workflow called copy number variants after filtering out copy number neutral regions and outlier coverage regions (using default parameters).
For quality control, we compared germline and somatic copy number variation. We found one group of cases with evidence of switched tumor and normal samples, shown by the germline CNV profiles resembling somatic CNV profiles, and vice-versa. This switch was further indicated by those cases having significantly fewer somatic mutations than the rest of the cohort. Swapping the tumor and normal sequencing files (BAMs) before re-processing CNV and somatic mutations eliminated the issue and rescued many important somatic mutations, including TP53. The sample swap issue was limited to exome sequencing data.
Significantly altered regions of amplification and deletion across the tumor population were identified using the Genomic Identification of Significant Targets in Cancer (GISTIC) 2.0 algorithm9 on the segmented copy number profiles of the tumor samples. The GISTIC algorithm uses relative copy number data to determine significantly aberrant regions of somatic copy number alteration across a set of tumors. The algorithm calculates a G-score for each locus that accounts for both the frequency and the amplitude of observed alterations across the set of samples. Separate scores are computed for gains and losses. Only SCNAs that met relatively high thresholds of copy number changes (in log2-space) > 0.3 (amplification) or < −0.3 (deletion) were included in the computations. Statistical significance of the aberrations is determined by comparing the observed statistics against a random distribution obtained by a permutation of the data in each dataset. The p values are corrected for multiple hypotheses testing. A q-value cutoff of 0.05 was used to identify significant alterations. SCNA profiles are divided into arm-level and focal alterations. Significant aberrant regions that span more than half of the chromosome arm are characterized as arm-level events whereas regions smaller than this length are labeled focal events.
mRNA Sequencing
Indexed cDNA sequencing libraries were prepared from the RNA samples using the TruSeq Stranded RNA Sample Preparation Kit and bar-coded with individual tags. Library preparation was performed similarly to the method used for WXS. Quality control was performed at every step, and the libraries were quantified using the Agilent 2100 Bioanalyzer. Indexed libraries were prepared as equimolar pools and run on the HiSeq4000 platform (2x150 paired end runs) to generate a minimum of 30 million paired-end reads per sample library. The raw Illumina sequence data were demultiplexed and converted to. fastq files, and adaptor and low-quality sequences were trimmed.
RNA-Seq Data Analysis
mRNA sequencing reads were mapped to human genome hg19 by STAR (version 2.5.3a) using the one-pass model. Hg19 sequence and genome annotation were downloaded from NCBI RefSeq (03/29/2017). RSEM (version 1.2.31) was used to quantify gene and transcript expression levels. Gene read counts were calculated by HTseq (version 0.7.2) based on the above annotation. The RSEM output, including the mRNA RSEM and FPKM (Fragments Per Kilobase of transcript per Million mapped reads) results, were reported in table format (Table S3).
Quantification and Statistical Analysis
Quantification of Global Proteomics Data
LC-MS/MS analysis of the TMT10-labeled, bRPLC fractionated samples generated a total of 288 global proteomics data files. The Thermo RAW files were processed with mzRefinery43 to characterize and correct for any instrument calibration errors and then with MS-GF+45,69 (v9881) to match against the RefSeq human protein sequence database released on September 14, 2016 (37,593 proteins) combined with 149 contaminants (e.g., trypsin, keratin). The partially tryptic search used a ± 10 ppm parent ion tolerance, allowed for isotopic error in precursor ion selection, and searched a decoy database composed of the forward and reversed protein sequences. MS-GF+ settings included static carbamidomethylation (+57.0215 Da) on Cys residues, TMT modification (+229.1629 Da) on the peptide N terminus and Lys residues, and dynamic oxidation (+15.9949 Da) on Met residues for searching the global proteome data.
Peptide identification stringency was tuned to a PepQValue < 0.005 and a parent ion mass deviation < 7 ppm criteria such that it did not exceed false discovery rate (FDR) of 1% at the unique peptide sequence level. The minimum number of unique peptides per 1,000 amino acids of protein length was also explicitly evaluated, and a minimum of six peptides per 1000 AA was finally applied to achieve 1% FDR at the protein level within the full dataset. Inference of the parsimonious protein set resulted in 10,706 protein identifications (an average of 9,769 proteins per sample), with 8,184 proteins common among all 103 samples (Table S2).
The intensities of all ten TMT reporter ions were extracted using MASIC software.44 Next, PSMs were linked to the extracted reporter ion intensities by scan number. The reporter ion intensities from different scans and different bRPLC fractions corresponding to the same protein were summed. Relative protein abundance was calculated as the ratio of abundance in a given sample to the reference abundance. The pooled reference sample was labeled with TMT 131 reagent, allowing comparison of relative protein abundances across different TMT-10 plexes. The relative abundances were log2 transformed and zero-centered for each protein to obtain final, relative abundance values.
Small differences in sample handling and BCA assay measurement errors can result in detectable systematic, sample-specific bias in the quantification of protein levels. To mitigate these effects, we computed the median, log2 relative protein abundance for each sample and re-centered to achieve a common median of 0. The final processed global proteome data table is available in Table S2; raw proteomic data is available via the CPTAC Data Portal (https://cptac-data-portal.georgetown.edu/cptac/study/disclaimer?accNum=S038).
Quantification of Phosphopeptides
Phosphopeptides were identified from the 144 phosphoproteomics data files as described above (e.g., peptide level FDR < 1%), with an additional dynamic phosphorylation (+79.9663 Da) on Ser, Thr, or Tyr residues. A total of 49,616 phosphopeptides were identified. The phosphoproteome data were further processed by the Ascore algorithm70 for phosphorylation site localization, and the top-scoring sequences were reported. For phosphoproteomic datasets, the TMT-10 quantitative data were not summarized by protein but remained at the phosphopeptide level (Table S2).
All the peptides (phosphopeptides and global peptides) were labeled with TMT-10 reagent simultaneously, and the enrichment of phosphopeptides using IMAC was performed after the labeling. Thus, all the biases upstream of labeling are assumed to be identical between global and phosphoproteomics datasets. Therefore, to account for sample-specific biases in the phosphoproteome analysis we applied the correction factors derived from mean-centering the global proteomic dataset.
In addition to the original phosphorylation abundances, phosphorylation site occupancy ratios (i.e., the relative extent of phosphorylation) were calculated by subtracting the log2 relative abundance of the parent protein (reflecting the overall abundance) from the phosphopeptide (Table S2). The resulting phosphopeptide values reflect the changes in relative phosphorylation rates of the protein and are not confounded by changes in expression of the protein itself.
The proteomics data quality has been carefully evaluated in terms of both proteome coverage and quantitation. The relative abundances of the proteins and phosphopeptides across the tumor and normal tissue samples were quantified using a universal reference strategy as reported recently,5,7 applying a stringent 1% FDR cutoff at the protein level. The consistency of the proteomics pipeline was demonstrated in both the protein sequence coverage in the proteome data (Figure S1B) and the quantitation reproducibility in the external quality controls comparing two breast cancer patient-derived xenograft samples (i.e., CompRef samples, see “Construction and Utilization of the Comparative Reference Samples” above) that were analyzed alongside the ovarian tumors and normal tissue samples using the same proteomics pipeline (Figure S1C). Note that it was the ratio between two different xenograft samples, not the quantitation values of just one sample, that was compared in Figure S1C for correlation. We have successfully used such external QCs to effectively monitor the performance of the proteomics pipeline over time in previous analyses.5,7,71
Isobaric labeling based quantitation could have interference-based compression compared to the label-free methods; however, we have performed extensive fractionation to significantly reduce the sample complexity in each individually analyzed fraction, thus effectively alleviating such compression issues. The consistency and robustness of the quantitation results were also demonstrated in the PCA analysis of the entire global proteome and phosphoproteome datasets: the tumors were readily separated from the normal FT tissues (Figure S1D).
Identification and Quantification of Acetylated Histone H4
In order to identify specific sites of acetylation using TMT global proteomic data, we performed the search similarly yet with the addition of a dynamic acetylation to lysine (+42 Da). The PSMs were filtered by (1) FDR < 1%, (2) number of missed cleavage sites no greater than 2, (3) at least 3 PSMs for an identified peptide, and (4) at least 3 peptides for an identified protein. Each identified PSM was quantified using TMT reporter ion intensities.
Gene-wise Correlation between Different Platforms
We calculated gene-wise correlations between RNA-seq and TMT proteomics that were quantifiable in both platforms. The Spearman correlation between the two platforms was calculated for each gene across all the samples.
Correlation of Somatic Copy Number Alterations with mRNA/protein Abundance
To determine the consequences of copy number variation on mRNA and protein expression, we carried out a correlation analysis as previously described14 and implemented in the R package MultiomicsViz.62 The datasets were initially ordered in terms of their chromosomal location. mRNA expression was transformed to log2 fold change versus mean expression of each gene. The Spearman rank correlation was then calculated for the genes quantified in all samples in the SCNA dataset for each gene with complete data in both the mRNA and proteomic datasets using the corresponding measurements for the 81 overlapping samples between the SCNA, mRNA, and proteomic matrices. The p values for the correlation were also determined to assess statistical significance. The p values were adjusted for multiple-testing correction by applying the Benjamini-Hochberg procedure across each set of p values of the correlations of each SCNA with the proteins. SCNA-protein correlations (positive or negative) with an adjusted p value below 0.05 were deemed to be significant. Functional enrichment analysis for gene sets represented in the group of proteins in the SCNA loci with the strongest trans effects was carried out using clusterProfiler63 at an FDR of 0.05 to determine enriched gene ontology biological processes.
Tumor versus Normal Differential Proteomic Analysis
For the proteomic dataset, peptides were aggregated to the gene level by computing their mean abundance. Two normal samples, N02OV001 and N17OV001, were removed from all tumor-normal comparisons based on quality control analysis. Proteins with missing values in any of the samples were dropped, yielding 7,599 complete proteins that were tested for statistically significant differential abundance between tumor and normal samples. Differential abundance analyses were conducted using empirical Bayes moderated t tests via the Bioconductor package limma.64 To correct for multiple testing, the Benjamini-Hochberg procedure was used to control the FDR. Gene-set enrichment analysis was conducted using the R package clusterProfiler63 with the list of proteins tested for differential expression and their corresponding log fold-changes as determined by limma as input. Gene symbols were mapped to their Entrez ids and ranked according to their log fold-change values. ClusterProfiler calculated normalized enrichment scores (NES) and FDR values for gene sets in GO BP. An FDR cutoff of 0.05 was used to designate significant enrichment of pathways. This differential expression analysis was repeated and restricted to the set of proteins that overlapped with cytobrush FTE samples (Figure S5D).
Tumor versus Normal Differential Phosphoproteomic Analysis
Non-normalized phosphoproteomics data were reduced to the phosphosite level by averaging phosphopeptides that mapped to the same site. As with the corresponding proteomic analysis, samples N02OV001 and N17OV001 were discarded. Phosphosites with missing values in at least half of either the tumor or the normal samples were filtered out, resulting in 7,215 phosphosites for further downstream analysis. Differential expression analysis to characterize changes in phosphoproteomic levels between tumors and the FT samples were conducted as described in the preceding subsection using limma to calculate the fold changes and associated adjusted p values for each phosphosite. The differential expression results were then used to determine kinase activity using KSEA18 implemented in the R package KSEAapp.19 KSEA computes a normalized score to measure relative kinase activity in test versus control using the difference in the mean log fold-changes of predefined substrate groups of the kinase, as referenced from the PhosphoSitePlus20 (July 2016) and NetworKIN72 databases. In the latter database, kinase-substrate annotations with a NetworKIN score below five are discarded. The mean log fold-changes of all the substrates are divided by the standard deviation of log fold-changes across all phosphosites, followed by an adjustment to the score for the number of substrates in the data that annotate to the kinase. The statistical significance of the scores is calculated using a one-tailed z-test followed by BH multiple testing correction. Kinases with z-scores with corresponding p values below 0.05 were considered to be significant. The KSEA analysis was repeated after filtering out phosphorylation sites known to be altered by ischemia6 (Figure S5E).
Pathway activity was compared between the tumor and normal samples using the method described in our previous study5. Phosphopeptides from the stoichiometrically corrected phosphoproteomics data were mapped to pathways in NCI PID using gene symbols. For each pathway, the relative abundances of all phosphopeptides mapping to the pathway were compared between tumor and normal samples using a two-tailed t test followed by FDR correction using the Benjamini-Hochberg procedure. A similar analysis was performed with the global proteomics data.
Phosphoproteomics Pathway Analysis Across Cohorts
To identify potential improvement in phosphoproteome quality resulting from improved ischemia control, we compared the pathway activity of the retrospective and prospective cohorts using KEGG, Reactome and BioCarta pathway collections. For each patient in a particular cohort, we tested for enrichment for a specific pathway by comparing the abundance of phosphosites on proteins in the pathway against that of all other phosphosites in the dataset using a Kolmogorov-Smirnov test, adjusted for multiple hypothesis testing using the Benjamini-Hochberg approach. An adjusted p value threshold of 0.05 was used to determine significant enrichment. The number of patients for which the pathway was enriched was used as a measure of overall activity of the pathway in the cohort for purposes of comparing across the retrospective and prospective cohorts. Figure S5A depicts a scatterplot of the number of patients for which a pathway was determined to be significantly enriched in the two datasets.
NetFill Analysis Linking CIN Score Associated Proteins Across Cohorts
Proteogenomic analysis of HGSC tumor tissues from the TCGA cohort and the current prospectively collected cohort both identified a relatively small number of proteins that are highly associated with CIN score. A common issue when comparing discoveries across multiple studies is that the results may not overlap on the surface. To compare and interpret the results beyond simple Venn diagrams, we applied an in-house software package, NetFill, to identify a parsimonious set of molecular mediators to connect the results from the current and the TCGA cohorts. NetFill inputs information from multiple interactome databases and formulates the solution as a linear programming problem under constraints.
Survival Analysis
This was performed by first applying the four individual models (a set of proteins and weights) to the proteomics data reported in the current study to get scores, then averaging the resulting scores to get an overall predictive score for each sample. We note that in the previous study we used a voting method to combine results from the different models, but that was because the survival analysis (which we could not reasonably perform on the current cohort) allowed this. The proteins in our models were all observed and quantified in the current study with the exception of KIAA1715, out of 142 unique proteins considered in the models.
Data and Code Availability
Processed proteomic data tables are available in Table S2. Raw genomic data is available from the Genomic Data Commons (https://gdc.cancer.gov/) and proteomic data is available via the CPTAC Data Portal (https://cptac-data-portal.georgetown.edu/cptacPublic/). Interactive plots for proteomics and phosphoproteomics data are available at https://doi.org/10.25584/cptac/1601822.
Acknowledgments
This work was supported by grants U24CA160019, U24CA160036, and U24CA210955 from the National Institute of General Medical Sciences (NCI) CPTAC, and P41GM103493 from the National Institutes of Health. The proteomics work described herein was performed in the Environmental Molecular Sciences Laboratory (grid.436923.9), a US Department of Energy (DOE) national scientific user facility located at the Pacific Northwest National Laboratory (PNNL) in Richland, Washington. PNNL is a multi-program national laboratory operated by Battelle Memorial Institute for the DOE under Contract DE-AC05-76RL01830.
Author Contributions
Study Conception & Design, R.D.S., M.A.B., T.L., and K.D.R. Investigation, Performed Experiment or Data Collection, M.A.G., T.R.C., R.J.M., A.A.S., M.A.B., and R.Z. Computation & Statistical Analysis, J.E.M., O.A.A., V.A.P., Y.F., M.E.M., S.H.P., C.H., L.-B.W., S.F., M.W., Y.W., B.Z., Z.Z., and L.D. Data Interpretation & Biological Analysis, J.E.M., O.A.A., V.A.P., Y.F., C.-F.T., E.S., D.W.C., B.Z., Z.Z., L.D., R.D.S., T.L., and K.D.R. Manuscript Preparation & Revision, J.E.M., O.A.A., C.-F.T., M.T., A.I.R., Z.Z., L.D., R.D.S., T.L., and K.D.R. Supervision & Administration, C.R.K., E.S.B., H.R., D.W.C., R.D.S., T.L., and K.D.R.
Declaration of Interests
The authors declare no competing interests.
Published: April 21, 2020; corrected online August 13, 2020
Footnotes
Supplemental Information can be found online at https://doi.org/10.1016/j.xcrm.2020.100004.
Contributor Information
Tao Liu, Email: tao.liu@pnnl.gov.
Karin D. Rodland, Email: karin.rodland@pnnl.gov.
Supplemental Information
References
- 1.Siegel R.L., Miller K.D., Jemal A. Cancer statistics, 2018. CA Cancer J. Clin. 2018;68:7–30. doi: 10.3322/caac.21442. [DOI] [PubMed] [Google Scholar]
- 2.American Cancer Society Key Statistics for Ovarian Cancer. https://www.cancer.org/cancer/ovarian-cancer/about/key-statistics.html
- 3.Cancer Genome Atlas Research Network Integrated genomic analyses of ovarian carcinoma. Nature. 2011;474:609–615. doi: 10.1038/nature10166. [DOI] [PMC free article] [PubMed] [Google Scholar]
- 4.National Cancer Institute SEER Cancer Statistics Review, 1975-2015. https://seer.cancer.gov/archive/csr/1975_2015/
- 5.Zhang H., Liu T., Zhang Z., Payne S.H., Zhang B., McDermott J.E., Zhou J.Y., Petyuk V.A., Chen L., Ray D., CPTAC Investigators Integrated Proteogenomic Characterization of Human High-Grade Serous Ovarian Cancer. Cell. 2016;166:755–765. doi: 10.1016/j.cell.2016.05.069. [DOI] [PMC free article] [PubMed] [Google Scholar]
- 6.Mertins P., Yang F., Liu T., Mani D.R., Petyuk V.A., Gillette M.A., Clauser K.R., Qiao J.W., Gritsenko M.A., Moore R.J. Ischemia in tumors induces early and sustained phosphorylation changes in stress kinase pathways but does not affect global protein levels. Mol. Cell. Proteomics. 2014;13:1690–1704. doi: 10.1074/mcp.M113.036392. [DOI] [PMC free article] [PubMed] [Google Scholar]
- 7.Mertins P., Mani D.R., Ruggles K.V., Gillette M.A., Clauser K.R., Wang P., Wang X., Qiao J.W., Cao S., Petralia F., NCI CPTAC Proteogenomics connects somatic mutations to signalling in breast cancer. Nature. 2016;534:55–62. doi: 10.1038/nature18003. [DOI] [PMC free article] [PubMed] [Google Scholar]
- 8.Shyr C., Tarailo-Graovac M., Gottlieb M., Lee J.J., van Karnebeek C., Wasserman W.W. FLAGS, frequently mutated genes in public exomes. BMC Med. Genomics. 2014;7:64. doi: 10.1186/s12920-014-0064-y. [DOI] [PMC free article] [PubMed] [Google Scholar]
- 9.Mermel C.H., Schumacher S.E., Hill B., Meyerson M.L., Beroukhim R., Getz G. GISTIC2.0 facilitates sensitive and confident localization of the targets of focal somatic copy-number alteration in human cancers. Genome Biol. 2011;12:R41. doi: 10.1186/gb-2011-12-4-r41. [DOI] [PMC free article] [PubMed] [Google Scholar]
- 10.Cancer Genome Atlas Research Network Integrated genomic analyses of ovarian carcinoma. Nature. 2011;474:609–615. doi: 10.1038/nature10166. [DOI] [PMC free article] [PubMed] [Google Scholar]
- 11.Subramanian A., Tamayo P., Mootha V.K., Mukherjee S., Ebert B.L., Gillette M.A., Paulovich A., Pomeroy S.L., Golub T.R., Lander E.S., Mesirov J.P. Gene set enrichment analysis: a knowledge-based approach for interpreting genome-wide expression profiles. Proc. Natl. Acad. Sci. USA. 2005;102:15545–15550. doi: 10.1073/pnas.0506580102. [DOI] [PMC free article] [PubMed] [Google Scholar]
- 12.Thomas S.N., Chen L., Liu Y., Höti N., Zhang H. Targeted Proteomic Analyses of Histone H4 Acetylation Changes Associated with Homologous-Recombination-Deficient High-Grade Serous Ovarian Carcinomas. J. Proteome Res. 2017;16:3704–3710. doi: 10.1021/acs.jproteome.7b00405. [DOI] [PMC free article] [PubMed] [Google Scholar]
- 13.Liu Y., Beyer A., Aebersold R. On the Dependency of Cellular Protein Levels on mRNA Abundance. Cell. 2016;165:535–550. doi: 10.1016/j.cell.2016.03.014. [DOI] [PubMed] [Google Scholar]
- 14.Zhang B., Wang J., Wang X., Zhu J., Liu Q., Shi Z., Chambers M.C., Zimmerman L.J., Shaddox K.F., Kim S., NCI CPTAC Proteogenomic characterization of human colon and rectal cancer. Nature. 2014;513:382–387. doi: 10.1038/nature13438. [DOI] [PMC free article] [PubMed] [Google Scholar]
- 15.Vasaikar S., Huang C., Wang X., Petyuk V., Savage S., Wen B., Dou Y., Zhang Y., Shi Z., Arshad O. Proteogenomic characterization of human colon cancer reveals new therapeutic opportunities. Cell. 2019;177:1035–1049.e19. doi: 10.1016/j.cell.2019.03.030. [DOI] [PMC free article] [PubMed] [Google Scholar]
- 16.Ducie J., Dao F., Considine M., Olvera N., Shaw P.A., Kurman R.J., Shih I.M., Soslow R.A., Cope L., Levine D.A. Molecular analysis of high-grade serous ovarian carcinoma with and without associated serous tubal intra-epithelial carcinoma. Nat. Commun. 2017;8:990. doi: 10.1038/s41467-017-01217-9. [DOI] [PMC free article] [PubMed] [Google Scholar]
- 17.Labidi-Galy S.I., Papp E., Hallberg D., Niknafs N., Adleff V., Noe M., Bhattacharya R., Novak M., Jones S., Phallen J. High grade serous ovarian carcinomas originate in the fallopian tube. Nat. Commun. 2017;8:1093. doi: 10.1038/s41467-017-00962-1. [DOI] [PMC free article] [PubMed] [Google Scholar]
- 18.Casado P., Rodriguez-Prados J.C., Cosulich S.C., Guichard S., Vanhaesebroeck B., Joel S., Cutillas P.R. Kinase-substrate enrichment analysis provides insights into the heterogeneity of signaling pathway activation in leukemia cells. Sci. Signal. 2013;6:rs6. doi: 10.1126/scisignal.2003573. [DOI] [PubMed] [Google Scholar]
- 19.Wiredja D.D., Koyutürk M., Chance M.R. The KSEA App: a web-based tool for kinase activity inference from quantitative phosphoproteomics. Bioinformatics. 2017;33:3489–3491. doi: 10.1093/bioinformatics/btx415. [DOI] [PMC free article] [PubMed] [Google Scholar]
- 20.Hornbeck P.V., Kornhauser J.M., Tkachev S., Zhang B., Skrzypek E., Murray B., Latham V., Sullivan M. PhosphoSitePlus: a comprehensive resource for investigating the structure and function of experimentally determined post-translational modifications in man and mouse. Nucleic Acids Res. 2012;40:D261–D270. doi: 10.1093/nar/gkr1122. [DOI] [PMC free article] [PubMed] [Google Scholar]
- 21.Song L., Pei L., Hu L., Pan S., Xiong W., Liu M., Wu Y., Shang Y., Yao S. Death-associated protein kinase 1 mediates interleukin-1β production through regulating inflammasome activation in Bv2 microglial cells and mice. Sci. Rep. 2018;8:9930. doi: 10.1038/s41598-018-27842-y. [DOI] [PMC free article] [PubMed] [Google Scholar]
- 22.Anjum R., Roux P.P., Ballif B.A., Gygi S.P., Blenis J. The tumor suppressor DAP kinase is a target of RSK-mediated survival signaling. Curr. Biol. 2005;15:1762–1767. doi: 10.1016/j.cub.2005.08.050. [DOI] [PubMed] [Google Scholar]
- 23.Goodrich D.W. The retinoblastoma tumor-suppressor gene, the exception that proves the rule. Oncogene. 2006;25:5233–5243. doi: 10.1038/sj.onc.1209616. [DOI] [PMC free article] [PubMed] [Google Scholar]
- 24.Indovina P., Pentimalli F., Casini N., Vocca I., Giordano A. RB1 dual role in proliferation and apoptosis: cell fate control and implications for cancer therapy. Oncotarget. 2015;6:17873–17890. doi: 10.18632/oncotarget.4286. [DOI] [PMC free article] [PubMed] [Google Scholar]
- 25.Chau B.N., Wang J.Y.J. Coordinated regulation of life and death by RB. Nat. Rev. Cancer. 2003;3:130–138. doi: 10.1038/nrc993. [DOI] [PubMed] [Google Scholar]
- 26.Zarkowska T., Mittnacht S. Differential phosphorylation of the retinoblastoma protein by G1/S cyclin-dependent kinases. J. Biol. Chem. 1997;272:12738–12746. doi: 10.1074/jbc.272.19.12738. [DOI] [PubMed] [Google Scholar]
- 27.Gu Y., Rosenblatt J., Morgan D.O. Cell cycle regulation of CDK2 activity by phosphorylation of Thr160 and Tyr15. EMBO J. 1992;11:3995–4005. doi: 10.1002/j.1460-2075.1992.tb05493.x. [DOI] [PMC free article] [PubMed] [Google Scholar]
- 28.Hughes B.T., Sidorova J., Swanger J., Monnat R.J., Jr., Clurman B.E. Essential role for Cdk2 inhibitory phosphorylation during replication stress revealed by a human Cdk2 knockin mutation. Proc. Natl. Acad. Sci. USA. 2013;110:8954–8959. doi: 10.1073/pnas.1302927110. [DOI] [PMC free article] [PubMed] [Google Scholar]
- 29.Teixeira L.K., Wang X., Li Y., Ekholm-Reed S., Wu X., Wang P., Reed S.I. Cyclin E deregulation promotes loss of specific genomic regions. Curr. Biol. 2015;25:1327–1333. doi: 10.1016/j.cub.2015.03.022. [DOI] [PMC free article] [PubMed] [Google Scholar]
- 30.Mazouzi A., Velimezi G., Loizou J.I. DNA replication stress: causes, resolution and disease. Exp. Cell Res. 2014;329:85–93. doi: 10.1016/j.yexcr.2014.09.030. [DOI] [PubMed] [Google Scholar]
- 31.Bhattacharjee S., Nandi S. DNA damage response and cancer therapeutics through the lens of the Fanconi Anemia DNA repair pathway. Cell Commun. Signal. 2017;15:41. doi: 10.1186/s12964-017-0195-9. [DOI] [PMC free article] [PubMed] [Google Scholar]
- 32.Ishiai M., Sato K., Tomida J., Kitao H., Kurumizaka H., Takata M. Activation of the FA pathway mediated by phosphorylation and ubiquitination. Mutat. Res. 2017;803-805:89–95. doi: 10.1016/j.mrfmmm.2017.05.003. [DOI] [PubMed] [Google Scholar]
- 33.Marcel V., Fernandes K., Terrier O., Lane D.P., Bourdon J.C. Modulation of p53β and p53γ expression by regulating the alternative splicing of TP53 gene modifies cellular response. Cell Death Differ. 2014;21:1377–1387. doi: 10.1038/cdd.2014.73. [DOI] [PMC free article] [PubMed] [Google Scholar]
- 34.Czubaty A., Piekiełko-Witkowska A. Protein kinases that phosphorylate splicing factors: roles in cancer development, progression and possible therapeutic options. Int. J. Biochem. Cell Biol. 2017;91(Pt B):102–115. doi: 10.1016/j.biocel.2017.05.024. [DOI] [PubMed] [Google Scholar]
- 35.Zhu D., Xu S., Deyanat-Yazdi G., Peng S.X., Barnes L.A., Narla R.K., Tran T., Mikolon D., Ning Y., Shi T. Synthetic Lethal Strategy Identifies a Potent and Selective TTK and CLK1/2 Inhibitor for Treatment of Triple-Negative Breast Cancer with a Compromised G1-S Checkpoint. Mol. Cancer Ther. 2018;17:1727–1738. doi: 10.1158/1535-7163.MCT-17-1084. [DOI] [PubMed] [Google Scholar]
- 36.Kroeger P.T., Jr., Drapkin R. Pathogenesis and heterogeneity of ovarian cancer. Curr. Opin. Obstet. Gynecol. 2017;29:26–34. doi: 10.1097/GCO.0000000000000340. [DOI] [PMC free article] [PubMed] [Google Scholar]
- 37.Kim J., Park E.Y., Kim O., Schilder J.M., Coffey D.M., Cho C.H., Bast R.C., Jr. Cell Origins of High-Grade Serous Ovarian Cancer. Cancers (Basel) 2018;10:E433. doi: 10.3390/cancers10110433. [DOI] [PMC free article] [PubMed] [Google Scholar]
- 38.Clark D.J., Dhanasekaran S.M., Petralia F., Pan J., Song X., Hu Y., da Veiga Leprevost F., Reva B., Lih T.M., Chang H.Y., Clinical Proteomic Tumor Analysis Consortium Integrated Proteogenomic Characterization of Clear Cell Renal Cell Carcinoma. Cell. 2019;179:964–983.e31. doi: 10.1016/j.cell.2019.10.007. [DOI] [PMC free article] [PubMed] [Google Scholar]
- 39.Xiao Y., Ma D., Zhao S., Suo C., Shi J., Xue M.Z., Ruan M., Wang H., Zhao J., Li Q. Multi-Omics Profiling Reveals Distinct Microenvironment Characterization and Suggests Immune Escape Mechanisms of Triple-Negative Breast Cancer. Clin. Cancer Res. 2019 doi: 10.1158/1078-0432.CCR-18-3524. [DOI] [PubMed] [Google Scholar]
- 40.Echarti A., Hecht M., Büttner-Herold M., Haderlein M., Hartmann A., Fietkau R., Distel L. CD8+ and Regulatory T cells Differentiate Tumor Immune Phenotypes and Predict Survival in Locally Advanced Head and Neck Cancer. Cancers (Basel) 2019;11:E1398. doi: 10.3390/cancers11091398. [DOI] [PMC free article] [PubMed] [Google Scholar]
- 41.Beniey M., Haque T., Hassan S. Translating the role of PARP inhibitors in triple-negative breast cancer. Oncoscience. 2019;6:287–288. doi: 10.18632/oncoscience.474. [DOI] [PMC free article] [PubMed] [Google Scholar]
- 42.Taylor E.M., Lindsay H.D. DNA replication stress and cancer: cause or cure? Future Oncol. 2016;12:221–237. doi: 10.2217/fon.15.292. [DOI] [PubMed] [Google Scholar]
- 43.Gibbons B.C., Chambers M.C., Monroe M.E., Tabb D.L., Payne S.H. Correcting systematic bias and instrument measurement drift with mzRefinery. Bioinformatics. 2015;31:3838–3840. doi: 10.1093/bioinformatics/btv437. [DOI] [PMC free article] [PubMed] [Google Scholar]
- 44.Monroe M.E., Shaw J.L., Daly D.S., Adkins J.N., Smith R.D. MASIC: a software program for fast quantitation and flexible visualization of chromatographic profiles from detected LC-MS(/MS) features. Comput. Biol. Chem. 2008;32:215–217. doi: 10.1016/j.compbiolchem.2008.02.006. [DOI] [PMC free article] [PubMed] [Google Scholar]
- 45.Kim S., Pevzner P.A. MS-GF+ makes progress towards a universal database search tool for proteomics. Nat. Commun. 2014;5:5277. doi: 10.1038/ncomms6277. [DOI] [PMC free article] [PubMed] [Google Scholar]
- 46.Kessner D., Chambers M., Burke R., Agus D., Mallick P. ProteoWizard: open source software for rapid proteomics tools development. Bioinformatics. 2008;24:2534–2536. doi: 10.1093/bioinformatics/btn323. [DOI] [PMC free article] [PubMed] [Google Scholar]
- 47.Forbes S.A., Beare D., Boutselakis H., Bamford S., Bindal N., Tate J., Cole C.G., Ward S., Dawson E., Ponting L. COSMIC: somatic cancer genetics at high-resolution. Nucleic Acids Res. 2017;45(D1):D777–D783. doi: 10.1093/nar/gkw1121. [DOI] [PMC free article] [PubMed] [Google Scholar]
- 48.Cibulskis K., Lawrence M.S., Carter S.L., Sivachenko A., Jaffe D., Sougnez C., Gabriel S., Meyerson M., Lander E.S., Getz G. Sensitive detection of somatic point mutations in impure and heterogeneous cancer samples. Nat. Biotechnol. 2013;31:213–219. doi: 10.1038/nbt.2514. [DOI] [PMC free article] [PubMed] [Google Scholar]
- 49.Saunders C.T., Wong W.S., Swamy S., Becq J., Murray L.J., Cheetham R.K. Strelka: accurate somatic small-variant calling from sequenced tumor-normal sample pairs. Bioinformatics. 2012;28:1811–1817. doi: 10.1093/bioinformatics/bts271. [DOI] [PubMed] [Google Scholar]
- 50.Koboldt D.C., Zhang Q., Larson D.E., Shen D., McLellan M.D., Lin L., Miller C.A., Mardis E.R., Ding L., Wilson R.K. VarScan 2: somatic mutation and copy number alteration discovery in cancer by exome sequencing. Genome Res. 2012;22:568–576. doi: 10.1101/gr.129684.111. [DOI] [PMC free article] [PubMed] [Google Scholar]
- 51.Ye K., Schulz M.H., Long Q., Apweiler R., Ning Z. Pindel: a pattern growth approach to detect break points of large deletions and medium sized insertions from paired-end short reads. Bioinformatics. 2009;25:2865–2871. doi: 10.1093/bioinformatics/btp394. [DOI] [PMC free article] [PubMed] [Google Scholar]
- 52.Sherry S.T., Ward M.H., Kholodov M., Baker J., Phan L., Smigielski E.M., Sirotkin K. dbSNP: the NCBI database of genetic variation. Nucleic Acids Res. 2001;29:308–311. doi: 10.1093/nar/29.1.308. [DOI] [PMC free article] [PubMed] [Google Scholar]
- 53.Zhao H., Sun Z., Wang J., Huang H., Kocher J.P., Wang L. CrossMap: a versatile tool for coordinate conversion between genome assemblies. Bioinformatics. 2014;30:1006–1007. doi: 10.1093/bioinformatics/btt730. [DOI] [PMC free article] [PubMed] [Google Scholar]
- 54.McKenna A., Hanna M., Banks E., Sivachenko A., Cibulskis K., Kernytsky A., Garimella K., Altshuler D., Gabriel S., Daly M., DePristo M.A. The Genome Analysis Toolkit: a MapReduce framework for analyzing next-generation DNA sequencing data. Genome Res. 2010;20:1297–1303. doi: 10.1101/gr.107524.110. [DOI] [PMC free article] [PubMed] [Google Scholar]
- 55.McLaren W., Gil L., Hunt S.E., Riat H.S., Ritchie G.R., Thormann A., Flicek P., Cunningham F. The Ensembl Variant Effect Predictor. Genome Biol. 2016;17:122. doi: 10.1186/s13059-016-0974-4. [DOI] [PMC free article] [PubMed] [Google Scholar]
- 56.Scott A.D., Huang K.L., Weerasinghe A., Mashl R.J., Gao Q., Martins Rodrigues F., Wyczalkowski M.A., Ding L. CharGer: Clinical Characterization of Germline Variants. Bioinformatics. 2019;35:865–867. doi: 10.1093/bioinformatics/bty649. [DOI] [PMC free article] [PubMed] [Google Scholar]
- 57.Karczewski K.J., Weisburd B., Thomas B., Solomonson M., Ruderfer D.M., Kavanagh D., Hamamsy T., Lek M., Samocha K.E., Cummings B.B., The Exome Aggregation Consortium The ExAC browser: displaying reference data information from over 60 000 exomes. Nucleic Acids Res. 2017;45(D1):D840–D845. doi: 10.1093/nar/gkw971. [DOI] [PMC free article] [PubMed] [Google Scholar]
- 58.Landrum M.J., Lee J.M., Benson M., Brown G., Chao C., Chitipiralla S., Gu B., Hart J., Hoffman D., Hoover J. ClinVar: public archive of interpretations of clinically relevant variants. Nucleic Acids Res. 2016;44(D1):D862–D868. doi: 10.1093/nar/gkv1222. [DOI] [PMC free article] [PubMed] [Google Scholar]
- 59.Kumar P., Henikoff S., Ng P.C. Predicting the effects of coding non-synonymous variants on protein function using the SIFT algorithm. Nat. Protoc. 2009;4:1073–1081. doi: 10.1038/nprot.2009.86. [DOI] [PubMed] [Google Scholar]
- 60.Adzhubei I., Jordan D.M., Sunyaev S.R. Predicting functional effect of human missense mutations using PolyPhen-2. Curr. Protoc. Hum. Genet. 2013;Chapter 7(January):Unit 7.20. doi: 10.1002/0471142905.hg0720s76. [DOI] [PMC free article] [PubMed] [Google Scholar]
- 61.Robinson J.T., Thorvaldsdóttir H., Winckler W., Guttman M., Lander E.S., Getz G., Mesirov J.P. Integrative genomics viewer. Nat. Biotechnol. 2011;29:24–26. doi: 10.1038/nbt.1754. [DOI] [PMC free article] [PubMed] [Google Scholar]
- 62.Wang J. multiOmicsViz: plot the effect of one omics data on other omics data along the chromosome. https://rdrr.io/bioc/multiOmicsViz/
- 63.Yu G., Wang L.G., Han Y., He Q.Y. clusterProfiler: an R package for comparing biological themes among gene clusters. OMICS. 2012;16:284–287. doi: 10.1089/omi.2011.0118. [DOI] [PMC free article] [PubMed] [Google Scholar]
- 64.Ritchie M.E., Phipson B., Wu D., Hu Y., Law C.W., Shi W., Smyth G.K. limma powers differential expression analyses for RNA-sequencing and microarray studies. Nucleic Acids Res. 2015;43:e47. doi: 10.1093/nar/gkv007. [DOI] [PMC free article] [PubMed] [Google Scholar]
- 65.Tabb D.L., Wang X., Carr S.A., Clauser K.R., Mertins P., Chambers M.C., Holman J.D., Wang J., Zhang B., Zimmerman L.J. Reproducibility of Differential Proteomic Technologies in CPTAC Fractionated Xenografts. J. Proteome Res. 2016;15:691–706. doi: 10.1021/acs.jproteome.5b00859. [DOI] [PMC free article] [PubMed] [Google Scholar]
- 66.Li S., Shen D., Shao J., Crowder R., Liu W., Prat A., He X., Liu S., Hoog J., Lu C. Endocrine-therapy-resistant ESR1 variants revealed by genomic characterization of breast-cancer-derived xenografts. Cell Rep. 2013;4:1116–1130. doi: 10.1016/j.celrep.2013.08.022. [DOI] [PMC free article] [PubMed] [Google Scholar]
- 67.Richards S., Aziz N., Bale S., Bick D., Das S., Gastier-Foster J., Grody W.W., Hegde M., Lyon E., Spector E., ACMG Laboratory Quality Assurance Committee Standards and guidelines for the interpretation of sequence variants: a joint consensus recommendation of the American College of Medical Genetics and Genomics and the Association for Molecular Pathology. Genet. Med. 2015;17:405–424. doi: 10.1038/gim.2015.30. [DOI] [PMC free article] [PubMed] [Google Scholar]
- 68.Huang K.L., Mashl R.J., Wu Y., Ritter D.I., Wang J., Oh C., Paczkowska M., Reynolds S., Wyczalkowski M.A., Oak N. Pathogenic Germline Variants in 10,389 Adult Cancers. Cell. 2018;173:355–370.e1–e6. doi: 10.1016/j.cell.2018.03.039. [DOI] [PMC free article] [PubMed] [Google Scholar]
- 69.Kim S., Gupta N., Pevzner P.A. Spectral probabilities and generating functions of tandem mass spectra: a strike against decoy databases. J. Proteome Res. 2008;7:3354–3363. doi: 10.1021/pr8001244. [DOI] [PMC free article] [PubMed] [Google Scholar]
- 70.Beausoleil S.A., Villén J., Gerber S.A., Rush J., Gygi S.P. A probability-based approach for high-throughput protein phosphorylation analysis and site localization. Nat. Biotechnol. 2006;24:1285–1292. doi: 10.1038/nbt1240. [DOI] [PubMed] [Google Scholar]
- 71.Vasaikar S., Huang C., Wang X., Petyuk V.A., Savage S.R., Wen B., Dou Y., Zhang Y., Shi Z., Arshad O.A., Clinical Proteomic Tumor Analysis Consortium Proteogenomic Analysis of Human Colon Cancer Reveals New Therapeutic Opportunities. Cell. 2019;177:1035–1049.e19. doi: 10.1016/j.cell.2019.03.030. [DOI] [PMC free article] [PubMed] [Google Scholar]
- 72.Linding R., Jensen L.J., Pasculescu A., Olhovsky M., Colwill K., Bork P., Yaffe M.B., Pawson T. NetworKIN: a resource for exploring cellular phosphorylation networks. Nucleic Acids Res. 2008;36:D695–D699. doi: 10.1093/nar/gkm902. [DOI] [PMC free article] [PubMed] [Google Scholar]
Associated Data
This section collects any data citations, data availability statements, or supplementary materials included in this article.
Supplementary Materials
Data Availability Statement
Processed proteomic data tables are available in Table S2. Raw genomic data is available from the Genomic Data Commons (https://gdc.cancer.gov/) and proteomic data is available via the CPTAC Data Portal (https://cptac-data-portal.georgetown.edu/cptacPublic/). Interactive plots for proteomics and phosphoproteomics data are available at https://doi.org/10.25584/cptac/1601822.