Abstract
We have previously characterized the reproducibility of brain tumor relative cerebral blood volume (rCBV) using a dynamic susceptibility contrast magnetic resonance imaging digital reference object across 12 sites using a range of imaging protocols and software platforms. As expected, reproducibility was highest when imaging protocols and software were consistent, but decreased when they were variable. Our goal in this study was to determine the impact of rCBV reproducibility for tumor grade and treatment response classification. We found that varying imaging protocols and software platforms produced a range of optimal thresholds for both tumor grading and treatment response, but the performance of these thresholds was similar. These findings further underscore the importance of standardizing acquisition and analysis protocols across sites and software benchmarking.
Keywords: DSC-MRI, digital reference object, relative cerebral blood volume, standardization, multisite consistency, tumor grading, treatment response
Introduction
The National Cancer Institute's Quantitative Imaging Network (QIN), Radiological Society of North America's Quantitative Imaging Biomarkers Alliance (QIBA), and the National Brain Tumor Society's (NBTS) Jumpstarting Brain Tumor Drug Development Coalition all have initiatives aiming to standardize Dynamic Susceptibility Contrast (DSC) MRI protocols and postprocessing methods. Standardization of relative cerebral blood volume (rCBV) as a quantitative biomarker for glioma care is warranted because of the increased adoption of rCBV into multisite clinical trials and protocol variability could impact its use as a reliable biomarker of response (1–3). For example, a recent systematic meta-analysis of 26 published studies found that although DSC-MRI accurately distinguishes tumor recurrence from post-treatment radiation effects within a given study, inconsistency of DSC-MRI protocols between institutions led to substantial variability in reported optimal thresholds. These resulting inconsistencies emphasize the need for greater consistency before a specific quantitative DSC-MRI strategy is adopted across institutions for routine clinical use (4). To overcome this challenge, the American Society of Functional Neuroradiology (ASFNR) provided a minimal set of protocol recommendations for the acquisition of clinical DSC-MR images (5). In addition, the aforementioned initiatives, e.g. QIBA, are working to release more comprehensive recommendations on imaging protocol and postprocessing methods (O. Wu, Personal Communication, January 24, 2020).
In a previously published study involving 12 sites within the NCI's Quantitative Imaging Network (QIN), variable imaging protocols (IPs) and postprocessing methods (PMs) were found to reduce rCBV reproducibility (6). In contrast, another QIN study showed that if acquisition and preprocessing steps were held constant, the variability between sites greatly diminished such that a global threshold to distinguish low- from high-grade tumor could be identified (7). This study extends these previous investigations by evaluating the potential impact of variable IPs and PMs on 2 clinical use cases, namely, classification of brain tumor grade and treatment response assessment. Virtual tumors were designed to reflect each one of these clinical cases using a DSC digital reference object (DRO) representative of a wide range of glioma MR signals. Using these virtual patients, the aim of this study was to evaluate the influence of the previously characterized rCBV reproducibility as a classifier for tumor grade and treatment response.
Materials and Methods
The previously validated population-based DRO used in this study encompasses 10 000 unique DSC-MRI tumor voxels and was simulated for each IP provided by the 12 participating QIN sites (6, 8). In addition to these site-specific DROs, an additional DRO was simulated using parameters from the standard imaging protocol (SIP) as defined by the ASFNR (5). All sites used their PM of choice to compute rCBV maps from these simulated DROs. In summary, the majority of IPs submitted were similar in alignment with the ASFNR recommendations (5), whereas a variety of software platforms were used (IB Neuro, nordicICE, PGUI, 3D Slicer, Philips IntelliSpace Portal [ISP], and in-house processing scripts). A detailed description of each site's IPs and PMs are tabulated in Bell et al.'s (6) study, and tables are reprinted with permission (see online supplemental Tables 1 and 2).
As outlined in the previously published manuscript, there were 3 phases to this study to evaluate the effects of various IPs and PMs (6). Phase I (“site IP w/constant PM”) required the managing center to process rCBV maps for each site-specific DRO. Computation of rCBV was based on previously optimized methods (9). Some sites provided more than one IP owing to differences in field strengths (n = 15 [3.0 T], n = 4 [1.5 T]), dosing schemes (n = 5 [0.10 0.10] mmol/kg; n = 4 [0 0.10] mmol/kg]; n = 3 [0.025 0.10] mmol/kg; n = 2 [0.05 0.10] mmol/kg); n = 1 [0.025 0.075], [0.033 0.066], [0.05 0.05], [0.10 0.05] mmol/kg), and acquisition methods (n = 17 [single-echo]; n = 2 [dual-echo]). In this study's phase, 19 different DROs were processed by the managing center (see online supplemental Table 1). Phase II (“constant IP w/site PM”) required each site to process rCBV maps from the standard protocol using their PM of choice. Two sites chose to process rCBV maps using multiple software platforms (see online supplemental Table 2), resulting in 17 submitted rCBV maps (see online supplemental Table 1; second to last column). Phase III (“site IP w/site PM”) allowed each site to process their own rCBV maps using their IP and PM, which yielded 25 rCBV maps (see online supplemental Table 1—last column). In total, across all 3 phases, 61 rCBV maps were analyzed in this study.
Virtual Tumor Development
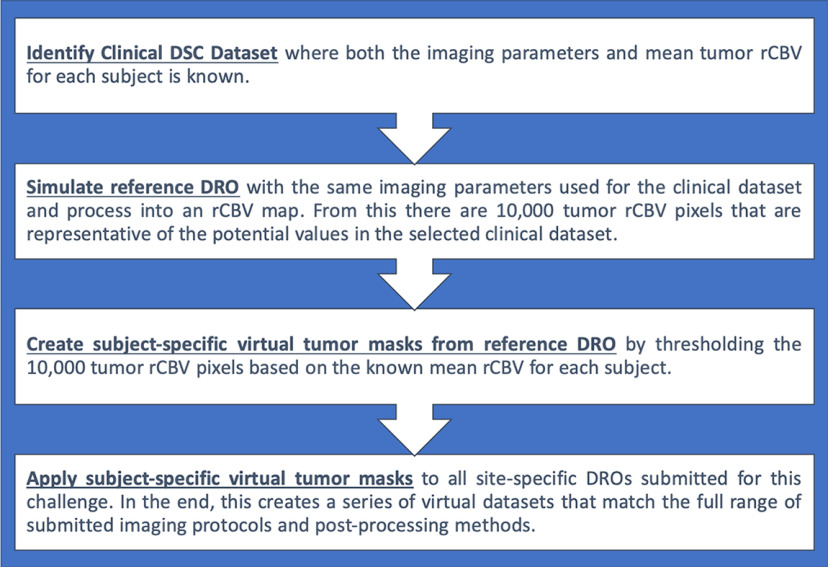
Two clinical data sets were identified for each clinical case investigated in this study (more details for each case appear after this paragraph). The mean tumor rCBV values were known a priori for each subject in each data set. The managing center simulated a reference DRO to match the imaging parameters used in the selected clinical data set and then processed these time curves into an rCBV map using previously detailed methods (8, 9). In general, virtual tumors were created by selecting 25 pixels of the 10 000 pixels possible from the rCBV map (produced by the reference DRO) such that the mean of these pixels matched each clinical patient. Specifically, this was done by first applying a threshold to identify the DRO pixels whose rCBV value matched each patient-specific mean rCBV to within ±20%, allowing for intratumor heterogeneity. From this pool of DRO indices, 25 voxels were randomly selected. Repeat tumor indices were not allowed for each consecutive simulated tumor. Once these 25 pixels were selected, the mean virtual tumor rCBV values could be found. To evaluate the effects of varying IPs and PMs on tumor grading, these masks were then retrospectively applied to all the 61 submitted rCBV maps for each of the 3 phases outlined above. Specific details for each aim of the study are outlined below, including a flowchart to demonstrate the steps involved (Figure 1).
Figure 1.
A flowchart of the steps involved to create the virtual tumors from the digital reference object (DRO).
Case 1: Tumor Grade Classification.
A publicly available data set on The Cancer Imaging Archive (TCIA) was used to study rCBV-based classification of high-grade gliomas (HGGs) and low-grade gliomas (LGG)s (10, 11). This data set contains 49 DSC-MRI images of low- (LGG; n = 13) and high-grade (HGG; n = 36) glial brain lesions with previously published mean rCBV values for each tumor (7). In the end, 24 LGG and 72 HGG virtual tumor masks were simulated.
Case 2: Consistency of Longitudinal rCBV Differences Owing to Treatment.
The data set used for Case 2 originated from a previous study by Schmainda et al. (3), in which rCBV changes measured in HGGs undergoing Bevacizumab therapy were shown to be predictive of overall survival. This data set contains 36 subjects with 2 imaging time points, namely, pretreatment (preTx) and posttreatment (postTx). The authors provided the mean rCBV value for each subject at each time point. Using this information, virtual tumors were created for each time point for 35 subjects for a total of 70 virtual tumors. In this cohort, 24 subjects were identified as responders (determined by overall survival) and 11 subjects as nonresponders. The mean percent difference in rCBV was then calculated by (rCBVpostTx − rCBVpreTx)/rCBVpreTx × 100%. In the end, 68 virtual masks (preTx and postTx) were simulated for 23 responders and 11 nonresponders.
Statistical Analysis
The ability for rCBV to classify tumor grade and therapy response was evaluated using receiver operating characteristics (ROC) analysis. From the ROC analysis, the area under the ROC curve (AUROC) and optimal threshold (defined by where the sensitivity and specificity from the ROC analysis overlap) are reported for each submitted DRO. Boxplots were used to show the distribution of the ROC results. The boxplot lines (“whiskers”) are drawn from the 25th and 75th percentiles of the samples, and any observations outside of these are considered outliers. All statistical tests were done in MATLAB (The MathWorks, Inc., Natick, MA).
Results
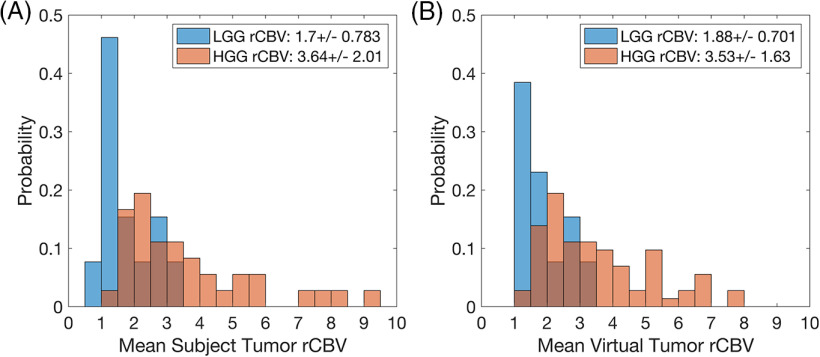
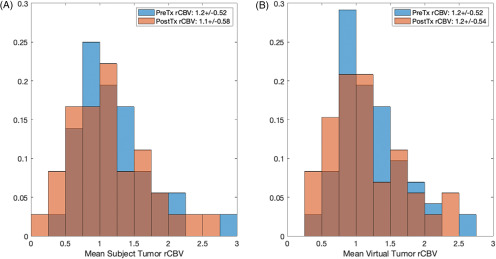
The distributions of rCBV for both virtual cases were similar to their respective clinical data sets (Figures 2–3). For tumor grading (Figure 2B), the mean values were within 10% and 3% for the LGG and HGG populations, respectively. For treatment response (Figure 3B), the mean values were within 0.35% and 1.5% for the preTx and postTx, respectively. Results specific to each case are detailed below.
Figure 2.
Histogram distributions of mean relative cerebral blood volume (rCBV) the for The Cancer Imaging Archive (TCIA) data set (A) and the virtual tumors (B) for tumor grade: low-grade glioma (LGG) (blue) and high-grade glioma (HGG) (red). The rCBV distributions for both populations are similar (as listed within the legend), with slight deviations noted for very low and high mean rCBV tumors.
Figure 3.
Histogram distributions of the mean rCBV, pre- (preTx) and posttreatment (postTx), for the clinical data set (A) and the virtual tumors (B): preTx (blue) and postTx (red). The rCBV distributions for both populations are similar (as listed within the legend).
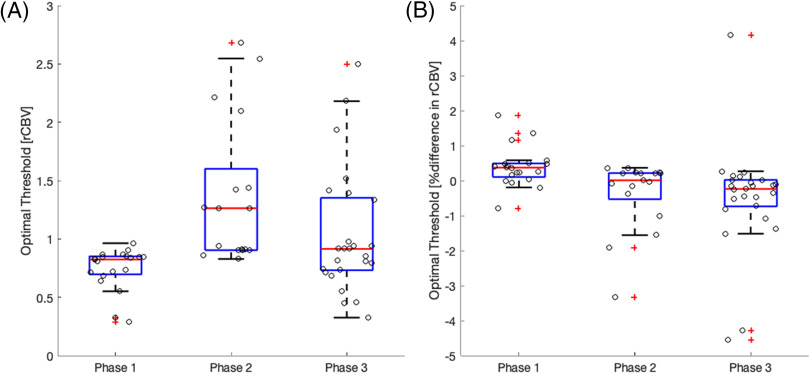
Boxplots of the ROC results are summarized in Figure 4 (optimal thresholds) and Figure 5 (AUROC) for each clinical use case. In general, the range of thresholds increases for phase II and phase III when compared with phase I of the study highlighting the effect of varying PMs. The range of optimal thresholds is narrower for phase I where only IPs differed. Also noted are the wider distributions of optimal thresholds for the tumor grading (Figure 4A) compared with those for treatment response (Figure 4B). For tumor grading (Figure 4A), the IP without a preload for a single-echo acquisition (phase I) and the second definition from Philip's ISP (phase II) result in optimal thresholds that are deemed outliers. For treatment response (Figure 4B), all IP with a preload <1 standard dose for a single-echo acquisition (phase I) and PMs' methods that included 3DSlicer and in-house scripts (phase II) resulted in optimal thresholds that markedly differed from the rest of the population. Importantly, the clinical performance of rCBV was highly consistent across sites that used similar IPs and PMs.
Figure 4.
Boxplots of the optimal rCBV threshold needed for tumor grade (A) and treatment response (B) classification grouped by the 3 phases of this study. Individual measurements are overlaid on the boxplot to better visualize the distribution. Outliers are indicated by red plus signs. Wider distributions of optimal thresholds are seen for phases II and III where sites use a variety of software packages for rCBV calculation.
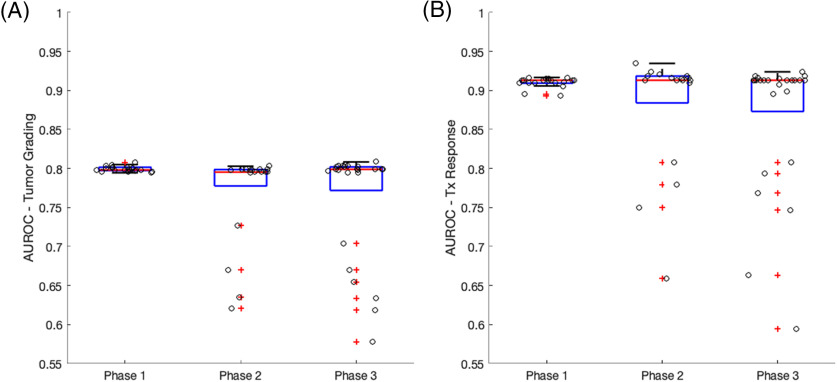
Figure 5.
Boxplots of the AUROC for tumor grade (A) and treatment response (B) classification grouped by the 3 phases of this study. Individual measurements are overlaid on the boxplot to better visualize the distribution. Outliers are indicated by red plus signs. Slightly wider distributions of area under the receiver operating characteristics (AUROCs) are seen for phases II and III where sites use a variety of software packages for rCBV calculation. Outliers consistently show a decrease in AUROC.
Despite the heterogeneity in optimal thresholds for varying IPs and PMs, tighter boxplot distributions in AUROC results are observed across all 3 phases of the study (Figure 5). In general, the distribution of AUROC is the narrowest when a constant PM is used. There are clear outliers for each clinical use case and all result in a decreased AUROC. For tumor grading (Figure 5A), the 4 outliers observed for phases II and III are those that used PGUI and an in-house script. Note that the optimal threshold outliers do not correlate to the AUROC outliers.
Discussion/Conclusion
Previously published results show that variable IPs and PMs reduce rCBV reproducibility (6). In this follow-up study, we further explore how reduced reproducibility affects the potential clinical utility of rCBV with the overarching goal to improve the utilization of quantitative imaging biomarkers extracted from DSC-MRI in neuro-oncology.
The clinical performance of tumor grading and treatment response is generally not diminished with reduced rCBV reproducibility owing to variations in IP and PM, highlighting the robustness of rCBV as a biomarker. All imaging protocols submitted resulted in similar AUROC (∼0.8 for tumor grading and ∼0.9 for treatment response) when a standardized PM was applied. However, the IP with a preload of <1 standard dose resulted in optimal threshold values that differed from all other IPs. This most likely resulted from an underestimation of rCBV caused by insufficiency of the leakage correction algorithms to account for the considerable T1 leakage effects that arise in the absence of a preload and optimal pulse sequence parameters. When IP was controlled, the majority of the PMs used in this study yielded rCBV values that were effective classifiers for tumor grading and treatment response, including IB Neuro, nordicICE, 3D Slicer, and Philips ISP. However, 2 of these 4 software packages (disregarding in-house scripts results) produced different optimal thresholds that differed from the rest: 3D Slicer for the treatment response case and Philips ISP for the tumor grading case. The methods that deviated from the mean AUROC included PGUI (AUROC ∼0.60 for both clinical cases) and an in-house processing script (AUROC is 0.72 and 0.80 for tumor grading and treatment response, respectively). This result highlights the importance of benchmarking software used for DSC-MRI analysis. The narrower distributions of optimal thresholds and AUROC for the treatment response use case, when compared to tumor grading, are most likely owing to the percent difference calculation partially offsetting protocol-specific rCBV variability. The rCBV variability is most likely equally sensitive to variations in rCBV due to different imaging protocols and postprocessing methods. Note that this study did not analyze the effect of protocol variations between 2 imaging time points.
Taken together, results of the 2 QIN DSC-MRI DRO studies strongly justify the continuation of current efforts to standardize IPs and PMs, particularly when rCBV is to be used as a quantitative biomarker of treatment response in multisite clinical trials. Even though individual site protocols maintained their clinical performance utility, the site-to-site threshold variability indicates applying the same threshold across sites using different PM is not currently recommended. The lack of consistency of thresholds between PMs even when the same IP and leakage correction algorithms are used (most likely owing to differences in implementation) highlight the need for benchmarking software packages. Because it is unlikely that all vendors can provide exactly the same algorithms and implementation, we propose 2 levels of validation. The first level consists of performing the scientific studies to validate that the software provides clinically meaningful results. The second is to use a benchmark calibration method, such as the DRO used for these studies, so that each vendor can provide the threshold that should be used for a particular test. Only in that way will we have both the freedom to select the software of our liking and carry out cross-site studies using quantitative measures.
In conclusion, results from this study show that reduced multisite rCBV reproducibility owing to heterogeneous IPs and PMs would confound the reliable use of this biomarker in clinical trials, and further emphasize the need for harmonization of acquisition and analysis methods.
Supplemental Materials
Acknowledgments
We would like to thank the following support: NIH/NCI R01CA213158 (LCB, NS, CCQ), NIH/NCI U01CA207091 (AJM, MCP), NIH/NCI U01CA166104 and P01CA085878 (DM, TLC), NIH/NCI U01CA142565 (CW, AGS, TEY, NR), NIH/NCI U01CA1761100 (KMS, MAP), CPRIT RR160005 (TEY).
TEY is a CPRIT Scholar in Cancer Research.
Disclosures: IQ-AI (KMS, ownership interest) and Imaging Biometrics (KMS, financial interest).
Footnotes
- DSC-MRI
- dynamic susceptibility contrast-magnetic resonance imaging
- rCBV
- relative cerebral blood volume
- IP
- imaging protocol
- PM
- processing method
- QIN
- Quantitative Imaging Network
- DRO
- digital reference object
- QIBA
- Quantitative Imaging Biomarkers Alliance
- ASFNR
- American Society of Functional Neuroradiology
- HGG
- high-grade glioma
- LGG
- low-grade glioma
References
- 1. Galbán CJ, Lemasson B, Hoff BA, Johnson TD, Sundgren PC, Tsien C, Chenevert TL, Ross BD. Development of a multiparametric voxel-based magnetic resonance imaging biomarker for early cancer therapeutic response assessment. Tomography. 2015;1:44–52. [DOI] [PMC free article] [PubMed] [Google Scholar]
- 2. Boxerman JL, Zhang Z, Safriel Y, Larvie M, Snyder BS, Jain R, Chi TL, Sorensen AG, Gilbert MR, Barboriak DP. Early post-bevacizumab progression on contrast-enhanced MRI as a prognostic marker for overall survival in recurrent glioblastoma: results from the ACRIN 6677/RTOG 0625 Central Reader Study. Neuro Oncol. 2013;15:945–954. [DOI] [PMC free article] [PubMed] [Google Scholar]
- 3. Schmainda KM, Zhang Z, Prah M, Snyder BS, Gilbert MR, Sorensen AG, Barboriak DP, Boxerman JL. Dynamic susceptibility contrast MRI measures of relative cerebral blood volume as a prognostic marker for overall survival in recurrent glioblastoma: results from the ACRIN 6677/RTOG 0625 multicenter trial. Neuro Oncol. 2015;17:1148–1156. [DOI] [PMC free article] [PubMed] [Google Scholar]
- 4. Patel P, Baradaran H, Delgado D, Askin G, Christos P, John Tsiouris A, Gupta A. MR perfusion-weighted imaging in the evaluation of high-grade gliomas after treatment: a systematic review and meta-analysis. Neuro Oncol. 2017;19:118–127. [DOI] [PMC free article] [PubMed] [Google Scholar]
- 5. Welker K, Boxerman J, Kalnin A, Kaufmann T, Shiroishi M, Wintermark M, American Society of Functional Neuroradiology MR Perfusion Standards and Practice Subcommittee of the ASFNR Clinical Practice Committee. ASFNR recommendations for clinical performance of MR dynamic susceptibility contrast perfusion imaging of the brain. AJNR Am J Neuroradiol. 2015;36:E41–51. [DOI] [PMC free article] [PubMed] [Google Scholar]
- 6. Bell LC, Semmineh N, An H, Eldeniz C, Wahl R, Schmainda KM, Prah MA, Erickson BJ, Korfiatis P, Wu C, Sorace AG, Yankeelov TE, Rutledge N, Chenevert TL, Malyarenko D, Liu Y, Brenner A, Hu LS, Zhou Y, Boxerman JL, Yen YF, Kalpathy-Cramer J, Beers AL, Muzi M, Madhuranthakam AJ, Pinho M, Johnson B, Quarles CC. Evaluating multisite rCBV consistency from DSC-MRI imaging protocols and postprocessing software across the NCI Quantitative Imaging Network sites using a digital reference object (DRO). Tomography. 2019;5:110–117. [DOI] [PMC free article] [PubMed] [Google Scholar]
- 7. Schmainda KM, Prah MA, Rand SD, Liu Y, Logan B, Muzi M, Rane SD, Da X, Yen Y-F, Kalpathy-Cramer J, Chenevert TL, Hoff B, Ross B, Cao Y, Aryal MP, Erickson B, Korfiatis P, Dondlinger T, Bell L, Hu L, Kinahan PE, Quarles CC. Multisite concordance of DSC-MRI analysis for brain tumors: results of a National Cancer Institute Quantitative Imaging Network collaborative project. AJNR Am J Neuroradiol. 2018;39:1008–1016. [DOI] [PMC free article] [PubMed] [Google Scholar]
- 8. Semmineh NB, Stokes AM, Bell LC, Boxerman JL, Quarles CC. A population-based digital reference object (DRO) for optimizing dynamic susceptibility contrast (DSC)-MRI methods for clinical trials. Tomography. 2017;3:41–49. [DOI] [PMC free article] [PubMed] [Google Scholar]
- 9. Semmineh N, Bell L, Stokes A, Hu L, Boxerman J, Quarles C. Optimization of acquisition and analysis methods for clinical dynamic susceptibility contrast (DSC) MRI using a population-based digital reference object. AJNR Am J Neuroradiol. 2018;39:1981–1988. [DOI] [PMC free article] [PubMed] [Google Scholar]
- 10. Clark K, Vendt B, Smith K, Freymann J, Kirby J, Koppel P, Moore S, Phillips S, Maffitt D, Pringle M, Tarbox L, Prior F. The Cancer Imaging Archive (TCIA): maintaining and operating a public information repository. J Digit Imaging. 2013;26:1045–1057. [DOI] [PMC free article] [PubMed] [Google Scholar]
- 11. Schmainda KM. Prah MA, Connelly JM, Rand SD. Glioma DSC-MRI Perfusion Data with Standard Imaging and ROIs. Cancer Imaging Arch. 2016. https://wiki.cancerimagingarchive.net/display/Public/QIN-BRAIN-DSC-MRI#460262baff8840aeae60978299a78dc5.
Associated Data
This section collects any data citations, data availability statements, or supplementary materials included in this article.


