Abstract
Purpose
Aiming to clarify the metabolic interrogation in cell fate decision of cultured human corneal endothelial cells (cHCECs).
Methods
To analyze the metabolites in the culture supernatants (CS), 34 metabolome measurements were carried out for mature differentiated and a variety of cHCECs with cell state transition through a facility service. Integrated proteomics research for cell lysates by liquid chromatography−tandem mass spectrometry (LC-MS/MS) was performed for 3 aliquots of each high-quality or low-quality cHCEC subpopulations (SP). The investigations for the focused genes involved in cHCEC metabolism were performed by using DAVID and its options “KEGG_PATHWAY.”
Results
The clusters of metabolites coincided well with the distinct content of CD44−/+ SPs. Both secreted pyruvic acid and lactic acid in the CS were negatively correlated with the content of high-quality SPs. Lactic acid and pyruvic acid in the CS exhibited the positive correlation with that of Ile, Leu, and Ser, whereas the negative correlation was with glutamine. Platelet-derived growth factor-ββ in the CS negatively correlated with lactic acid in CS, indicating indirectly the positive correlation with the content of CD44−/+ SPs. Upregulated glycolytic enzymes and influx of glutamine to the tricarboxylic acid cycle may be linked with a metabolic rewiring converting oxidative metabolism in mature differentiated CD44−/+SPs into a glycolytic flux-dependent state in immature SPs with cell state transition.
Conclusions
The findings suggest that the cell fate decision of cHCECs may be dictated at least partly through metabolic rewiring.
Keywords: CD44, c-Myc, p53, lactate, pyruvic acid, oxidative phosphorylation, glycolysis, mitochondria
Corneal endothelial (CE) disorders are caused by pathologic conditions such as bullous keratopathy and Fuchs's endothelial corneal dystrophy.1 Recently, we reported our development of a novel clinically effective therapeutic modality to regenerate monolayer CE tissues by injection into an anterior chamber of cultured human CE cells (cHCECs).2–8 Recently, cHCECs have been recognized to be heterogeneous not only in their biochemical features but also in their key functions, including the metabolic plasticity.9
Corneal endothelium is one of the most metabolically active tissues in the human body.10 Dissecting the biologic functions of metabolites and mitochondria in cHCEC cell fate decision will provide essential cues to further improve cell-based therapy. Mitochondria are poised to play an essential role.11,12 Glycolysis and mitochondrial respiration are the most relevant pathways for producing adenosine triphosphate (ATP) indispensable to HCE cell functions.13–19 However, the requirement for specific metabolic reprogramming in the maturation/differentiation of cHCECs or in cell fate decision remains elusive.20 Previously, we preliminary described20 that metabolomic profiling segregated mature differentiated-cHCECs from immature-cHCECs.9 Cultured HCECs have a tendency for cell-state transition (CST) into a dedifferentiation state, a senescent phenotype, epithelial-mesenchymal transition, and transformed fibroblastic cell morphology, indicating the presence of vast heterogeneity among these cHCECs with CST. Among cHCECs with CST, immature cHCECs switched to a glycolytic metabotype, whereas mature differentiated cHCECs became more oxidative and elicited reduced amount secretion of lactate, suggesting a possible application of metabolomics for quality control or their usefulness as biomarkers for diagnosis, prognosis, and therapeutic efficacy of cHCEC cell therapy for CE disorders.
The secreted metabolites were assigned to the cHCEC subpopulations (SPs) distinct in the expression levels of surface CD44 antigens,9 which expression is regulated by c-Myc.21 The link between bioenergetics and the cell fate decision of cHCECs remains largely unknown. In other cell systems, CD44 functions to regulate metabolic flux to mitochondrial respiration and induces entry into glycolysis.22 C-Myc reportedly regulates lactate production and is an important regulator for glycolysis.23–25 It has been suggested that c-Myc can addict cells to specific bioenergetic substrates.21 In this context, unraveling the plasticity of the mitochondrial response to in vitro cell culture environments would provide critical insights into how cHCEC cell fate decisions are established and may support the cell-based regenerative medicine.
Given the distinct expression profiles of CD44, cMyc and p53, also known as a major metabolic regulator, among cHCEC SPs,9 here we had tried to detail the inclination of CST cHCECs to intracellular glycolytic metabotypes to establish the scientific interpretation of the described preliminary quality specification. Metaboproteomics resolved up- or down-regulated enzymes underlying cHCEC cell fate determination. Upregulated glycolytic enzymes and influx of glutamine (Gln) to the tricarboxylic acid (TCA) cycle via α-ketoglutarate may be responsible for a metabolic rewiring converting oxidative metabolism in mature differentiated SPs into a glycolytic flux-dependent state in immature SPs.
Materials and Methods
Human Corneal Tissue and Endothelial Cell Donors
The human tissue used in this study was handled in accordance with the tenets set forth in the Declaration of Helsinki. HCECs were obtained from human donor corneas obtained from CorneaGen Inc. (Seattle, WA) eye bank, and were cultured before the experimental analysis. Informed written consent for eye donation for research was obtained from the next of kin of all deceased donors. All tissues were recovered under the tenets of the Uniform Anatomical Gift Act of the particular state in which the donor consent was obtained and the tissue was recovered. All donor corneas were preserved in Optisol-GS (Chiron Vision, Inc., Irvine, CA) corneal storage medium and then shipped via international air transport for research purposes. Donor information accompanying the donor corneas showed that they were all considered healthy and absent of any corneal disease.
Cell Cultures of HCECs
The HCECs were cultured according to the published protocols, with some modifications.5 Briefly, the Descemet's membranes with the CECs were stripped from donor corneas and digested at 37° C with 1 mg/mL collagenase A (Roche Applied Science, Penzberg, Germany) for 2 hours. The HCECs obtained from a single donor cornea were seeded in 1 well of a Type-I collagen-coated 6-well plate (Corning, Inc., Corning, NY). The culture medium was prepared according to published protocols. The HCECs were passaged after harvest with 10× TrypLE Select (Thermo Fisher Scientific, Inc., Waltham, MA) treatment at 37° C for 12 minutes when they reached confluence. The HCECs at passages 2 to 3 were used for all experiments.
Phase-Contrast Microscopy
Phase-contrast images were obtained by use of an inverted microscope system (CKX41; Olympus Corporation, Tokyo, Japan).
Flow Cytometry Analysis of cHCECs
HCEC cells were collected from the culture dish by TrypLE Select treatment, as described above, and provided to Fluorescence Activated Cell Sorter (FACS) analysis according to the procedures described previously.7,8 The antibodies used were as follows: FITC-conjugated anti-human CD90 mAb, phycoerythrin (PE)-conjugated anti-human CD166 mAb, PerCP-Cy 5.5 conjugated anti-human CD24 mAb, PE-Cy 7–conjugated anti-human CD44 and FITC-conjugated antihuman CD90 mAb (all from BD Biosciences, San Jose, CA), and allophycocyanin APC-conjugated anti-human CD105 (eBioscience, Inc.). After washing with FACS buffer, the HCECs were analyzed by use of the BD FACSCanto II (BD Biosciences) fluidics-system flow cytometer.
Reagents
Rho-associated protein kinase (ROCK)-inhibitor Y-27632 (Y) and epidermal growth factor was purchased from Wako Pure Chemical Industries, Ltd. (Osaka, Japan) and SB203580 (SB2) was obtained from Cayman Chemical (Ann Arbor, MI). Dulbecco's modified Eagle's medium−high glucose (DMEM-HG) and fetal bovine serum were obtained from Gibco Industries Inc. (Langley, OK) and plastic culture plates were obtained from Corning. Unless indicated differently, all other chemicals were purchased from Sigma-Aldrich, Inc. (St. Louis, MO).
Measurement of Metabolites in Culture Medium
For the measurement of metabolites in the culture supernatants (CS), 20 µL of the CS and 80 µL Milli-Q (Merck KGaA, Darmstadt, Germany)−purified water containing Internal Standard Solution 1 (H3304-1002; Human Metabolome Technologies, Inc., Yamagata, Japan) were thoroughly mixed. The procedures followed those described previously.9 Briefly, cationic compounds were measured in the positive mode of CE time-of-flight mass spectrometry, and anionic compounds were measured in the positive and negative modes of CE tandem MS (CE-MS/MS). Hierarchical cluster analysis (HCA) was performed by use of our proprietary software, that is, “PeakStat.” cHCECs from donors between the ages of 7 and 29 were used to obtain reproducible cultures producing high-quality cHCECs suitable for cell-injection therapy. Thus we used cHCECs from 3 donors of nearly the same age (age: 17, 14, and 18 years) to clarify the influence of the fine differences of the culture conditions. Differences between the values were statistically analyzed by use of the Student's t test or 1-way analysis of variance with Bonferroni post hoc tests (GraphPad Prism 6.0, GraphPad software). A P value <0.05 was considered statistically significant.
Integrated Analysis of Phosphoprotein by Bio-Plex
The culture lysates of cHCECs were harvested after 4-days cultivation and then immediately frozen and stored at −80° C until analysis. The phosphoprotein levels of the cHCEC lysates were analyzed by Luminex Corporation (Austin, TX) xMap Technology (Bio-Plex 200; Bio-Rad Laboratories, Inc., Hercules, CA) with the Bio-Plex Human 27-Plex Panel Kit (Bio-Rad Laboratories) according to the manufacturer's instructions. Among the multiple phosphoproteins, only phosphorylated platelet-derived growth factor-ββ (PDGF-ββ) receptor-B was used for this study. On the other hand, CS were harvested from the corresponding culture of cHCECs and spun in a centrifuge at 1580 g at room temperature for 10 minutes to remove detached cells. The CS were collected and filtered through 0.220-µm filters (Millex-GV; EMD Millipore Corporation, Temecula, CA). Enzyme-linked immunosorbent assay was performed by use of a PDGF-ββ human enzyme-linked immunosorbent assay kit (Abcam Plc., Cambridge, UK). The measurement of metabolites in the CS was carried out as described above.
Integral Proteomics by Liquid chromatography-Tandem Mass Spectrometry (LC/MS)
The cell lysates of cHCECs at passage 4 were used for the proteome analysis. The high-quality (HQ) cHCECs contained the CD44−/+ mature differentiated cHCEC SP at the ratio of 93.9 % (the effector ratio = E-ratio, n = 3) and the low-quality (LQ) cHCECs contained the CD44 ++/+++ immature cHCEC SP at the ratio of 73.8 % (n = 3) were analyzed. Cell lysates from 3 aliquots of each HQ or LQ cHCEC were dried and resolved in 20 mmol/L HEPES–NaOH (pH 58.0), 12 mmol/L sodium deoxycholate, and 12 mmol/L sodium N-lauroylsarcosinate. After reduction with 20 mmol/L dithiothreitol at 100° C for 10 minutes and alkylation with 50 mmol/L iodoacetamide at ambient temperature for 45 minutes, proteins were digested with immobilized trypsin (Thermo Fisher Scientific) with shaking at 1000 rpm at 37° C for 6 hours. After removal of sodium deoxycholate and sodium N-lauroylsarcosinate by ethyl acetate extraction, the resulting peptides were desalted by Oasis HLB m-elution plate (Waters) and subjected to mass spectrometric analysis. Peptides were analyzed by LTQ-Orbitrap-Velos mass spectrometer (Thermo Fisher Scientific) combined with Ulti- Mate 3000 RSLC nano-flow HPLC system (Thermo Fisher Scientific).
Protein identification and quantification analysis were performed with MaxQuant software. The MS/MS spectra were searched against the Homo sapiens protein database in Swiss-Prot, with a false discovery rate set to 1% for both peptide and protein identification filters. Only “Razor unique peptides” were used for calculation of relative protein concentration. For the integral analysis of proteins, all detected peaks were standardized by adjusting the median value to 1.0−104.
LC/MS Data-Set Analysis
The LC/MS data set, composed of 4641 proteins in total, was obtained by use of Proteome Discoverer 2.2 software. After removal of the data in which the abundance ratio could not be calculated, we analyzed the remaining data by means of a web-based program, DAVID v6.8 (The Database for Annotation, Visualization and Integrated Discovery; https://david.ncifcrf.gov). Finally, it ended up with 4315 genes, each with a unique DAVID Gene ID, for the subsequent analyses.
As for the gene expression analysis, we calculated the statistical P value and fold-change between 2 groups and drew the volcano plot to extract genes differentially expressed in HQ and LQ cHCECs. Further investigations for the focused genes, as well as the related genes/pathways that were suggested to be involved in cHCEC metabolism, were performed by using DAVID and its options “BIOCARTA” and “KEGG_PATHWAY.” We also referred their original databases of BioCarta (https://cgap.nci.nih.gov/Pathways/BioCarta_Pathways) or KEGG (Kyoto Encyclopedia of Genes and Genomes; https://www.genome.jp/kegg/) and showed the referred genes/pathways in the figures with slight modifications.
As for the gene ontology (GO) analysis, we divided the data into 3 groups based on the range of abundance ratio (LQ/HQ), and analyzed in DAVID with a “GOTERM_DIRECT” option by each group. The results of GO were sorted by the P-value and top ten-ranked GO terms in each group are shown. In LC/MS data analysis, the significance of difference between HQ and LQ cHCECs was assessed by Student's or Welch's t-test after the confirmation by F test.
Results
Variations of Metabolites in CS of HCECs
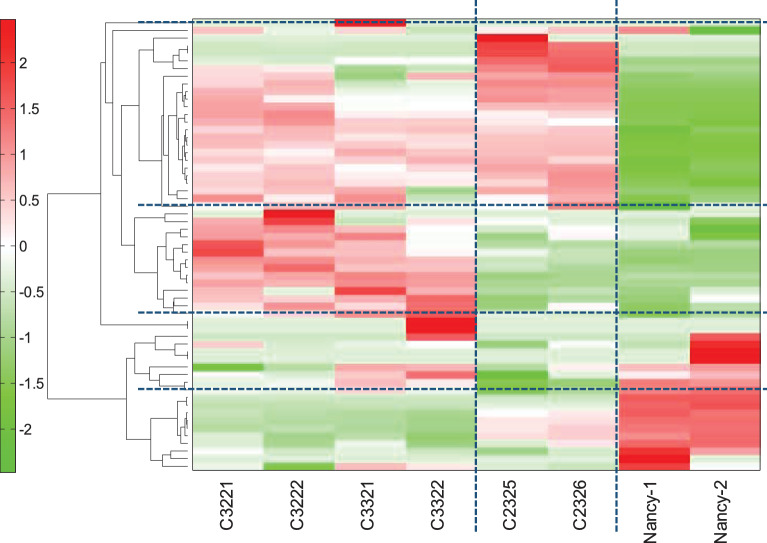
Aiming to develop a practical and noninvasive method for monitoring the conformity of cHCEC quality for regenerative therapy, we comprehensively surveyed the secretory metabolites in CS precisely assigned to the cHCEC SPs distinct in the expression levels of surface CD44 antigens. Cultured HCECs subjected to the analysis were C32 (P2, 17Y, ECD=3347), C33 (P2, 14Y, 3554), and C23 (P2, 18Y, 3280), all produced for clinical setting of cell infusion therapy. Unsupervised HCA of the metabolites in the CS among cHCECs, C32, C33, and C23 turned out to identify 4 metabolite clusters. Despite the superficially similar microscopic features of these 3 cHCECs (data not shown), the HCA differed greatly, between C32, 33, and C23 (Fig. 1). The distinction of these clustering coincided well with the distinct content of CD44−/+ SPs between these 2 groups; the former 2 were almost mature differentiated SPs with E-ratios, 94.6 and 99.3%, respectively, whereas the latter intermediary mature one was 76.3%. The clusters were divided into 3 metabolite clusters (Fig. 1): (1) increased metabolites in mature differentiated CD44−/+ cHCECs, namely glyoxylate, glycerol 3-phosphate acid, 2-phosphoglyceric acid, glycolic acid, folic acid, guanine, His, Thr, Pro, Phe, Trp, Tyr, and Lys, (2) decreased metabolites in mature differentiated CD44−/+ cHCECs, namely β-Ala, pyruvic acid, Ser, branched chain amino acids (BCAA) Ile, Leu, and Val, and citrulline, (3) increased metabolites in both cHCECs, namely TCA cycle related metabolic intermediates; lactic acid, malic acid, argininosuccinic acid, fumaric acid, cis-aconitic acid, isocitric acid, citric acid, succinic acid, urea-cycle-related metabolites, ornithine, uric acid, urea, and others (Table 1). The clustering of these metabolites clearly means the distinction in bioenergetics even between these 2 cHCECs, which differ only in the intensity of the expression levels of CD44 (>94% vs 75%).
Figure 1.
Hierarchical cluster analysis identified 3 metabolite subsets. Hierarchical clustering of the metabolites in the CS among cHCECs, C32, C33, and C23. Unsupervised HCA showed clear separation among these 3 lots of cHCECs. Cultured HCECs subjected to the analysis were C32 (male donor, P2, 23Y, ECD3884), C33 (male donor, P2, 29Y, ECD3309), and C23 (female donor, P2, 18Y, 3280). ECD, endothelial cell density in donor corneal tissues; P2, passage 2; Y, year of the corneal tissue donors.
Table 1.
Variations of Secreted Metabolites between High- and Low-Quality cHCECs
| Decreased Secretion in High-Quality cHCECs | Increased Secretion in High-Quality cHCECs | Increased Secretion in Low-Quality cHCECs |
|---|---|---|
| β-Ala | Glyoxylate | Lactic acid |
| Pyruvic acid | Glycerol 3-phosphate | Malic acid |
| Ser | 2-Phosphoglyceric acid | Argininosuccinic acid |
| BCAA (Ile, Leu, Val) | Glycolic acid | Fumaric acid |
| Citrulline | Folic acid | cis-Aconitic acid |
| Guanine | Isocitric acid | |
| His | Citric acid | |
| Thr | Succinic acid | |
| Pro | Ornithine | |
| Phe | Uric acid | |
| Trp | Urea | |
| Tyr | ||
| Lys |
High-Quality cHCECs corresponds to culture lots C32 (P2, 17Y, 3347) and C33 (P2, 14Y, 3554), and Low-Quality cHCECs to culture lot C23 (P2, 18Y, 3280) described in the text. Typical metabolites are listed.
Correlation of Secreted Lactic Acid or Pyruvic Acid with BCAA, Ser, and Gln
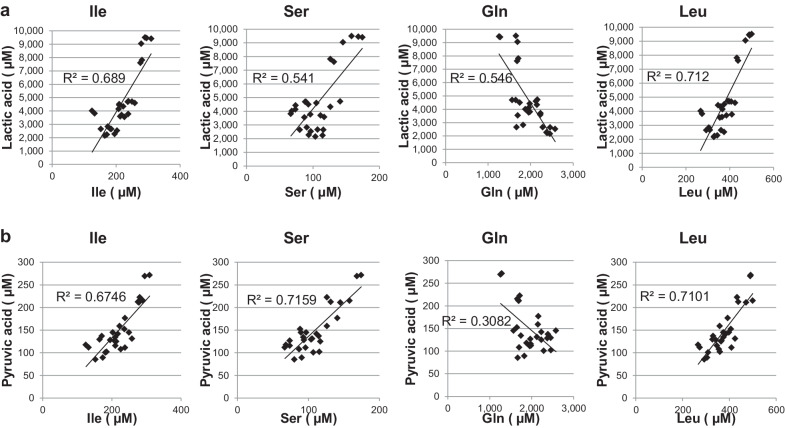
In the previous finding we had confirmed that CD44−/+ mature-differentiated cHCECs are disposed to mitochondria-dependent oxidative phosphorylation, whereas CD44++/+++ immature cHCECs with CST switched to a glycolytic metabotype.9 In this context, we next investigated, using 28 lots of cHCECs different in the content of SPs, the association of secreted lactic acid or pyruvic acid with BCAA, Ser and Gln, which were confirmed to be selectively up- or down-regulated in HCA analysis described above (Table 1). Pyruvic acid in the CS of cHCECs exhibited the positive correlation with Ile, Leu, and Ser (R2 = 0.675, 0.710, and 0.716, respectively), whereas the negative correlation was with Gln (R2 = 0.308) (Fig. 2a). The correlation of lactic acid in the CS of cHCECs exhibited almost the same tendency; positive correlation was with Ile, Leu and Ser (R2 = 0.689, 0.712 and 0.541, respectively), whereas the negative correlation was with Gln (R2 = 0.548) (Fig. 2b).
Figure 2.
Correlation of secreted lactic acid or pyruvic acid with BCAA, Ser, and Gln in the culture supernatants among 28 different lots of cHCECs. The metabolites were analyzed by CE-MS, as described in the text. (a) Association of secreted BCAA, Ser, Gln, and lactic acid. (b) Association of BCAA, Ser, Gln, and Pyruvic Acid
Association of Secreted Pyruvic Acid and Lactic Acid with E-Ratios
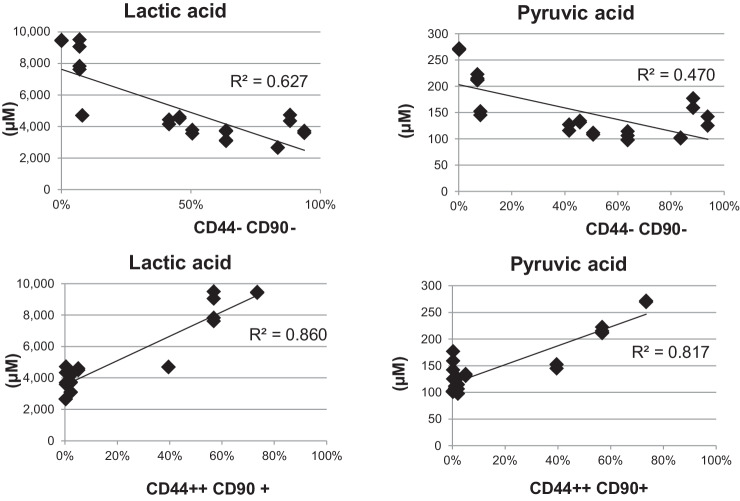
Both secreted pyruvic acid and lactic acid in the CS of 28 different lots of cHCECs were negatively correlated (R2 = 0.470 and 0.627, respectively) with the content of CD44-CD90- mature differentiated SPs in cHCECs, whereas those were positively correlated (R2 = 0.817 and 0.880, respectively) with that of CD44++/+++CD90+ immature SPs in cHCECs (Fig. 3). The content of CD44-CD90- mature SPs in cHCECs corresponds to the higher E-ratios in cHCECS, which had been designated in our previous publication.7,8 This means that lactic acid and pyruvic acid in the CS negatively correlated with the E-ratios.
Figure 3.
Association of secreted pyruvic acid and lactic acid with effector ratios (E-ratios). Both of secreted pyruvic acid and lactic acid in the CS were analyzed by CE-MS similarly as other metabolites. The cHCEC SP with surface expression of CD166+, CD105-, CD44-, CD26-, CD90-, and CD24- was designated as effector cells and the ratio of that SP was designated among heterogeneous cHCECs as an E-ratio.
Association of Phosphorylation of PDGFR-b with Secreted Products
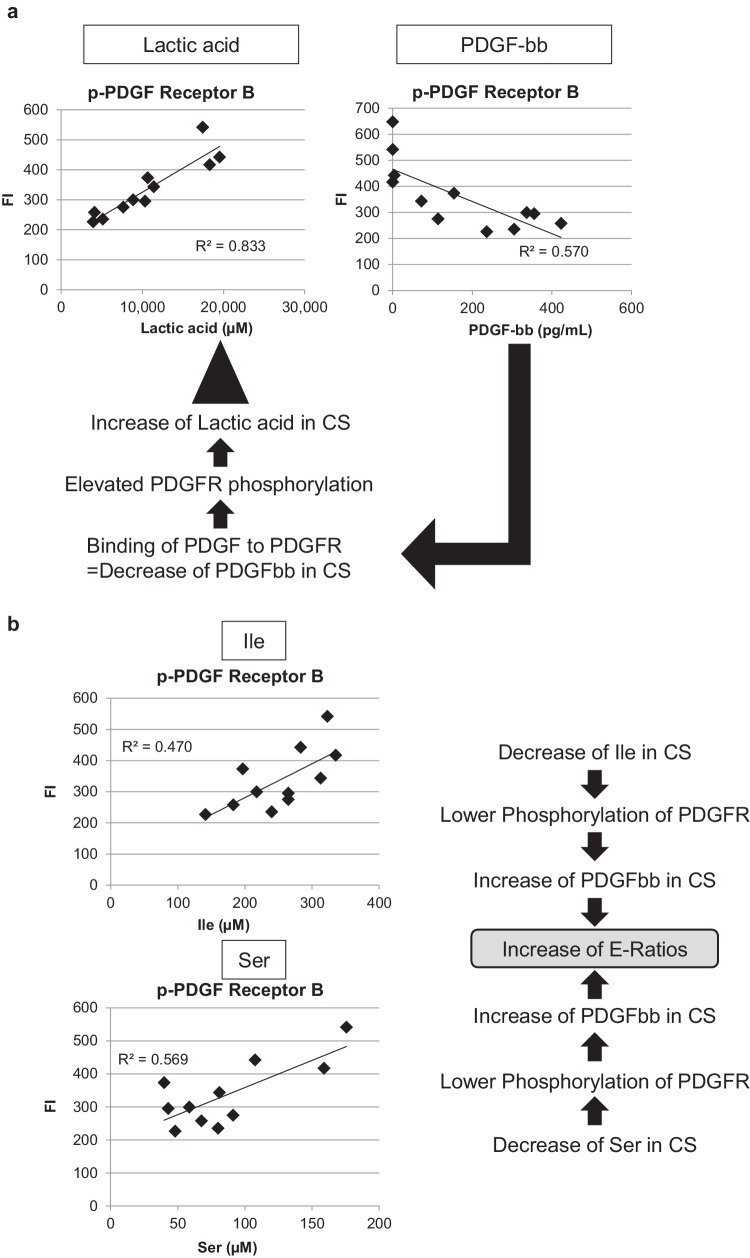
To investigate the roles of cytokines extracellularly secreted, we studied the effect of PDGF-ββ in modulating metabolic dynamics of cHCECs. Considering that PDGF-ββ is one of the most abundant cytokines secreted selectively from mature differentiated cHCECs (Hamuro, unpublished data), the amount of free PDGF-ββ ligand in CS of cHCECs, cultivated under different culture conditions producing divergent cHCEC SPs, might be greatly distinct. To confirm the hypothesis we prepared 12 different cultures from 3 separate donor corneal tissues. Actually as illustrated in Figure 4, the intensity of phosphorylation of PDGFR-B was inversely correlated with the amount of free PDGF-ββ in CS (R2 = 0.594) among 12 different cultures, n = 3 for each with one culture additive deleted, namely epidermal growth factor, SB2, or Y. All of the culture was extended either 34 or 35 days after cell seeding, and the cell lysates and the corresponding CS were analyzed.
Figure 4.
Diagram illustrating the inverse correlation of PDGF-ββ ligand and lactic acid, Ile, and Ser in the CS of cHCECs. The intensity of phosphorylation of PDGFR-B was measured as detailed in the text. Twelve different cultures, n=3 for each with one culture additive deleted, namely, no deletion control, –epidermal growth factor, –SB2, or –Y, were extended either 34 or 35 days after cell seeding, and the cell lysates and corresponding CSs were then analyzed. (a) Association of phosphorylation of PDGFR-B with lactic acid or PDGF-ββ in the CS. (b) Association of phosphorylation of PDGFR-B with Ile or Ser in the CS.
Of note, the amount of phosphorylated PDGFR-B was positively correlated with the amount of lactic acid in the CS (R2 = 0.832) (Fig. 4a), indicating the critical role of PDGF-ββ in rewiring of energy metabolism in cHCECs to dispose to glycolysis producing higher amount of lactic acid extracellularly. Accordingly, the amount of phosphorylated PDGFR-B was also positively correlated with the amount of Ile and Ser in the CS (R2 = 0.470 and 0.569, respectively) (Fig. 5b), indicating the critical role of these 2 amino acids in reducing PDGFR-B phosphorylation and in the increase of resulting PDGF-ββ in the CS, which in turn correlated with the elevation of E-ratios. This observation is also in consistent with the above-mentioned positive correlation of the amount of lactic acid in the CS with those of Ile and Ser (Fig. 2a).
Figure 5.
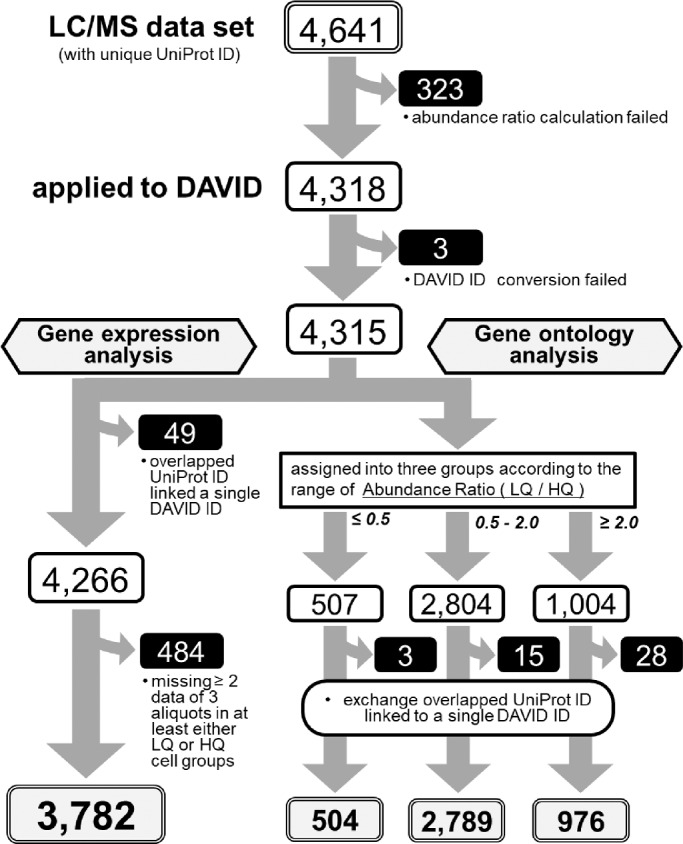
Flowchart of the LC/MS data analyses. The details are as described in the text.
Integral Proteome Analysis: Gene Ontology Analysis
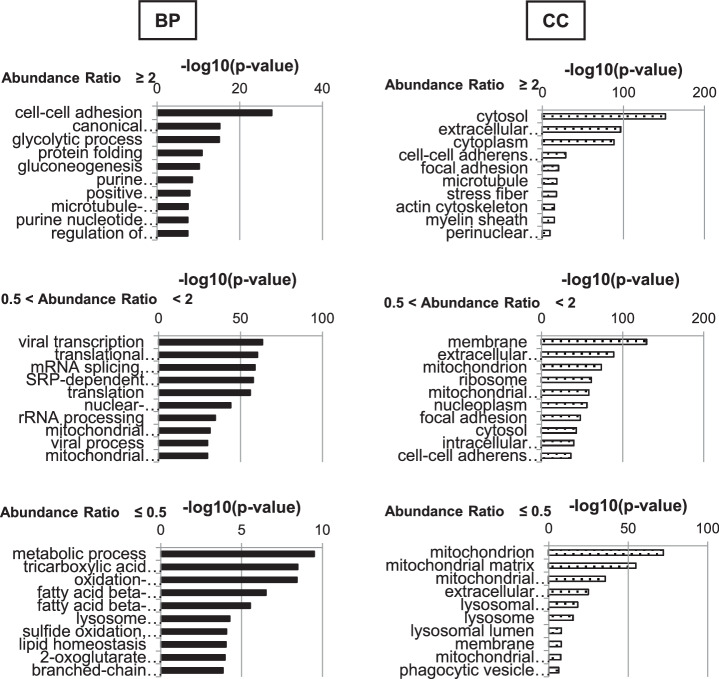
After calculating the abundance ratio for all proteins detected either in the immature LQ or mature differentiated HQ cHCEC SP, we analyzed the data by means of a web-based program, DAVID v6.8 for 4,315 genes. The numbers of identified proteins from these SPs were classified by Venn diagram. Total identified proteins (3781), immature LQ cHCEC dominant proteins (160), and mature differentiated HQ cHCEC dominant proteins (253) were characterized (the complete procedures are diagrammed in Fig. 5). Biologic characteristics of HQ and LQ cHCECs were clarified. Top ten−ranked biologic processes (BP) and cellular components (CC) for each group are shown as bar charts (Fig. 6). As illustrated in BP classification, cell-to-cell adhesion, glycolytic process, and glucogenesis-related proteins were enriched in the group with the abundance ratio >2.0, namely in LQ cHCECs, whereas metabolic process, TCA cycle, oxidation-reduction process, fatty acid β-oxidation, and branched-chain amino acid metabolism−related proteins were enriched in the group with the abundance ratio <0.5, namely in HQ cHCECs. These kinds of segregated distributions of distinct functional proteins were observed also in CC classification. Mitochondria and lysosome related proteins were enriched in HQ cHCECs, whereas cytosolic proteins, extracellular exosomes, stress fiber or actin cytoskeleton related proteins were enriched in LQ cHCECs. Some of the observations were fully consistent with our previous observation describing the metabolomic profiling segregated differentiated from dedifferentiated-cHCECs,9 the linkage of the dedifferentiation state with epithelial-mesenchymal transition and transformed fibroblastic cell morphology,7,8 and the observation that cHCECs SPs with CST secreted higher amount of exosomes than the mature differentiated cHCECs SPs.30
Figure 6.
Integral Proteome Analysis. GO term Analysis. The analysis was performed on the basis of the abundance ratios divided into three groups (>2.0, 0.5< ∼ <2, and <0.5). Only the top 10 ranked cellular components (CC) and biological processes (BP) are shown.
Elevated Expression of Anaplerotic Metabolic Enzymes in Immature cHCECs
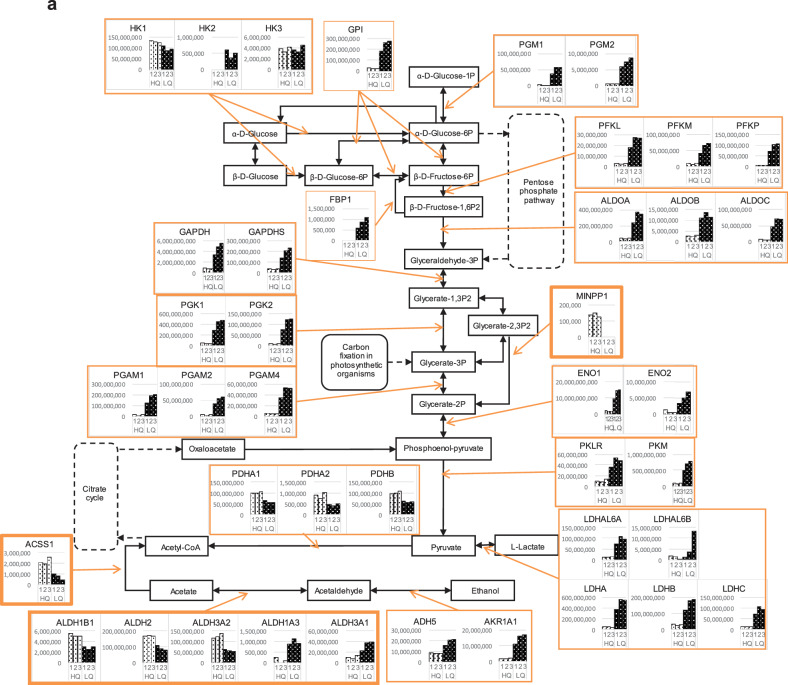
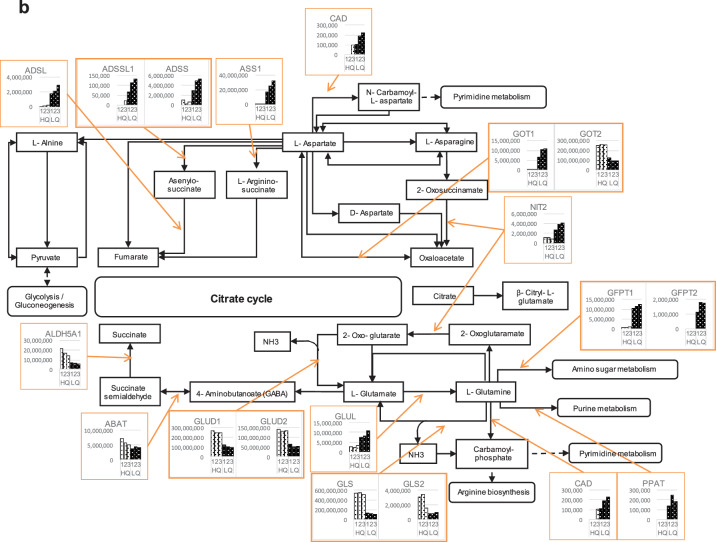
Further investigations for the focused genes and the related genes/pathways involved in cHCEC metabolism, were performed. The part of the referred genes/pathways were shown in the figures with slight modifications for glycolysis (a) and alanine, aspartate and glutamate metabolism (b) (Figs. 7a, b).
Figure 7.
Expression of key enzymes in 2 typical metabolisms in the cHCECs. (a) Glycolysis/Gluconeogenesis. (b) Alanine, aspartate, and glutamate metabolism.
Figure 7.
Continued.
It is of interest that most of the enzymes involved in the earlier metabolic stage of glycolysis were upregulated in immature LQ cHCEC SPs than in mature differentiated HQ cHCEC SPs. Typical enzymes are aldolase A, B, and C, enolase 1, 2, glyceraldehyde-3-phosphate dehydrogenase, glucose-6-phosphate isomerase hexokinase 2, lactate dehydrogenase A, phosphoglycerate mutase 1, 2, and 4, phosphoglucomutase 1, 2, and pyruvate kinase. On the other hand, pyruvate dehydrogenase (conversion of pyruvate to acetyl-CoA) and aldehyde dehydrogenase 2 family (mitochondrial localized) were selectively upregulated in HQ cHCEC SPs, whereas other isoforms of aldehyde dehydrogenase were isoform specifically upregulated either in HQ or LQ cHCEC SPs.
In regard to alanine, aspartate, and glutamate metabolism (Fig. 7b), argininosuccinate synthase 1 (ASS1), known as the catalytic enzymes in urea cycle, and glutamate-ammonia ligase were upregulated in the LQ cHCEC SPs, whereas, to the contrary, the reduced expression was evident for glutamate dehydrogenase 1, 2 and mitochondrial glutaminase in those SPs (Fig. 7b)
Discussion
We previously reported the presence of heterogeneous cHCEC SPs and identified 1 specified mature differentiated SPs, sharing the surface phenotypes with mature HCECs in fresh CE tissues and with the expression of CD166+, 133-, 105-, 44-, 26-, and 24-, as a candidate cHCEC SP for the cell therapy against CE dysfunctions.2,7,8
The homeostatic cellular identity of cHCECs may require passive adaptation to environmental culture conditions. Upon exposure to divergent stimuli in cultures, cHCECs dynamically regulate the transcriptional response that results in either differentiation or CST including dedifferentiation. In our culture system, the presence of Y induced the differentiation of cHCECs with reduced expression of CD44.9 Consistent with the observation, CD44++/+++ immature cHCECs displayed segregated profiles of extracellularly secreted metabolites; the increased amount of lactic acid, while the decreased amount of pyruvic acid, Ser, and BCAA was evident in mature differentiated cHCEC SPs (Table 1). Not only lactic acid, but also other TCA cycle intermediates, such as malic acid, fumaric acid, cis-aconitic acid, isocitric acid, citric acid, and succinic acid, were secreted increasingly by CD44++/+++ immature cHCEC SPs, compared with CD44−/+ mature differentiated SPs (Table 1). The increased secretion of TCA cycle intermediates by the former SPs is seemingly incompatible with our previous argument that the latter SPs are disposed to mitochondria dependent oxidative phosphorylation. However, and of interest, most enzymes with mitochondrial-localized reductive activity were upregulated in the differentiated SPs, whereas most with cytosolic reductive activity were upregulated in immature SPs (Fig. 7a), similar to what we found in a recent study on enzymes involved in TCA cycle (Numa et al., unpublished data).
It is of note that the amounts of secreted BCAA and Ser were positively associated with those of secreted lactic acid and pyruvic acid (Figs. 1 and 2). This imply that CD44−/+ SPs catabolize BCAA and Ser more actively than CD44++/+++ SPs, which may be conceptually rationalized by recent findings.26,27 The elevated BCAA metabolism is more active in differentiated leukemia than in undifferentiated leukemia.26 In actual, BCAT2, a mitochondrial aminotransferase for BCAA and BCKDH, branched chain keto acid dehydrogenase, were upregulated in CD44−/+ SPs (Supplementary Fig. S2). In a fuel-efficient mode more pyruvate is diverted to the mitochondria and more glucose-derived carbon is channeled into serine biosynthesis to support cell proliferation.27 To the contrary negative association of the amount of Gln in the CS with those of secreted lactic acid and pyruvic acid (Fig. 2) may imply that CD44++/+++ SPs catabolize Gln more actively than CD44- SPs.
Myc-induced alterations in glucose (Glc) and Gln metabolism and overexpressed c-Myc resulted in the concurrent conversion of Glc to lactate and the oxidation of Gln via the TCA cycle28 and these were the case also in our present study in the context of elevated expression of anaplerotic metabolic enzymes in immature SPs (Fig. 7; Table 2). c-Myc reportedly regulates lactate production through transcriptional regulation and is an important regulator for glycolysis.21,23–25 In this regard, it is noteworthy that c-Myc is also regulating CD44 expression,21 which is the key in distinguishing differentiated cHCECs from either immature SPs or SPs with CST. These finding can be interpreted into the negative association of effector (differentiated SP) ratios (E-ratios) of heterogeneous bulk cHCECs with secreted lactic acid and pyruvic acid (Fig. 2). It should be noted that CD44 might be repressed by wild-type p5329 in consistent with our previous finding of upregulated p53 in CD44−/+ differentiated SPs.30 It should be noted that mutant p53 promotes aerobic glycolysis.29
Table 2.
Segregated Expression of Anaplerotic and Cataplerotic Metabolic Enzymes
| Pathway | Gene Symbol | Description | HQ | LQ |
|---|---|---|---|---|
| Glycolysis | ||||
| ALDOA | Aldolase, fructose-bisphosphate A | + | ||
| ALDOB | Aldolase, fructose-bisphosphate B | + | ||
| ALDOC | Aldolase, fructose-bisphosphate C | + | ||
| ENO1 | Enolase 1 | + | ||
| ENO2 | Enolase 2 | + | ||
| GAPDH | Glyceraldehyde-3-phosphate dehydrogenase | + | ||
| GPI | Glucose-6-phosphate isomerase | + | ||
| HK2 | Hexokinase 2 | + | ||
| LDHA | Lactate dehydrogenase A | + | ||
| PGAM1 | Phosphoglycerate mutase 1 | + | ||
| PGAM2 | Phosphoglycerate mutase 2 | + | ||
| PGAM | Phosphoglycerate mutase family member 4 | + | ||
| PGM1 | Phosphoglucomutase 1 | + | ||
| PGM2 | Phosphoglucomutase 2 | + | ||
| PKLR | Pyruvate kinase, liver and RBC | + | ||
| PKM | Pyruvate kinase, muscle | + | ||
| Alanine, aspartate, and glutamate metabolism | ||||
| ABAT | 4-Aminobutyrate aminotransferase | + | ||
| ADSL | Adenylosuccinate lyase | + | ||
| ADSS | Adenylosuccinate synthase | + | ||
| ADSSL1 | Adenylosuccinate synthase-like 1 | + | ||
| ALDH5A1 | Aldehyde dehydrogenase 5 family member A1 | |||
| ASS1 | Argininosuccinate synthase 1 | + | ||
| CAD | Carbamoyl-phosphate synthetase 2, aspartate transcarbamylase, and dihydro-orotase | |||
| GFPT1 | Glutamine-fructose-6-phosphate transaminase 1 | + | ||
| GFPT2 | Glutamine-fructose-6-phosphate transaminase 2 | + | ||
| GLS | Glutaminase | + | ||
| GLS2 | Glutaminase 2 | + | ||
| GLUD1 | Glutamate dehydrogenase 1 | + | ||
| GLUD2 | Glutamate dehydrogenase 2 | + | ||
| GLUL | Glutamate-ammonia ligase | + | ||
| GOT1 | Glutamic-oxaloacetic transaminase 1 | + | ||
| GOT2 | Glutamic-oxaloacetic transaminase 2 | + | ||
| PPAT | Phosphoribosyl pyrophosphate amidotransferase | + | ||
Given the recent finding that PDGF-ββ stimulated Glc uptake, lactate production, and ATP production through lactate dehydrogenase A (LDHA)31 and the segregated upregulation of LDHA in CD44++/+++ SPs (Fig. 7a), it is conceivable that the amount of PDGF-ββ in the CS of cHCECs may have the close association with secreted lactate as shown in Figure 4a. The decreased signaling through PDGF-ββ-PDGFR-B binding (PDGFR-B phosphorylation) resulted in the increased amount of residual PDGF-ββ and the reduction of secreted lactate in the CS of CD44-SPs (Fig. 4a). The similar association was also confirmed between the amount of residual PDGF-ββ in the CS and the secreted Ile or Ser in the CS (Fig. 4b). We are currently using PDGF-ββ and lactic acid in CS as noninvasive biomarkers to qualify the culture process and the content of mature differentiated cHCEC SPs product for cell therapy in clinical settings.
Our present data may indicate that dissecting metabolic processes in cHCEC differentiation will provide essential cues to understand the dynamics of cell fate modulation in cHCECs, because chemical fluxes can affect both transcriptional and epigenetic mechanisms.32 It is a shift from oxidative phosphorylation to aerobic glycolysis characteristic of cancer cells (the Warburg effect in pre-differentiated cells).33–36 Myc is depicted to regulate genes involved in Glc metabolism (e.g., hexokinase 2, pyruvate kinase M2, LDHA, and pyruvate dehydrogenase kinase 1, favoring the conversion of Glc to lactate.37 Enhanced expression of these glycolytic enzymes (Fig. 7a) is a hallmark of oncogenic signaling and transcriptional networks38 or the dedifferentiation into pluripotency with proliferating capability. In glycolysis, most glucose carbon is converted to pyruvate and NADH-dependent reduction of pyruvate to lactate by LDH.39 This reductive reaction recycles the NAD+ reduced to NADH during glycolysis.40
Anaplerosis via glutaminolysis or pyruvate carboxylation, as well as other sources such as fatty acids, contribute to the additional supplies of biosynthetic precursors not met by Glc metabolism.10,40,41 Gln is converted to α-KG for catabolism through the TCA cycle to malate, which is transported into the cytoplasm and converted to pyruvate and then to lactate.41 Recent report described that glutaminolysis mainly sustains ATP production in terminally-differentiated nonproliferating HCE and accelerated the CE pump function,10 although the authors described that relative contribution of 2 energy sources Glc and Gln into the TCA cycle will require further investigation.
Genes involved in both Glc and Gln metabolism are regulated by c-Myc and c-Myc overexpressing cells appear to become addicted to Gln.37 A Glc-independent TCA cycle solely supported by Gln involved the supply of acetyl-CoA and oxaloacetic acid (OAA) to the TCA cycle.28 Most of genes involved in Glc metabolism were elevated in immature SPs; however, those involved in Gln were segregated between mature differentiated and immature SPs (Table 2). To dissect the role of anaplerosis via glutaminolysis (TCA cycle or urea cycle) among cHCECs SPs can provide critical insights into how cell fate decisions are established either in vitro or in vivo pathogenesis of HCE disorders. To establish a possible application of the metabolomics included in this study as biomarkers for diagnosis, it would require a very precise analysis of the correlation of the in vitro metabolomics reported in this study with the metabolites in the aqueous humor after the infusion of the cHCECs.
Divergent energetic requirements among heterogeneous cHCECs may implicate either a segregated metabolic profile or distinct mitochondria biogenesis between mature differentiated and immature cHCECs. Further intensive researches in this field will provide the new molecular target for the therapy of CE disorders beyond cell therapy.
Supplementary Material
Acknowledgments
The authors thank Asako Uehara and Kazuko Asada for technical assistance, Yoko Hamuro and Keiko Takada for secretarial assistance, and John Bush for his excellent review of the manuscript. The authors also thank Takahiro Ito and Kenjiro Kami.
Supported by the Highway Program for Realization of Regenerative Medicine and The Projects for Technological Development from Japan Agency for Medical Research and Development, AMED and JSPS KAKENHI Grant Numbers JP26293376.
Disclosure: J. Hamuro, None; K. Numa, None; T. Fujita, None; M. Toda, None; K. Ueda, None; Y. Tokuda, None; A. Mukai, None; M. Nakano, None; M. Ueno, None; S. Kinoshita, None; C. Sotozono, None
References
- 1. Dawson DG, Ubels JL, Edelhauser HF. Cornea and sclera. In: Levin LA, Nilsson SFE, Ver Hoeve J, Wu SM, eds. Adler's physiology of the eye. 11th ed Edinburgh: Elsevier; 2011: 71–130. [Google Scholar]
- 2. Kinoshita S, Koizumi N, Ueno M, et al.. Injection of cultured cells with a ROCK inhibitor for bullous keratopathy. N Engl J Med. 2018; 378: 995–1003. [DOI] [PubMed] [Google Scholar]
- 3. Koizumi N, Sakamoto Y, Okumura N, et al.. Cultivated corneal endothelial cell sheet transplantation in a primate model. Invest Ophthalmol Vis Sci. 2007; 48: 4519–4526. [DOI] [PubMed] [Google Scholar]
- 4. Okumura N, Ueno M, Koizumi N, et al.. Enhancement on primate corneal endothelial cell survival in vitro by a ROCK inhibitor. Invest Ophthalmol Vis Sci. 2009; 50: 3680–3687. [DOI] [PubMed] [Google Scholar]
- 5. Okumura N, Koizumi N, Ueno M, et al.. ROCK inhibitor converts corneal endothelial cells into a phenotype capable of regenerating in vivo endothelial tissue. Am J Pathol. 2012; 181: 268–277. [DOI] [PubMed] [Google Scholar]
- 6. Hongo A, Okumura N, Nakahara M, Kay EP, Koizumi N. The effect of a p38 mitogen-activated protein kinase inhibitor on cellular senescence of cultivated human corneal endothelial cells. Invest Ophthalmol Vis Sci. 2017; 58: 3325–3334. [DOI] [PubMed] [Google Scholar]
- 7. Hamuro J, Toda M, Asada K, et al.. Cell homogeneity indispensable for regenerative medicine by cultured human corneal endothelial cells. Invest Ophthalmol Vis Sci. 2016; 57: 4749–4761. [DOI] [PubMed] [Google Scholar]
- 8. Toda M, Ueno M, Hiraga A, et al.. Production of homogeneous cultured human corneal endothelial cells indispensable for innovative cell therapy. Invest Ophthalmol Vis Sci. 2017; 58: 2011–2020. [DOI] [PubMed] [Google Scholar]
- 9. Hamuro J, Ueno M, Asada K, et al. Metabolic plasticity in cell state homeostasis and differentiation of cultured human corneal endothelial cells. Invest Ophthalmol Vis Sci. 2016; 57: 4452–4463. [DOI] [PubMed] [Google Scholar]
- 10. Zhang W, Li D, Diego G, et al.. Glutaminolysis is essential for energy production and ion transport in human corneal endothelium. EBioMedicine. 2017; 16: 292–301. [DOI] [PMC free article] [PubMed] [Google Scholar]
- 11. Sousa MI, Rodrigues AS, Pereira S, et al.. Mitochondrial mechanisms of metabolic reprogramming in proliferating cells. Curr Med Chem. 2015; 22: 2493–2504. [DOI] [PubMed] [Google Scholar]
- 12. Lisowski P, Kannan P, Mlody B, Prigione A. Mitochondria and the dynamic control of stem cell homeostasis. EMBO Rep. 2018; 19(5). pii: e45432. [DOI] [PMC free article] [PubMed] [Google Scholar]
- 13. Laing RA, Chiba K, Tsubota K, Oak SS. Metabolic and morphologic changes in the corneal endothelium. The effects of potassium cyanide, iodoacetamide, and ouabain. Invest Ophthalmol Vis Sci. 1992; 33: 3315–3324. [PubMed] [Google Scholar]
- 14. Greiner MA. Regional assessment of energy-producing metabolic activity in the endothelium of donor corneas. Invest Ophthalmol Vis Sci. 2015; 56: 2803–2810. [DOI] [PubMed] [Google Scholar]
- 15. Herrera AS, Del C A Esparza M, Ashraf G, Zamyatnin AA, Aliev G. Beyond mitochondria, what would be the energy source of the cell? Cent Nerv Syst Agents Med Chem. 2015; 15: 32–41. [DOI] [PubMed] [Google Scholar]
- 16. Tatsuta T, Langer T. Quality control of mitochondria: protection against neurodegeneration and ageing. EMBO J. 2008; 27: 306–314. [DOI] [PMC free article] [PubMed] [Google Scholar]
- 17. Youle RJ, van der Bliek AM. Mitochondrial fission, fusion, and stress. Science. 2012; 337: 1062–1065. [DOI] [PMC free article] [PubMed] [Google Scholar]
- 18. Wilson DF. Oxidative phosphorylation: regulation and role in cellular and tissue metabolism. J Physiol. 2017; 595: 7023–7038. [DOI] [PMC free article] [PubMed] [Google Scholar]
- 19. Wallace DC. Mitochondria and cancer. Nat Rev Cancer. 2012; 12: 685–698. [DOI] [PMC free article] [PubMed] [Google Scholar]
- 20. Wang YH, Israelsen WJ, Lee D, et al.. Cell-state-specific metabolic dependency in hematopoiesis and leukemogenesis. Cell. 2014; 158: 1309–1323. [DOI] [PMC free article] [PubMed] [Google Scholar]
- 21. Davidson SM, Vander Heiden MG. METabolic adaptations in the tumor MYCroenvironment. Cell Metab. 2012; 15: 131–133. [DOI] [PubMed] [Google Scholar]
- 22. Nagano O, Saya H. Mechanism and biological significance of CD44 cleavage. Cancer Sci. 2004; 95: 930–935. [DOI] [PMC free article] [PubMed] [Google Scholar]
- 23. Miller DM, Thomas SD, Islam A, Muench D, Sedoris K. c-Myc and cancer metabolism. Clin Cancer Res. 2012; 18: 5546–5553. [DOI] [PMC free article] [PubMed] [Google Scholar]
- 24. Morrish F, Neretti N, Sedivy JM, Hockenbery DM. The oncogene c-Myc coordinates regulation of metabolic networks to enable rapid cell cycle entry. Cell Cycle. 2008; 7: 1054–1066. [DOI] [PMC free article] [PubMed] [Google Scholar]
- 25. Osthus RC, Shim H, Kim S, et al.. Deregulation of glucose transporter 1 and glycolytic gene expression by c-Myc. J Biol Chem. 2000; 275: 21797–21800. [DOI] [PubMed] [Google Scholar]
- 26. Hattori A, Tsunoda M, Konuma T, et al.. Cancer progression by reprogrammed BCAA metabolism in myeloid leukaemia. Nature. 2017; 545: 500–504. [DOI] [PMC free article] [PubMed] [Google Scholar]
- 27. Chaneton B, Hillmann P, Zheng L, et al.. Serine is a natural ligand and allosteric activator of pyruvate kinase M2. Nature. 2012; 491: 458–462. [DOI] [PMC free article] [PubMed] [Google Scholar]
- 28. Le A, Lane A, Hamaker M, et al. Glucose-independent glutamine metabolism via TCA cycling for proliferation and survival in B cells. Cell Metab. 2012; 15: 110–121. [DOI] [PMC free article] [PubMed] [Google Scholar]
- 29. Godar S, Ince TA, Bell GW, et al.. Growth-inhibitory tumor suppressive functions of p53 depend on its repression of CD44 expression. Cell. 2008; 134: 62–73. [DOI] [PMC free article] [PubMed] [Google Scholar]
- 30. Ueno M, Asada K, Toda M, et al. Concomitant evaluation of a panel of exosome proteins and MiRs for qualification of cultured human cornea endothelial cells. Invest Ophthalmol Vis Sci. 2016; 57: 4393–4402. [DOI] [PubMed] [Google Scholar]
- 31. Kim JH, Bae KH, Byun JK, et al.. Lactate dehydrogenase-A is indispensable for vascular smooth muscle cell proliferation and migration. Biochem Biophys Res Commun. 2017; 492: 41–47. [DOI] [PubMed] [Google Scholar]
- 32. Moussaieff A, Rouleau M, Kitsberg D, et al.. Glycolysis-mediated changes in acetyl-CoA and histone acetylation control the early differentiation of embryonic stem cells. Cell Metab. 2015; 21: 392–402. [DOI] [PubMed] [Google Scholar]
- 33. Folmes CDL, Nelson TJ, Martinez-Fernandez A, et al.. Somatic oxidative bioenergetics transitions into pluripotency-dependent glycolysis to facilitate nuclear reprogramming. Cell Metab. 2011; 14: 264–271. [DOI] [PMC free article] [PubMed] [Google Scholar]
- 34. Panopoulos AD, Yanes O, Ruiz S, et al.. The metabolome of induced pluripotent stem cells reveals metabolic changes occurring in somatic cell reprogramming. Cell Res. 2012; 22: 168–177. [DOI] [PMC free article] [PubMed] [Google Scholar]
- 35. Zhu S, Li W, Zhou H, et al.. Reprogramming of human primary somatic cells by OCT4 and chemical compounds. Cell Stem Cell. 2010; 7: 651–655. [DOI] [PMC free article] [PubMed] [Google Scholar]
- 36. Hanahan D, Weinberg RA. Hallmarks of cancer: the next generation. Cell. 2011; 144: 646–674. [DOI] [PubMed] [Google Scholar]
- 37. Dang CV, Le A, Gao P. MYC-induced cancer cell energy metabolism and therapeutic opportunities. Clin Cancer Res. 2009; 15: 6479–6483. [DOI] [PMC free article] [PubMed] [Google Scholar]
- 38. Faubert B, Li KY, Cai L, et al.. Lactate metabolism in human lung tumors. Cell. 2017; 171: 358–371.e9. [DOI] [PMC free article] [PubMed] [Google Scholar]
- 39. DeBerardinis RJ, Lum JJ, Hatzivassiliou G, Thompson CB. The biology of cancer: metabolic reprogramming fuels cell growth and proliferation. Cell Metab. 2008; 7: 11–20. [DOI] [PubMed] [Google Scholar]
- 40. Martínez-Reyes I, Chandel NS. Waste not, want not: lactate oxidation fuels the TCA cycle. Cell Metab. 2017; 26: 803–804. [DOI] [PubMed] [Google Scholar]
- 41. Jin L, Alesi GN, Kang S. Glutaminolysis as a target for cancer therapy. Oncogene. 2016; 35: 3619–3625. [DOI] [PMC free article] [PubMed] [Google Scholar]
Associated Data
This section collects any data citations, data availability statements, or supplementary materials included in this article.


