

Abstract
Purpose:
Ductal carcinoma in situ (DCIS) is a non-obligate precursor of invasive breast cancer. Here, we sought to investigate the level of intra-lesion genetic heterogeneity in DCIS and the patterns of clonal architecture changes in the progression from DCIS to invasive disease.
Design:
Synchronous DCIS (n=27) and invasive ductal carcinomas of no special type (IDC-NSTs; n=26) from 25 patients and pure DCIS (n=7) from 7 patients were microdissected separately and subjected to high-depth whole-exome (n=56) or massively parallel sequencing targeting ≥410 key cancer-related genes (n=4). Somatic genetic alterations, mutational signatures, clonal composition and phylogenetic analyses were defined using validated computational methods.
Results:
DCIS revealed genetic alterations similar to those of synchronously diagnosed IDC-NSTs and of non-related IDC-NSTs from The Cancer Genome Atlas (TCGA), whereas pure DCIS lacked PIK3CA mutations. Clonal decomposition and phylogenetic analyses based on somatic mutations and copy number alterations revealed that the mechanisms of progression of DCIS to invasive carcinoma are diverse, and that clonal selection might have constituted the mechanism of progression from DCIS to invasive disease in 28% (7/25) of patients. DCIS displaying a pattern of clonal selection in the progression to invasive cancer harbored higher levels of intra-lesion genetic heterogeneity than DCIS where no clonal selection was observed.
Conclusions:
Intra-lesion genetic heterogeneity is a common feature in DCIS synchronously diagnosed with IDC-NST. DCIS is a non-obligate precursor of IDC-NST, whose mechanisms of progression to invasive breast cancer are diverse and vary from case to case.
Keywords: ductal carcinoma in situ, invasive ductal carcinoma, whole-exome sequencing, clonal decomposition, non-obligate precursor, clonal relatedness, progression
INTRODUCTION
Ductal carcinoma in situ (DCIS) constitutes a bona fide non-obligate precursor of invasive breast cancer (1), and due to advances in imaging techniques, is being detected with increasing frequency (2). DCIS and invasive ductal carcinoma of no special type (IDC-NST) have been found to be genetically similar (3,4). Indeed, as a group, synchronous DCIS and IDC-NSTs show remarkable resemblance in terms of gene expression profiles and gene copy number alterations (CNAs) (4–6). Progression to invasive carcinoma has been estimated to occur in up to 40% of untreated DCIS (4,7–9). The molecular mechanisms driving progression of DCIS to invasive carcinoma remain contentious (10,11). Various evolutionary models for progression of DCIS to invasive carcinoma have been proposed, including i) the independent evolution model, which proposes that DCIS and invasive carcinoma are not genetically related and evolve in parallel (12), ii) the evolutionary bottleneck model, which posits that a single cell gives rise to different clones, followed by selection of a single clone which traverses the basement membrane invading the surrounding stroma (13), and iii) the multiclonal invasion model, which suggests that evolution takes place in the DCIS, with ensuing generation of multiple subclones that co-migrate and co-invade resulting in the establishment of invasive carcinoma (14). In the latter scenario, one could posit that the ability of invading may have been acquired by DCIS cells early in the evolution, prior to the development of intra-lesion heterogeneity, or that invasion is either a passive phenomenon from the perspective of the cancer cells or is primarily driven by the microenvironment.
Single cell and bulk tumor sequencing studies conducted by our group (4,15) and others (14) have revealed vast intratumor heterogeneity in DCIS, and provided direct evidence of different mechanisms resulting in progression of DCIS to invasive carcinoma, including clonal selection and multiclonal invasion (4,14,15). Here, through the study of synchronously diagnosed DCIS and IDC-NST and of DCIS that did not progress to invasive carcinoma, we sought to define the genetic heterogeneity of DCIS, and the repertoire of genetic alterations and clonal architecture of synchronously diagnosed DCIS and IDC-NST to catalogue the patterns of clonal architecture changes in the progression from DCIS to invasive breast cancer.
MATERIALS AND METHODS
Subjects and samples
This study was approved by the Institutional Review Board (IRB) of Memorial Sloan Kettering Cancer Center (MSKCC), and written informed consent was obtained according to the approved protocol. This study is in compliance with the Declaration of Helsinki. Formalin-fixed paraffin-embedded (FFPE) tissue blocks were retrieved from MSKCC’s pathology archives. Samples were anonymized prior to tissue processing. All cases were reviewed by five pathologists (FP, RB, FCG, MV and HYW) for diagnosis confirmation following criteria put forward by the World Health Organization (16). Following pathology review, 27 synchronous DCIS and IDC-NST (n=26), including two cases of multifocal/multicentric DCIS, and 7 DCIS not associated with invasion (pure DCIS) were included in this study (Table 1). DCIS and IDC-NSTs were separately microdissected from 10–20 eight-micron-thick histological sections under a stereomicroscope (Olympus SZ61) to ensure a tumor cell content >80%, as described (4). DNA was extracted from tumor and matched normal tissues, confirmed by pathology review to be devoid of neoplastic cells, using the DNAeasy Blood and Tissue Kit (Qiagen) according to manufacturers’ instructions (17). DNA quantification and quality control were performed using a Qubit fluorometer (Invitrogen) and a TapeStation system (Agilent), respectively. The DNA samples derived from DCIS, IDC-NST and normal breast tissue away from DCIS or IDC-NST were subjected to whole-exome sequencing (WES; Cases 2, 4–8, 10–13, 18–19, 21–26, 28, 30–35, 38 and 40) or to massively parallel sequencing targeting all coding regions of 410 (Case 3) or 468 (Case 9) cancer-related genes using the MSK Integrated Mutation Profiling of Actionable Cancer Targets (MSK-IMPACT) assay (18). Sequencing results of four of the patients included in this study (i.e., Cases 14, 15, 16 and 17) were presented in part in Lee et al., Begg et al. and Weigelt et al. (19–21). For these cases, the raw WES sequencing data (i.e. FASTQ files) from DCIS, IDC-NST and normal breast were retrieved and processed using the same bioinformatics pipeline employed for the analysis of the samples sequenced solely for the purpose of this study.
Table 1:
Clinicopathologic characteristics of the DCIS and IDC-NSTs included in this study.
| Case ID | Sample ID | Age (years) | Histology | DCIS type | Laterality | Quadrant | Invasive tumor size (mm) | Grade* | ER | HER2 |
|---|---|---|---|---|---|---|---|---|---|---|
| 2 | ||||||||||
| 2IDCB | 41 | IDC-NST | N/A | Right | LOQ | 13 | 3 | - | - | |
| 3 | 3DCIS | 75 | DCIS | Synchronous | Left | LOQ | N/A | 2 | + | - |
| 4 | 4DCIS | 45 | DCIS | Synchronous | Right | LOQ | N/A | 3 | + | - |
| 5 | 5DCISA | 44 | DCIS | Synchronous | Right | LIQ | N/A | 2 | + | - |
| 6 | 6DCIS | 53 | DCIS | Synchronous | Right | UIQ | N/A | 2 | + | - |
| 7 | 7DCIS | 31 | DCIS | Synchronous | Left | LOQ | N/A | 3 | + | - |
| 8 | 8DCIS | 47 | DCIS | Synchronous | Right | UOQ | N/A | 2 | + | - |
| 9 | 9DCIS | 53 | DCIS | Synchronous | Right | UIQ | N/A | 3 | + | - |
| 10 | 10DCIS | 37 | DCIS | Synchronous | Right | UIQ | N/A | 2 | + | - |
| 12 | 12DCIS | 59 | DCIS | Synchronous | Right | UIQ | N/A | 2 | + | - |
| 13 | 13DCIS | 52 | DCIS | Synchronous | Left | LOQ-LIQ | N/A | 3 | + | - |
| 14 | 14DCIS | 52 | DCIS | Synchronous | Left | UIQ | N/A | 2 | + | - |
| 15 | 15DCIS | 27 | DCIS | Synchronous | Left | UOQ | N/A | 2 | + | - |
| 16 | 16DCIS | 50 | DCIS | Synchronous | Left | UIQ | N/A | 2 | + | - |
| 17 | 17DCIS | 46 | DCIS | Synchronous | Unknown | Unknown | N/A | 2 | + | + |
| 18 | 18DCIS | 61 | DCIS | Synchronous | Right | LOQ/LIQ | N/A | 3 | + | + |
| 19 | 19DCIS | 53 | DCIS | Synchronous | Right | UOQ | N/A | 3 | - | - |
| 21 | 21DCIS | 51 | DCIS | Synchronous | Right | LIQ | N/A | 3 | - | + |
| 22 | 22DCIS | 76 | DCIS | Synchronous | Right | UOQ-UIQ | N/A | 3 | - | - |
| 23 | 23DCIS | 63 | DCIS | Synchronous | Right | LOQ | N/A | 3 | - | - |
| 24 | 24DCIS | 37 | DCIS | Synchronous | Right | LOQ | N/A | 3 | + | - |
| 25 | 25DCIS | 54 | DCIS | Synchronous | Right | UOQ-UIQ | N/A | 3 | - | - |
| 26 | 26DCIS | 66 | DCIS | Synchronous | Right | UOQ | N/A | 3 | + | + |
| 28 | 28DCIS | 49 | DCIS | Synchronous | Left | LOQ | N/A | 3 | + | + |
| 30 | 30DCIS | 26 | DCIS | Synchronous | Right | UOQ | N/A | 3 | + | + |
| 31 | 31DCIS | 50 | DCIS | Pure | Left | UIQ | N/A | 3 | + | - |
| 32 | 32DCIS | 27 | DCIS | Pure | Left | LOQ | N/A | 2 | + | - |
| 33 | 33DCIS | 61 | DCIS | Pure | Left | UOQ | N/A | 2 | + | + |
| 34 | 34DCIS | 45 | DCIS | Pure | Left | UOQ | N/A | 3 | + | - |
| 35 | 35DCIS | 44 | DCIS | Pure | Right | UOQ | N/A | 2 | + | - |
| 38 | 38DCIS | 50 | DCIS | Pure | Left | LOQ | N/A | 3 | + | - |
| 40 | 40DCIS | 49 | DCIS | Pure | Left | LIQ | N/A | 2 | + | - |
IDC-NSTs were graded according to the Nottingham grading system (44) and nuclear grading of DCIS was conducted as per the recommendations of the College of American Pathologists (45).
DCIS, ductal carcinoma in situ; IDC-NST, invasive ductal carcinoma of no special type; LIQ, lower inner quadrant; LOQ, lower outer quadrant; N/A, not applicable; UIQ, upper inner quadrant; UOQ, upper outer quadrant; WES, whole-exome sequencing.
Whole-exome and targeted sequencing analysis
WES and MSK-IMPACT targeted sequencing analyses were performed as described in Weigelt et al. (21) and Pareja et al. (22) (Supplementary Methods).
Clonal frequencies
To estimate the clonal architecture and composition of the lesions from each patient, mutant allelic fractions from all somatic mutations were adjusted for tumor cell content, ploidy, local copy number and sequencing errors using PyClone (23), as previously described (19,24) (Supplementary Methods).
Measures of diversity
To quantitate the intra-lesion genetic heterogeneity of each sample analyzed, we used the Shannon (25) and Gini-Simpson (26) diversity indices, as previously described (19) (Supplementary Methods).
Comparisons with invasive breast cancers from The Cancer Genome Atlas (TCGA)
The number of non-synonymous mutations, mutational frequencies and CNAs of DCIS were compared to those of IDC-NSTs from TCGA matched by age (20-year intervals), menopausal status and ER and HER2 status, at a 1:3 ratio (Supplementary Methods).
Mutational signatures
Mutational signatures were inferred from non-synonymous and synonymous mutations in samples with at least 40 SNVs using deconstructSigs (27) based on the set of mutational signatures “signature.cosmic” (28), as previously described (24).
Statistical analysis
Statistical analyses were performed using R v3.1.2. For comparisons between categorical variables, Fisher’s exact test was used, whereas for continuous variables, the Mann-Whitney U test was employed. For comparisons of mutation frequencies, p-values were corrected for multiple testing using the Benjamini-Hochberg false discovery rate. All tests were two-sided and P-values<0.05 were considered statistically significant.
RESULTS
Clinicopathologic characteristics of DCIS and IDC-NSTs
Synchronously diagnosed DCIS (n=27) and IDC-NSTs (n=26) from 25 patients and pure DCIS (n=7) from 7 patients (Table 1) were included in this study and subjected to WES or targeted MSK-IMPACT sequencing (Supplementary Methods, Supplementary Figure S1). The median sequencing depth of tumor and normal samples subjected to WES was 186x (range, 130x-321x) and 126x (range, 103x-239x), respectively, and of tumor and normal samples subjected to MSK-IMPACT was 596x (range, 525x-720x) and 549x (range, 402x-697x), respectively (Supplementary Table S1). Median age at diagnosis was 50 years (range, 26–76 years) and the median tumor size of the IDC-NSTs was 1.5 cm (range, 0.9–3.1 cm). Forty-one % (14/34) of DCIS were of intermediate nuclear grade, and 59% (20/34) of high nuclear grade, whereas 46% (12/26) and 54% (14/26) of IDC-NSTs were of histologic grades 2 and 3, respectively (Table 1). Fifteen of 27 synchronous DCIS (56%) and 14/26 (54%) IDC-NSTs were ER-positive/HER2-negative, 6/27 synchronous DCIS (22%) and 6/26 (23%) IDC-NSTs were ER-negative/HER2-negative, and 6/27 synchronous DCIS (22%) and 6/26 (23%) IDC-NSTs were HER2-positive (Table 1). Notably, all but two DCIS (25/27) displayed a receptor status concordant to that of their synchronous IDC-NST. In contrast, 17DCIS was ER-positive/HER2-positive whilst the matched 17IDC was ER-positive/HER2-negative, and 24DCIS was ER-positive/HER2-negative and the matched 24IDC was ER-positive/HER2-positive (Table 1). Two multifocal/ multicentric DCIS were included in this study (Table 1); in multifocal DCIS Case 2 the two DCIS foci (2DCISA and 2DCISB) and the two IDC-NSTs (2IDCA and 2IDCB) mapped to the same breast quadrant, whereas in multicentric DCIS Case 5, one DCIS (5DCISB) was located in a breast quadrant distinct from that of the IDC-NST (5IDC) and the remaining DCIS (5DCISA; Table 1). The DCIS (24DCIS) and IDC-NST (24IDC) of Case 24 were located in different breast quadrants, and the synchronous DCIS and IDC-NSTs in all other cases were located in the same breast quadrant (Table 1).
DCIS display a repertoire of somatic genetic alterations similar to that of IDC-NSTs
WES analyses revealed a median of 37 (range, 16–308) non-synonymous somatic mutations per synchronous DCIS (n=25) and a median of 44 (range 13–250) non-synonymous somatic mutations per IDC-NSTs (n=24), respectively (Supplementary Figs. S2A and S2B, Supplementary Table S2). Notably, the repertoires of somatic mutations detected in synchronous DCIS and their respective IDC-NSTs were markedly concordant (Fig. 1A), and the most frequently mutated cancer genes in the IDC-NSTs (n=26) largely overlapped with those in synchronous DCIS (n=27), including TP53 (54% vs 52%; P>0.05), PIK3CA (42% vs 41%; P>0.05) and GATA3 (23% vs 26%: P>0.05; Fig. 1B). In fact, we did not observe statistically significant differences in the mutational frequency of cancer genes between synchronous DCIS (n=27) and IDC-NSTs (n=26) analyzed in this study (P>0.05, Fisher’s exact test; Fig. 1B). Of the 12 PIK3CA mutations identified in 12 synchronous DCIS and 12 IDC-NSTs, nine (9/12) affected hotspot residues including H1047R/L (DCIS, n=9; IDC-NST, n=8) and E545D (IDC-NST, n=1; Fig. 1A), and 11/12 in DCIS and 10/12 in IDC-NST were predicted to be clonal (Supplementary Table S2). Most GATA3 mutations in synchronous DCIS (6/7) and IDC-NSTs (6/6) were loss-of-function mutations, including frame-shift (DCIS, n=4; IDC-NST, n=5), truncating (DCIS, n=1) and splice-site mutations (DCIS and IDC-NST, n=1, each; Fig. 1A; Supplementary Table S2). The majority of TP53 mutations identified in synchronous DCIS (13/14) and IDC-NSTs (12/14) were inactivating and most of them (DCIS, 12/13; IDC-NST, 12/14) were associated with loss of heterozygosity (LOH) of the wild-type allele (Fig. 1A; Supplementary Table S2).
Figure 1. Repertoire of non-synonymous somatic mutations in ductal carcinoma in situ, synchronously diagnosed invasive ductal carcinomas of no special type and pure ductal carcinoma in situ, and comparison with invasive carcinomas from The Cancer Genome Atlas breast cancer study.
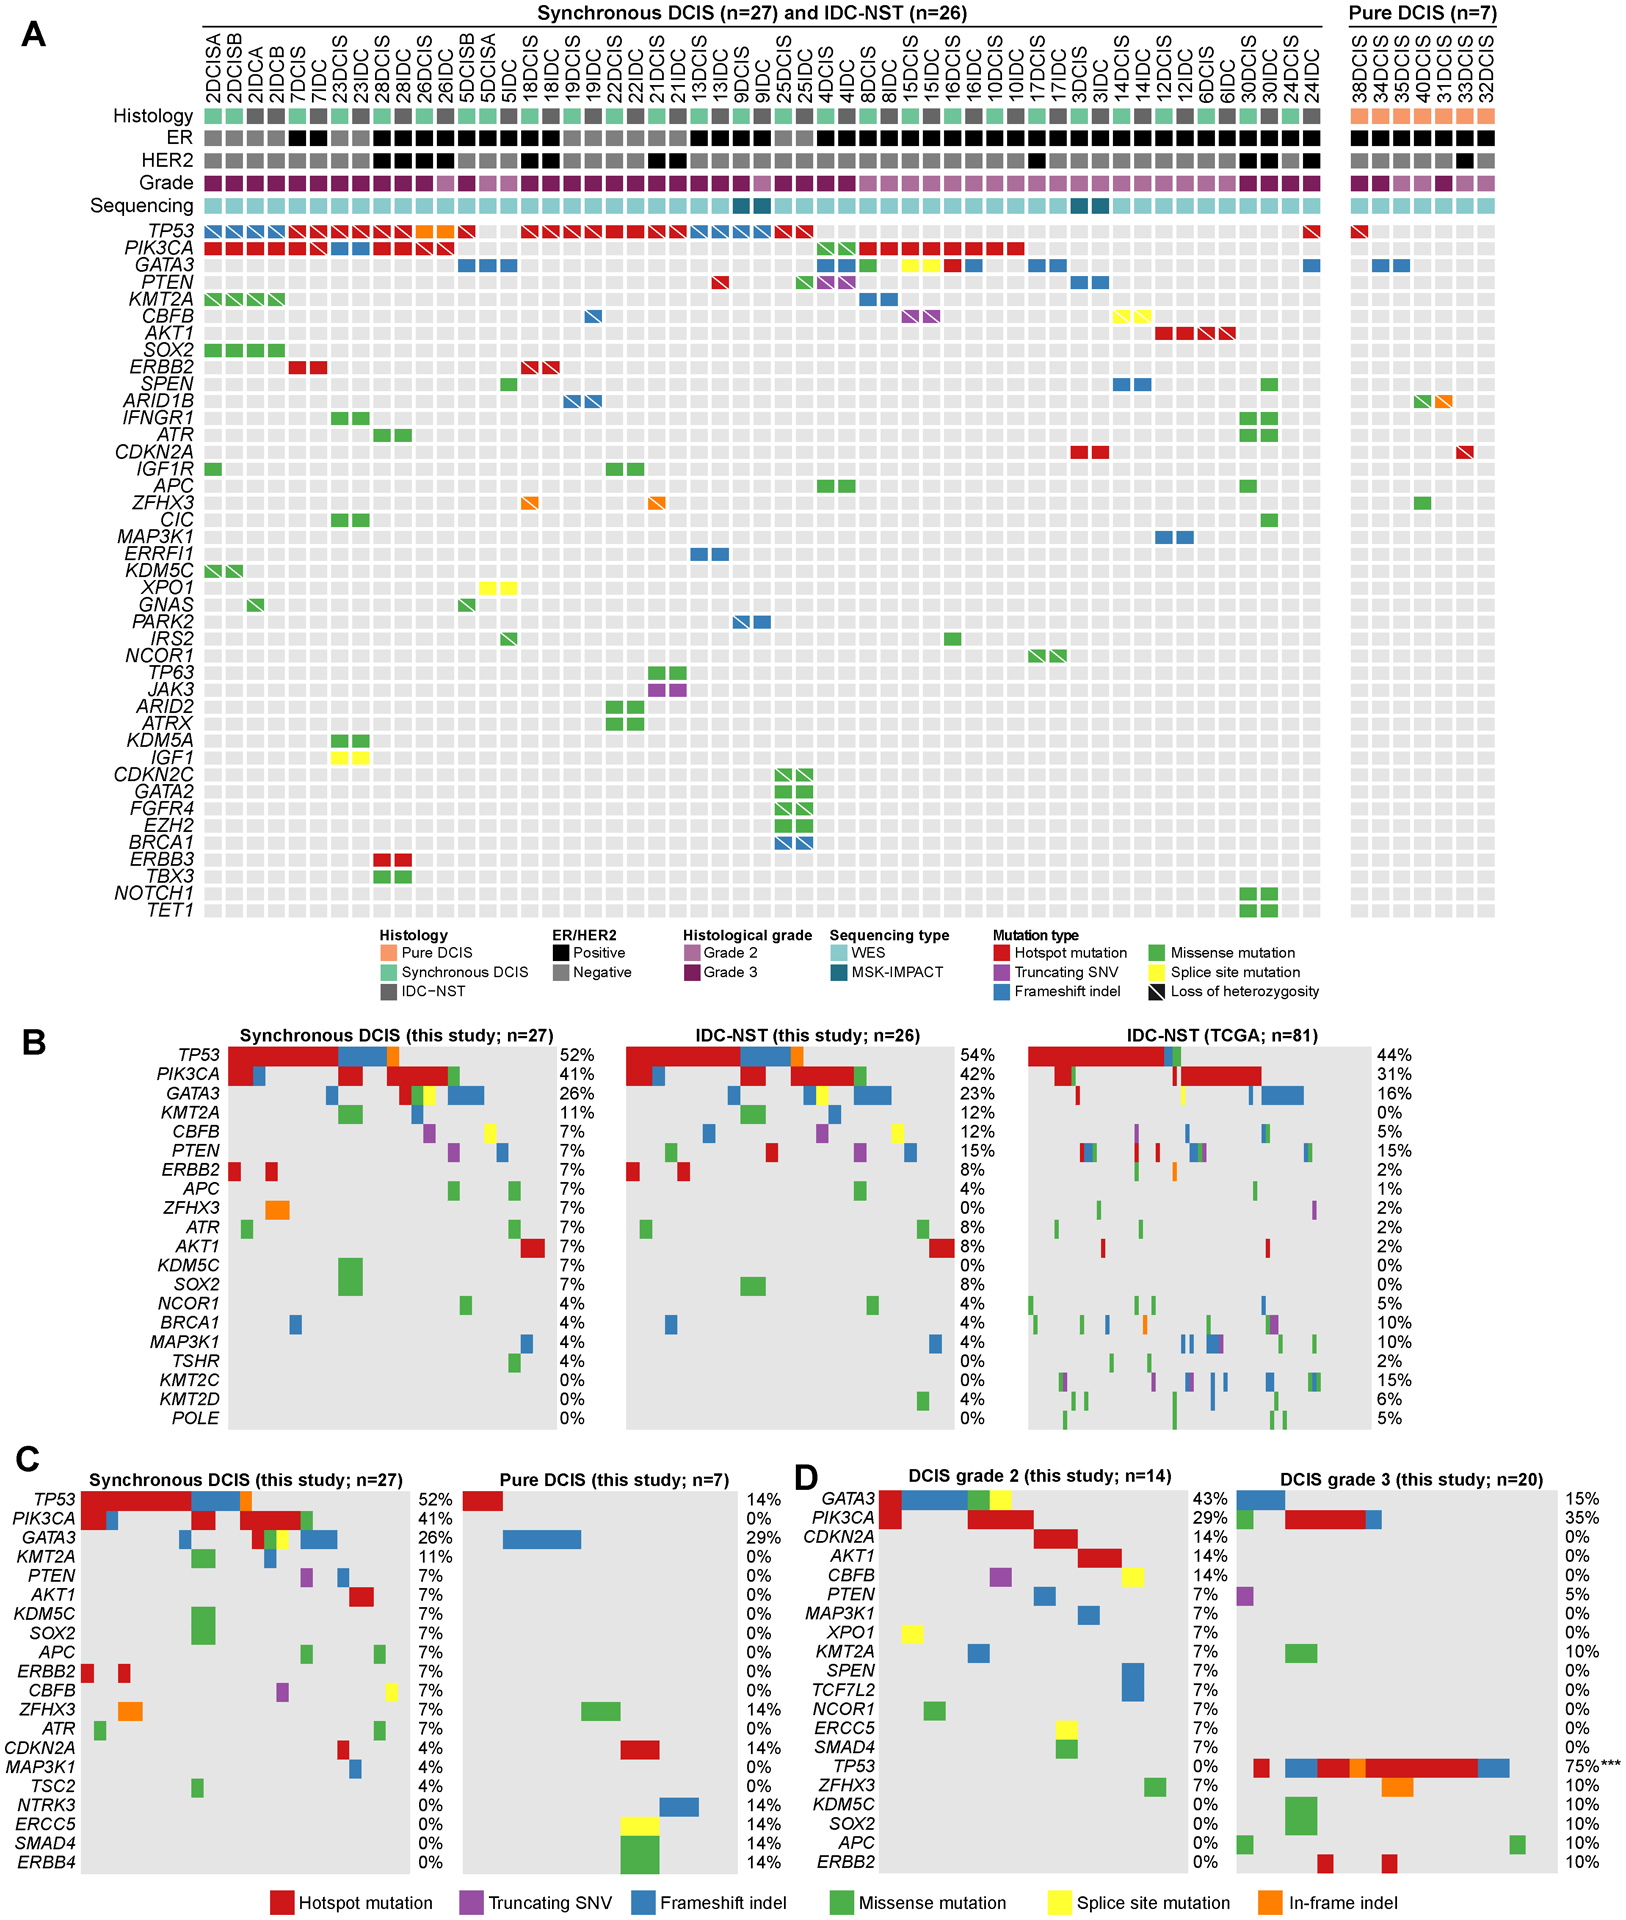
(A) Recurrent (n≥2) non-synonymous somatic mutations affecting cancer genes identified in synchronously diagnosed ductal carcinoma in situ (DCIS, n=27), their corresponding invasive ductal carcinomas of no special type (IDC-NST, n=26) and pure DCIS (n=7) by whole-exome sequencing or targeted capture massive parallel sequencing using MSK-IMPACT. Cases are shown in columns and genes in rows. Clinicopathologic characteristics are shown on the top. Mutations are color coded according to the legend. (B-D) Comparison of the most frequently mutated cancer genes identified in (B) DCIS synchronously diagnosed with invasive carcinoma (n=27), their corresponding IDC-NSTs (n=26) and non-related IDC-NSTs from The Cancer Genome Atlas (TCGA) matched according to age, menopausal status and ER/HER2 receptor status (n=81). (C) DCIS synchronously diagnosed with invasive carcinoma (n=27) and pure DCIS (n=7), (D) Grade 2 DCIS (n=14) and grade 3 DCIS (n=20). Two-sided Fisher’s exact test following multiple testing correction. ***, P<0.001. ER, estrogen receptor; DCIS, ductal carcinoma in situ; IDC-NST, invasive ductal carcinoma of no special type; indel, insertion and deletion; SNV, single nucleotide variant; WES, whole-exome sequencing.
The majority of synchronous DCIS (63%, 12/19) and IDC-NSTs (58%, 11/19) with sufficient number of mutations for accurate mutational signature inference displayed a dominant aging signature (signatures 1 or 5), 21% (4/19) of synchronous DCIS and 26% (5/19) of IDC-NSTs displayed a dominant homologous recombination deficiency (HRD)-related signature (signature 3) and 16% (3/19) of synchronous DCIS and of IDC-NSTs displayed a dominant APOBEC signature (signatures 2 or 13 Supplementary Figs. S2G–S2I). Of the cases with a dominant signature 3, Case 2 harbored a pathogenic BRCA1 E23Vfs*17 germline mutation associated with LOH of the wild-type allele in all DCIS (2DCISA and 2DCISB) and IDC-NST (2IDCA and 2IDCB) foci, Case 19 harbored a BRCA1 R496H germline mutation and LOH in the DCIS and IDC-NST, and both the DCIS and IDC-NST of Case 25 harbored a somatic BRCA1 L1154Mfs*4 mutation associated with LOH. Case 23 was heterogeneous and displayed a shift from a dominant aging signature 5 in the DCIS to a dominant HRD-related signature 3 in the matched IDC-NST. A genomic basis for HRD could not be identified in the IDC-NST, however (Supplementary Figs. S2G–S2I).
Copy number analysis demonstrated that synchronous DCIS (n=27) and IDC-NSTs (n=26) displayed largely comparable copy number profiles, including recurrent 1q and 16p gains, and losses of 5q, 6q, 8p, and chromosomes 13 and 22 (Supplementary Fig. S3A). Recurrent amplifications in the synchronous DCIS (n=27) affected 17q12 (ERBB2, CDK12, LASP1 and MLLT6), 17q22-q23.3 (HLF, MSI2, CLTC, PPM1D and DDX5), 19q12 (CCNE1), 7p11.2 (EGFR), 8q22.2-q24.2 (MYC, COX6C, UBR5, EXT1), 8p11.22-p11.21 (FGFR1, KAT6A, HOOK3 and TCEB1) and 8q21.13 (HEY1; Supplementary Fig. S3A). IDC-NSTs harbored recurrent amplifications of 17q12 (ERBB2, CDK12, LASP1 and MLLT6), 17q21.2 (RARA), 10q22.3 (NUTM2B), 19q12 (CCNE1), 7p11.2 (EGFR), 11q13.3–13.4 (CCND1; Supplementary Fig. S3A). No statistically significant differences in the frequency of CNAs were observed between the synchronous DCIS (n=27) and IDC-NSTs (n=26) from this study (Supplementary Figs. S3B–S3I).
To determine whether the genomic landscape of DCIS differs from that of unrelated IDC-NSTs, we compared the synchronous DCIS from this study with IDC-NSTs from TCGA. The number of non-synonymous somatic mutations of the synchronous DCIS subjected to WES (n=25) was comparable to that of IDC-NSTs from TCGA matched for age, menopausal status and receptor status (1:3 ratio, n=75; P>0.05, Mann Whitney U-test; Supplementary Fig. S2B). Similarly, synchronous DCIS from this study (n=27) harbored a comparable frequency of mutations affecting cancer genes included in MSK-IMPACT than IDC-NSTs from TCGA matched by age, menopausal status and receptor status (1:3 ratio, n=81; Fig. 1B). Comparative analysis of the CNAs in synchronous DCIS from this study (n=27) and IDC-NSTs from TCGA matched by age, menopausal status and receptor status (1:3 ratio; n=81) revealed no statistically significant differences (Supplementary Figs. S3B–S3I). To account for potential differences in histologic grade, given that the DCIS of our cohort were of intermediate or high-grade, we compared synchronous ER-positive DCIS from our study (n=20) to ER-positive luminal B IDC-NSTs from TCGA (n=60) matched at a 1:3 ratio by age, menopausal status and HER2 status and observed no statistically significant differences in terms of mutational frequencies or frequency of CNAs (Supplementary Figs. S3B–S3J). The ER-positive synchronous DCIS from our cohort subjected to WES (n=18), however, had a lower number of non-synonymous somatic mutations than the ER-positive luminal B IDC-NSTs from TCGA matched by clinicopathologic characteristics (n=54; Supplementary Fig. S2C).
We then sought to determine whether the repertoire of genetic alterations in DCIS synchronously identified with invasive carcinoma would differ from that of pure DCIS that did not progress to invasion (median follow-up time of 72 months; range, 22–85 months). Our analyses revealed that despite harboring a comparable number of non-synonymous mutations (Supplementary Fig. S2D), pure DCIS (n=7) had a numerically lower frequency of TP53 mutations (14% vs 52%; P>0.05) and PIK3CA mutations (0% vs 41%; P>0.05) than synchronous DCIS (n=27; Fig. 1C). No differences in the frequency of CNAs were observed (Supplementary Figs. S3B–S3I). 5/6 (83%) pure DCIS with sufficient SNVs for accurate mutational signature inference had a dominant mutational signature 1 (aging), and 1/6 (40DCIS) had a dominant mutational signature 3 (HRD-related; Supplementary Fig. S2G–S2I). 40DCIS harbored a BRCA1 E908* germline mutation. No LOH or somatic mutations affecting the wild-type allele were identified. It is possible that the second hit affecting BRCA1 in this case was either affected a non-coding region of BRCA1 or was of epigenetic nature.
We then sought to determine whether the repertoire of genetic alterations in DCIS (synchronous or pure) varies according to grade. We observed that grade 3 DCIS (n=19) subjected to WES had a higher number of non-synonymous somatic mutations than grade 2 DCIS (n=13; P<0.01; Supplementary Fig. S2E). Grade 3 DCIS (n=20) had a statistically significantly higher frequency of TP53 mutations than grade 2 DCIS (n=14; 75% vs 0%; P<0.001; Fig. 1D). No differences in frequency of CNAs were observed in DCIS according to grade (Supplementary Fig. S3B–S3I).
Finally, we assessed the repertoire of genetic alterations in DCIS according to ER and HER2 status. We observed that ER-positive/HER2-negative DCIS (n=19) had a lower number of non-synonymous somatic mutations than ER-negative/HER2-negative DCIS (n=6; P<0.01) and HER2-positive DCIS (n=7; P<0.01) subjected to WES (Supplementary Fig. S2F). ER-positive/HER2-negative DCIS (n=21) harbored a numerically higher frequency of mutations in GATA3 (38%) than ER-negative/HER2-negative DCIS (n=6; 0%; P>0.05) and that HER2-positive DCIS (n=7; 14%; P>0.05). TP53 mutations were numerically more frequent in ER-negative/HER2-negative DCIS (100%) than in ER-positive/HER2-negative DCIS (24%; P>0.05) and HER2-positive DCIS (57%; P>0.05; Supplementary Fig. S3K). Besides a higher frequency in ERBB2 gene amplification in HER2-positive DCIS compared to ER-positive/HER2-negative DCIS (P<0.05), no differences in the frequency of gains/losses and amplifications/homozygous deletions in DCIS according to ER/HER2 status were detected (Supplementary Fig. S3B–S3I), likely due to the small sample sizes of each subgroup.
Taken together, our findings suggest that pure DCIS that did not progress to invasive carcinoma are less advanced at the genetic level than DCIS synchronously diagnosed with IDC-NSTs, as they lack mutations in key cancer genes recurrently altered in invasive carcinoma, including PIK3CA. In contrast, DCIS synchronously identified with IDC-NST are genetically advanced lesions and display a similar spectrum of somatic genetic alterations to that of their synchronous invasive carcinomas. Genes significantly mutated in IDC-NSTs, such as PIK3CA, TP53, AKT1 and PTEN (29), were also found to be frequently mutated in synchronous DCIS, indicating roles early in the evolution of breast cancers.
DCIS and synchronously identified IDC-NSTs are often clonally related
Given the similarities in the repertoire of somatic mutations of DCIS and synchronously diagnosed IDC-NSTs, we sought to determine whether synchronously identified DCIS and IDC-NSTs of a given patient were clonally related. We computed the clonality index (19), which, based on SNVs in WES data, which assesses the likelihood of two different lesions to share mutations not expected to have occurred by chance. Most synchronous DCIS subjected to WES (92%; 23/25) were found to be clonally related to their corresponding IDC-NSTs (Fig. 2A) and harbored remarkably similar mutational repertoires and copy number profiles (Fig. 1A, Supplementary Figs. S3B–S3I). The DCIS (24DCIS) and synchronous IDC-NST (24IDC) of Case 24 were located in different breast quadrants and were not clonally related (Fig. 2A). Our series included two cases of multifocal DCIS (Cases 2 and 5). In Case 2, we analyzed two anatomically distinct foci of DCIS (2DCISA and 2DCISB) and two synchronously identified foci of invasive carcinoma (2IDCA and 2IDCB) in the same breast quadrant, all of which were found to be clonally related (Fig. 2A). For multifocal DCIS Case 5, we profiled two foci of DCIS arising in different breast quadrants (5DCISA and 5DCISB) along with a focus of IDC-NST (5IDC) identified in the same quadrant as 5DCISA. As expected, our analyses revealed that the DCIS and IDC-NST foci arising in the same quadrant (5DCISA and 5IDC) were clonally related, whereas the DCIS present in a different breast quadrant (5DCISB) did not show any clonal relatedness to the other DCIS focus or to the invasive carcinoma (Fig. 2A). These findings support the notion that DCIS is a non-obligate precursor of IDC-NST, and demonstrate, that genetically unrelated DCIS and invasive carcinoma can co-occur in the same breast.
Figure 2: Clonal relatedness, clonal decomposition and phylogenetic analysis of synchronously diagnosed ductal carcinoma in situ and invasive breast cancers.
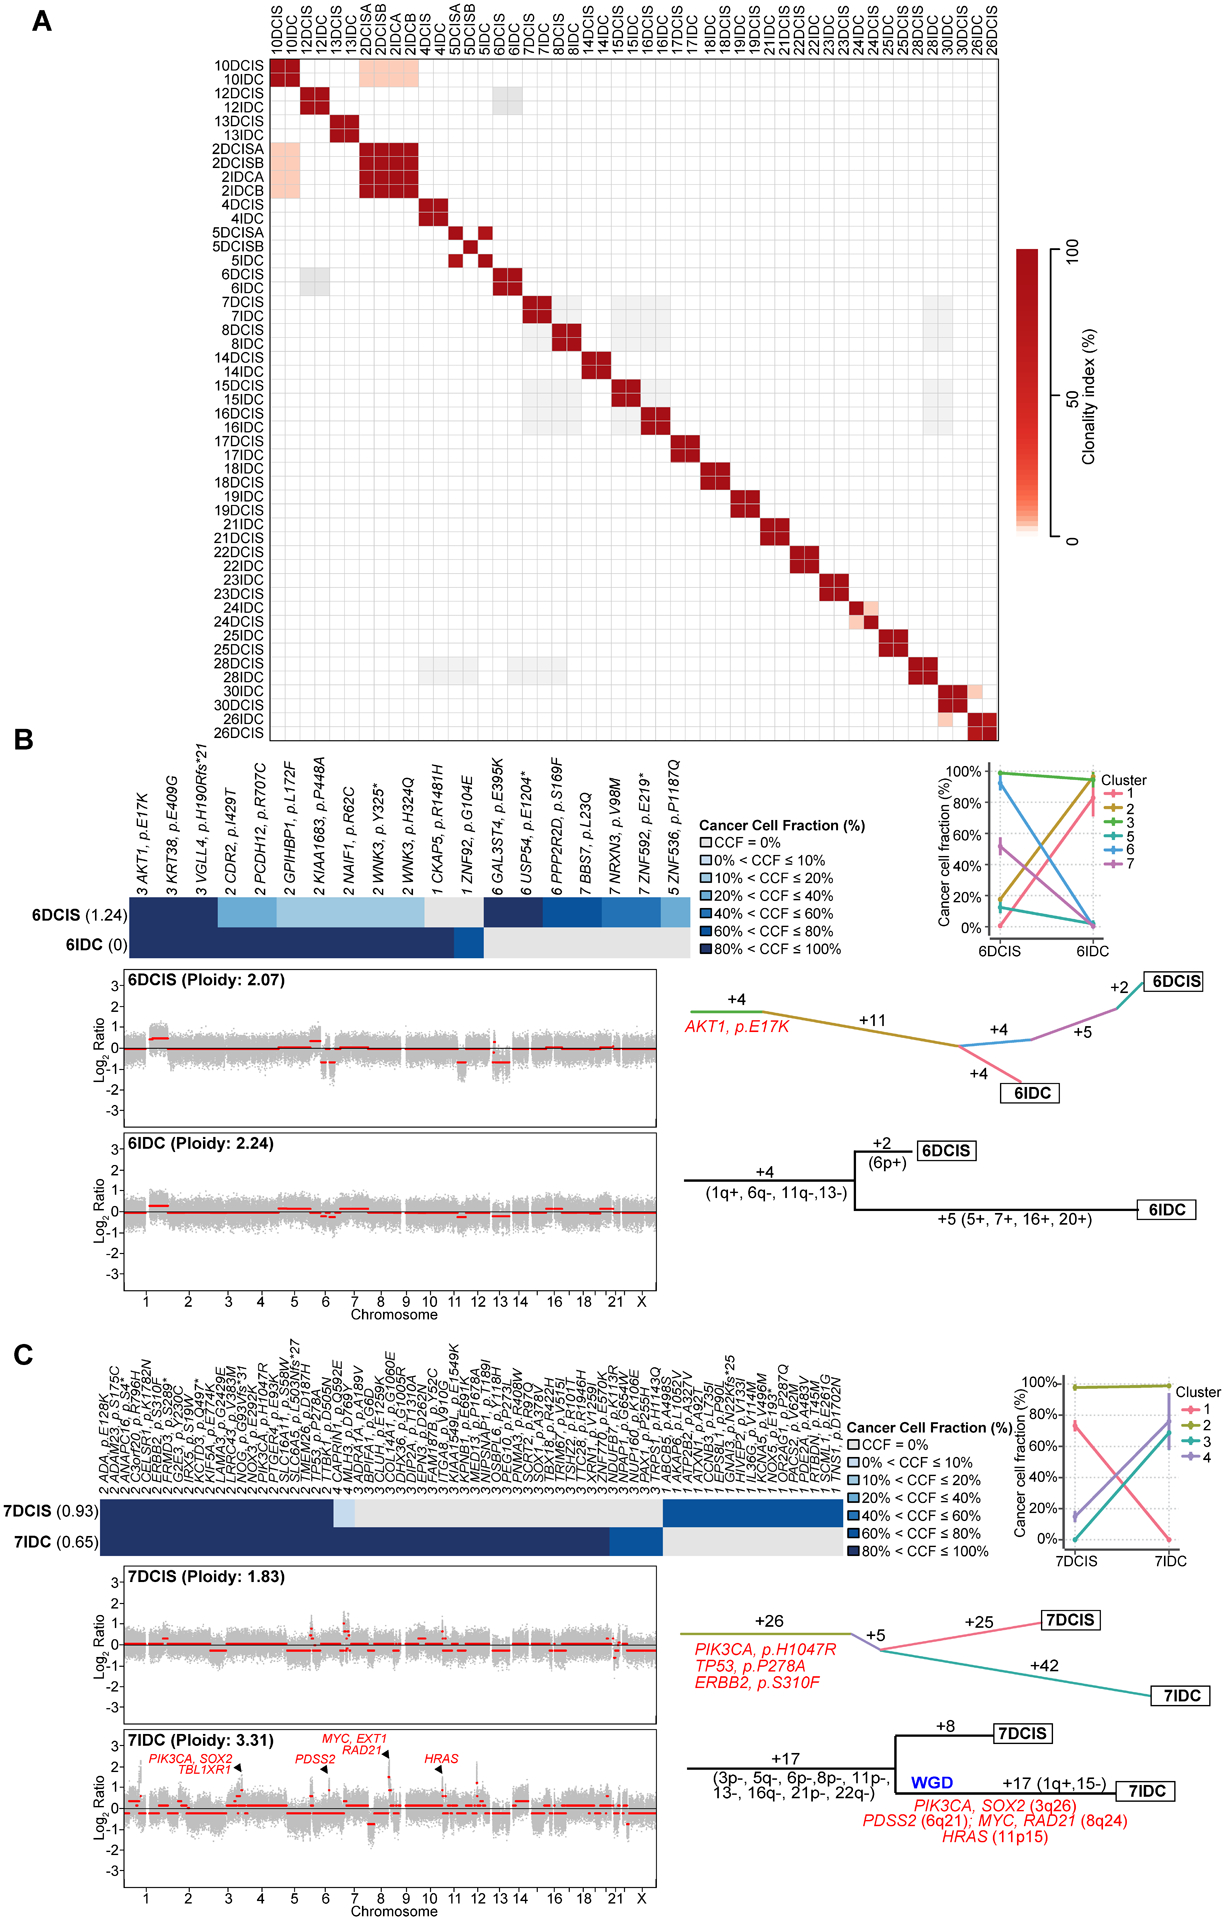
(A) Pairwise comparison of the clonality index (CI) based on somatic mutations identified in synchronous ductal carcinoma in situ (DCIS) and invasive ductal carcinoma of no special type (IDC-NST) by whole exome sequencing (WES). (B-C) Clonal decomposition and phylogenetic analysis of Case 6 (B) and Case 7 (C). Clonal frequency heatmaps of mutations in the DCIS and synchronous IDC-NST of a given case are shown (top), grouped by their clonal/subclonal structure (clusters) as inferred by PyClone. Cancer cell fractions are color-coded according to the legend. Shannon index of intratumor heterogeneity is shown in parentheses to the left. PyClone parallel coordinates plots (top right) are shown. Copy number plots depicting segmented Log2 ratios (y-axis) according to genomic position (x-axis) of DCIS and IDC-NSTs are depicted (bottom left). PyClone-derived phylogenetic trees of synchronous DCIS and IDC-NST are shown (middle right). Trunk and branches are colored according to clusters as per PyClone, and the number of somatic mutations that result in the divergence of a clone/subclone from its ancestor is shown. Hotspot mutations (orange) that define a given clone are depicted. Phylogenetic trees based on copy number alterations are shown (bottom right). The numbers alongside the branches represent the number of copy number alterations. Gains and losses are shown in parentheses and genes included in amplifications are shown in red. WGD, whole genome duplication.
Progression of DCIS to IDC-NSTs follows various evolutionary pathways
We and others have demonstrated that in situ carcinoma including DCIS and lobular carcinoma in situ (LCIS) (14,15,19) can display intra-tumor genetic heterogeneity. In such cases, virtually all tumor cells harbor founder genetic events (i.e. truncal mutations), whereas subclonal populations carry additional genetic alterations (i.e. branch mutations) (30). Moreover, we have previously observed that genetic mechanisms of progression from DCIS to invasive carcinoma appear to be diverse based on the pattern of CNAs detected in these lesions (15).
To define the changes in clonal architecture in the progression of DCIS to invasive carcinoma, we first jointly inferred the clonal composition of matched DCIS (n=25) and IDC-NST (n=24) samples subjected to WES by applying PyClone, a Bayesian clustering model (23) to mutant allele fractions, incorporating tumor cellularity, ploidy and local copy number obtained from ABSOLUTE (31) and FACETS (32). In addition, we have also performed an independent phylogenetic reconstruction based on CNAs employing MEDICC (33).
Our analyses revealed that synchronous DCIS and IDC-NSTs are genetically heterogeneous, and that the mechanisms of progression to invasive carcinoma are diverse. This analysis further confirmed that all but two (92%, 23/25) DCIS synchronously diagnosed with IDC-NST subjected to WES were clonally related to their corresponding invasive carcinoma (Figs. 2A–2C, 3, 4, Supplementary Figs. S4A–S4T), corroborating our clonality index findings (Fig. 2A). Clonal decomposition analysis based on PyClone revealed that 7/25 (28%) of DCIS (6DCIS, 7DCIS, 14DCIS, 16DCIS, 18DCIS, 22DCIS and 28DCIS) had minor subclones harboring mutations that became dominant in their corresponding IDC-NST (Figs. 2B–2C, Supplementary Figs. S4A–S4E). These clonal shifts might be consistent with a model where progression to invasive disease followed a clonal selection evolutionary pattern. In multifocal DCIS Case 2, a subclone of 2DCISA, harboring a KDM5C E185Q mutation, became dominant in a separate DCIS focus (2DCISB), suggesting that 2DCISB stemmed from 2DCISA (Fig. 3). Although the two DCIS and two IDC-NSTs from this patient were clonally related, it was not possible to determine whether the IDC-NSTs stemmed from 2DCISA or 2DCISB. In the remaining nine cases, synchronously identified DCIS and IDC-NST did not display clonal selection (Fig 4, Supplementary Figs. S4F–S4T). Cancer genes affected by somatic mutations found to be restricted to the IDC-NST of a given case included GATA3, CHD4, PTEN, RAD51B, SOX2, SPEN, SMO, RB1, CFBF, NCOA1, TP53, NBN, GNAQ, KMT2D and TET2, amongst others (Figs. 3 and 4, Supplementary Figs. S4A–S4T)
Figure 3: Clonal decomposition and phylogenetic analysis of synchronously identified multifocal ductal carcinoma in situ and invasive ductal carcinoma of no special type of Case 2.
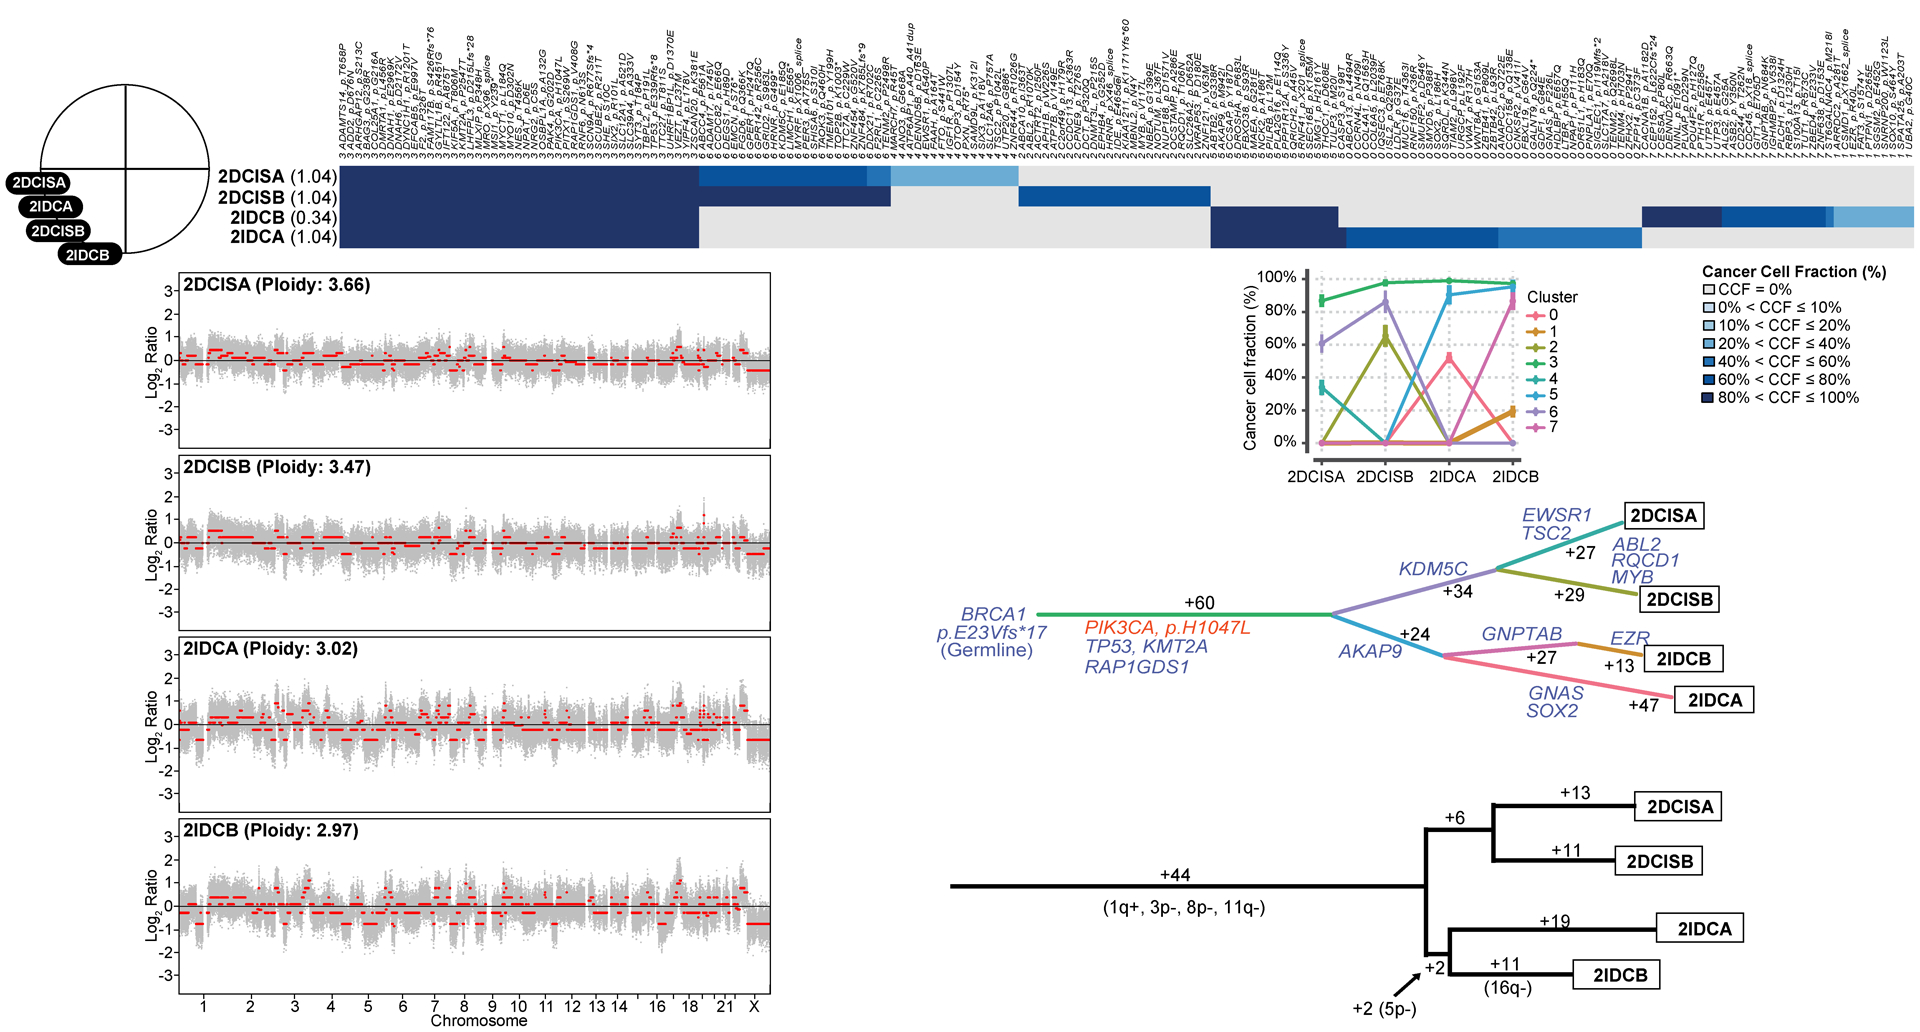
Schematic representation of the anatomic location (breast quadrants) of the different samples analyzed (top left). Clonal frequency heatmap of mutations in the two foci of ductal carcinoma in situ (DCIS), 2DCISA and 2DCISB, and the two synchronously diagnosed foci of invasive ductal carcinoma of no special type (IDC-NST), 2IDCA and 2IDCB (top), grouped according to their clonal/subclonal structure (clusters) as inferred by PyClone. Cancer cell fractions are color-coded according to the legend. Shannon index of intratumor heterogeneity is shown in parentheses to the left. Parallel coordinates plots generated by PyClone are shown (top center). Copy number plots depicting segmented Log2 ratios (y-axis) plotted according to genomic position (x-axis) of DCIS and IDC-NSTs are depicted (bottom left). PyClone-derived phylogenetic trees of synchronous DCIS and IDC-NST are shown (middle center). Trunk and branches are colored according to clusters as per PyClone, and the number of somatic mutations that result in the divergence of a clone/subclone from its ancestor is shown. Cancer genes (blue) and hotspot mutations (orange) that define a given clone are depicted. A phylogenetic tree based on copy number alterations is shown (bottom right). The numbers alongside the branches represent the total number of copy number alterations. Gains and losses are shown in parentheses.
Figure 4: Clonal decomposition and phylogenetic analysis of synchronously identified multifocal ductal carcinoma in situ and invasive ductal carcinoma of no special type of Case 5.
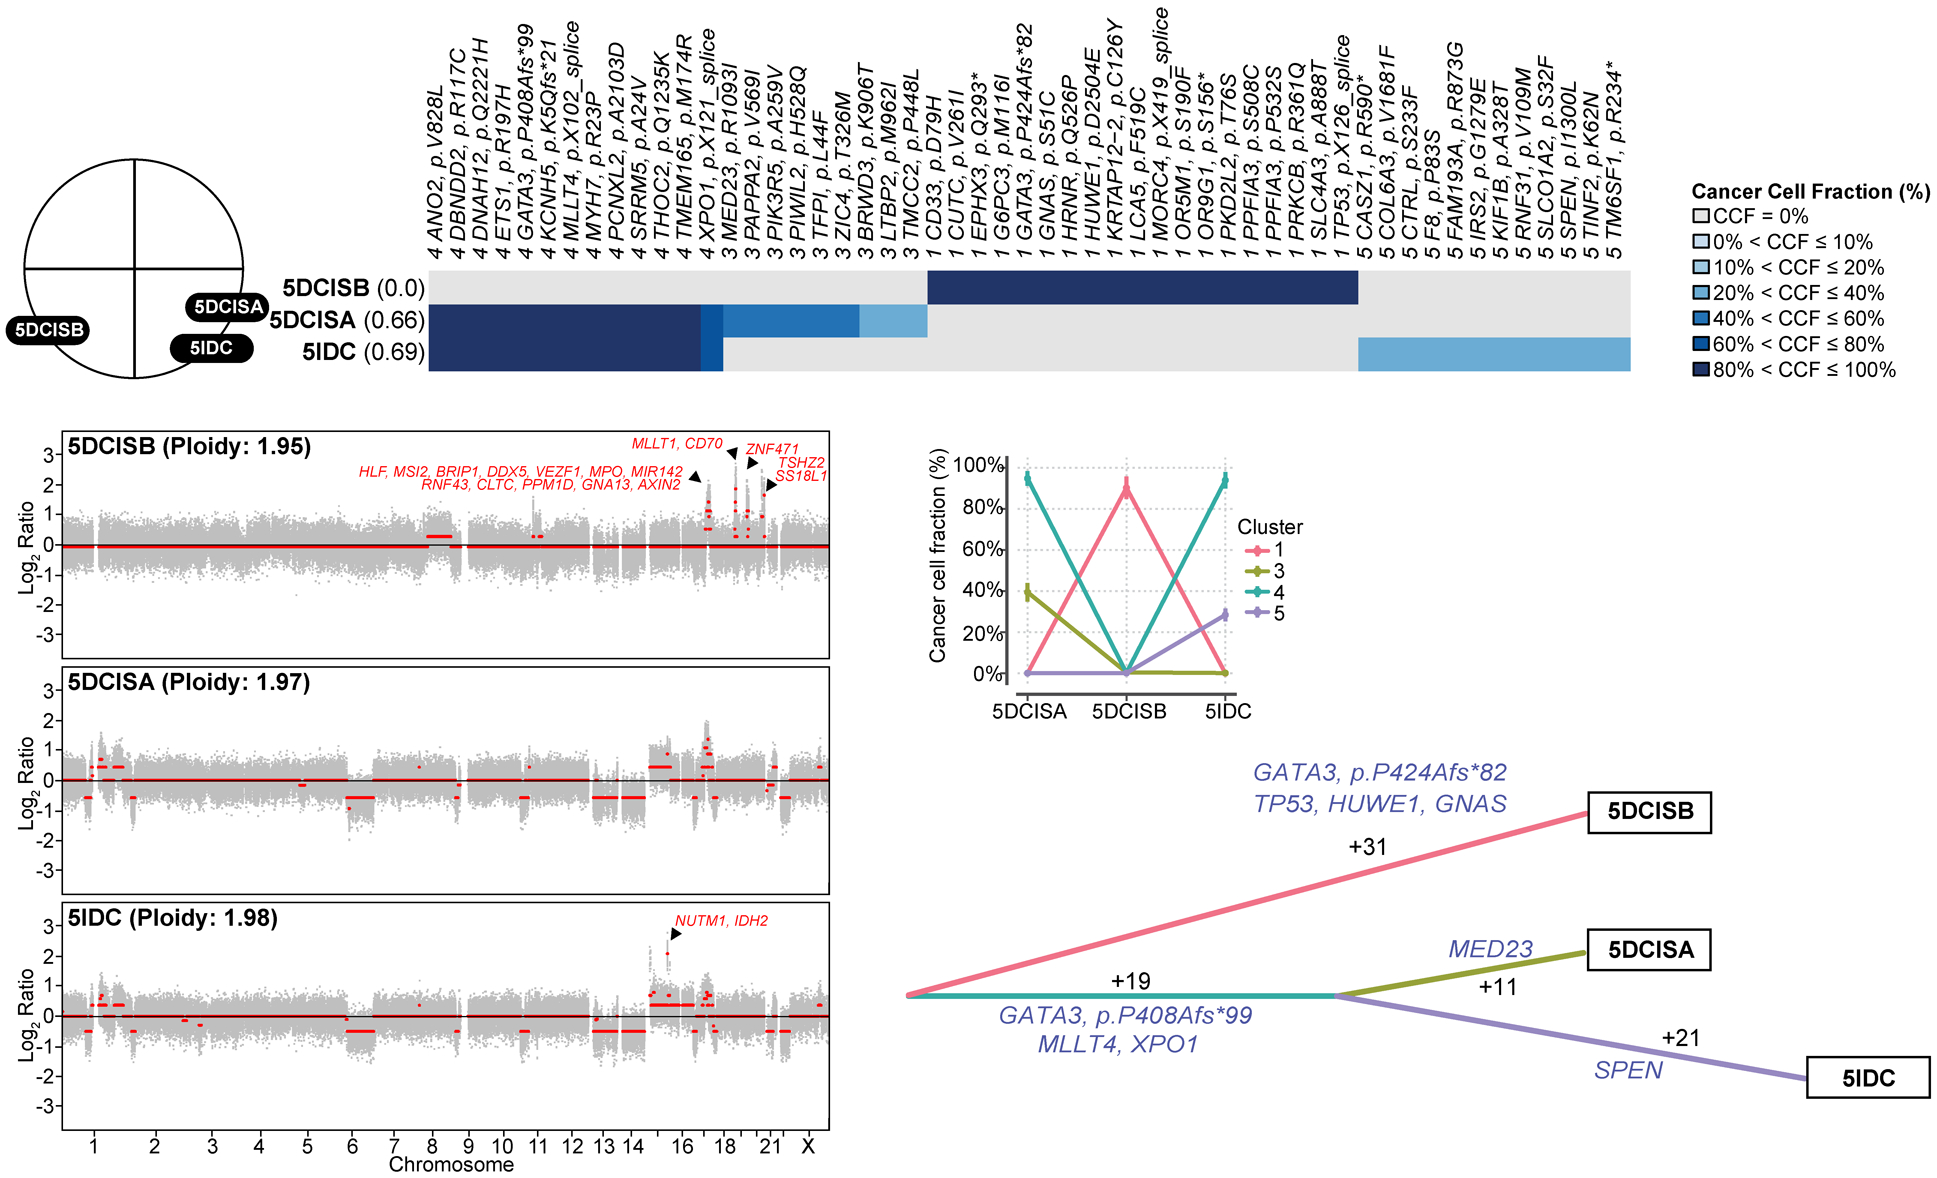
Schematic representation of the anatomic location (breast quadrants) of the different samples analyzed (top left). Clonal frequency heatmap of mutations in the two foci of ductal carcinoma in situ (DCIS), 5DCISA and 5DCISB, and a synchronously diagnosed focus of invasive ductal carcinoma of no special type (IDC-NST), 5IDC, grouped by their clonal/subclonal structure (clusters) as inferred by PyClone (top). Cancer cell fractions are color-coded according to the legend. Shannon index of intratumor heterogeneity is shown in parentheses to the left. Parallel coordinates plots generated by PyClone are shown (middle center). Copy number plots depicting segmented Log2 ratios (y-axis) plotted according to their genomic positions (x-axis) of the DCIS and IDC-NSTs are depicted (bottom left). Genes included in amplifications are shown in red. PyClone-derived phylogenetic tree of synchronous DCIS and IDC-NST is shown (bottom right). Trunk and branches are colored according to clusters as per PyClone results, and the number of somatic mutations that result in the divergence of a clone/subclone from its ancestor are shown. Cancer genes (blue) that define a given clone are illustrated alongside the branches.
Phylogenetic analyses based on copy number profiles revealed gains of 1q and 16p, and losses of 11q, 16q, 6q, 8p, 13 and 22 among truncal CNAs of a given case. Private events restricted to the IDC-NST of a given case included gains of 1q and 16p, and 16q and 18q losses, and amplification of 11q13.3–11q13.4 (CCND1), 18q21.33-q22.1 (BCL2), 19p13.11 (JAK), 3q26.32-q26.33 (PIK3CA), 8q23.3-q24.21 (MYC, RAD21), 15q11.1-q26.1 (IDH2, NUTM1), 11p15.5 (HRAS), 1p34.2 (MYCL1), 10q22.3 (NUTM2B), 17q12 (ERBB2, CDK12), and 21q22.2 (ERG) amongst others; Figs. 2C and 4, Supplementary Figs. S4A–S4T). This analysis also confirmed the observation that 5DCISB and 24DCIS lacked CNAs in common with 5DCISA and 5IDC, and with 24IDC, respectively (Fig. 4 and Supplementary Fig. S4Q) providing additional evidence to demonstrate that this DCIS developed independently from their corresponding IDC-NSTs in these patients.
Case 7 (Fig. 2C) harbored truncal PIK3CA (H1047R), TP53 (P278A) and ERBB2 (S310F) hotspot mutations and displayed clonal shifts, consistent with clonal selection in the progression to IDC-NST. In this case, the DCIS component (7DCIS; Fig. 2C) had a hypodiploid genome, with a genomic mass of 1.8 as inferred by FACETS, whereas its synchronous IDC-NST (7IDC) was predicted to have undergone whole genome duplication (WGD) and had a genomic mass of 3.3. In addition, 7IDC harbored amplification of 3q26.32-q26.33 that includes PIK3CA, of 8q23.3-q24.21 that encompasses MYC and of 11p15.5 that includes HRAS (Fig. 2C). WGD was also detected in cases 13, 17, 18, 22, 25 and 26 (Supplementary Figs. S4A–S4T). In 3/7 (43%) cases with WGD, both the DCIS and the IDC components were found to harbor the WGD event, whilst in 4/7 (57%) cases, the WGD was restricted to the IDC-NST component. These findings support the notion that WGD may occur, not only in the advanced setting, but also early in the evolution of a breast cancer.
In multifocal DCIS Case 2 arising in a BRCA1 germline carrier (BRCA1 E23Vfs*17), despite different absolute number of copies, two foci of ER-negative/HER2-negative DCIS (2DCISA and 2DCISB) and of IDC-NST (2IDCA and 2IDCB) in the same breast quadrant harbored LOH of the wild-type allele of BRCA1 (Fig. 3 and Supplementary Fig. 5). Interestingly, a minor subclone of 2DCISA became dominant in 2DCISB, suggesting that DCIS can give rise to a separate DCIS lesion via clonal selection. Nonetheless, 2IDCA and 2IDCB appear to have undergone subsequent progression with the emergence of subclones restricted to each of the DCIS foci (Fig. 3). 16q loss and GNTAB and EZR mutations were private to 2IDCB, whereas mutations affecting GNAS and SOX2 mutations were private to 2IDCA (Fig. 3). In the multifocal DCIS Case 5 (Fig. 4), both our analyses based on somatic mutations and on CNAs revealed that one DCIS (5DCISA) was clonally related to the IDC-NST located in the same quadrant (5IDC), whereas a second focus of DCIS (5DCISB), present in a different quadrant, was not clonally related to either 5DCISA or 5IDC (Figs. 2A and 4). The non-related 5DCISB harbored focal amplification of 17q22–23.2 including PPM1D, 19p.13.3-q13.41 (MLLT1, CD70) and 20q13.2-q13.33 (TSHZ2, SS18L1), 19q13.43 (ZNF471), whereas the IDC-NST (5IDC) harbored a private 15q11.1-q26.1 amplification (NUTM1, IDH2; Fig. 4).
We next sought to compare the intratumor genetic heterogeneity in DCIS that evolved to invasive carcinoma via clonal selection (n=7) versus that of DCIS where clonal selection could not be defined based on WES (n=18) by computing the Shannon and Gini-Simpson diversity indices (19,25,26). Our analyses demonstrated that synchronous DCIS that evolved to IDC-NST following a clonal selection pattern (n=7) harbored significantly higher intra-lesion genetic heterogeneity than synchronous DCIS that evolved to IDC-NSTs without evidence of clonal selection (n=18; Shannon index, P<0.05; Simpson index, P<0.05; Mann-Whitney U test) and than pure DCIS (n=7; Shannon index, P<0.05; Simpson index, P<0.05; Mann-Whitney U test) (Fig. 5A). No differences in the intra-lesion genetic heterogeneity indices of DCIS according to histologic grade or compared to IDC-NST of the same histologic grade, or according to ER/HER2 status were observed (P>0.05; Mann Whitney U-test; Fig 5B–5C).
Figure 5: Intratumor genetic heterogeneity of ductal carcinoma in situ.
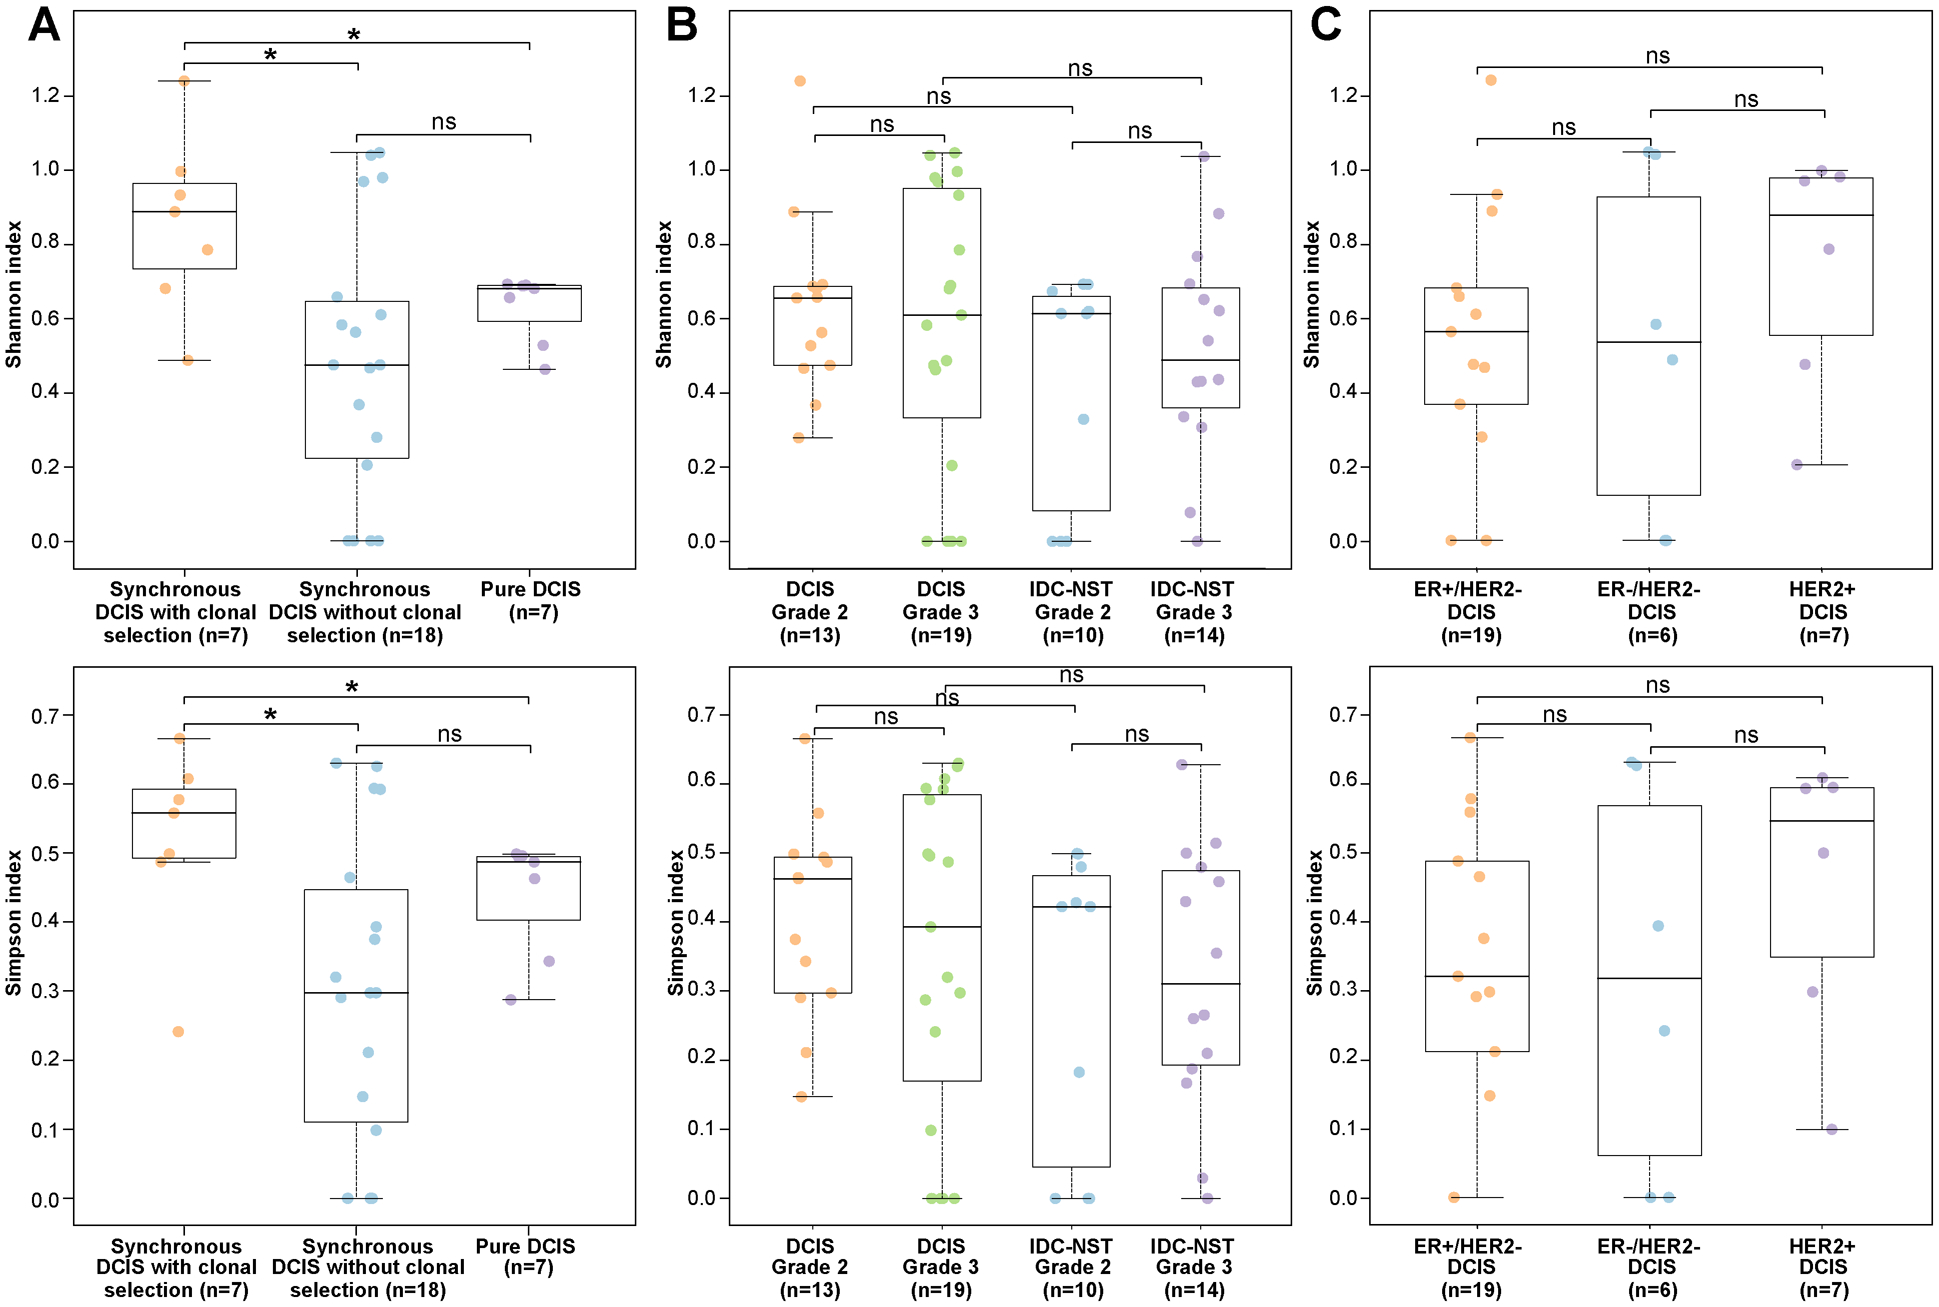
Boxplots depicting the Shannon diversity index (top) and the Gini-Simpson diversity index (bottom) (A) in ductal carcinoma in situ (DCIS) synchronously diagnosed with invasive carcinoma displaying a clonal selection evolutionary pattern (n=7), synchronous DCIS lacking evidence of clonal selection (n=18), and in pure DCIS (n=7), (B) in grade 2 (n=13) and grade 3 (n=19) DCIS, and grade 2 (n=10) and grade 3 (n=14) IDC-NST, (C) in ER-positive/HER2-negative DCIS (n=19), ER-negative/HER2-negative DCIS (n=6) and HER2-positive DCIS (n=7) subjected to whole-exome sequencing (WES). The median value of the Shannon diversity index and the Gini-Simpson diversity index, and the 75th and 25th percentiles are displayed at the top and bottom of the boxes, respectively. Each dot corresponds to the Shannon or Gini-Simpson diversity index of one case. Mann-Whitney U test two-sided P values. *, P<0.05
Taken together, our findings support the notion that DCIS is a genetically advanced lesion with marked intratumoral heterogeneity and that progression of DCIS to invasive carcinoma varies from case to case, with a minority of samples displaying features consistent with the dominant clone of the IDC-NST constituting a minor subclone in the respective DCIS. Our findings also indicate that WGD may occur in the early stages of breast cancer, both at the DCIS stage or in the progression from DCIS to invasive carcinoma.
DISCUSSION
Here we provide further evidence in support of the notion that DCIS is a non-obligate precursor of invasive carcinoma. We observed that synchronously diagnosed DCIS and IDC-NSTs were often clonally related. Interestingly, two DCIS analyzed here were found to be genetically independent from IDC-NST diagnosed in a distinct breast quadrant. Although, we interrogated only two cases with synchronous lesions located in different breast quadrants, these results might suggest that the geographic relationship between DCIS and IDC-NST may be linked to their clonal relatedness, in contrast to our findings in LCIS, as LCIS and invasive lobular carcinoma were found to be clonally related regardless of their anatomic location (19).
Our findings indicate that DCIS synchronously identified with invasive carcinoma are genetically advanced. Notably, methylation profiling of DCIS and adjacent invasive carcinoma support the notion that, also epigenetically, DCIS is an advanced lesion (34,35). It is possible that high-grade DCIS might arise de novo. Nonetheless, it has been recently shown that atypical ductal hyperplasia (ADH) is clonally related to synchronously identified high-grade DCIS and invasive carcinoma, suggesting the possibility that ADH might be a precursor lesion not only in the low-grade but also in the high-grade breast cancer evolutionary pathways (36).
Notably, in agreement with Moelans et al (37), we did not identify significant differences in the frequency of CNAs between synchronous DCIS compared to IDC-NST and to pure DCIS. Furthermore, amplification of CCND1 and MYC, found to display an increased amplitude in invasive carcinoma compared to DCIS (38), were restricted to the invasive component of a given case in our series. Previously reported higher frequencies of 5q31.1–5q35.3, 6q25.3–6q26 and 13q32.3–13q33.1 losses and 11p12 gains in DCIS compared to their synchronously identified invasive carcinoma (39), and a higher frequency of 1q, 8q and 11q gains in synchronous compared to pure DCIS (40,41) could not be confirmed in our study. Such discrepancies might stem from the small sample size of DCIS in our cohort and the fact that low-grade DCIS samples were not included in our study. Consistent with Sakr et al (42), all pure DCIS in our study lacked PIK3CA mutations. These findings contrast the observations by Lin et al (41), who reported an enrichment in PIK3CA kinase domain mutations in pure compared to synchronous DCIS. Larger studies of DCIS/ invasive carcinomas carefully stratified by grade and ER and HER2 status are warranted.
By performing clonal decomposition based on somatic mutations and a phylogenetic reconstruction based on copy number profiles of DCIS and synchronously diagnosed IDC-NSTs, we observed that both DCIS and IDC-NSTs are genetically heterogeneous and that progression to invasive carcinoma may follow different evolutionary pathways. In 7 of 25 cases (28%), the clonal decomposition and/or CNA analyses supported the hypothesis that the invasive carcinoma stemmed from a minor subclone of the synchronously diagnosed DCIS, following a clonal selection evolutionary pattern. PTEN and GATA3, TP53 and KMT2D were among the cancer genes affected by non-synonymous somatic mutations restricted to the invasive component of individual cases. In addition, we observed amplification of cancer genes restricted to the IDC-NST component of a given case, including CCND1, PIK3CA, IDH2, MYC, MYCL1, ERBB2 and HRAS, suggesting that these may play a role in the progression from DCIS to invasive carcinoma. In the majority of cases (72%), however, our analyses did not show any evidence of clonal selection during progression to invasive carcinoma. It is plausible that in these cases, genetic alterations conferring ability to invade were acquired early in their development, followed by the acquisition of intra-lesion genetic heterogeneity and multiclonal invasion. Alternatively, invasion in these cases might have been driven by changes in the microenvironment or merely constituted a passive phenomenon.
WGD or genome doubling has been reported in up to 30% of advanced cancers (43). Here, we demonstrate that this phenomenon may be present even at the DCIS stage. In three cases analyzed here, WGD was a truncal event, suggesting that it took place relatively early in tumor evolution, and in four cases, WGD was restricted to the IDC-NST, illustrating the profound differences that can be observed between the modal populations of cancer cells from a DCIS and its synchronously diagnosed IDC-NST. One could posit that WGD occurring early in tumor development could result in increased levels of genome instability and increased intra-tumor heterogeneity facilitating the accumulation of additional genetic alterations, whereas in other contexts, WGD may occur relatively late and was either present in a minor subclone of the DCIS that came to become the dominant clone of the IDC-NST or one of the potential mechanisms underpinning progression to invasive breast cancer.
Our study has important limitations. First, our study was restricted to intermediate and high-grade DCIS, and did not include low-grade DCIS. Second, we employed tumor bulk sequencing and state-of-the-art computational approaches to infer the clonal architecture of each sample/case and their phylogeny. Although these were bioinformatics inferences, they were consistent with the results of single cell sequencing studies carried out by our group (15) and others (14). Finally, we have focused on somatic genetic alterations affecting protein coding genes; further studies investigating potential mechanisms of progression from DCIS to invasive disease based on somatic genetic alterations affecting non-coding regions of the genome are warranted.
Despite these limitations, our findings corroborate the notion that DCIS is a neoplastic non-obligate precursor of invasive carcinoma, with a repertoire of somatic genetic alterations similar to that of IDC-NSTs. Most importantly, our results highlight the complexity of evolutionary patterns driving progression from DCIS to invasive carcinoma and suggests they may vary from case to case. In fact, in a minority of patients (7 of 25; 28%), evidence of clonal selection in the progression from DCIS to invasive disease was documented and in these cases, higher levels of intra-lesion genetic heterogeneity were observed. These observations support the contention that biomarkers to predict the progression from DCIS to invasive disease ought to consider the information provided by intra-lesion genetic heterogeneity and the potential mechanisms of disease progression.
Supplementary Material
TRANSLATIONAL RELEVANCE.
We analyzed the genomic landscape of synchronously diagnosed ductal carcinoma in situ (DCIS) and invasive ductal carcinomas of no special type (IDC-NST), and of pure DCIS. Our analyses revealed that DCIS are genetically advanced lesions with marked intratumor genetic heterogeneity and harbor genetic alterations similar to those present in synchronous IDC-NSTs. We have also observed that the molecular mechanisms underpinning progression to invasive carcinoma are diverse and vary from case to case, including clonal selection, which was detected in a minority of cases (28%). Our findings provide further support to the notion that DCIS is a non-obligate precursor of IDC-NST and suggest that progression to invasive disease is a multifaceted process. Hence, the development of molecular predictors of progression of DCIS to invasive carcinoma might require incorporating intra-lesion genetic heterogeneity and/or the individual mechanisms of progression.
ACKNOWLEDGMENTS
JSR-F, JBH and BW are supported in part by Breast Cancer Research Foundation grants, BW by a Cycle for survival grant, and FP by a National Institutes of Health/National Cancer Institute K12 CA184746 grant. Research reported in this paper was supported in part by a Cancer Center Support Grant of the National Institutes of Health/National Cancer Institute (grant No P30CA008748) and a Susan G Komen Investigator-Initiated Research Grant (IIR13265578).
Footnotes
CONFLICTS OF INTEREST
JSR-F reports personal/consultancy fees from VolitionRx, Page.AI, Goldman Sachs, Grail, REPARE Therapeutics, Ventana Medical Systems, InVicro, Roche Diagnostics and Genentech, outside the scope of the submitted work. All other authors declare no conflicts of interest.
DATA AVAILABILITY
The WES and targeted sequencing data that support the findings of this study will be available for visualization and download in cBioPortal for Cancer Genomics (http://www.cbioportal.org) upon publication of the manuscript.
REFERENCES
- 1.Allred DC. Ductal carcinoma in situ: terminology, classification, and natural history. J Natl Cancer Inst Monogr 2010;2010(41):134–8. [DOI] [PMC free article] [PubMed] [Google Scholar]
- 2.D’Orsi CJ. Imaging for the diagnosis and management of ductal carcinoma in situ. J Natl Cancer Inst Monogr 2010;2010(41):214–7. [DOI] [PMC free article] [PubMed] [Google Scholar]
- 3.Lopez-Garcia MA, Geyer FC, Lacroix-Triki M, Marchio C, Reis-Filho JS. Breast cancer precursors revisited: molecular features and progression pathways. Histopathology 2010;57(2):171–92. [DOI] [PubMed] [Google Scholar]
- 4.Hernandez L, Wilkerson PM, Lambros MB, Campion-Flora A, Rodrigues DN, Gauthier A, et al. Genomic and mutational profiling of ductal carcinomas in situ and matched adjacent invasive breast cancers reveals intra-tumour genetic heterogeneity and clonal selection. J Pathol 2012;227(1):42–52. [DOI] [PMC free article] [PubMed] [Google Scholar]
- 5.Vincent-Salomon A, Lucchesi C, Gruel N, Raynal V, Pierron G, Goudefroye R, et al. Integrated genomic and transcriptomic analysis of ductal carcinoma in situ of the breast. Clin Cancer Res 2008;14(7):1956–65. [DOI] [PubMed] [Google Scholar]
- 6.Heselmeyer-Haddad K, Berroa Garcia LY, Bradley A, Ortiz-Melendez C, Lee WJ, Christensen R, et al. Single-cell genetic analysis of ductal carcinoma in situ and invasive breast cancer reveals enormous tumor heterogeneity yet conserved genomic imbalances and gain of MYC during progression. Am J Pathol 2012;181(5):1807–22. [DOI] [PMC free article] [PubMed] [Google Scholar]
- 7.Sanders ME, Schuyler PA, Dupont WD, Page DL. The natural history of low-grade ductal carcinoma in situ of the breast in women treated by biopsy only revealed over 30 years of long-term follow-up. Cancer 2005;103(12):2481–4. [DOI] [PubMed] [Google Scholar]
- 8.Collins LC, Tamimi RM, Baer HJ, Connolly JL, Colditz GA, Schnitt SJ. Outcome of patients with ductal carcinoma in situ untreated after diagnostic biopsy: results from the Nurses’ Health Study. Cancer 2005;103(9):1778–84. [DOI] [PubMed] [Google Scholar]
- 9.Casasent AK, Edgerton M, Navin NE. Genome evolution in ductal carcinoma in situ: invasion of the clones. J Pathol 2017;241(2):208–18. [DOI] [PMC free article] [PubMed] [Google Scholar]
- 10.Polyak K, Hu M. Do myoepithelial cells hold the key for breast tumor progression? J Mammary Gland Biol Neoplasia 2005;10(3):231–47. [DOI] [PubMed] [Google Scholar]
- 11.Schnitt SJ. The transition from ductal carcinoma in situ to invasive breast cancer: the other side of the coin. Breast Cancer Res 2009;11(1):101. [DOI] [PMC free article] [PubMed] [Google Scholar]
- 12.Sontag L, Axelrod DE. Evaluation of pathways for progression of heterogeneous breast tumors. J Theor Biol 2005;232(2):179–89. [DOI] [PubMed] [Google Scholar]
- 13.Cowell CF, Weigelt B, Sakr RA, Ng CK, Hicks J, King TA, et al. Progression from ductal carcinoma in situ to invasive breast cancer: revisited. Mol Oncol 2013;7(5):859–69. [DOI] [PMC free article] [PubMed] [Google Scholar]
- 14.Casasent AK, Schalck A, Gao R, Sei E, Long A, Pangburn W, et al. Multiclonal Invasion in Breast Tumors Identified by Topographic Single Cell Sequencing. Cell 2018;172(1–2):205–17 e12. [DOI] [PMC free article] [PubMed] [Google Scholar]
- 15.Martelotto LG, Baslan T, Kendall J, Geyer FC, Burke KA, Spraggon L, et al. Whole-genome single-cell copy number profiling from formalin-fixed paraffin-embedded samples. Nat Med 2017;23(3):376–85. [DOI] [PMC free article] [PubMed] [Google Scholar]
- 16.WHO Classification of Tumors Editorial Board. Breast tumours. WHO Classification of Tumors. 5th Edition IARC: Lyon; 2019. [Google Scholar]
- 17.Martelotto LG, De Filippo MR, Ng CK, Natrajan R, Fuhrmann L, Cyrta J, et al. Genomic landscape of adenoid cystic carcinoma of the breast. J Pathol 2015;237(2):179–89. [DOI] [PMC free article] [PubMed] [Google Scholar]
- 18.Cheng DT, Mitchell TN, Zehir A, Shah RH, Benayed R, Syed A, et al. Memorial Sloan Kettering-Integrated Mutation Profiling of Actionable Cancer Targets (MSK-IMPACT): A Hybridization Capture-Based Next-Generation Sequencing Clinical Assay for Solid Tumor Molecular Oncology. J Mol Diagn 2015;17(3):251–64. [DOI] [PMC free article] [PubMed] [Google Scholar]
- 19.Lee JY, Schizas M, Geyer FC, Selenica P, Piscuoglio S, Sakr RA, et al. Lobular carcinomas in situ display intra-lesion genetic heterogeneity and clonal evolution in the progression to invasive lobular carcinoma. Clin Cancer Res 2018;25(2):674–86. [DOI] [PMC free article] [PubMed] [Google Scholar]
- 20.Begg CB, Ostrovnaya I, Geyer FC, Papanastasiou AD, Ng CKY, Sakr RA, et al. Contralateral breast cancers: Independent cancers or metastases? Int J Cancer 2018;142(2):347–56. [DOI] [PMC free article] [PubMed] [Google Scholar]
- 21.Weigelt B, Bi R, Kumar R, Blecua P, Mandelker DL, Geyer FC, et al. The Landscape of Somatic Genetic Alterations in Breast Cancers From ATM Germline Mutation Carriers. J Natl Cancer Inst 2018;110(9):1030–4. [DOI] [PMC free article] [PubMed] [Google Scholar]
- 22.Pareja F, Brandes AH, Basili T, Selenica P, Geyer FC, Fan D, et al. Loss-of-function mutations in ATP6AP1 and ATP6AP2 in granular cell tumors. Nat Commun 2018;9(1):3533. [DOI] [PMC free article] [PubMed] [Google Scholar]
- 23.Roth A, Khattra J, Yap D, Wan A, Laks E, Biele J, et al. PyClone: statistical inference of clonal population structure in cancer. Nature methods 2014;11(4):396–8. [DOI] [PMC free article] [PubMed] [Google Scholar]
- 24.Pareja F, Lee JY, Brown DN, Piscuoglio S, Gularte-Merida R, Selenica P, et al. The Genomic Landscape of Mucinous Breast Cancer. J Natl Cancer Inst 2019;111(7):737–41. [DOI] [PMC free article] [PubMed] [Google Scholar]
- 25.Shannon CE. The mathematical theory of communication. 1963. MD computing : computers in medical practice 1997;14(4):306–17. [PubMed] [Google Scholar]
- 26.Simpson EH. Measurement of diversity. Nature 1949;163(4148):688-. [Google Scholar]
- 27.Rosenthal R, McGranahan N, Herrero J, Taylor BS, Swanton C. DeconstructSigs: delineating mutational processes in single tumors distinguishes DNA repair deficiencies and patterns of carcinoma evolution. Genome Biol 2016;17:31. [DOI] [PMC free article] [PubMed] [Google Scholar]
- 28.Nik-Zainal S, Davies H, Staaf J, Ramakrishna M, Glodzik D, Zou X, et al. Landscape of somatic mutations in 560 breast cancer whole-genome sequences. Nature 2016;534(7605):47–54. [DOI] [PMC free article] [PubMed] [Google Scholar]
- 29.Ng CK, Schultheis AM, Bidard FC, Weigelt B, Reis-Filho JS. Breast cancer genomics from microarrays to massively parallel sequencing: paradigms and new insights. J Natl Cancer Inst 2015;107(5). [DOI] [PubMed] [Google Scholar]
- 30.McGranahan N, Swanton C. Biological and therapeutic impact of intratumor heterogeneity in cancer evolution. Cancer Cell 2015;27(1):15–26. [DOI] [PubMed] [Google Scholar]
- 31.Carter SL, Cibulskis K, Helman E, McKenna A, Shen H, Zack T, et al. Absolute quantification of somatic DNA alterations in human cancer. Nature biotechnology 2012;30(5):413–21. [DOI] [PMC free article] [PubMed] [Google Scholar]
- 32.Shen R, Seshan VE. FACETS: allele-specific copy number and clonal heterogeneity analysis tool for high-throughput DNA sequencing. Nucleic Acids Res 2016;44(16):e131. [DOI] [PMC free article] [PubMed] [Google Scholar]
- 33.Schwarz RF, Trinh A, Sipos B, Brenton JD, Goldman N, Markowetz F. Phylogenetic quantification of intra-tumour heterogeneity. PLoS Comput Biol 2014;10(4):e1003535. [DOI] [PMC free article] [PubMed] [Google Scholar]
- 34.Moelans CB, Verschuur-Maes AH, van Diest PJ. Frequent promoter hypermethylation of BRCA2, CDH13, MSH6, PAX5, PAX6 and WT1 in ductal carcinoma in situ and invasive breast cancer. J Pathol 2011;225(2):222–31. [DOI] [PubMed] [Google Scholar]
- 35.Muggerud AA, Ronneberg JA, Warnberg F, Botling J, Busato F, Jovanovic J, et al. Frequent aberrant DNA methylation of ABCB1, FOXC1, PPP2R2B and PTEN in ductal carcinoma in situ and early invasive breast cancer. Breast Cancer Res 2010;12(1):R3. [DOI] [PMC free article] [PubMed] [Google Scholar]
- 36.Kader T, Hill P, Zethoven M, Goode DL, Elder K, Thio N, et al. Atypical ductal hyperplasia is a multipotent precursor of breast carcinoma. J Pathol 2019;248(3):326–38. [DOI] [PubMed] [Google Scholar]
- 37.Moelans CB, de Weger RA, Monsuur HN, Maes AH, van Diest PJ. Molecular differences between ductal carcinoma in situ and adjacent invasive breast carcinoma: a multiplex ligation-dependent probe amplification study. Anal Cell Pathol (Amst) 2010;33(3):165–73. [DOI] [PMC free article] [PubMed] [Google Scholar]
- 38.Johnson CE, Gorringe KL, Thompson ER, Opeskin K, Boyle SE, Wang Y, et al. Identification of copy number alterations associated with the progression of DCIS to invasive ductal carcinoma. Breast Cancer Res Treat 2012;133(3):889–98. [DOI] [PubMed] [Google Scholar]
- 39.Rane SU, Mirza H, Grigoriadis A, Pinder SE. Selection and evolution in the genomic landscape of copy number alterations in ductal carcinoma in situ (DCIS) and its progression to invasive carcinoma of ductal/no special type: a meta-analysis. Breast Cancer Res Treat 2015;153(1):101–21. [DOI] [PubMed] [Google Scholar]
- 40.Afghahi A, Forgo E, Mitani AA, Desai M, Varma S, Seto T, et al. Chromosomal copy number alterations for associations of ductal carcinoma in situ with invasive breast cancer. Breast Cancer Res 2015;17:108. [DOI] [PMC free article] [PubMed] [Google Scholar]
- 41.Lin CY, Vennam S, Purington N, Lin E, Varma S, Han S, et al. Genomic landscape of ductal carcinoma in situ and association with progression. Breast Cancer Res Treat 2019;178(2):307–16. [DOI] [PMC free article] [PubMed] [Google Scholar]
- 42.Sakr RA, Weigelt B, Chandarlapaty S, Andrade VP, Guerini-Rocco E, Giri D, et al. PI3K pathway activation in high-grade ductal carcinoma in situ--implications for progression to invasive breast carcinoma. Clin Cancer Res 2014;20(9):2326–37. [DOI] [PMC free article] [PubMed] [Google Scholar]
- 43.Bielski CM, Zehir A, Penson AV, Donoghue MTA, Chatila W, Armenia J, et al. Genome doubling shapes the evolution and prognosis of advanced cancers. Nat Genet 2018;50(8):1189–95. [DOI] [PMC free article] [PubMed] [Google Scholar]
- 44.Elston CW, Ellis IO. Pathological prognostic factors in breast cancer. I. The value of histological grade in breast cancer: experience from a large study with long-term follow-up. Histopathology 1991;19(5):403–10. [DOI] [PubMed] [Google Scholar]
- 45.Lester SC, Bose S, Chen YY, Connolly JL, de Baca ME, Fitzgibbons PL, et al. Protocol for the examination of specimens from patients with ductal carcinoma in situ of the breast. Arch Pathol Lab Med 2009;133(1):15–25. [DOI] [PubMed] [Google Scholar]
Associated Data
This section collects any data citations, data availability statements, or supplementary materials included in this article.