

Abstract
Rationale:
Regression of atherosclerosis is an important clinical goal, however the pathways that mediate the resolution of atherosclerotic inflammation and reversal of plaques are poorly understood. Regulatory T cells (Tregs) have been shown to be atheroprotective, yet the numbers of these immunosuppressive cells decrease with disease progression, and whether they contribute to atherosclerosis regression is not known
Objective:
We investigated the roles of Tregs in the resolution of atherosclerotic inflammation, tissue remodeling and plaque contraction during atherosclerosis regression.
Methods and Results:
Using multiple independent mouse models of atherosclerosis regression, we demonstrate that an increase in plaque Tregs is a common signature of regressing plaques. Single cell RNA-sequencing of plaque immune cells from revealed that Tregs from regressing plaques shared some similarity with splenic Tregs, but were distinct from skin and colon Tregs supporting recent findings of tissue-dependent Treg heterogeneity. Unlike Tregs from progressing plaques that expressed markers of natural Tregs derived from the thymus, Tregs in regressing plaques lacked Nrp1 and Helios expression, suggesting that they are induced in the periphery during lipid lowering therapy. To test whether Tregs are required for resolution of atherosclerotic inflammation and plaque regression, Tregs were depleted using CD25 monoclonal antibody in atherosclerotic mice during apolipoprotein B anti-sense oligonucleotide-mediated lipid lowering. Morphometric analyses revealed that Treg depletion blocked plaque remodeling and contraction, and impaired hallmarks of inflammation resolution including dampening of the Th1 response, alternative activation of macrophages, efferocytosis, and upregulation of specialized pro-resolving lipid mediators.
Conclusions:
Our data establish essential roles for Tregs in resolving atherosclerotic cardiovascular disease and provide mechanistic insight into the pathways governing plaque remodeling and regression of disease.
Keywords: Atherosclerosis, inflammation, regression, adaptive immunity, innate immunity, inflammation resolution
Subject Terms: Vascular Biology
Graphical Abstract
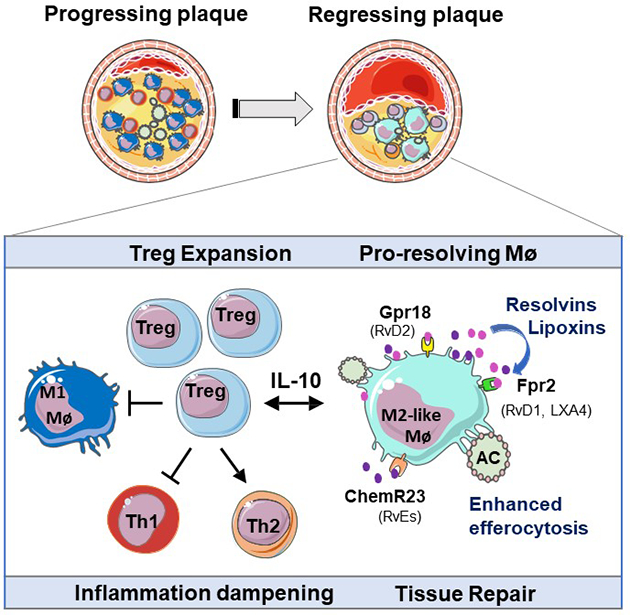
Atherosclerotic cardiovascular disease is the leading cause of morbidity and mortality worldwide. Atherosclerotic plaques begin in early adulthood and progress with age and sedentary lifestyle. Current therapies targeting plasma levels of atherogenic lipids are effective at reducing the progression of atherosclerosis, but they do not cause appreciable regression of existing plaques. There is an urgent need to better understand the pathways that resolve inflammation in the artery wall and enable plaque regression. We report that immune dampening regulatory T cells (Tregs) are increased in plaques undergoing regression and are essential for the resolution of atherosclerotic inflammation and plaque contraction. Our study identifies key functions regulated by Tregs in the regressing plaque, including signals that induce inflammation resolution and tissue repair. These finding provide a roadmap for understanding key components of the immune response needed to reverse chronic inflammation in the artery wall and reduce atherosclerotic plaque burden.
INTRODUCTION
Cardiovascular disease is the leading cause of morbidity and mortality in developed nations, and is expected to remain so as the global incidence of obesity and type 2 diabetes continue to rise1 and the average age of the population increases. Atherosclerotic cardiovascular disease is a chronic inflammatory disease triggered by hypercholesterolemia, in which lipid-rich plaques form in the artery wall. Current therapies for atherosclerosis focus on treatment of modifiable disease risk factors, particularly lowering of apoB-lipoproteins that accumulate in the arterial intima and fuel chronic inflammation. While cholesterol-lowering drugs that promote the clearance of circulating low density lipoproteins (LDL) (e.g., statins, PCSK9 inhibitors) and/or inhibit intestinal cholesterol absorption (e.g., ezetimibe) effectively reduce hypercholesterolemia, they have proven inadequate to substantially regress (<2%) the plaque burden observed in the majority of patients with established atherosclerosis2, 3. There is, thus, an urgent need to develop new therapeutics that restore tissue homeostasis in the artery wall and regress atherosclerotic plaques. One strategy that is thought to hold promise is targeting of the maladaptive immune response that fuels plaque growth through the accumulation of pro-inflammatory immune cell subsets4, 5. However, this will require a better understanding of the mechanisms underpinning inflammation resolution and tissue repair that enable atherosclerosis regression.
Both the innate and adaptive immune responses are activated in atherosclerosis6. Monocyte-derived and tissue- resident macrophages internalize lipoproteins accumulated in the artery wall, leading to the formation of lipid-laden foam cells7. These accruing macrophages are a source of pro-inflammatory cytokines (e.g., interleukin (IL)-1β, tumor necrosis factor-α) and chemokines (e.g., CCL2/MCP-1, CCL5) that amplify the immune response through recruitment of monocytes, dendritic cells and effector T cells (Th1, Th2, Th17)6, 7. Ample evidence supports a pro-atherosclerotic role for CD4+ Th1 cells, which sustain inflammation via secretion of interferon gamma, which stimulates monocyte and T cell recruitment into plaques, increases macrophage foam cell formation and activates dendritic cells8–11. The roles of Th17 cells in atherosclerosis are less clear, as mouse studies have reported both pro- and anti-atherosclerotic roles for Th17 cells and the Th17-derived cytokine IL-1712. By contrast, immunosuppressive CD4+ regulatory T cells (Tregs) have been shown to be atheroprotective13 through their secretion of inflammation-dampening cytokines [e.g., interleukin (IL)-10, transforming growth factor (TGF)-ß] and expression of coinhibitory receptors (e.g., CTLA-4) that suppress naïve and effector CD4+ and CD8+ T cells, antigen presenting cells (DC and macrophages) and NK cells [reviewed in14, 15]. Treg cells are vital for maintaining tolerance to self-antigens and preventing the unrestricted expansion of effector T cell populations16, and an imbalance in T effector:Treg ratio is thought to drive atherosclerosis progression17–19.
Regulatory T cells are defined by their high expression of the markers CD25 and FoxP3, and can be derived from the thymus (natural Tregs) or differentiate from naïve CD4+ T cells in the periphery (inducible or iTregs)20. In humans, low levels of circulating Tregs are associated with an increased risk of acute coronary syndrome21, and higher numbers of Tregs are found in stable versus unstable plaques22, 23. These findings are supported by studies in hypercholesterolemic mouse models, which have shown a decline in Treg numbers in the circulation and plaque, and reduced suppressive function during atherosclerosis progression17, 24. Several factors are thought to contribute to the decline in Tregs during atherosclerosis including epigenetic regulation of the FoxP3 locus25, increased susceptibility to apoptosis21, 26, and Treg conversion into follicular T cells or pro-inflammatory Th1/Tregs27, 28. Notably, depletion of Tregs in mouse models of atherosclerosis progression using anti-CD25 antibodies13 or diphtheria toxin-targeted depletion of FoxP3+ cells29 exacerbates disease, whereas adoptive transfer of Tregs halts disease progression13. Furthermore, recent studies have shown that the Treg population of the plaque can be dynamically expanded by administration of IL-2 complex30–32, tolerogenic administration of atherosclerotic antigens33–36, or increasing the M2-macrophage population of the plaque37, to impede atherosclerosis progression. Together, these studies support Treg enhancement strategies for the treatment of atherosclerosis.
In the current study, we sought to understand whether Tregs are essential for the regression of atherosclerotic plaque, and if so, to identify key mechanisms by which Tregs contribute to plaque repair and contraction. We show that enrichment of Tregs in plaques is evident in multiple mouse models of atherosclerosis regression, and is required for the contraction of plaque burden, reduction of inflammation and induction of tissue repair in the artery wall. Using single cell RNA-seq, combined with conventional histological and flow cytometry techniques, we show that antibody-mediated depletion of Tregs halts the regression of atherosclerosis achieved with aggressive lipid lowering, and impedes pro-resolving functions in the plaque including macrophage emigration, polarization of tissue reparative M2-like macrophages, and response to specialized pro-resolving lipid mediators. These findings reveal the critical role of Tregs in resolving atherosclerotic cardiovascular disease and provide mechanistic insight into the pathways governing plaque remodeling and regression of disease.
METHODS
Data is available on request from the authors.
Major Resources Table included in the Supplemental Materials.
Mouse studies.
All experimental procedures were done in accordance with the US Department of Agriculture Animal Welfare Act and the US Public Health Service Policy on Humane Care and Use of Laboratory Animals and were approved by the New York University School of Medicine’s Institutional Animal Care and Use Committee. Within the animal studies, all analyses were blinded whenever possible through numerical coding of samples. To power our studies, sample size was predefined as n = 8–10 mice/group for morphometric and flow cytometry analyses, and n = >5 for immunostaining analyses, as noted. For in vivo analyses, mice were excluded if starting total cholesterol levels were less than 600 mg/dL. Advanced atherosclerosis was induced in 8 week old male and female C57BL6/J mice (Jackson Laboratories, ME, USA) by injection with murine AAV-mPCSK9 (5 × 10¹¹; Penn Vector core, PA, USA) and western diet feeding (40% fat kcal, 0.3% cholesterol; Dyets #101977GI) for 20 weeks. In this model, sustained expression of PCSK9 by the liver markedly reduces hepatic LDL-R levels without the need for genetic modification (e.g., Ldlr–/– or Apoe–/–). Mice were randomly assigned to either baseline or one of two regression groups: ApoB-ASO+ IgG or ApoB-ASO + anti-CD25. Regression was induced by reversal of hyperlipidemia using an apoB-ASO (Ionis Pharmaceuticals, 50 mg/kg; 2x/week for 3weeks) on chow diet (13% fat kcal, 0% cholesterol; LabDiet #5053). During the regression period, mice were untreated or treated 1x weekly with 250 μg of isotype control IgG (Ultra-LEAF™ Purified Rat IgG1, λ Isotype Ctrl Antibody #401916, Biolegend, CA, USA) or PC61 anti-CD25 monoclonal antibody (Ultra-LEAF™ Purified anti-mouse CD25 Antibody # 102040, Biolegend, CA, USA) to deplete Tregs. Mice were monitored regularly throughout the study and weighed weekly. For the aortic arch transplant mice model, male and female Apoe–/– (B6.129P2-Apoetm1Unc/J) mice were fed western diet for 16 weeks and were randomized to either baseline or donor groups. The donor aortic arch from Apoe–/– mice on the CD45.1 background was interpositioned with the abdominal aorta in the recipient WT (C57BL6/J) mice on CD45.2 background as previously described38. The baseline and recipient WT mice were sacrificed after 3–5 days of aortic arch transplant38. For the REVERSA mouse model, male and female Ldlr−/−Apob100/100Mttpfl/flMx1Cre+/+ were fed western diet for 16 weeks and randomized to either baseline or regression groups. In the regression group, Mx1-Cre expression was induced by polyinosinic-polycytidylic acid (pIpC) (36 μg every other day for a total of 4 injections) (tlrl-pic, Invivogen, CA, USA), resulting in the inactivation of Mttp in the liver and mice were fed chow diet for 4 weeks prior to sacrifice as described39. At the endpoint of each study, mice were anaesthetized with isoflurane and exsanguinated by cardiac puncture, perfused with PBS, followed by 10% sucrose in PBS. Aortic roots were embedded in OCT medium and frozen immediately for subsequent sectioning and staining. Cholesterol levels were measured using Wako Total cholesterol kit (Wako Diagnostics, CA, USA).
Labelling and tracking of blood monocytes.
Circulating blood monocytes were labeled in vivo by retro-orbital i.v. injection of 1 μm Flouresbrite YG microspheres (Polysciences Inc., PA, USA) diluted 1:4 in sterile PBS as described40–42. The efficiency of bead labelling was verified 24 hours later by flow cytometry. One group of mice was harvested after 3 days for baseline measurements of plaque size and Ly6Clo monocyte recruitment, and mice undergoing regression in the presence of IgG or anti-CD25 were harvested 21 days later to measure the number of labeled macrophages remaining in the aortic arch and aortic root lesions. Ly6Chi monocytes were labelled by intraperitoneal injection of 4 mg/ml of Edu (5-ethynyl-2’-deoxyuridine) from Life technologies (NY, USA) and mice were sacrifice after 3 days to assess recruitment or 21 days to assess for retention. Efficiency of Edu labeling was assessed using Click-IT EdU Pacific Blue Flow Cytometry Assay Kit (Life Technologies, NY, USA) after 24 hours, and EdU-labeled cells were stained using a Click-IT reaction with Alexa Fluor 647 nm-azide (Click-iT EdU Imaging Kit, Invitrogen, CA, USA).
Tissue collection and flow cytometry.
The aortic arches of mice were harvested at baseline, or 3 weeks after apoB-ASO and IgG- or anti-CD25 treatment, and incubated in digestion buffer containing liberase (#273582, Roche, Basel, Switzerland), hyalurodonidase (#3506, Sigma, MO, USA), DNase I (#DN25, Sigma, MO, USA) and 1M CaCl2 at 37°C for 15 min using the GentleMacs dissociator (Miltenyi Biotech, Bergisch Gladbach, Germany). The digested tissue was passed through a 70 μm cell strainer, washed with 1X cold PBS and centrifuged at 350 g for 10 min at 4°C. The thymus was mashed, passed through the 70 μm cell strainer and centrifuged prior to flow cytometer analysis. Spleens were mashed and red blood cells were lysed using ACK lysis buffer (ThermoFisher Scientific, MA, USA) prior to flow cytometer analysis. Blood collected at sacrifice was treated with ACK lysis buffer and leukocytes were collected for flow cytometric staining. For flow cytometry, cells stained with Fixable Viability Dye eFluor® 780 (eBioscience, CA, USA) for 30 mins on ice, blocked with TruStain fcX™ (Biolegend, CA, USA) and then stained using PerCp/Cy5.5 anti-mouse CD45 antibody (Biolegend, 103132), Alexa Fluor 700 anti-mouse CD3 antibody (#100216, Biolegend, CA, USA), Bv605 anti-mouse CD4 antibody (#100548, Biolegend, CA, USA), APC anti-mouse CD25 antibody (#101910, Clone 3C7, Biolegend, CA, USA), Bv650 anti-mouse CD11b antibody (#101239, eBioscience, CA, USA), Bv786 anti-mouse F4/80 antibody (#123141, Biolegend, CA, USA), Bv570 anti-mouse Ly6C antibody (#128030, Biolegend, CA, USA), Bv421 anti-mouse Nrp1 antibody (#145209, Biolegend, CA, USA) for 30 min on ice. Cells were then fixed and permeablized in fix-perm wash buffer (BD Bioscience, NJ, USA) for 30 min on ice. Intracellular markers were detected using PE anti-mouse FoxP3 antibody (#12-4774-41, eBioscience, CA, USA), PE-Cy7 anti-mouse T-bet antibody (#126419, Biolegend, CA, USA), Bv711 anti-mouse Gata3 antibody (#565445, BD Biosciences, NJ, USA), APC anti-mouse RORgd antibody (#17-6981-82, ThermoFisher Scientific, MA, USA). The cells were then acquired on a LSRII HTS (BD Biosciences, NJ, USA) and analyzed with FlowJo V10 (Tree-Star, OR, USA).
Immunohistochemistry.
Hearts were sectioned through the aortic root (6 μm) and stained with hematoxylin and eosin for quantification of lesion area. For immunostaining, slides were fixed with 4% formaldehyde, permeabilised with 0.1% triton and blocked with 5% BSA. The sections were incubated with antibodies against Ki67 (#Ab1666, Abcam, MA, USA) to detect proliferating cells, CD68 (#MCA1957, Bio-Rad, CA, USA) or Mac2 (#677302, Biolegend, CA, USA) to detect macrophages, MR1 (#MCA2235, Bio-Rad, CA, USA) and Arg1 (#53-3697-82, ThermoFisher Scientific, MA, USA) M2 markers, and Foxp3 (#17-5773-82, ThermoFisher Scientific, MA, USA) to detect Tregs. Sections were then incubated with appropriate secondary antibodies and stained with DAPI to detect nuclei. To distinguish bona fide target staining from background secondary antibody only was used as a control. The images were taken with a Nikon Eclipse microscope and analysed using Image J software (https://fiji.sc/). Quantification of immunostaining was performed from 6 high power fields per aortic root or arch section/ mouse, with investigators blinded to treatment assignment. Representative images were selected to represent the mean value of each condition.
Single cell RNA-sequencing.
Single-cell RNA-sequencing was performed on CD45+ cells isolated from aortic arches as described above were pooled from 4 mice. Immune cells were stained for CD45 (anti-CD45 PerCp-Cy5.5, BioLegend) and isolated by flow sorting viable (fixable viability dye e780, eBioScience, CA, USA) single cells on a FACS Aria II cytometer (BD Biosciences, NJ, USA) equipped with a 100 μm nozzle. Sorted CD45+ cells were loaded into single cell gel beads (GEMs) and barcoded with a unique molecular identifier (UMI) using the Single Cell 3’ reagent kit (10X Genomics) and processed as described previously43. Sequence libraries containing full-length, barcoded cDNA were generated and sequenced on a NovaSeq 6000 (Illumina, CA, USA) in a dual paired-end sequencing. The data was demultiplexed, QC checked and aligned to the mouse genome using the Cell Ranger Single Cell Software Suite v2.2 (https://support.10xgenomics.com/single-cell-gene-expression/software/pipelines/latest/what-is-cell-ranger). Briefly, using Cellranger mkfastq and Cellranger count, FASTQ files were generated and aligned to the mm10 genome, sequencing reads were filtered by base-calling quality scores, and then cell barcodes and UMIs were extracted from each read in the FASTQ files. The filtered gene expression matrices were then used for downstream analyses. Outlier cells were removed based on the number of genes expressed and the percent of expressed genes coming from the mitochondria, as outliers in these metrics are likely to represent either multiple captured cells or cells undergoing apoptosis. Using the R package Seurat v2, the samples were then merged, canonical correlation analysis (CCA) was performed, and the canonical correlation vectors (CCs) were aligned, as described by Butler et al44. Using the aligned CCs, Louvain clusters were found and t-SNE dimension reduction was performed. Single cell RNA-Seq data have been deposited in the Gene Expression Omnibus under accession number GSE141038.
Cluster annotation and differential gene expression.
To assign clusters and individual cells to main cell types, we used the R package SingleR45 and default parameters, using the complete ImmGen catalog as the reference dataset and the parameter do.main.types = T. This resulted in the most likely main cell type being assigned to either each cluster, based on the average expression profile of the cluster, or each individual cell, using the expression profile of the cell. We used Seurat v244 to identify differentially expressed genes by sample for each cluster, using the Wilcoxon test to generate p-values. To calculate log fold-change (logFC) values and p-values for all variable genes for each cluster, we used the following parameters: logfc.threshold = -Inf, min.pct = 0, min.cells.gene = 0, min.cells.group = 0, genes.use = my.seurat@var.genes. We used the R package ClusterProfiler46 to look for enriched functions in the marker genes for each cluster, as well as differentially expressed genes by sample.
Cell culture.
Primary bone marrow–derived macrophages (BMDMs) were prepared by flushing the bone marrow of the tibia and femur of 6- to 8-week-old C57BL/6 mice as described47. The cells were grown in DMEM supplemented with 20% L929-conditioned medium, 10% FBS and 1% penicillin-streptomycin for 4–5 days. To isolated naïve T cells from the spleen, the tissue was mashed, RBCs were lysed using ACK lysis buffer and cells were isolated using the Naive CD4+ T Cell Isolation Kit for mouse (Miltenyi Biotech, Germany). Isolated naïve T cells were incubated with anti-CD28 (1 μg/mL; #102102, Biolegend, CA, USA) and anti-CD3 (0.25 μg/mL; #100302, Biolegend, CA, USA) to maintain cell proliferation in T cell media (RPMI supplemented with 10% FBS, 2 mM L-glutamine, 1 mM sodium pyruvate, 100 mM non-essential amino acids (#11140–050, Invitrogen, MA, USA), 55 μM beta-mercaptoethanol (#21985023, Invitrogen, MA, USA), 100 U/mL PenStrep and 5 mM HEPES. For Treg differentiation and proliferation, naïve T cells were isolated from the spleens of 5–6 wild type mice and incubated with anti-CD28 (1 μg/mL), anti-CD3 (0.25 μg/mL), and TGFβ (5 ng/mL) from R&D Biosystems (#7666-MB-005, MN, USA), IL-2 (5 ng/mL) from R & D Biosystems (#202-IL-050, MN, USA), anti-IFNγ (1 ug/mL; #505706, Biolegend, CA, USA) and anti-IL-4 (1 ug/mL; #504108, Biolegend, CA, USA) in T cell media for 4 days at 37οC. Differentiated Tregs or naïve T cells were then incubated with BMDMs (at day 5) for 72 hours at 37οC. After the priming of BMDMs with naïve T cells or Tregs, BMDMs were washed and RNA was isolated for qPCR analysis for Gpr18, Fpr2 and Cmklr1 genes using 28S and HPRT as normalisation genes, or cells were fixed with 4 % paraformaldehyde, blocked with 5% BSA and stained for Fpr2, Cmklr1 and Gpr18 (#NLS1878C, NBP1–43233AF488 and NBP2–24918, Novus Biologicals, CO, USA). To assay efferocytosis, BMDMs were co-cultured with apoptotic JURKAT cells labelled with CellTracker™ Green CMFDA (#C2925, Life Technologies, CA, USA) at 10 μM concentrations for 30 minutes at 37οC. The labelled JURKATs were treated with 100 μg/mL cycloheximide for 6 hours at 37οC to induce apoptosis. These apoptotic cells were co-cultured with BMDMs at 1: 3 (BMDMs: JURKATs) for 60 minutes at 37οC. These cells were processed for immunohistochemistry by staining membrane of BMDMs with AlexaFlour 488 anti-phalloidin antibody (#A12379, Life Technologies, CA, USA). All images were taken with Nikon Eclipse microscope and analysed with using Image J software (https://fiji.sc/).
Targeted LC-MS/MS-based lipid mediator analysis.
Targeted mass spectrometry was used to measure specific SPM in BMDMs. For this, BMDMs were untreated or incubated with naïve T cells or Tregs, and cells were washed, scraped and snap frozen in liquid nitrogen for analysis. Lipid mediators were extracted using solid phase C18 columns and elution in methyl formate. Identification and quantification of lipid mediators by LC-MS/MS was facilitated by internal deuterated standards and external standard curves for each mediator, as recently described48.
Statistics.
For analysis of in vitro and in vivo experiments, GraphPad Prism 8 (GraphPad Software, CA, USA) was used. Data are presented as mean ± standard error (s.e.m.) unless otherwise indicated, and P ≤ 0.05 was considered as statistically significant. Briefly, Gaussian distribution was first determined in experiments with n>3 using the Shapiro Wilk normality test. Data that were determined to be parametric were analyzed by a two-tailed unpaired Student’s t-test (2 groups), or one-way ANOVA (>2 groups) followed by Sidak’s multiple comparison test. Data that were determined to be non-parametric were analyzed by a Kruskal-Wallis test. No experiment-wide multiple test correction was applied. For the single-cell RNA analysis, unless otherwise noted, we report adjusted p-values that have been corrected for multiple testing using Benjamini-Hochberg.
RESULTS
Tregs are expanded in regressing atherosclerotic plaques.
The introduction of mouse models of atherosclerosis regression has facilitated the identification of factors and pathways that could be manipulated, in conjunction with lipid lowering strategies, to further reduce cardiovascular disease risk in patients. To understand the role of regulatory T cells in the regression of atherosclerosis, we quantified the number of Foxp3+ Tregs in progressing and regressing plaques using four independent mouse models. In the first model, hepatic low density lipoprotein receptor (LDLR)-deficiency was established in C57BL6/J mice using adeno-associated virus (AAV)-mediated delivery of PCSK9, and mice were fed western diet (WD) to establish atherosclerosis (baseline; Figure 1A). After 20 weeks, mice were switched to chow diet and treated with antisense oligonucleotides (ASO) targeting apolipoprotein B (apoB-ASO) to initiate atherosclerosis regression. Three weeks after apoB-ASO treatment, we observed a normalization of hypercholesterolemia and 35% reductions in aortic root plaque size and macrophage content compared to baseline mice (Online Figure I). Immunohistochemical staining for FoxP3 showed a 3-fold increase in FoxP3+ Tregs in plaques of apoB-ASO treated mice compared to baseline (Fig. 1A). Similarly, using the REVERSA genetic model of atherosclerosis regression (Ldlr–/–ApoB100/100MTTPfl/flMx1Cre+)49 in which hypercholesterolemia is reversed after 16 weeks of WD (baseline) upon administration of poly I:poly C to induce cre-mediated deletion of the MTTP gene to reduce hepatic secretion of very low density lipoproteins (VLDL), we found a 2-fold enrichment of Foxp3+ Tregs and a 50% decrease in CD68+ macrophages in regressing plaques compared to baseline (Fig. 1B, Online Figure I). Moreover, using an aortic transplant model of atherosclerosis regression50 in which the aortic arch of Apoe–/– was transplanted into normocholesterolemic C57BL6 (regression) or hypercholesterolemic Apoe–/– (progression) mice, we observed a 3-fold increase in Foxp3+ Tregs in regressing plaques compared to progressing plaques (Fig. 1C, Online Figure I). Notably, switching atherosclerotic mice to chow diet alone for 4 weeks did not alter Treg content or plaque size, although there was a trend toward reduced macrophage content, indicating that modest lipid lowering was insufficient to mediate the enrichment of Tregs observed in regressing plaques (Fig. 1D; Online Figure I). Together, these data indicate that an increase in Tregs in plaques is a common feature of atherosclerosis regression.
Figure 1. Tregs are expanded in regressing atherosclerotic plaques and exhibit a gene signature distinct from Tregs in progressing plaques.
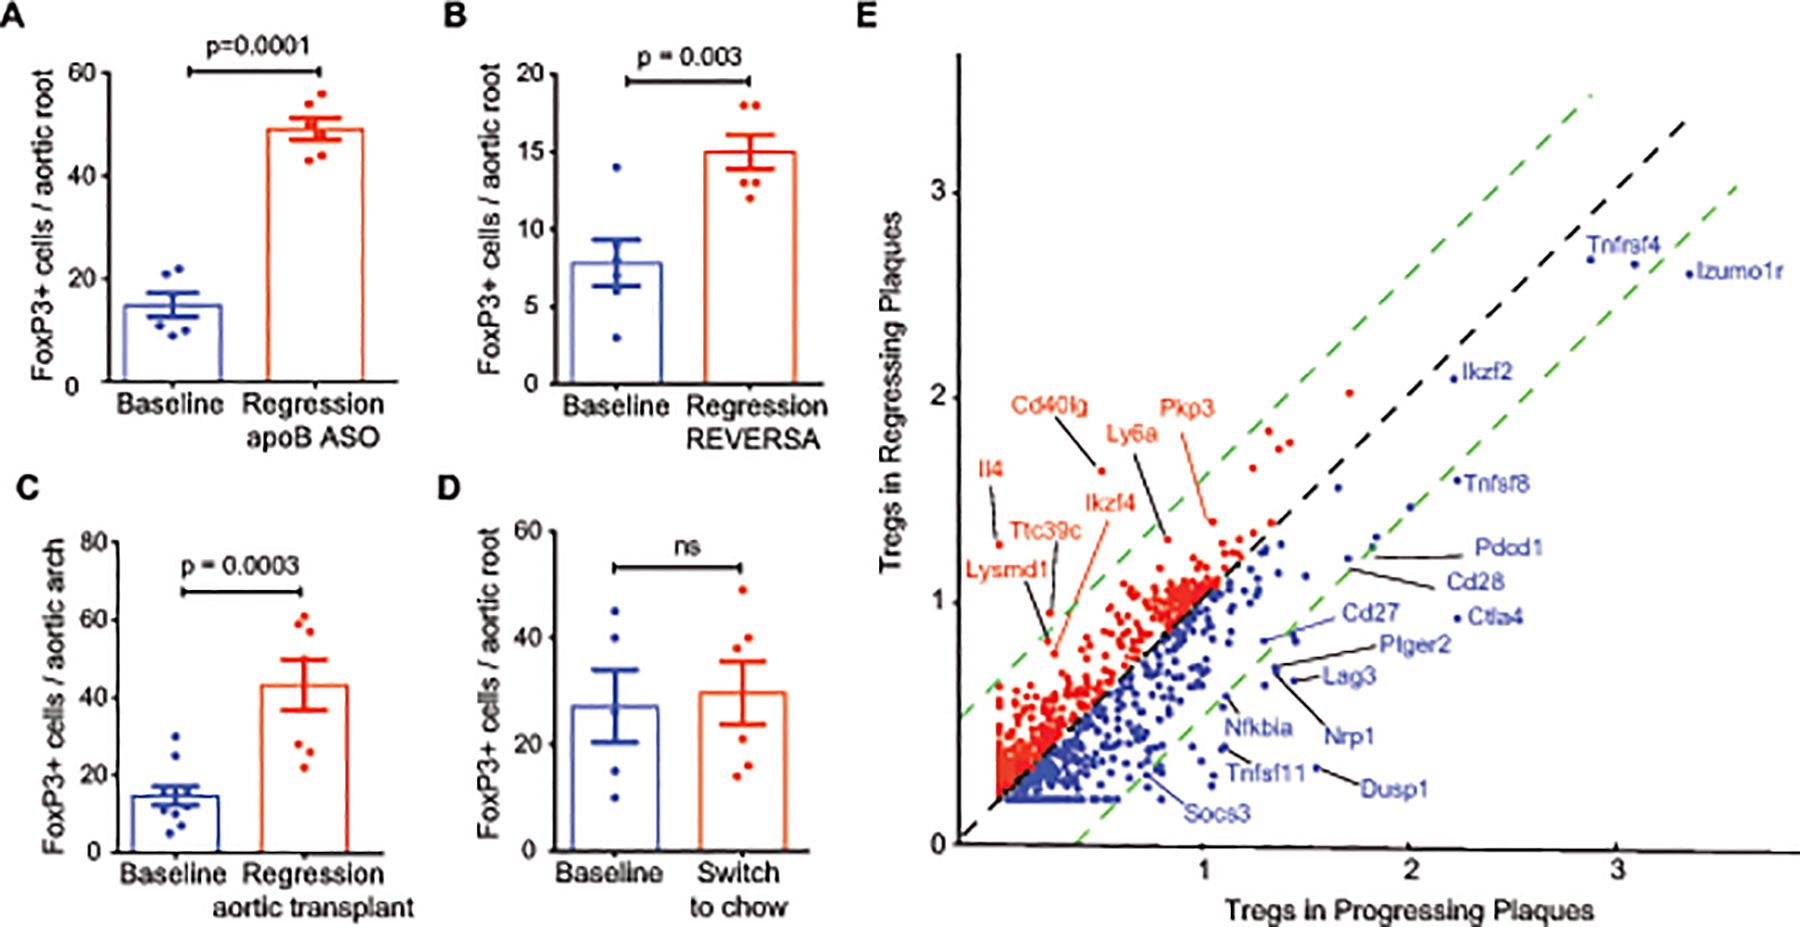
A-D) Quantification of Foxp3 immunostaining in cross-sections of the A) aortic root of atherosclerotic C57BL6/J mice at baseline [AAV-PCSK9 and western diet (WD) for 20 weeks] and 3 weeks after lipid lowering using apoB-ASO (regression) (n=6 mice/group), B) aortic root of atherosclerotic REVERSA mice at baseline (16 weeks WD) and 4 weeks after lipid lowering by MTP deletion (regression) (n=6 mice/group), C) aortic arch of atherosclerotic Apoe–/– mice at baseline (16 weeks WD; n= 10) and 3 weeks after transplant into normolipidemic C57BL6/J (regression; n=7), D) aortic root of atherosclerotic C57BL6/J mice at baseline (AAV-PCSK9 and WD for 20 weeks; n=5) and 3 weeks after switching mice to chow diet to halt plaque progression (n=6). E) Scatter plot of scaled average gene expression values for the 1,327 most variable genes in the Treg clusters from aortas of mice (n=4 mice pooled per group) undergoing atherosclerosis progression using PCSK9-AAV + WD 20 wk (blue, x-axis) or after 3 weeks of regression (red, y-axis) induced by ApoB-ASO treatment. Green dotted lines indicate 1.5-fold change in expression. Genes of interest due to change in expression or known biology are labelled. Data in (A-D) are the mean ± s.e.m. P values were determined by an unpaired Student’s t-test (A-D).
To understand whether aortic Tregs that accumulate in progressing plaques are different than those that populate regressing plaques, we performed single cell RNA-sequencing of CD45+ cells isolated from aortic arch plaques of atherosclerotic mice, and compared the expression profiles of Tregs from both progressing (PCSK9-AAV + 20 weeks WD) and regressing (PCSK9-AAV + 20 weeks WD, followed by ApoB-ASO for 3 weeks). Interestingly, we observed that Tregs in the progressing plaques had high mRNA levels of the marker for thymus-derived or natural Tregs, Nrp1, and genes associated with nTreg activation (Itgb1, Ctla4)51 (Figure 1E). By contrast, Tregs from regressing plaques showed lower mRNA levels of Nrp1, and higher mRNA levels of factors implicated in inducible Treg differentiation or maintenance (Mif, lgals9, Ly6a) compared to Tregs from progressing plaques52,53,54 (Figure 1G, Online Table I), suggesting that Tregs in regressing plaques may derive from peripheral differentiation of naïve T cells.
Treg depletion abrogates atherosclerosis regression.
To investigate whether the expansion of Tregs in regressing plaques is required for resolution of atherosclerosis, we treated mice with advanced atherosclerosis with the PC61 anti-CD25 monoclonal antibody (mAb) to deplete CD25+Foxp3+ Tregs or an isotype control antibody (IgG) during apoB-ASO lipid lowering therapy (Figure 2A). Three weeks after treatment with apoB-ASO, western diet-induced hypercholesterolemia was normalized in both antibody treatment groups (Figure 2B) and we observed no difference in plasma total cholesterol, high density lipoprotein (HDL) cholesterol, non-HDL cholesterol and triglycerides (Figure 2B), or body weight between PC61 mAb and IgG-treated mice (Online Figure II). Using flow cytometry, we observed that PC61 mAb reduced CD25+FoxP3+ cells by 50–70% in the blood, spleen and thymus of treated mice compared to control IgG (Figure 2C, D). Immunostaining for FoxP3 in cross-sections of the aortic root confirmed a 3-fold increase in FoxP3+ cells in apoB-ASO treated mice receiving IgG, which was blunted by 50% in mice receiving PC61 mAb (Figure 2E). To assess the effect of Treg depletion on plaque burden during atherosclerosis regression, we measured lesion area in two anatomical sites: the aorta en face and at the aortic root. In mice treated with control IgG during lipid lowering, by en face staining, we observed a 50% decrease in aortic lesion area compared to baseline mice (Figure 2F). Strikingly, we observed no change in plaque burden in the aortas of mice treated with PC61 mAb during lipid lowering (Figure 2F). Analysis of plaque size in the aortic arch, the major site of plaque formation in the aorta, showed similar results with a marked reduction in lesion area upon lipid lowering in IgG-treated but not PC61 mAb-treated mice (Online Figure II). These findings were replicated in the aortic root, a site of advanced plaque formation, where cross-sectional analysis revealed a 35% decrease in plaque size in mice treated with apoB-ASO and control IgG, but no change in mice treated with apoB-ASO and PC61 mAb, compared to baseline mice (Fig. 2G). Together these data indicate that depletion of CD25+ Tregs blocks the regression of atherosclerotic plaques induced by aggressive lipid lowering.
Figure 2. Treg depletion abrogates atherosclerosis regression.
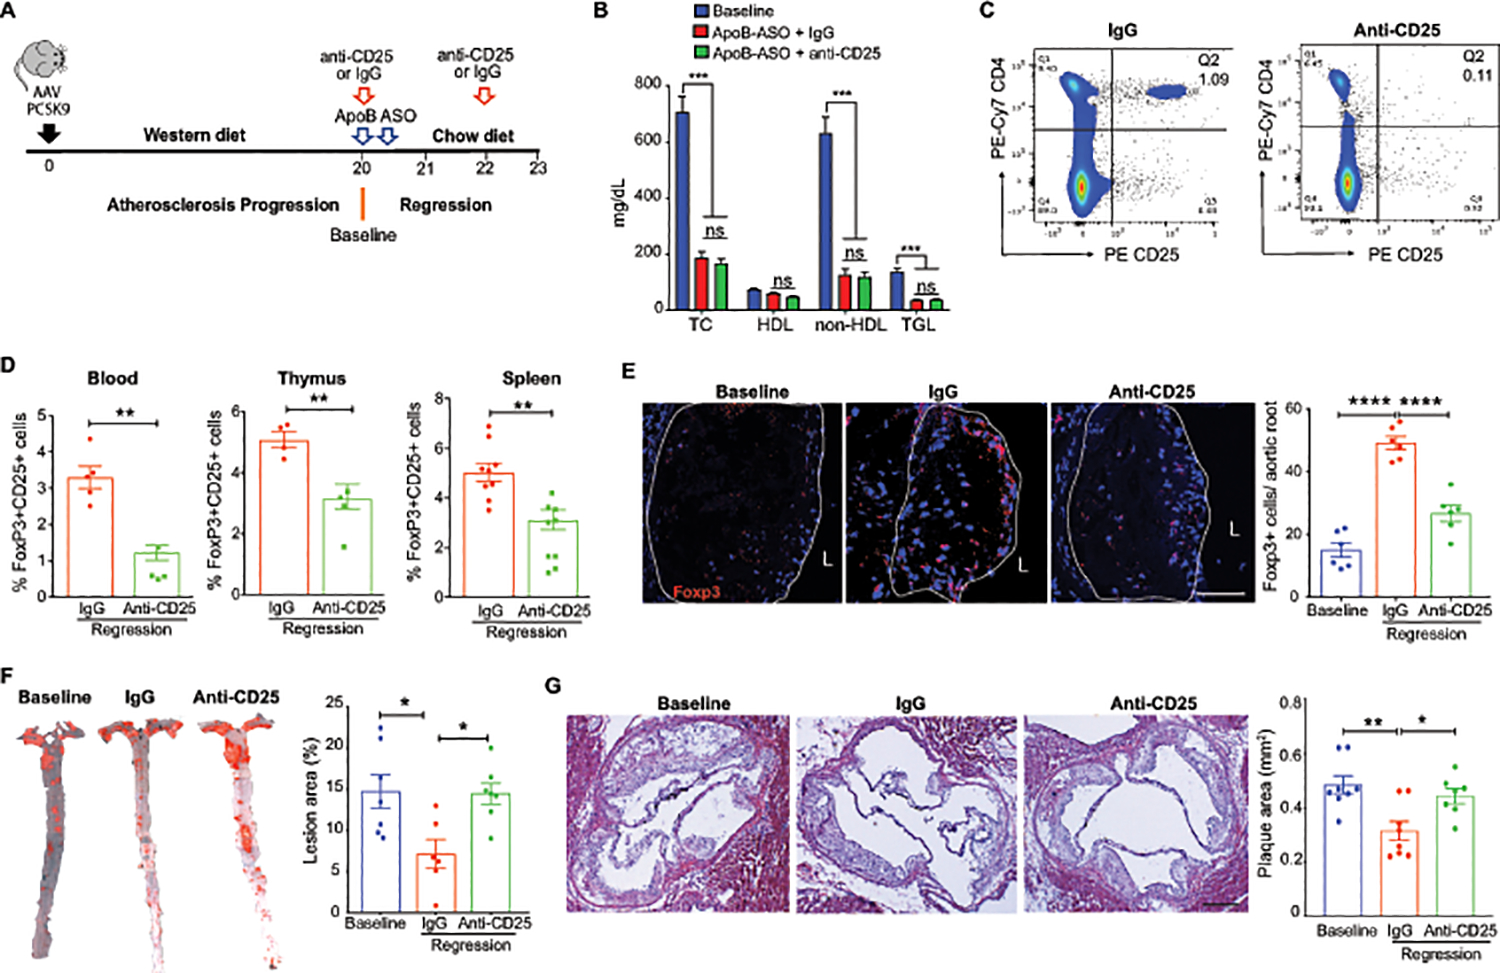
A) Experimental design: Atherosclerosis was established in C57BL6/J mice by injection of AAV-PCSK9 followed by western diet feeding for 20 weeks (Baseline). Mice were then switched to chow diet and atherosclerosis regression was initiated by apoB-ASO-mediated lipid lowering in conjunction with anti-CD25 or IgG isotype control antibody treatment for 3 weeks. B) Plasma total cholesterol, HDL and non-HDL cholesterol and triglyceride levels at baseline and after regression + IgG anti-CD25 treatment (n=11 mice/group). C) Representative flow cytometric analyses of CD4+CD25+ cells in the circulation of mice treated with IgG or anti-CD25 during atherosclerosis regression. D) Quantification of FoxP3+CD25+ cells in peripheral blood (n=5/group), thymus (n-5/group) and spleen (n=9/group) of mice by flow cytometry. Data are mean ± SEM and are representative of 2 independent experiments. P values were determined by a Student’s t-test. E) Representative immunofluorescence staining for FoxP3 in aortic root plaques from mice at baseline and after regression + IgG or anti-CD25 treatment (n=6 mice/group). Quantification shown at right. Scale bars = 100 μM. F-G) Representative images and quantification of atherosclerotic plaque area by en face analysis of the aorta (n=7 mice/group). (F) and cross-sectional analysis of the aortic root (baseline & IgG n=7 mice; anti-CD25 n=8 mice). (G). Scale bars = 250 μM. Data are mean ±SEM. P values were determined by Student’s t-test (B) or in a one-way ANOVA (C-G) with post-hoc Sidak’s test.
The T cell profile is altered in plaques undergoing regression.
To understand how the T cell phenotype in the plaque changes during atherosclerosis regression, and the impact of Tregs on these changes, we isolated single cells from aortic arch plaques by digestion and performed flow cytometric analysis of T cell subsets. We observed no change in CD4+ cells as a percentage of total CD45+ cells among the groups (Online Figure II). However, consistent with FoxP3 staining of aortic root plaques, we observed a 2-fold increase in the percentage of FoxP3+ CD4 T cells in the aortic arch of mice treated with apoB-ASO and control IgG compared to baseline, which was abrogated in mice treated with PC61 mAb (Figure 3A, Online Figure II). Interestingly, more than 50% of Tregs in progressing plaques expressed the Nrp1 marker of thymic-derived Tregs, while 80% of Tregs in regressing plaques (ApoB-ASO + IgG) were Nrp1– (Figure 3B), suggesting that the increase in Tregs in regressing plaques may derive from expansion of peripherally induced Tregs (iTregs). Notably, in mice treated with ApoB-ASO and anti-CD25, this increase in Nrp1–FoxP3+ cells did not occur (Figure 3B). In conjunction with the increase in Nrp1lo-Tregs in regressing plaques of IgG-treated mice, we observed a decrease in Tbet+ Th1 cells and an increase in Gata3+ Th2 and Rorgt+ Th17 cells compared to baseline (Figure 3C–E). The decrease of pro-inflammatory Th1 cells and enrichment of Th2 cells in plaques undergoing regression were suppressed in Treg-depleted mice, while the increase in Th17 cells was unchanged (Figure 3C–E, Online Figure II). These data suggest that Tregs contribute to immunosuppression during atherosclerosis regression by altering the balance of pro- and anti-atherosclerotic effector T cell subsets.
Figure 3. The T cell profile of plaques is altered during atherosclerosis regression.
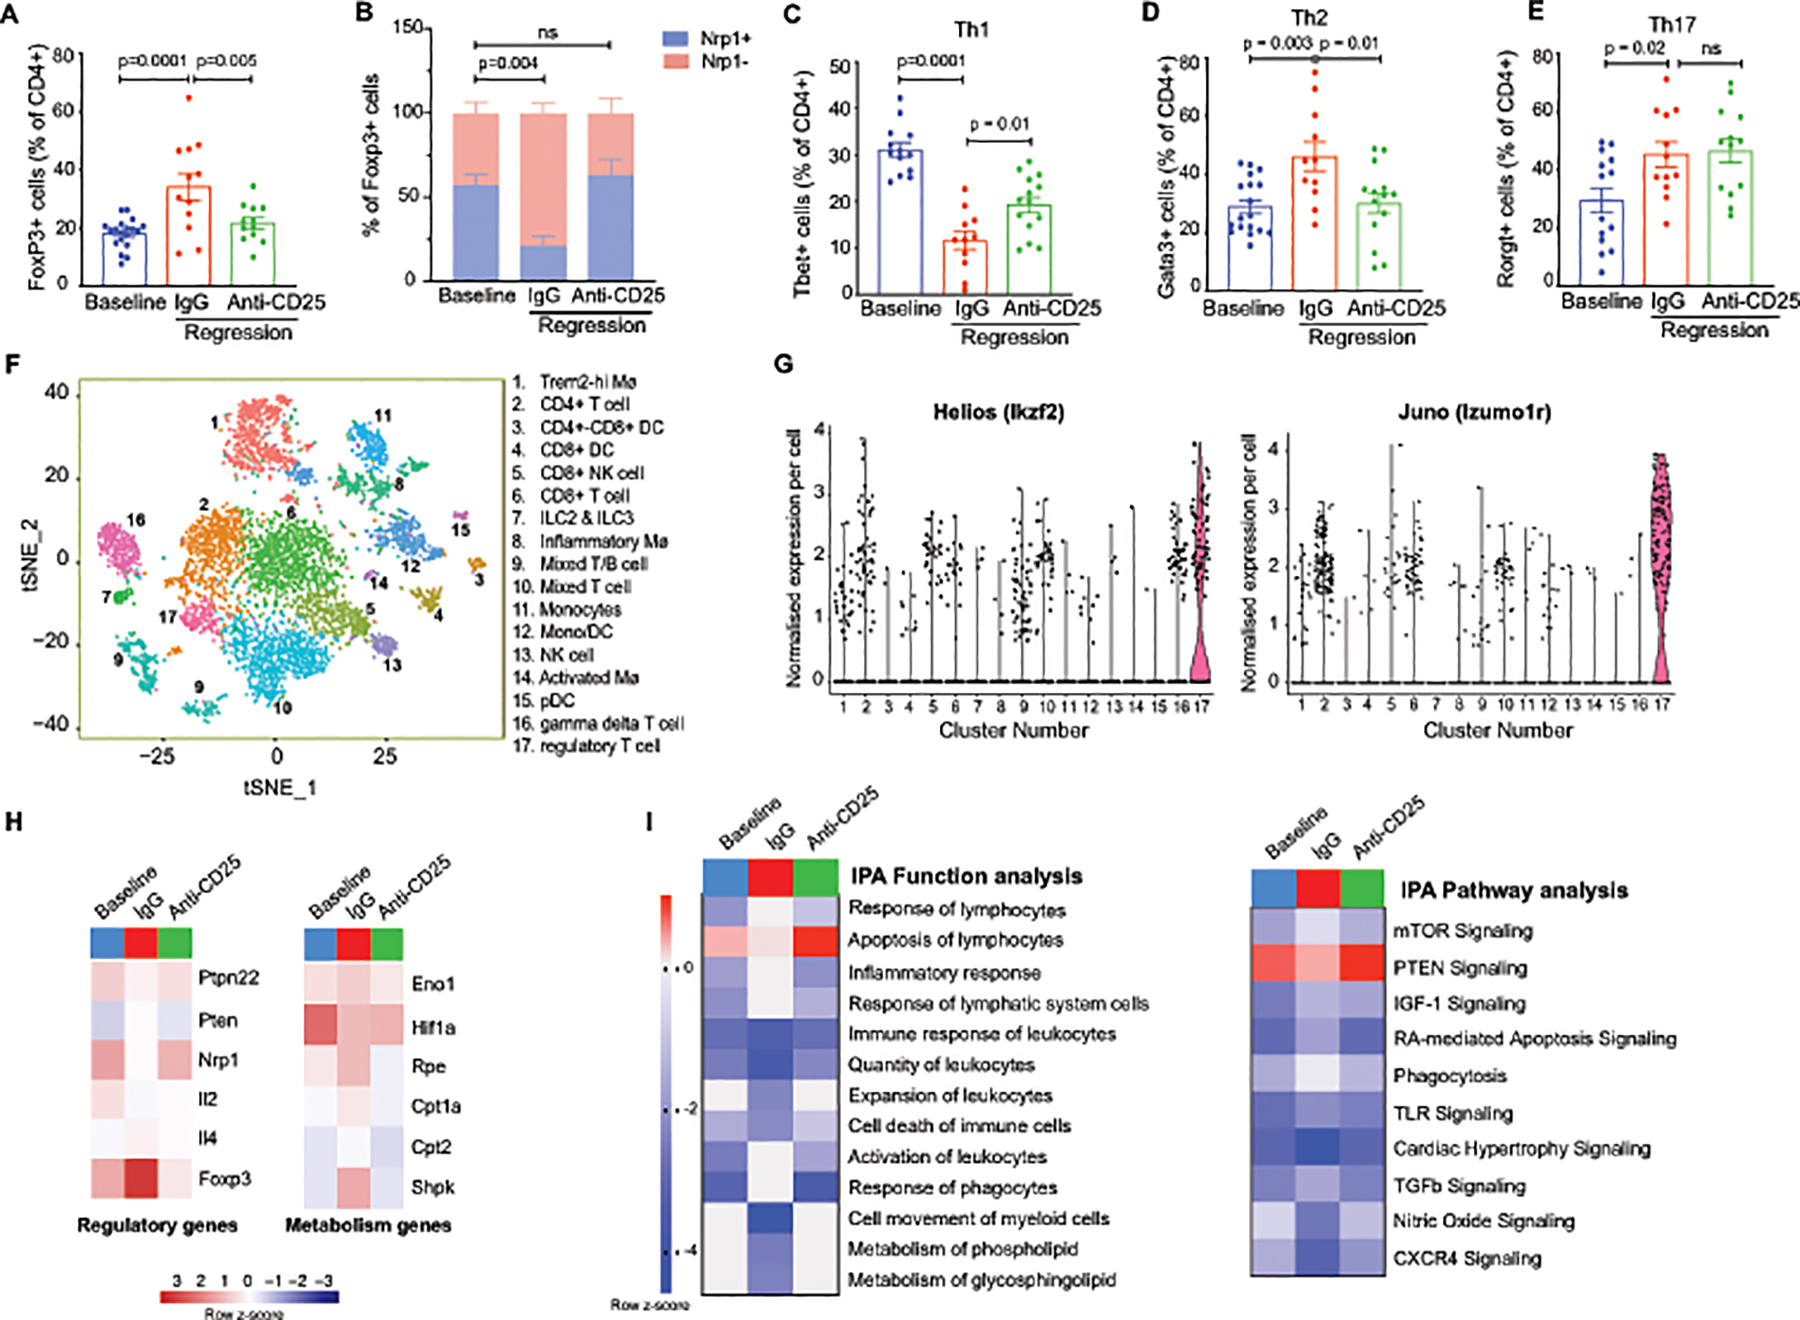
A-E) Quantification of CD4+ T cell subsets in aortic arch plaques by flow cytometric analysis of markers for A) Tregs (FoxP3) (n=19 baseline, 12 IgG, 12 anti-CD25), B) natural (Nrp1+) or induced (Nrp1–) Tregs (n=12/group), C) Th1 (Tbet) (n=13 baseline, 11 IgG, 14 anti-CD25), D) Th2 (Gata3) (n=18 baseline, 11 IgG, 14 anti-CD25). and E) Th17 (RORγδ) (n=14 baseline, 12 IgG, 14 anti-CD25) in mice at baseline and after regression + IgG or anti-CD25 treatment Data are mean ±SEM. P values in A-E were determined by a one-way ANOVA with post-hoc Sidak’s test. F) t-SNE visualization of CD45+ cells isolated from aortic arches of mice at baseline and after regression + IgG or anti-CD25 mAb showing 17 distinct clusters based on single cell transcriptomes. G) Violin plots showing the highest expression of the Treg cell markers Helios (Izkf2) and Juno (Izumo1r) in cluster 17. H-I) Heatmaps of regulatory and metabolism genes (H) and molecular function and signaling pathways (I) differentially expressed in aortic Treg cells isolated from aortic arches of mice at baseline and after regression + IgG or anti-CD25 mAb. Scale represents z-score. Data in F-I are from n=4 mice pooled per group.
To further understand how Tregs alter the phenotype of other immune cells during atherosclerosis regression, we performed single cell RNA-sequencing of CD45+ cells isolated by FACS from the aortic arch at baseline and after treatment with apoB-ASO and control IgG or PC61 mAb, using the 10X Genomics platform. Unbiased hierarchical clustering revealed 17 distinct immune cell clusters in the atherosclerotic aortic arches of mice, which were visualized using multicore t-stochastic neighbor embedding (t-SNE) algorithm (Figure 3F). To characterize the main cell types of origin for the clusters, we used SingleR, which leverages the ImmGen database to characterize cells by their closest match in an unsupervised manner55. This analysis revealed the presence of 5 monocyte and macrophage clusters, 5 T cell clusters, 2 natural killer (NK) cell clusters, 1 innate lymphoid cell (ILC) cluster and 3 dendritic cell (DC) clusters, and a T and B cell cluster of mixed origin. To further characterize these immune cell subpopulations in the plaque, we defined the genes with the highest differential expression for a given cluster as compared to all other cells in the dataset (Online Figure III). Our cell cluster assignment and top marker genes showed accordance with recently published single cell RNA-sequencing of the immune cell repertoire of Apoe–/– and Ldlr–/– mouse atherosclerotic plaques56, 57.
The Treg cluster from aortic plaques was identified by expression of Helios (Ikzf2) and Juno (Izumo1r) (Figure 3G, Online Figure III). Differential gene expression analysis of aortic Tregs at baseline and under regression conditions (apoB-ASO + IgG) showed increased expression of Foxp3 and decreased expression of the nTreg marker Nrp1, again suggesting a non-thymic origin of Tregs in regressing plaques (Figure 3H). To identify gene pathways that are altered during atherosclerosis regression, we used Ingenuity Pathway Analysis to analyze genes differentially expressed (unadjusted p values <0.05) in Tregs from plaques during atherosclerosis progression or regression in the presence and absence of Treg-depleting antibody. This analysis revealed changes in regulatory and metabolic genes as the major functional categories altered between Tregs in progressing and regressing plaques (Figure 3H). Tregs in regressing plaques showed lower expression of Ptpn22, compared to baseline, suggesting increased Treg activation during atherosclerosis regression (Figure 3H). Furthermore, Tregs in regressing plaques had an expression profile consistent with increased metabolic activity, with higher expression of genes involved in glycolysis (Eno1) and the pentose phosphate pathway (Rpe, Shpk), and mitochondrial fatty acid oxidation (Cpt1a, Cpt2), compared to Tregs in baseline plaques (Figure 3H). These changes in aortic Treg phenotype under regression conditions were reversed in mice treated with PC61 mAb (Figure 3H). Ingenuity pathway analysis revealed that the response and activation of lymphocytes was activated, whereas apoptosis, cell movement and metabolism of glycosphingolipids were inhibited in aortic Tregs during regression compared to baseline (Figure 3I). By contrast, these functional pathways were unchanged in Tregs from PC61 mAb-treated mice compared to baseline (Fig. 3I). Furthermore, analysis of signaling pathways showed an increase in TGF-β, mammalian target of rapamysin/mTOR and insulin-like growth factor (IGF)-1 signaling, and a reduction in nitric oxide and phosphatase and tensin homolog (PTEN) signaling in aortic Tregs under regression conditions compared to baseline, whereas no change in these signaling pathways were observed in Tregs from PC61 mAb-treated mice (Figure 3I). Together these data suggest a change in both Treg origin and phenotype during atherosclerosis regression.
Treg depletion alters monocyte/macrophage dynamics.
Tregs are known to have immunosuppressive effects on inflammatory myeloid cells and can educate macrophages to promote a tissue reparative environment31. To investigate how the enrichment of Treg cells in regressing plaques alters monocyte and macrophage dynamics, we first measured kinetic processes that contribute to macrophage accumulation in the plaque, including recruitment, retention, proliferation and apoptosis. We first performed flow cytometric analysis of F4/80+ macrophages isolated from the aortic arch of mice at baseline or under regression conditions with control IgG or PC61 mAb. Compared to baseline, we observed a marked decrease in CD11b+F4/80+ macrophages in the aortic arch of mice undergoing lipid lowering therapy in the presence of IgG, but not PC61 mAb (Figure 4A). Similarly, quantification of macrophage content by CD68 or Mac2 immunostaining in the aortic root, an area of more advanced atherosclerosis, showed a decrease in CD68 and Mac2 staining in plaques undergoing regression, which was blunted by Treg cell depletion (Figure 4B, Online Figure IV). Although these markers are largely expressed by macrophages, it should be noted they can also be expressed by some smooth muscle cells in the plaque. To investigate the basis for macrophage reduction in regressing plaques, and the effect of Tregs on contributing processes, we measured the recruitment of Ly6Chi and Ly6Clo monocytes into the aortic root using Edu pulse labeling and fluorescent microsphere labeling, respectively58. Compared to baseline, we observed no change in monocyte recruitment to regressing plaques, irrespective of antibody treatment (Figure 4C). However, retention of labeled-macrophages in the aortic root and aortic arch (Figure 4D–E; Online Figure IV) was markedly decreased in regressing plaques of IgG-treated but not PC61 mAb-treated mice compared to baseline, suggesting that emigration of macrophages from regressing plaques is impaired upon Treg depletion. In addition, we observed decreased proliferation and increased apoptosis of macrophages in plaques undergoing regression in IgG-treated, but not PC61 mAb-treated mice, as measured by Ki67 and terminal deoxynucleotidyl transferase dUTP nick end labeling (TUNEL) staining (Figure 4F–H). Together, these data suggest that Tregs alter macrophage kinetic processes during atherosclerosis regression that decrease plaque macrophage residence, including reducing macrophage proliferation and retention, and increasing cell death.
Figure 4. Tregs alter macrophage dynamics and phenotype in the regressing plaque.
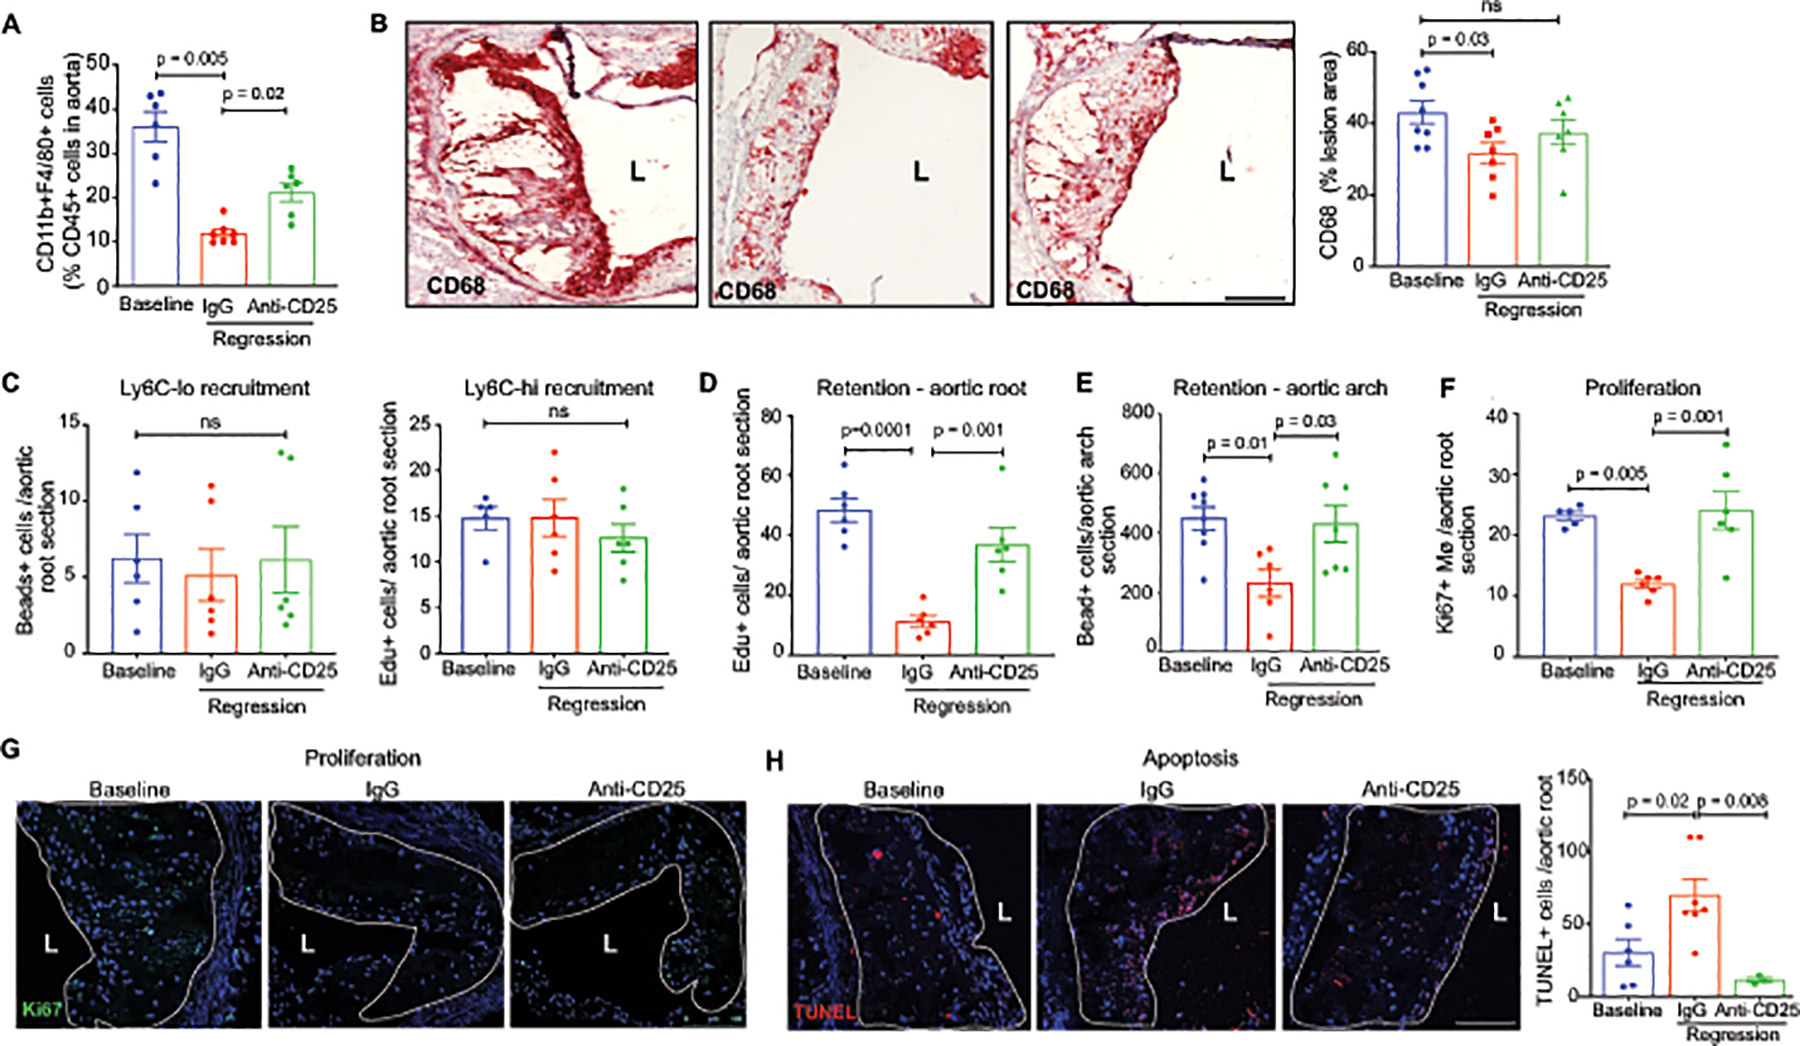
A) Quantification of F4/80+ macrophages in aortic arch plaques of mice at baseline (n=6) and after regression + IgG (n=7) or anti-CD25 (n=6) treatment by flow cytometric analysis. B) Representative images and quantification of immunohistochemical staining for the macrophage marker CD68 (red) in aortic root plaques of mice at baseline (n=8) and after regression + IgG (n=7) or anti-CD25 treatment (n=8). C) Quantification of the recruitment of bead-labeled Ly6Clo monocytes and Edu-labeled Ly6Chi monocytes to aortic root plaques of mice at baseline and after regression + IgG or anti-CD25 treatment (n=6 mice/group). D-E) Quantification of the retention of Edu-labeled Ly6Chi monocyte-derived macrophages in aortic root plaques (n=6 mice/group) (D) and bead-labeled Ly6Clo monocyte-derived macrophages in aortic arch plaques 21 days after pulse-labeling (n=8 baseline, n=6 IgG, n=7 anti-CD25). F-H) Quantification and representative images of immunostaining for the cell proliferation marker Ki67 (n=5 baseline, n=6 IgG and anti-CD25)(F, G) and for cellular apoptosis by TUNEL in aortic root plaques of mice at baseline (n=6) and after regression + IgG (n=7) or anti-CD25 treatment (n=3). Scale bars = 100 μM. Data are the mean ± SEM. P values in A-H were determined by a one-way ANOVA with post-hoc Sidak’s test.
Tregs alter the plaque macrophage landscape during regression.
Our single-cell RNA sequencing analysis identified 4 major monocyte and macrophage clusters, including a monocyte cluster defined by high expression of the Ly6i member of the lymphocyte antigen complex (cluster 11), an “Activated Macrophage” cluster defined by enrichment of interferon-stimulated genes such as Ifit3 and Isg15 (Cluster 14), a “Trem2-hi Macrophage” cluster defined by high expression of Trem2 and C1qa (cluster 12), and an “Inflammatory Macrophage” cluster defined by high expression of Il1b (Cluster 8) (Figure 5A). To understand how Tregs affect these macrophage subpopulations in regressing plaques, we performed differential gene expression and gene ontology enrichment analyses of plaque macrophage subsets from mice at baseline and under regression conditions with IgG or PC61 mAb-treatment. Of the 4 macrophage subsets examined, the presence of Tregs prominently affected the transcriptional profile of activated macrophages (Figure 5B). Compared to baseline, activated macrophages in regressing plaques of IgG-treated mice showed an increase in expression of genes associated with a tissue reparative M2-like macrophage phenotype, including Il4ra, Il10ra, Stat3 and Stat6, genes involved in Jak-Stat signaling (Jak1, Stat1), as well genes involved in efferocytosis (Rac1, Il10ra, Mfge8, Mafb, Fasl) (Figure 5B). By contrast, expression of these genes was reduced in activated macrophages of PC61 mAb-treated mice compared to baseline (Figure 5B). Ingenuity pathway analysis of differentially expressed genes in activated macrophages of progressing and regressing plaques showed increases in Stat3 and Jak1 signaling pathways and decreases in leukotriene, hypoxia and oxidative stress pathways in IgG-treated but not PC61 mAb-treated mice, compared to baseline (Online Figure IV). The inflammatory macrophage population showed decreased expression of genes in the inflammasome-IL-1b pathway (Il1b, Nlrp3, Nlrc4), as well as the M1 marker Cd80 and lncRNA-Malat1, in IgG treated mice compared to baseline, whereas PC61 mAb-treated mice showed an increase in expression of these gene compared to baseline (Figure 5B). In addition, we observed reduced plasma levels of IL-1β in IgG-treated, but not PC61-treated mice compared to baseline mice (Online Figure IV). No differences in plasma tumor necrosis factor (TNF)-α levels were observed in IgG and PC61-treated mice, indicating that plaque Tregs may specifically reduce inflammasome activation of IL-1β maturation (Online Figure IV). Furthermore, the Trem2-hi macrophage cluster showed increased expression of the M2 marker, Aldh1a2 and an increase in efferocytosis genes including Tgfbr1 and Mertk in mice treated with ApoB-ASO and control IgG compared to baseline mice (Figure 5B). Finally, the monocyte cluster showed increased expression of genes involved in mitochondrial oxidative phosphorylation (Ndufa2, Ndufa3, Ndufa12, Ndufs3, Cox5b, Cox7b) and efferocytosis (Bcl3), and decreased expression of genes involved in the immune response (Ccl3, Tlr2) in both regression treatment groups compared to baseline, however these changes were more pronounced in IgG-treated mice compared to PC61-treated mice (Figure 5B). Collectively, transcriptional profiling of myeloid cell subsets revealed Treg-dependent changes in both inflammatory gene pathways and alternative macrophage activation in plaques undergoing regression.
Figure 5. Tregs alter the plaque macrophage transcriptional profile during regression.
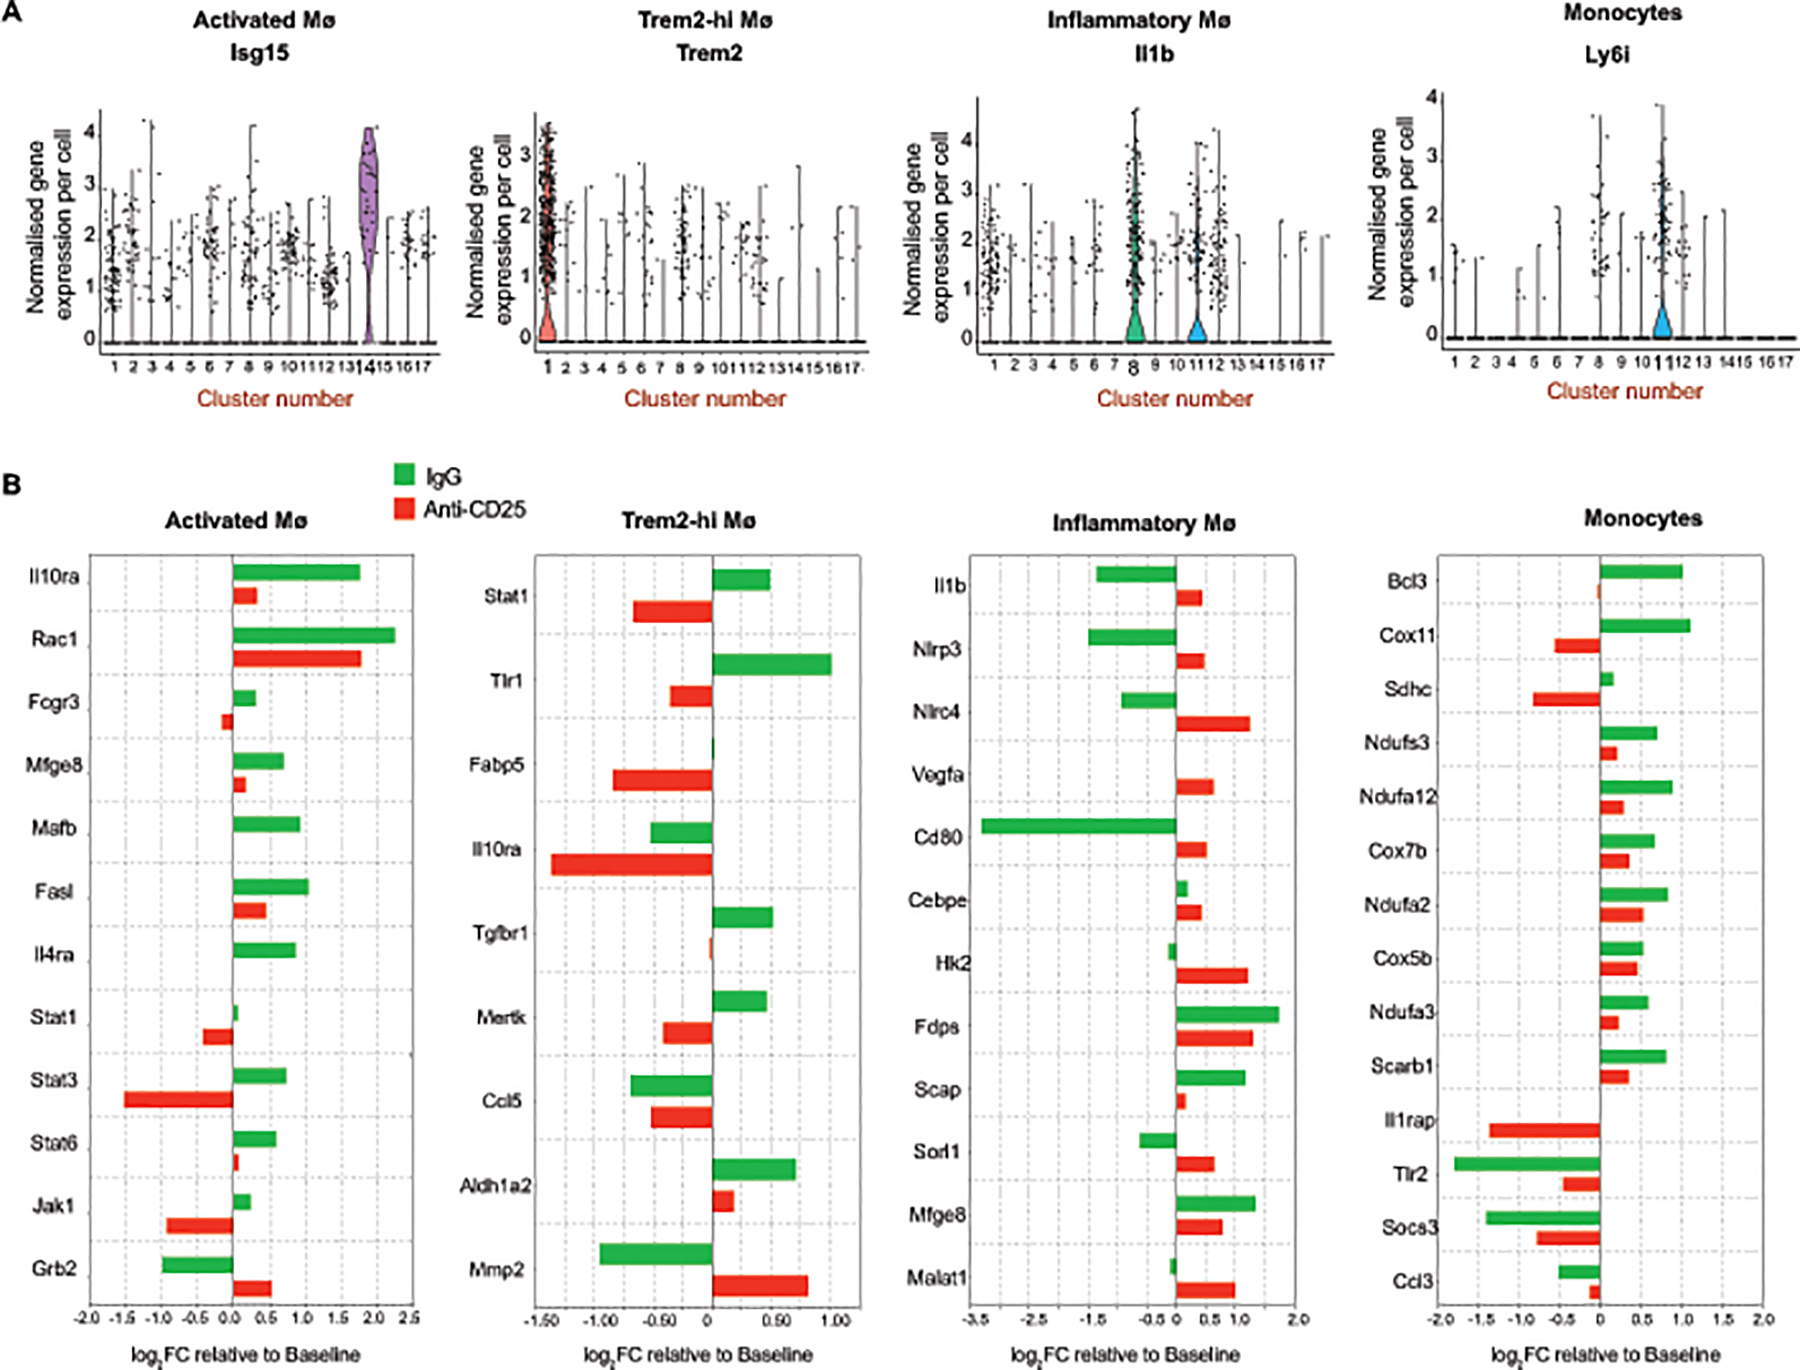
A) Violin plots showing the normalized gene expression per cell of cluster-specific markers for activated macrophages (Isg15), Trem2-hi macrophages (Trem2), inflammatory macrophages (Il1b) and monocytes (Ly6i) monocytes. B) Barplot of genes differentially expressed in monocytes and macrophages of regressing plaques in IgG (green) or anti-CD25 mAb (red) treated mice compared to baseline plaques. Data are from n=4 mice pooled per group.
Treg cells support M2-macrophage enrichment in regressing plaques.
Previous studies from our groups have shown that an enrichment of tissue reparative M2-like macrophages in plaques is a signature of atherosclerosis regression37, 39, 59–61. As Tregs can steer the differentiation of macrophages toward a M2-like state through the elaboration of inflammation-dampening cytokines such as IL-10 and TGF-β, we stained aortic root plaques for markers of M2-like macrophages. Compared to baseline plaques, plaques from IgG-treated mice undergoing regression showed a marked increase in staining for mannose receptor (CD206) and arginase 1 (Figure 6A–B). However, no increase in mannose receptor and arginase 1 staining was found in mice treated with PC61 mAb, indicating that Tregs are required for the enrichment of M2-like macrophages in regressing plaques (Figure 6A–B). As M2-like macrophages promote tissue reparative functions such as efferocytosis, we measured the clearance of apoptotic cells in aortic root plaques by assessing the ratio of Mac2-associated TUNEL+ cells to free TUNEL+ cells. Compared to baseline plaques, we observed a 6-fold increase in efferocytosis in regressing plaques of mice treated with IgG (Figure 6C), which correlated with reduced plaque necrotic area (Figure 6D). By contrast, plaques from mice treated with PC61 mAb under regression conditions showed no change in the ratio of Mac2-associated TUNEL+ cells to free TUNEL+ cells compared to baseline (Figure 6C), indicating that efferocytosis is impaired by Treg depletion. Consistent with defective efferocytosis, the necrotic area in regressing plaques from mice treated with PC61 mAb was similar to baseline plaques (Figure 6D, Online Figure V). Next, we stained plaques for smooth muscle cell alpha-actin to assess fibrous cap thickness, which is a measure of plaque stability in humans. Compared to baseline, we observed an increase in smooth muscle cell alpha actin in the fibrous cap of regressing plaques from IgG-treated but not PC61 mAb-treated mice (Figure 6E). Finally, we stained aortic root plaques for the anti-inflammatory cytokine IL-10 and observed an increase in plaque IL-10 levels in regressing plaques of mice treated with IgG, but not in PC61 mAb treated mice, compared to baseline (Figure 6F). Together, these data indicate that Treg cells are required for beneficial plaque remodeling during atherosclerosis regression, including enrichment of M2-like macrophages, clearance of apoptotic cells, formation of the fibrous cap and production of inflammation-dampening cytokines.
Figure 6. Treg cells support M2-macrophage enrichment, efferocytosis and IL-10 production in regressing plaques.
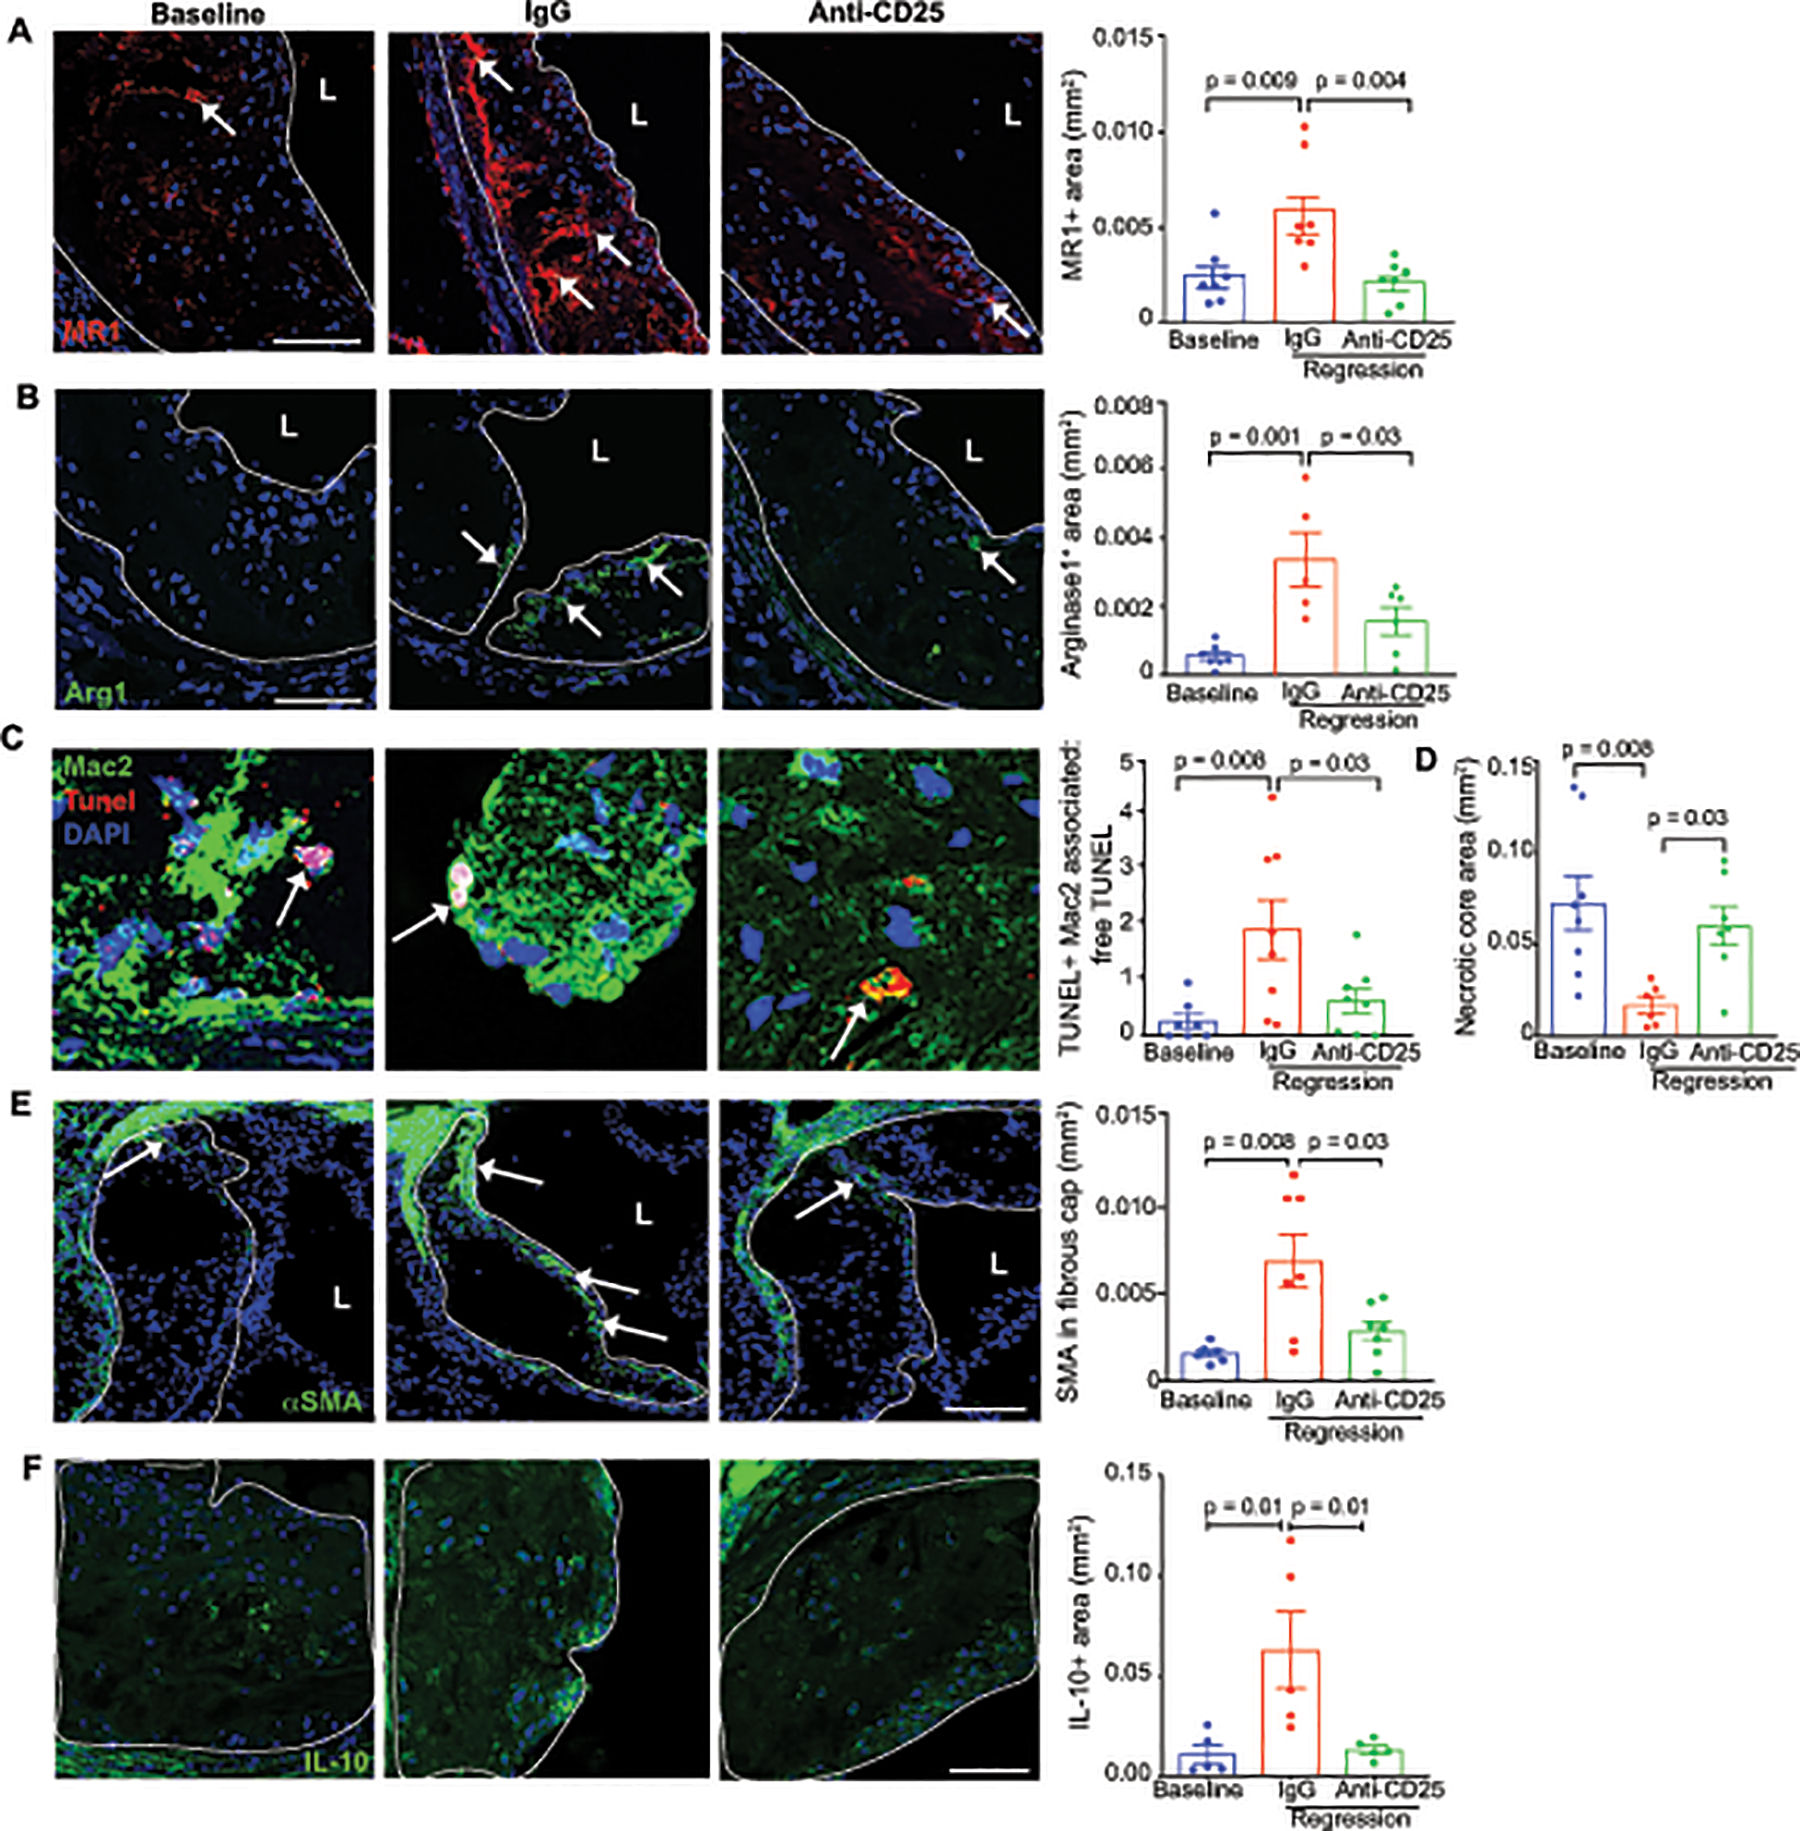
Representative images and quantification of immunofluorescence staining in aortic root plaques from mice at baseline and during regression with IgG or anti-CD25 treatment for: A-B) the M2-like macrophage markers, MR1 (n=7/group) and Arg1 (n=7 baseline, n=5 IgG, n=6 anti-CD25)(arrows indicate positive staining), C) TUNEL and Mac2 to measure macrophage efferocytosis capacity (n=7 baseline, n=9 IgG, n=8 anti-CD25) (arrows indicate apoptotic cell efferocytosis), D) necrotic area (n=8 baseline, n=6 IgG, n=8 anti-CD25), E) smooth muscle cell α-actin (n=6 baseline, n=7 IgG, n=7 anti-CD25) (arrows indicate positive staining), and F) the anti-inflammatory cytokine IL-10 (n=5 mice/group). Scale bars = 100 μm (A, B, D-F); 25 μm (C). Data are mean ±SEM, P values in A-B, D-E were determined by a one-way ANOVA with post-hoc Sidak’s test; C, Kruskal Wallis test.
Treg cells enhance pro-resolving capacity of macrophages in plaques.
It is now recognized that inflammation resolution is an active process stimulated by specialized pro-resolving lipid mediators (SPMs) derived from arachidonic acid (i.e., lipoxins; LX), eicosapentaenoic acid (i.e., E-series resolvins; RvE) and docosahexaenoic acid (i.e., protectins, D-series resolvins; RvD). SPMs can stimulate macrophage pro-resolving activities, including clearance of apoptotic cells and cellular debris, and tissue repair62. As SPMs bind specific receptors on macrophages to activate resolution and tissue repair pathways63, we investigated whether expression of SPM receptors was altered on macrophages in regressing plaques, and whether this was impacted by Treg depletion. Flow cytometric analysis of Gpr18 (RvD2 receptor), Fpr2 (LXA4, RvD1 receptor) and ChemR23 (RvE1, RvE2 receptor) on F4/80+ macrophages in the aortic arch revealed an increase in Gpr18+ and Fpr2+ macrophages in regressing plaques of IgG-treated but not PC61 mAb-treated mice, compared to baseline (Figure 7A). We did not observe a significant change in ChemR23 expression in macrophages of regressing plaques (Figure 7A), however ChemR23 was significantly increased in monocytes in regressing plaques of IgG-treated but not PC61 mAb-treated mice (Online Figure V). To further investigate the role of Tregs in the macrophage response to SPMs, we performed co-culture experiments with bone marrow derived macrophages (BMDM) and naïve T cells isolated from the spleens of wild type mice and maintained in their undifferentiated state or differentiated into Tregs in vitro. Notably, we observed an increase in mRNA and protein expression of Gpr18, Fpr2 and Cmklr1 in BMDMs incubated with Tregs compared to naive T cells (Figure 7B–C), suggesting that Tregs can enhance macrophage response to SPMs. Furthermore, BMDMs co-cultured with Tregs showed increased secretion of Fpr2 ligands, lipoxin A4 (15R-LXA4), resolvin D1 (RvD1) compared to BMDMs cultured with naïve T cells, as measured by liquid chromatography with tandem mass spectrometry (LC-MS/MS; Figure 7D). We also observed an increase in resolvin D6 (RvD6), although the receptor for this mediator is not known. As SPMs can stimulate macrophage efferocytosis, we measured the ability of BMDMs co-cultured with Tregs or naïve T cells to phagocytose apoptotic cells. Consistent with the ability of Tregs to increase both macrophage secretion of and response to SPMs, BMDMs co-cultured with Tregs showed increased clearance of apoptotic cells compared to BMDMs co-cultured with naïve T cells (Figure 7E). Collectively, these data suggest that Treg cells enhance the inflammation resolving capacity of macrophages in plaques during atherosclerosis regression.
Figure 7. Treg cells enhance the pro-resolving capacity of macrophages in plaques.
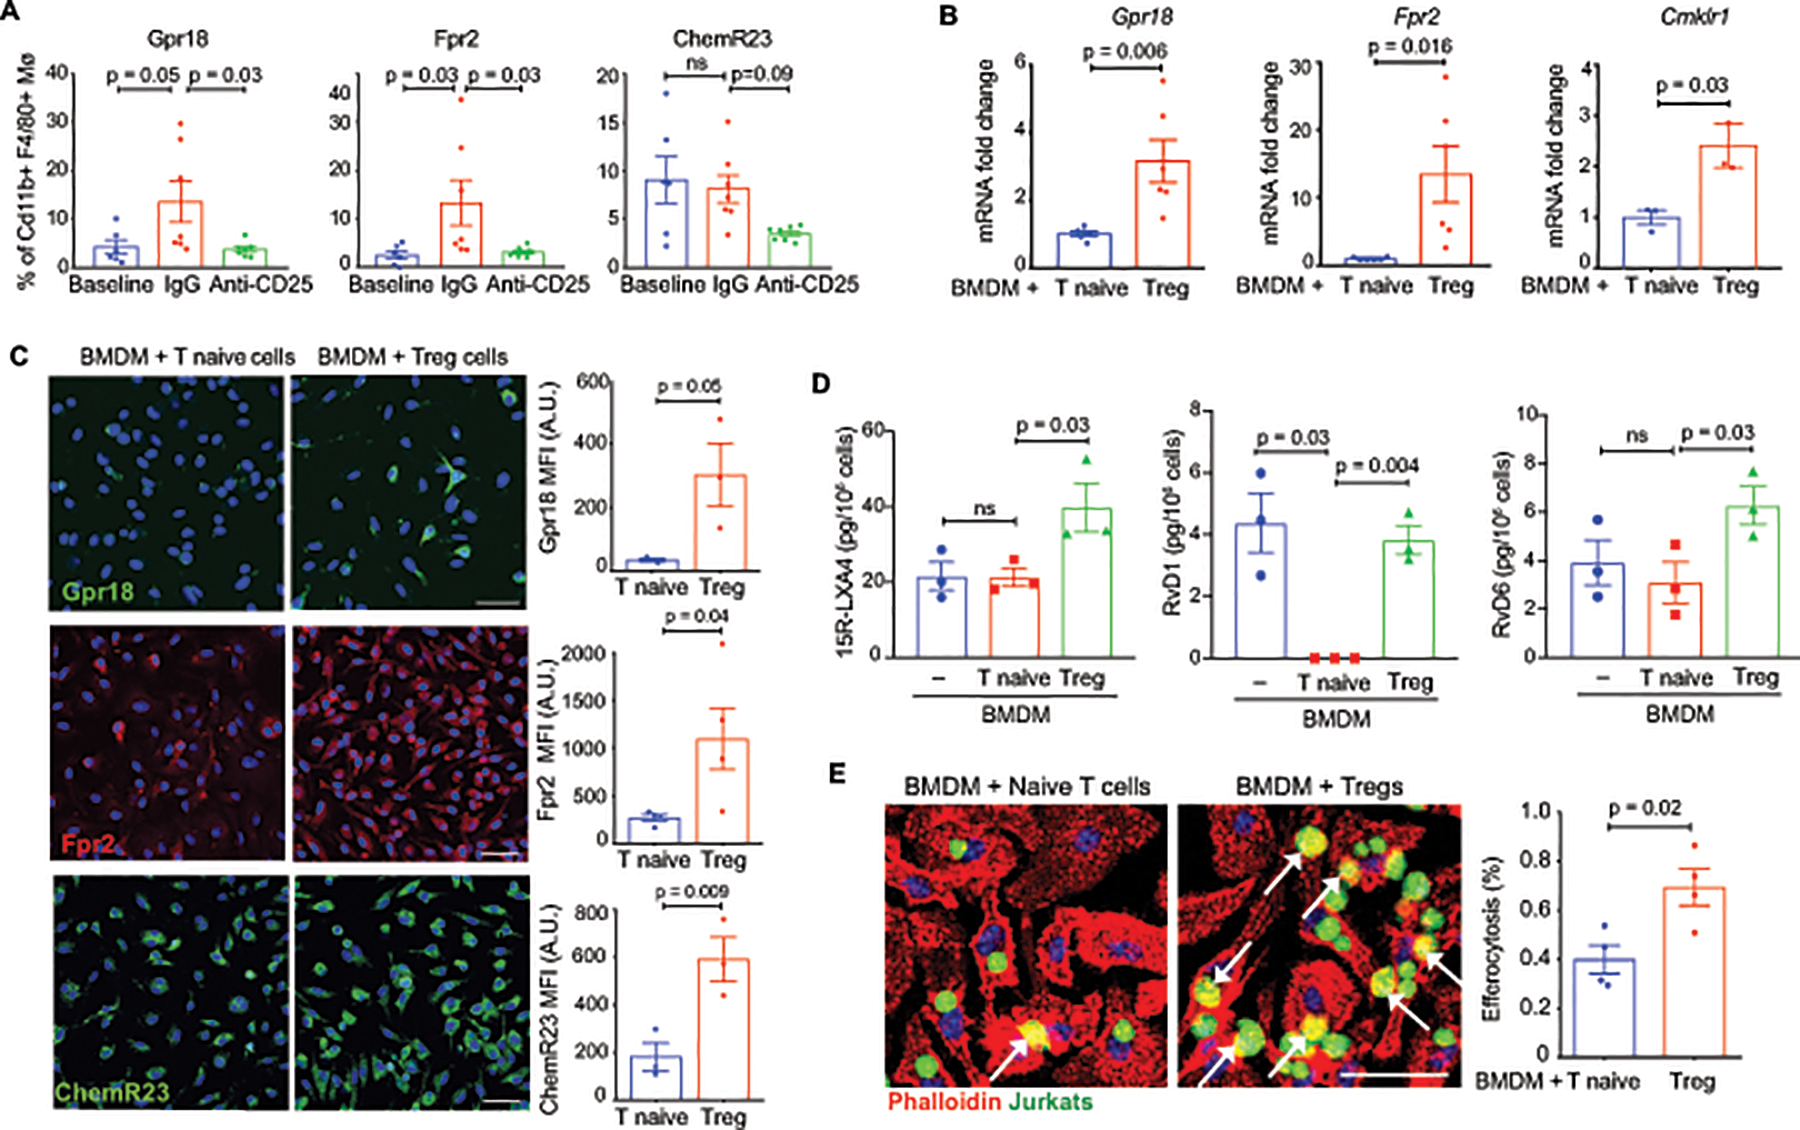
A) Flow cytometric quantification of Gpr18, Fpr2 and ChemR23 expression in macrophages of digested aortic arches of mice at baseline and after regression + IgG or anti-CD25 mAb (n=6 baseline, n=7 IgG and anti-CD25). B) qPCR analysis of receptors for specialized pro-resolving mediators. Data are the mean ±SEM of six (Gpr18, Fpr2) or three (Cmklr1) independent experiments. C) Immunofluorescent staining and quantification for GPR18 (green), FPR2 (red) and CHEMR23 (green) expression in BMDMs (nuclei, blue) co-cultured with naïve T cells or Tregs. Data are the mean ±SEM of 3 (Gpr18, ChemR23) or 4 (Fpr2) independent experiments. D) LC-MS/MS analysis of the specialized pro-resolving lipid mediators 15R-LXA4, RvD1, and RvD6 in BMDMs co-cultured with naïve T cells or Tregs Data are the mean ±SEM of 3 independent experiments. E) Representative images and quantification of BMDMs (red, phalloidin stain) co-cultured with naïve T cells or Tregs and then exposed to apoptotic Jurkat cells (Green, CellTracker™) to assess efferocytosis. Data are the mean ±SEM of four independent experiments. P values were determined by a Student t-test (B, C, E) or one-way ANOVA with post-hoc Sidak’s test (A, D).
DISCUSSION
Our study establishes that Tregs are enriched in plaques during atherosclerosis regression, and are essential for the resolution of atherosclerotic inflammation and contraction of advanced atherosclerotic plaques. Our data suggest that Tregs enable atherosclerosis regression through suppression of ongoing macrophage and T cell pro-inflammatory responses, and re-education of macrophages to a pro-resolving state that facilitates tissue repair and plaque contraction. In the absence of Tregs, atherosclerosis regression does not proceed, despite optimal lipid lowering, and plaques show an inflammatory phenotype similar to that of progressing atherosclerotic plaques. Mechanistic studies revealed that Tregs are required to alter the balance of effector T cells and M1:M2 macrophages in the plaque, promote the clearance of dying cells to reduce plaque necrosis, and stimulate the production of and response to lipid mediators of inflammation resolution. These hallmarks of inflammation resolution and tissue repair are absent from plaques of mice depleted of Tregs during regression of atherosclerosis. Together, these findings identify key pro-resolving functions, licensed by Tregs in regressing plaques that are essential for plaque remodeling and contraction, and support that therapeutic expansion of Tregs, in conjunction with lipid lowering, may hold promise for the treatment of atherosclerotic inflammation and reversal of plaque burden.
Tregs maintain immune homeostasis and tolerance through the release of immunosuppressive cytokines (e.g., IL-10, TGFß), cell-contact dependent mechanisms that suppress pro-inflammatory innate and adaptive immune cell functions, and by promoting tissue repair15. Studies in mouse models have shown that atherosclerosis progression is associated with a marked expansion of interferon (IFN)-γ+ Th1 cells and a progressive decrease in FoxP3+ Tregs in the aorta11, 17–19, 24. Correspondingly, the frequency of FOXP3+ Treg cells is reduced in the circulation of patients with carotid atherosclerosis and acute coronary syndromes, and has been associated with plaque vulnerability21–23, 64. This decrease in Treg numbers has been linked to both altered stability and plasticity of Tregs under proatherosclerotic conditions25, 27, 28, and their decline is thought to contribute to the chronic inflammation in the artery wall that drives plaque progression. Our study now shows that under conditions conducive to atherosclerosis regression in mice, the balance of aortic Treg:Th1 cells can be restored in the plaque and this switch is vital to resolving the maladaptive immune response to hyperlipidemia.
Using three independent strategies to aggressively reduce hypercholesterolemia and induce plaque regression in mice – delivery of apoB ASO, genetic deletion of MTTP, or aortic transplant – we found that enrichment in CD4+FoxP3+ Tregs is a common signature of a resolving plaque. Notably, more moderate reduction of hypercholesterolemia (to ~200 mg/dL) achieved by switching mice from a western to a chow diet for 4 weeks, was insufficient to promote Treg enrichment in the plaque or changes in plaque size. These findings suggest that in mice there is a threshold for cholesterol lowering above which inflammation resolution programs fails to activate. Using atherosclerotic mice treated with apoB-ASO as a model system to investigate the dynamic balance and function of Tregs in regressing plaques, we found that Tregs increased as a proportion of CD4+ T cells by ~2–3 fold in regressing plaques of both the aortic root and ascending aorta, and spleen. Notably, we found that the majority of Tregs in progressing plaques expressed Nrp1, a marker of thymus derived natural Tregs, whereas 80% of Tregs in regressing plaques were Nrp1– suggesting that these Tregs may derive from a local expansion of iTregs from naïve T cells. Previous studies in wild type and atherosclerotic mice have shown that naïve T cells can traffic between the circulation and the vessel wall, and this is regulated in part, by the P-selectin glycosylated ligand-1 receptor65. Naïve T cells take up residence in the intima, media and adventitia, where they can undergo local priming in response to antigenic and non-antigenic stimuli65. Whether Tregs in regressing plaques are indeed iTreg-derived will need to be formally tested in future studies. However, Tregs from regressing plaques showed higher expression of genes involved in TGF-β signaling, as well as mitochondrial electron transport chain respiratory genes such as Atp5g3 and Cox7a2, which may allow Tregs to thrive in low glucose and high lactate conditions of inflammatory foci. Finally, Tregs from regressing plaques also showed increased expression of Mif, which is thought to promote macrophage-Treg interactions during the resolution of chronic inflammation66, 67. By contrast, Tregs from progressing plaques showed higher levels of memory T cell markers such as Itgb1 and Cd28, a transition that has been linked to the reduction of Tregs during atherosclerosis progression27.
Tregs enhance numerous macrophage pro-resolving functions that likely contribute to plaque regression and tissue repair. Previous studies by our groups have shown that regressing plaques are characterized by both a decrease in macrophage burden and a change in macrophage polarization to an M2-like phenotype39, 59, 61, 68. Our study now shows that Tregs are essential for the enrichment of M2-like macrophages in regressing plaques and to license key pro-resolving macrophage functions, including clearance of apoptotic cells, production of specialized pro-resolving lipid mediators (e.g., LXA4, RvD1, RvD6), and upregulation of the receptors that sense these mediators of resolution. Notably, these pro-resolving and tissue reparative functions of macrophages fail to activate in the absence of Tregs in spite of optimal lipid lowering for plaque regression. Treg derived cytokines such as IL-10 and TGF-β can dampen macrophages inflammatory responses, promote alternative activation and increase efferocytosis15, 31, 69, and we find that IL-10 is increased in regressing plaques in a Treg-dependent manner. M2 macrophages can also secrete IL-10 and TGF-β, which may in turn sustain iTregs70, and this mutual interaction may be synergistic in promoting tissue repair in the plaque. Notably, we observe a Treg-dependent increase in efferocytosis and reduction of necrotic core area in regressing plaques, that corresponded with an increase in smooth muscle cells in the fibrous cap, suggesting that Tregs are key participants in enabling tissue reparative functions that promote plaque stability. Consistent with our findings, a recent study of acute inflammation in the peritoneum and lung showed that depletion of Tregs during the resolution phase resulted in defective efferocytosis and blocked return to homeostasis31. During inflammation resolution, Tregs were found to secrete IL-13, which in turn stimulated IL-10 production by macrophages that activated Rac1-dependent apoptotic cell engulfment31. In addition, we observed Treg-dependent increases in macrophage expression of receptors for pro-resolving lipid mediators during atherosclerosis regression, including GPR18, FPR2, and ChemR23. In response to SPMs, these receptors initiate signaling to enhance macrophage phagocytosis of apoptotic cells, reduce pro-inflammatory cytokine production, and increase anti-inflammatory cytokine production71. Using in vitro co-culture studies, we found that Tregs can promote macrophage secretion of 15R-LXA4, RvD1, and RvD6, indicating that Tregs increase both macrophage production and sensing of SPMs. Interestingly, administration of RvD1 promotes plaque stability by enhanced efferocytosis capacity of macrophages in atherosclerotic plaques in both mice and humans72. Moreover, prior studies have shown that SPMs and their receptors (i.e., FPR2) could also regulate T cell functions, including dampening Th1 activation and reciprocal enhancement of Treg functions73. While our study does not identify the source of SPMs in the regressing plaque, macrophages are known sources of SPMs in tissues, which is consistent with our present results with BMDM48.
One limitation of our study is that although the anti-CD25 antibody is quite effective at depleting CD25+FoxP3+ T cells, studies in the cancer field have shown that it may also impact other activated effector CD8+ and CD4+ T cells that can upregulate CD2574. Thus, we cannot exclude the possibility that reduction in other CD25-expressing cells may also contribute to the observed phenotype. An alternative strategy to depleting Tregs during atherosclerosis regression would be to inducibly delete Foxp3 in mice after the establishment of atherosclerosis. However, for reasons that remain unclear, Foxp3–/– mice have elevated plasma levels of cholesterol that may confound the interpretation of such experiments29. Importantly, in the current study we observed no difference in total cholesterol levels in mice treated with anti-CD25 and control antibody. Another limitation of our study is the inherent differences in mouse and human atherosclerosis. Although mouse and human atherosclerotic plaques share many features, including an imbalance in the ratio of Th1:Treg and markers of impaired inflammation resolution, aggressive lipid lowering strategies in humans have to date failed to appreciably regress plaque size as observed in the mouse models used in this study3. However, our data suggest that Treg enrichment in plaques supports pro-resolving macrophage functions, including efferocytosis, IL-10 and SPM secretion and enhanced response to SPMs, that may enable tissue repair and plaque remodeling in humans.
Several potential strategies to expand Treg levels in humans are currently being investigated including administration of IL-2 complex30, 32, 75 and tolerogenic administration of atherosclerotic antigens33–36. Treg cells show a lower threshold response to IL-2 stimulation compared to T effector cells, and low dose IL-2 has been used successfully in graft-versus-host disease and hepatitis C virus-induced vasculitis to selectively expand Tregs and reduce inflammation76–78. Treg expansion with IL-2 complex has been shown to reduce atherosclerosis progression in hyperlipidemic mouse model30, 32, and a phase I/II clinical trial of low dose recombinant IL-2 (Aldesleukin, Novartis) is currently underway in patients with stable ischemic heart disease and acute coronary syndromes75. Completion of this trial will provide insight into the feasibility of this approach to rebalance the immune response in coronary artery disease, in conjunction with lipid lowering therapies. Our study in mice supports further investigation into strategies to enhance Treg numbers and functions in atherosclerotic plaques as a mechanism for promoting tissue repair and inflammation resolution, with the ultimate goal of regressing the burden of atherosclerosis.
Supplementary Material
NOVELTY AND SIGNIFICANCE.
What Is Known?
Atherosclerosis regression – the shrinkage and remodeling of arterial plaques – is an important clinical goal to reduce the burden of cardiovascular disease.
Regulatory T cells (Tregs) dampen inflammation and promote tissue repair by releasing immunosuppressive factors and through interactions with other immune cells.
Low circulating levels of Tregs are associated with increased risk of heart attack in humans, and studies in mouse models have shown that Treg numbers decline in plaques as atherosclerosis progresses.
Strategies that expand Treg populations in the plaque may be viable treatment of atherosclerosis, but whether Treg numbers change in the course of atherosclerosis regression, and how they contribute to plaque contraction and the resolution of atherosclerotic inflammation are not currently known.
What New Information Does This Article Contribute?
A common feature of atherosclerosis regression, identified from multiple mouse models, is the enrichment of Treg cells in the regressing plaque.
Under conditions permissive for atherosclerosis regression (e.g., aggressive lipid lowering) in mice, blocking the enrichment of Tregs blocks plaque contraction and inflammation resolution in the artery wall.
Key features of inflammation resolution in the plaque that require Tregs include the accumulation of alternatively activated macrophages, production of pro-resolving lipid mediators and the increased expression of their receptors by macrophages, clearance of apoptotic cells, reduction of necrotic area, and formation of a thick fibrous cap.
SOURCES OF FUNDING
This work was supported by grants from the NIH [R01HL084312 to KJM, EAF, PL; R35HL135799 to KJM; P01HL131481 to KJM and EAF; P01HL131478 to KJM and EAF; P01GM095467 to MSpite; R01HL106173 to MSpite; F32HL136044 to BES; T32HL098129 to CvS], the Department of Defense [12019098 to EAF and PL], and the American Heart Association [19POST34380010 to MS; 18POST34080390 to AW; 14POST20180018 to CvS].
Nonstandard Abbreviations and Acronyms:
- AAV
adeno-associated virus
- ApoB
apolipoprotein B
- ASO
anti-sense oligonucleotide
- BMDM
bone marrow derived macrophage
- HDL
high density lipoprotein
- IGF-1
insulin-like growth factor
- IL
interleukin
- ILC
innate lymphoid cell
- IFN
interferon
- LC-MS/MS
liquid chromatography with tandem mass spectrometry
- LDL
low density lipoprotein
- LDLR
low density lipoprotein receptor
- LX
lipoxin
- M1
classically activated
- M2
alternatively activated
- mAb
monoclonal antibody
- NK
natural killer
- PCSK9
Proprotein convertase subtilisin/kexin type 9
- PTEN
phosphatase and tensin homolog
- Rv
resolvin
- REVERSA
genetic model of atherosclerosis regression (Ldlr–/–ApoB100/100MTTPfl/flMx1Cre+)
- SPM
specialized pro-resolving lipid mediators
- TGFb
transforming growth factor beta
- Th
T helper cell
- TNF
tumor necrosis factor
- Treg
regulatory T cell
- iTreg
inducible Treg
- TUNEL
terminal deoxynucleotidyl transferase dUTP nick end labeling
- VLDL
very low density lipoprotein
- WD
western diet
Footnotes
DISCLOSURES
None.
REFERENCES
- 1.Benjamin EJ, Virani SS, Callaway CW, Chamberlain AM, Chang AR, Cheng S, Chiuve SE, Cushman M, Delling FN, Deo R, et al. Heart disease and stroke statistics-2018 update: A report from the american heart association. Circulation. 2018;137:e67–e492 [DOI] [PubMed] [Google Scholar]
- 2.Kwan AC, Aronis KN, Sandfort V, Blumenthal RS, Bluemke DA. Bridging the gap for lipid lowering therapy: Plaque regression, coronary computed tomographic angiography, and imaging-guided personalized medicine. Expert Rev Cardiovasc Ther. 2017;15:547–558 [DOI] [PMC free article] [PubMed] [Google Scholar]
- 3.Williams KJ, Feig JE, Fisher EA. Rapid regression of atherosclerosis: Insights from the clinical and experimental literature. Nat Clin Pract Cardiovasc Med. 2008;5:91–102 [DOI] [PubMed] [Google Scholar]
- 4.Blankstein R, Libby P, Bhatt DL. Arterial inflammation: The heat before the storm. J Am Coll Cardiol. 2019;73:1383–1385 [DOI] [PubMed] [Google Scholar]
- 5.Libby P, Everett BM. Novel antiatherosclerotic therapies. Arterioscler Thromb Vasc Biol. 2019;39:538–545 [DOI] [PMC free article] [PubMed] [Google Scholar]
- 6.Witztum JL, Lichtman AH. The influence of innate and adaptive immune responses on atherosclerosis. Annu Rev Pathol. 2014;9:73–102 [DOI] [PMC free article] [PubMed] [Google Scholar]
- 7.Moore KJ, Sheedy FJ, Fisher EA. Macrophages in atherosclerosis: A dynamic balance. Nat Rev Immunol. 2013;13:709–721 [DOI] [PMC free article] [PubMed] [Google Scholar]
- 8.Buono C, Binder CJ, Stavrakis G, Witztum JL, Glimcher LH, Lichtman AH. T-bet deficiency reduces atherosclerosis and alters plaque antigen-specific immune responses. Proc Natl Acad Sci U S A. 2005;102:1596–1601 [DOI] [PMC free article] [PubMed] [Google Scholar]
- 9.Buono C, Come CE, Stavrakis G, Maguire GF, Connelly PW, Lichtman AH. Influence of interferon-gamma on the extent and phenotype of diet-induced atherosclerosis in the ldlr-deficient mouse. Arterioscler Thromb Vasc Biol. 2003;23:454–460 [DOI] [PubMed] [Google Scholar]
- 10.Whitman SC, Ravisankar P, Elam H, Daugherty A. Exogenous interferon-gamma enhances atherosclerosis in apolipoprotein e−/− mice. Am J Pathol. 2000;157:1819–1824 [DOI] [PMC free article] [PubMed] [Google Scholar]
- 11.Daugherty A, Rateri DL. T lymphocytes in atherosclerosis: The yin-yang of th1 and th2 influence on lesion formation. Circ Res. 2002;90:1039–1040 [DOI] [PubMed] [Google Scholar]
- 12.Taleb S, Tedgui A, Mallat Z. Il-17 and th17 cells in atherosclerosis: Subtle and contextual roles. Arterioscler Thromb Vasc Biol. 2015;35:258–264 [DOI] [PubMed] [Google Scholar]
- 13.Ait-Oufella H, Salomon BL, Potteaux S, Robertson AK, Gourdy P, Zoll J, Merval R, Esposito B, Cohen JL, Fisson S, et al. Natural regulatory t cells control the development of atherosclerosis in mice. Nat Med. 2006;12:178–180 [DOI] [PubMed] [Google Scholar]
- 14.Foks AC, Lichtman AH, Kuiper J. Treating atherosclerosis with regulatory t cells. Arterioscler Thromb Vasc Biol. 2015;35:280–287 [DOI] [PMC free article] [PubMed] [Google Scholar]
- 15.Spitz C, Winkels H, Burger C, Weber C, Lutgens E, Hansson GK, Gerdes N. Regulatory t cells in atherosclerosis: Critical immune regulatory function and therapeutic potential. Cell Mol Life Sci. 2016;73:901–922 [DOI] [PMC free article] [PubMed] [Google Scholar]
- 16.von Boehmer H Mechanisms of suppression by suppressor t cells. Nat Immunol. 2005;6:338–344 [DOI] [PubMed] [Google Scholar]
- 17.Mor A, Planer D, Luboshits G, Afek A, Metzger S, Chajek-Shaul T, Keren G, George J. Role of naturally occurring cd4+ cd25+ regulatory t cells in experimental atherosclerosis. Arterioscler Thromb Vasc Biol. 2007;27:893–900 [DOI] [PubMed] [Google Scholar]
- 18.Rohm I, Atiskova Y, Drobnik S, Fritzenwanger M, Kretzschmar D, Pistulli R, Zanow J, Kronert T, Mall G, Figulla HR, Yilmaz A. Decreased regulatory t cells in vulnerable atherosclerotic lesions: Imbalance between pro- and anti-inflammatory cells in atherosclerosis. Mediators Inflamm. 2015;2015:364710. [DOI] [PMC free article] [PubMed] [Google Scholar]
- 19.Heller EA, Liu E, Tager AM, Yuan Q, Lin AY, Ahluwalia N, Jones K, Koehn SL, Lok VM, Aikawa E, et al. Chemokine cxcl10 promotes atherogenesis by modulating the local balance of effector and regulatory t cells. Circulation. 2006;113:2301–2312 [DOI] [PubMed] [Google Scholar]
- 20.Kitagawa Y, Sakaguchi S. Molecular control of regulatory t cell development and function. Curr Opin Immunol. 2017;49:64–70 [DOI] [PubMed] [Google Scholar]
- 21.Mor A, Luboshits G, Planer D, Keren G, George J. Altered status of cd4(+)cd25(+) regulatory t cells in patients with acute coronary syndromes. Eur Heart J. 2006;27:2530–2537 [DOI] [PubMed] [Google Scholar]
- 22.Dietel B, Cicha I, Voskens CJ, Verhoeven E, Achenbach S, Garlichs CD. Decreased numbers of regulatory t cells are associated with human atherosclerotic lesion vulnerability and inversely correlate with infiltrated mature dendritic cells. Atherosclerosis. 2013;230:92–99 [DOI] [PubMed] [Google Scholar]
- 23.George J, Schwartzenberg S, Medvedovsky D, Jonas M, Charach G, Afek A, Shamiss A. Regulatory t cells and il-10 levels are reduced in patients with vulnerable coronary plaques. Atherosclerosis. 2012;222:519–523 [DOI] [PubMed] [Google Scholar]
- 24.Maganto-Garcia E, Tarrio ML, Grabie N, Bu DX, Lichtman AH. Dynamic changes in regulatory t cells are linked to levels of diet-induced hypercholesterolemia. Circulation. 2011;124:185–195 [DOI] [PMC free article] [PubMed] [Google Scholar]
- 25.Jia L, Zhu L, Wang JZ, Wang XJ, Chen JZ, Song L, Wu YJ, Sun K, Yuan ZY, Hui R. Methylation of foxp3 in regulatory t cells is related to the severity of coronary artery disease. Atherosclerosis. 2013;228:346–352 [DOI] [PubMed] [Google Scholar]
- 26.Zhang WC, Wang J, Shu YW, Tang TT, Zhu ZF, Xia N, Nie SF, Liu J, Zhou SF, Li JJ,et al. Impaired thymic export and increased apoptosis account for regulatory t cell defects in patients with non-st segment elevation acute coronary syndrome. J Biol Chem. 2012;287:34157–34166 [DOI] [PMC free article] [PubMed] [Google Scholar]
- 27.Gaddis DE, Padgett LE, Wu R, McSkimming C, Romines V, Taylor AM, McNamara CA, Kronenberg M, Crotty S, Thomas MJ, et al. Apolipoprotein ai prevents regulatory to follicular helper t cell switching during atherosclerosis. Nat Commun. 2018;9:1095. [DOI] [PMC free article] [PubMed] [Google Scholar]
- 28.Butcher MJ, Filipowicz AR, Waseem TC, McGary CM, Crow KJ, Magilnick N, Boldin M, Lundberg PS, Galkina EV. Atherosclerosis-driven treg plasticity results in formation of a dysfunctional subset of plastic ifngamma+ th1/tregs. Circ Res. 2016;119:1190–1203 [DOI] [PMC free article] [PubMed] [Google Scholar]
- 29.Klingenberg R, Gerdes N, Badeau RM, Gistera A, Strodthoff D, Ketelhuth DF, Lundberg AM, Rudling M, Nilsson SK, Olivecrona G, et al. Depletion of foxp3+ regulatory t cells promotes hypercholesterolemia and atherosclerosis. J Clin Invest. 2013;123:1323–1334 [DOI] [PMC free article] [PubMed] [Google Scholar]
- 30.Foks AC, Frodermann V, ter Borg M, Habets KL, Bot I, Zhao Y, van Eck M, van Berkel TJ, Kuiper J, van Puijvelde GH. Differential effects of regulatory t cells on the initiation and regression of atherosclerosis. Atherosclerosis. 2011;218:53–60 [DOI] [PubMed] [Google Scholar]
- 31.Proto JD, Doran AC, Gusarova G, Yurdagul A Jr., Sozen E, Subramanian M, Islam MN, Rymond CC, Du J, Hook J, et al. Regulatory t cells promote macrophage efferocytosis during inflammation resolution. Immunity. 2018;49:666–677 e666 [DOI] [PMC free article] [PubMed] [Google Scholar]
- 32.Dinh TN, Kyaw TS, Kanellakis P, To K, Tipping P, Toh BH, Bobik A, Agrotis A. Cytokine therapy with interleukin-2/anti-interleukin-2 monoclonal antibody complexes expands cd4+cd25+foxp3+ regulatory t cells and attenuates development and progression of atherosclerosis. Circulation. 2012;126:1256–1266 [DOI] [PubMed] [Google Scholar]
- 33.Fredrikson GN, Soderberg I, Lindholm M, Dimayuga P, Chyu KY, Shah PK, Nilsson J. Inhibition of atherosclerosis in apoe-null mice by immunization with apob-100 peptide sequences. Arterioscler Thromb Vasc Biol. 2003;23:879–884 [DOI] [PubMed] [Google Scholar]
- 34.Herbin O, Ait-Oufella H, Yu W, Fredrikson GN, Aubier B, Perez N, Barateau V, Nilsson J, Tedgui A, Mallat Z. Regulatory t-cell response to apolipoprotein b100-derived peptides reduces the development and progression of atherosclerosis in mice. Arterioscler Thromb Vasc Biol. 2012;32:605–612 [DOI] [PubMed] [Google Scholar]
- 35.van Puijvelde GH, Hauer AD, de Vos P, van den Heuvel R, van Herwijnen MJ, van der Zee R, van Eden W, van Berkel TJ, Kuiper J. Induction of oral tolerance to oxidized low-density lipoprotein ameliorates atherosclerosis. Circulation. 2006;114:1968–1976 [DOI] [PubMed] [Google Scholar]
- 36.Kimura T, Kobiyama K, Winkels H, Tse K, Miller J, Vassallo M, Wolf D, Ryden C, Orecchioni M, Dileepan T, et al. Regulatory cd4(+) t cells recognize major histocompatibility complex class ii molecule-restricted peptide epitopes of apolipoprotein b. Circulation. 2018;138:1130–1143 [DOI] [PMC free article] [PubMed] [Google Scholar]
- 37.Ouimet M, Ediriweera HN, Gundra UM, Sheedy FJ, Ramkhelawon B, Hutchison SB, Rinehold K, van Solingen C, Fullerton MD, Cecchini K, et al. Microrna-33-dependent regulation of macrophage metabolism directs immune cell polarization in atherosclerosis. J Clin Invest. 2015;125:4334–4348 [DOI] [PMC free article] [PubMed] [Google Scholar]
- 38.Feig JE, Pineda-Torra I, Sanson M, Bradley MN, Vengrenyuk Y, Bogunovic D, Gautier EL, Rubinstein D, Hong C, Liu J, et al. Lxr promotes the maximal egress of monocyte-derived cells from mouse aortic plaques during atherosclerosis regression. J Clin Invest. 2010;120:4415–4424 [DOI] [PMC free article] [PubMed] [Google Scholar]
- 39.Feig JE, Rong JX, Shamir R, Sanson M, Vengrenyuk Y, Liu J, Rayner K, Moore K, Garabedian M, Fisher EA. Hdl promotes rapid atherosclerosis regression in mice and alters inflammatory properties of plaque monocyte-derived cells. Proc Natl Acad Sci U S A. 2011;108:7166–7171 [DOI] [PMC free article] [PubMed] [Google Scholar]
- 40.Ramkhelawon B, Hennessy EJ, Menager M, Ray TD, Sheedy FJ, Hutchison S, Wanschel A, Oldebeken S, Geoffrion M, Spiro W, et al. Netrin-1 promotes adipose tissue macrophage retention and insulin resistance in obesity. Nat Med. 2014;20:377–384 [DOI] [PMC free article] [PubMed] [Google Scholar]
- 41.van Gils JM, Derby MC, Fernandes LR, Ramkhelawon B, Ray TD, Rayner KJ, Parathath S, Distel E, Feig JL, Alvarez-Leite JI, et al. The neuroimmune guidance cue netrin-1 promotes atherosclerosis by inhibiting the emigration of macrophages from plaques. Nat Immunol. 2012;13:136–143 [DOI] [PMC free article] [PubMed] [Google Scholar]
- 42.Tacke F, Alvarez D, Kaplan TJ, Jakubzick C, Spanbroek R, Llodra J, Garin A, Liu J, Mack M, van Rooijen N, et al. Monocyte subsets differentially employ ccr2, ccr5, and cx3cr1 to accumulate within atherosclerotic plaques. The Journal of clinical investigation. 2007;117:185–194 [DOI] [PMC free article] [PubMed] [Google Scholar]
- 43.Lin JD, Nishi H, Poles J, Niu X, McCauley C, Rahman K, Brown EJ, Yeung ST, Vozhilla N, Weinstock A, et al. Single-cell analysis of fate-mapped macrophages reveals heterogeneity, including stem-like properties, during atherosclerosis progression and regression. JCI Insight. 2019;4. [DOI] [PMC free article] [PubMed] [Google Scholar]
- 44.Butler A, Hoffman P, Smibert P, Papalexi E, Satija R. Integrating single-cell transcriptomic data across different conditions, technologies, and species. Nat Biotechnol. 2018;36:411–420 [DOI] [PMC free article] [PubMed] [Google Scholar]
- 45.Aran D, Looney AP, Liu L, Wu E, Fong V, Hsu A, Chak S, Naikawadi RP, Wolters PJ, Abate AR, et al. Reference-based analysis of lung single-cell sequencing reveals a transitional profibrotic macrophage. Nature Immunology. 2019;20:163–172 [DOI] [PMC free article] [PubMed] [Google Scholar]
- 46.Yu G, Wang LG, Han Y, He QY. Clusterprofiler: An r package for comparing biological themes among gene clusters. OMICS. 2012;16:284–287 [DOI] [PMC free article] [PubMed] [Google Scholar]
- 47.Weischenfeldt J, Porse B. Bone marrow-derived macrophages (bmm): Isolation and applications. CSH Protoc. 2008;2008:pdb prot5080 [DOI] [PubMed] [Google Scholar]
- 48.Giannakis N, Sansbury BE, Patsalos A, Hays TT, Riley CO, Han X, Spite M, Nagy L. Dynamic changes to lipid mediators support transitions among macrophage subtypes during muscle regeneration. Nat Immunol. 2019;20:626–636 [DOI] [PMC free article] [PubMed] [Google Scholar]
- 49.Feig JE, Parathath S, Rong JX, Mick SL, Vengrenyuk Y, Grauer L, Young SG, Fisher EA. Reversal of hyperlipidemia with a genetic switch favorably affects the content and inflammatory state of macrophages in atherosclerotic plaques. Circulation. 2011;123:989–998 [DOI] [PMC free article] [PubMed] [Google Scholar]
- 50.Chereshnev E, SabinaOmerhodzic, VitaliiItskovich, Juan-GilbertoAguinaldo, Zahi A Fayad, Edward A Fisher, Ernane D Reis.. Mouse model of heterotopic aortic arch transplantation. Journal of Surgical Research. 2003;111:171–176 [DOI] [PubMed] [Google Scholar]
- 51.Yadav M, Louvet C, Davini D, Gardner JM, Martinez-Llordella M, Bailey-Bucktrout S, Anthony BA, Sverdrup FM, Head R, Kuster DJ, et al. Neuropilin-1 distinguishes natural and inducible regulatory t cells among regulatory t cell subsets in vivo. J Exp Med. 2012;209:1713–1722, S1711–1719 [DOI] [PMC free article] [PubMed] [Google Scholar]
- 52.Vaeth M, Schliesser U, Muller G, Reissig S, Satoh K, Tuettenberg A, Jonuleit H, Waisman A, Muller MR, Serfling E, et al. Dependence on nuclear factor of activated t-cells (nfat) levels discriminates conventional t cells from foxp3+ regulatory t cells. Proc Natl Acad Sci U S A. 2012;109:16258–16263 [DOI] [PMC free article] [PubMed] [Google Scholar]
- 53.Oomizu S, Arikawa T, Niki T, Kadowaki T, Ueno M, Nishi N, Yamauchi A, Hattori T, Masaki T, Hirashima M. Cell surface galectin-9 expressing th cells regulate th17 and foxp3+ treg development by galectin-9 secretion. PLoS One. 2012;7:e48574. [DOI] [PMC free article] [PubMed] [Google Scholar]
- 54.Zhang Z, Zhang W, Guo J, Gu Q, Zhu X, Zhou X. Activation and functional specialization of regulatory t cells lead to the generation of foxp3 instability. J Immunol. 2017;198:2612–2625 [DOI] [PubMed] [Google Scholar]
- 55.Aran D, Looney AP, Liu L, Wu E, Fong V, Hsu A, Chak S, Naikawadi RP, Wolters PJ, Abate AR, et al. Reference-based analysis of lung single-cell sequencing reveals a transitional profibrotic macrophage. Nat Immunol. 2019;20:163–172 [DOI] [PMC free article] [PubMed] [Google Scholar]
- 56.Cochain C, Vafadarnejad E, Arampatzi P, Pelisek J, Winkels H, Ley K, Wolf D, Saliba AE, Zernecke A. Single-cell rna-seq reveals the transcriptional landscape and heterogeneity of aortic macrophages in murine atherosclerosis. Circ Res. 2018;122:1661–1674 [DOI] [PubMed] [Google Scholar]
- 57.Winkels H, Ehinger E, Vassallo M, Buscher K, Dinh HQ, Kobiyama K, Hamers AAJ, Cochain C, Vafadarnejad E, Saliba AE, et al. Atlas of the immune cell repertoire in mouse atherosclerosis defined by single-cell rna-sequencing and mass cytometry. Circ Res. 2018;122:1675–1688 [DOI] [PMC free article] [PubMed] [Google Scholar]
- 58.Weinstock A, Fisher EA. Methods to study monocyte and macrophage trafficking in atherosclerosis progression and resolution. Methods Mol Biol. 2019;1951:153–165 [DOI] [PMC free article] [PubMed] [Google Scholar]
- 59.Feig JE, Vengrenyuk Y, Reiser V, Wu C, Statnikov A, Aliferis CF, Garabedian MJ, Fisher EA, Puig O. Regression of atherosclerosis is characterized by broad changes in the plaque macrophage transcriptome. PLoS One. 2012;7:e39790. [DOI] [PMC free article] [PubMed] [Google Scholar]
- 60.Hewing B, Parathath S, Mai CK, Fiel MI, Guo L, Fisher EA. Rapid regression of atherosclerosis with mtp inhibitor treatment. Atherosclerosis. 2013;227:125–129 [DOI] [PMC free article] [PubMed] [Google Scholar]
- 61.Rahman K, Vengrenyuk Y, Ramsey SA, Vila NR, Girgis NM, Liu J, Gusarova V, Gromada J, Weinstock A, Moore KJ, et al. Inflammatory ly6chi monocytes and their conversion to m2 macrophages drive atherosclerosis regression. J Clin Invest. 2017;127:2904–2915 [DOI] [PMC free article] [PubMed] [Google Scholar]
- 62.Serhan CN, Levy BD. Resolvins in inflammation: Emergence of the pro-resolving superfamily of mediators. J Clin Invest. 2018;128:2657–2669 [DOI] [PMC free article] [PubMed] [Google Scholar]
- 63.Chiang N, Serhan CN. Structural elucidation and physiologic functions of specialized pro-resolving mediators and their receptors. Mol Aspects Med. 2017;58:114–129 [DOI] [PMC free article] [PubMed] [Google Scholar]
- 64.Wigren M, Bjorkbacka H, Andersson L, Ljungcrantz I, Fredrikson GN, Persson M, Bryngelsson C, Hedblad B, Nilsson J. Low levels of circulating cd4+foxp3+ t cells are associated with an increased risk for development of myocardial infarction but not for stroke. Arterioscler Thromb Vasc Biol. 2012;32:2000–2004 [DOI] [PubMed] [Google Scholar]
- 65.MacRitchie N, Grassia G, Noonan J, Cole JE, Hughes CE, Schroeder J, Benson RA, Cochain C, Zernecke A, Guzik TJ, et al. The aorta can act as a site of naive cd4+ t cell priming. Cardiovasc Res. 2019 [DOI] [PubMed] [Google Scholar]
- 66.Choi S, Kim HR, Leng L, Kang I, Jorgensen WL, Cho CS, Bucala R, Kim WU. Role of macrophage migration inhibitory factor in the regulatory t cell response of tumor-bearing mice. J Immunol. 2012;189:3905–3913 [DOI] [PMC free article] [PubMed] [Google Scholar]
- 67.Korf H, Breser L, Van Hoeck J, Godoy J, Cook DP, Stijlemans B, De Smidt E, Moyson C, Monteiro Carvalho Mori Cunha JP, Rivero V, et al. Mif inhibition interferes with the inflammatory and t cell-stimulatory capacity of nod macrophages and delays autoimmune diabetes onset. PLoS One. 2017;12:e0187455. [DOI] [PMC free article] [PubMed] [Google Scholar]
- 68.Rayner KJ, Sheedy FJ, Esau CC, Hussain FN, Temel RE, Parathath S, van Gils JM, Rayner AJ, Chang AN, Suarez Y, et al. Antagonism of mir-33 in mice promotes reverse cholesterol transport and regression of atherosclerosis. J Clin Invest. 2011;121:2921–2931 [DOI] [PMC free article] [PubMed] [Google Scholar]
- 69.Tiemessen MM, Jagger AL, Evans HG, van Herwijnen MJ, John S, Taams LS. Cd4+cd25+foxp3+ regulatory t cells induce alternative activation of human monocytes/macrophages. Proc Natl Acad Sci U S A. 2007;104:19446–19451 [DOI] [PMC free article] [PubMed] [Google Scholar]
- 70.Schmidt A, Zhang XM, Joshi RN, Iqbal S, Wahlund C, Gabrielsson S, Harris RA, Tegner J. Human macrophages induce cd4(+)foxp3(+) regulatory t cells via binding and re-release of tgf-beta. Immunol Cell Biol. 2016;94:747–762 [DOI] [PubMed] [Google Scholar]
- 71.Serhan CN, Chiang N. Resolution phase lipid mediators of inflammation: Agonists of resolution. Curr Opin Pharmacol. 2013;13:632–640 [DOI] [PMC free article] [PubMed] [Google Scholar]
- 72.Fredman G, Hellmann J, Proto JD, Kuriakose G, Colas RA, Dorweiler B, Connolly ES, Solomon R, Jones DM, Heyer EJ, et al. An imbalance between specialized pro-resolving lipid mediators and pro-inflammatory leukotrienes promotes instability of atherosclerotic plaques. Nature Communications. 2016;7. [DOI] [PMC free article] [PubMed] [Google Scholar]
- 73.Chiurchiu V, Leuti A, Dalli J, Jacobsson A, Battistini L, Maccarrone M, Serhan CN. Proresolving lipid mediators resolvin d1, resolvin d2, and maresin 1 are critical in modulating t cell responses. Sci Transl Med. 2016;8:353ra111. [DOI] [PMC free article] [PubMed] [Google Scholar]
- 74.Onizuka S, Tawara I, Shimizu J, Sakaguchi S, Fujita T, Nakayama E. Tumor rejection by in vivo administration of anti-cd25 (interleukin-2 receptor alpha) monoclonal antibody. Cancer Res. 1999;59:3128–3133 [PubMed] [Google Scholar]
- 75.Zhao TX, Kostapanos M, Griffiths C, Arbon EL, Hubsch A, Kaloyirou F, Helmy J, Hoole SP, Rudd JHF, Wood G, et al. Low-dose interleukin-2 in patients with stable ischaemic heart disease and acute coronary syndromes (lilacs): Protocol and study rationale for a randomised, double-blind, placebo-controlled, phase i/ii clinical trial. BMJ Open. 2018;8:e022452. [DOI] [PMC free article] [PubMed] [Google Scholar]
- 76.Koreth J, Matsuoka K, Kim HT, McDonough SM, Bindra B, Alyea EP 3rd, Armand P, Cutler C, Ho VT, Treister NS, et al. Interleukin-2 and regulatory t cells in graft-versus-host disease. N Engl J Med. 2011;365:2055–2066 [DOI] [PMC free article] [PubMed] [Google Scholar]
- 77.Matsuoka K, Koreth J, Kim HT, Bascug G, McDonough S, Kawano Y, Murase K, Cutler C, Ho VT, Alyea EP, et al. Low-dose interleukin-2 therapy restores regulatory t cell homeostasis in patients with chronic graft-versus-host disease. Sci Transl Med. 2013;5:179ra143. [DOI] [PMC free article] [PubMed] [Google Scholar]
- 78.Saadoun D, Rosenzwajg M, Joly F, Six A, Carrat F, Thibault V, Sene D, Cacoub P, Klatzmann D. Regulatory t-cell responses to low-dose interleukin-2 in hcv-induced vasculitis. N Engl J Med. 2011;365:2067–2077 [DOI] [PubMed] [Google Scholar]
Associated Data
This section collects any data citations, data availability statements, or supplementary materials included in this article.