Abstract
The Dynameomics project contains native state and unfolding simulations of 807 protein domains, where each domain is representative of a different metafold; these metafolds encompass ~97% of protein fold space. There is a long-standing question in structural biology as to whether proteins in the same fold family share the same folding/unfolding characteristics. Using molecular dynamics simulations from the Dynameomics project, we conducted a detailed study of protein unfolding/folding pathways for 5 protein domains from the immunoglobulin (Ig)-like β-sandwich metafold (the highest ranked metafold in our database). The domains have sequence similarities ranging from 4 to 15% and are all from different SCOP superfamilies, yet they share the same overall Ig-like topology. Despite having very different amino acid sequences, the dominant unfolding pathway is very similar for the 5 proteins, and the secondary structures that are peripheral to the aligned, shared core domain add variability to the unfolding pathway. Aligned residues in the core domain display consensus structure in the transition state primarily through conservation of hydrophobic positions. Commonalities in the obligate folding nucleus indicate that insights into the major events in the folding/unfolding of other domains from this metafold may be obtainable from unfolding simulations of a few representative proteins.
Keywords: conserved folding pathways, metafold, molecular dynamics simulations, protein homology
Introduction
A long-held tenet in structural biology is that the amino acid sequence of a protein uniquely determines its structure and function, yet as more and more structures are amassed, it has become clear that multiple sequences can give rise to the same structure. Furthermore, the same structure can give rise to different functions. The basis for this is that nature reuses protein folds and the current climate of increased protein structure determination; the discovery of unique folds is becoming rare (Towse and Daggett, 2012). In fact, there has not been a unique structure deposited in the Protein Data Bank (Berman et al., 2000) since 2008. Given the many-to-one relationship between sequence and structure and the one-to-many relationship between structure and function, questions arise as to the fundamental mechanisms of how these proteins fold. Is the pathway of folding conserved within a given fold family? Or is the pathway within a fold family dependent on amino acid sequence? What is the role of conserved residues versus variable residues in directing folding/unfolding? Molecular dynamics (MD) simulations of protein folding/unfolding can provide atomistic details to help answer these questions, and past studies have shown that such high-temperature protein unfolding simulations obey microscopic reversibility such that the unfolding pathway is the reverse of folding (Day and Daggett, 2007; McCully et al., 2008) and that the overall pathway is independent of temperature (Day et al., 2002).
As part of our Dynameomics project (Beck et al., 2008; van der Kamp et al., 2010), we conducted systematic simulations of representatives of essentially all protein folds. Using 3 common domain dictionaries, namely SCOP (Structural Classification of Proteins (Murzin et al., 1995)), Class, Architecture, Topology, Homology (Orengo et al., 1997), and the Dali Domain Dictionary (Dietmann et al., 2001), we created a consensus domain dictionary (CDD) based on agreement of at least 2 of the 3 protein domain dictionary assignments (Day et al., 2003; Schaeffer et al., 2011). Consensus domains were determined by a pairwise comparison between the aforementioned domain dictionaries of residue ranges within the same chain. The consensus domains were filtered for sequence similarity and then clustered into a set of topologies or metafolds. The metafolds were then ranked in order of population. A representative domain was chosen from each metafold resulting in 807 structurally autonomous protein domains that were amenable to simulation [a more in depth discussion of the generation of the CDD, and the selection of representative domains can be found in Day et al. (2003) and Schaeffer et al. (2011)]. The 807 metafolds represent 81% of the domains in our CDD and 97% of the known autonomous protein folds. For our latest CDD release set, the highest ranked metafold was the immunoglobulin (Ig)-like β-sandwich domains. This metafold had a population of 1279 non-redundant domains, the next highest ranked metafold was the Flavodoxin-like fold with 836 non-redundant domains (Schaeffer et al., 2011).
The Ig-like β-sandwich metafold
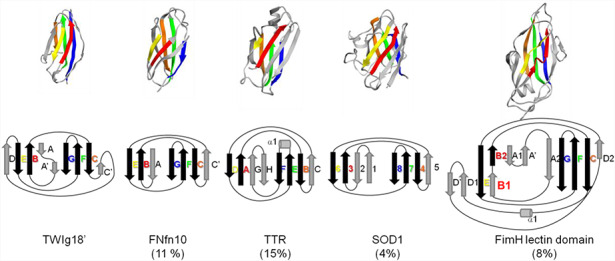
A fundamental hypothesis of the Dynameomics project is that the behavior of the chosen representative of a metafold is truly representative of the various members of that fold. Here, we test this hypothesis by comparing 5 proteins that are structurally similar representatives of the Rank1 Ig-like β-sandwich metafold. Domains from this metafold cover a wide range of functions, including muscle proteins, cell adhesion proteins, antibodies, and enzymes. Although these proteins are all part of the same metafold in our CDD, they all belong to different SCOP superfamilies (Table IA). Structural and topological details of these proteins are described in Table IB. The first protein is the 18th immunoglobulin domain of twitchin (TWIg18') from Caenorhabditis elegans; it is the Rank 1 metafold representative for Dynameomics, and it contains 93 residues. TWIg18' is part of the immunoglobulin superfamily, and it is involved in regulation of muscle contraction. Next is the 10th type III cell adhesion module of human fibronectin (FNfn10). FNfn10 is part of the fibronectin type III superfamily. The third protein is transthyretin (TTR), which is a carrier of thyroxin and is implicated in systemic amyloidosis, and has been studied previously in our lab (Armen et al., 2004). TTR is a homo-tetramer, but here we are focusing on the monomeric form since we are interested in the unfolding/folding pathway of single domains from this fold family. TTR is part of the transthyretin superfamily. The next protein is Cu–Zn superoxide dismutase 1 (SOD1), which has been implicated in and has also been studied by our lab previously (Schmidlin et al., 2009, 2013). SOD1 is part of the Cu–Zn superoxide dismutase-like superfamily. The final protein is the FimH lectin domain (FimH) from Escherichia coli. FimH is part of the bacterial adhesins superfamily. These 5 proteins span 91–158 residues, and they contain a conserved fold indicated by the black arrows in the topology diagrams in Fig. 1. The sequence identities, relative to our metafold representative Twitchin, range from 4 to 15% (Table I). This set of proteins represents a good model system for investigating sequence and the effects of the structural context on protein dynamics and unfolding within a fold family, as we have both primary and tertiary structures variability. Nevertheless, a consensus core domain is evident by aligning the proteins against twitchin, and the strands are labeled from I to V with peripheral strands retaining their original strand names (Table I).
Table IA. Ig-like domains used in this study.
| PDB codes | SCOP superfamily | No. Res | Organism | Name | Abbreviation | Sequence similarity (%) |
|---|---|---|---|---|---|---|
| 1wit | Immunoglobulin | 93 | Caenorhabditis elegans | Twitchin 18th igsf module | TwIg18' | — |
| 1fna | Fibronectin III | 91 | Homo sapiens | Fibronectin cell-adhesion module type III-10 | FNfn10 | 11 |
| 1bm7 | TTR | 113 | H. sapiens | Transthyretin | TTR | 15 |
| 1hl5 | Cu–Zn superoxide dismutase-like | 153 | H. sapiens | Superoxide dismutase | SOD1 | 4 |
| 1uwf | Bacterial adhesins | 158 | Escherichia coli | FimH adhesin | FimH | 8 |
Table IB. Structures and topologies of the proteins used in this study.
|
|
TWIg18′ (PDB code: 1wit) (18), FNfn10 (PDB code: 1fna) (19), TTR (PDB code: 1bm7) (20), SOD1 (PDB code: 1hl5) (21), and FimH (PDB code:1uwf) (22). (Color coding of β-strands that align with strand code I to V are maintained throughout the article and shown in black in the topology diagram.)
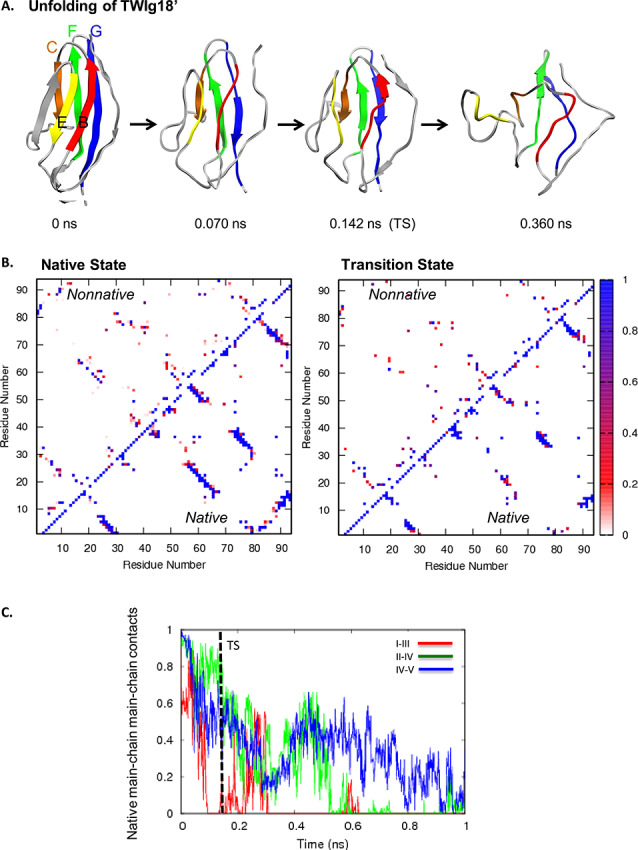
Fig. 1. (A) Unfolding pathway of TWIg18’. Strands colored as follows: I in red, II in orange, III in yellow, IV in green, and V in blue. (B) Contact maps show the fraction of time residues were in contact with non-native contacts (above the diagonal) or with native contacts (below). Contacts are colored from white through red and purple to blue, where white indicates that the residues were never in contact and blue those that were in contact 100% of the time. (C) Native mainchain–mainchain atom contacts between strands I and III (red), strands II and IV (green), and strands IV and V (blue). Results are provided for Simulation 1.
The relationship between topology and folding pathways has been studied both theoretically and experimentally (Zarrine-Afsar et al., 2005). Previous experimental studies of the folding kinetics and stabilities of 6 proteins from the Ig-like β-sandwich metafold by Clarke et al. (1999) indicated that proteins with a common core but from different superfamilies share common features during folding. In a follow-up study, Clarke and co-workers used Φ-value analysis to map the transition state of folding of the 27th Ig domain from the I band of human cardiac titin (TI I27), another Ig-like domain (Fowler and Clarke, 2001). Interestingly, the residues involved in the folding nucleus of TI I27 are structurally equivalent to those residues involved in the folding nucleus of TNfn3. We build on their studies by performing MD to further characterize the dynamic behavior of different Ig-like domains at high resolution and bring in other proteins in this metafold that contain “extra” structure around the consensus core sandwich structure including 2 proteins involved in human amyloid disease to see if they follow the pattern established by Clarke and co-workers.
Here, we employ MD simulations to compare and contrast the unfolding pathways of 5 Ig-like β-sandwich domains with variations in their primary and tertiary structures while retaining the consensus fold. We find that although peripheral segments of secondary structure can cause variations in the unfolding pathways, the unfolding mechanisms are very similar despite the sequence variability.
Methods
MD simulations
Simulations were performed using the in lucem molecular mechanics package (ilmm) (Beck et al., 2000–2019) and the protein and water potential functions of Levitt et al. (1995, 1997). One 298 K (native state) simulation and at least five 498 K unfolding simulations were performed using the previously described Dynameomics protocol (Beck et al., 2008; van der Kamp et al., 2010). The proteins simulated for this study were TWIg18′ (PDB code: 1wit) (Fong et al., 1996); FNfn10 (PDB code: 1fna) (Dickinson et al., 1994); TTR (PDB code: 1bm7) (Peterson et al., 1998); SOD1 (PDB code: 1hl5) (Strange et al., 2003); and FimH (PDB code:1uwf) (Bouckaert et al., 2005). Simulations were carried out using the microcanonical ensemble (NVE, constant number of particles, volume, and energy) and periodic boundary conditions. Each protein underwent 1000 steps of steepest decent minimization and was then solvated in a box of water with the appropriate experimental density of 0.997 g/ml for 298 K (Kell, 1967) and 0.829 g/ml for 498 K (Haar et al., 1984). The water and protein were equilibrated by 500 steps of minimization of the water, followed by 1 ps of dynamics of just the water molecules. Finally, 500 steps of energy minimization of the water and 500 steps of minimization of the protein atoms were performed. All minimization and MD calculations were unrestrained. A 2 fs time step was used in each simulation, and other details regarding the simulations have been presented (Beck and Daggett, 2004). The 298 K simulations and at least 2 of the 498 K simulations were at least 51 ns in duration and allow for a detailed exploration of the denatured state. Note that it was recently shown that the software, potential function, and MD protocols employed here provide improved conformational sampling compared with other common packages (Childers and Daggett, 2018). The additional 3–5 unfolding simulations were short (at least 2 ns each) to further sample the early events of unfolding in more detail. Structures were saved every 1 ps for analysis for the longer simulations except for the first 2 ns, where they were saved every 0.2 ps. For the shorter (2–5 ns) 498 K simulations, the structures were saved every 0.2 ps. There were 36 simulations in total covering 920 ns of simulation.
Transition state identification
Transition state (TS) ensembles were identified from the unfolding simulations using a conformational clustering method (Li and Daggett, 1994, 1996). The Cα RMSD was calculated between each pair of structures in a given simulation. Multidimensional scaling was then used to reduce the matrix to a 3D representation to identify clusters of similar structures. The TS ensemble was assigned as the 5 ps window of structures before the exit from the native-like cluster for each simulation.
To quantify the degree of structure in the MD-generated TS structures, S-values were calculated (Daggett et al., 1996). S-values are a semi-quantitative way to map the extent of structure along a protein chain for an ensemble of structures. It is defined as the product of 2 terms, S3° and S2° for each residue. S3° is the ratio of the number of contacts present in the TS ensemble to the number of contacts in the native state. S2° is the fraction of native secondary structure present in the TS.
Results and Discussion
The unfolding of each of the 5 Ig-like fold proteins from the MD simulations is described in turn, and then the unfolding pathways are compared. For all unfolding simulations of a specific protein, there were some slight variations in the unfolding pathways; however in all instances, except for TTR, there was a preferred pathway observed (where a similar pathway is shown in greater than half the simulations of a particular protein). In the immediately following unfolding pathway descriptions, we focus on the dominant pathways. To facilitate later comparisons between proteins, we refer to consensus strands by roman numerals and non-consensus strands by the standard labels used for the protein in question (see Table IC).
Table IC. β-Strand nomenclature of Ig-like domains used in this study.
| Strand codes | TWIg18' | FNfn10 | TTR | SOD1 | FimH |
|---|---|---|---|---|---|
| I | B | B | A | 3 | B1/2 |
| II | C | C | B | 4 | C |
| III | E | E | D | 6 | E |
| IV | F | F | E | 7 | F |
| V | G | G | F | 8 | G |
Color coding of β-strands that align with strand codes I to V are maintained throughout the article.
TWIg18′
Figure 1A shows the dominant unfolding pathway of TWIg18′. Of the central strands, the main chain contacts between strands I and III on the front sheet were lost first, but side chain contacts were maintained with the opposite sheet in the core through the TS (Fig. 1B). The front sheet (strands I and III) unfolded before the back sheet (strands V, IV, and II). The peripheral strands (those colored in gray in Table IA) typically lost structure before the TS. Residues in the middle of the central strands had the most tertiary contacts across the sheets. The main chain contacts between the IV and V strands consistently persisted the longest across all 8 unfolding simulations of TWIg18′ (Fig. 1C). Electrostatic side chain interactions between the IV and V strands persisted long into the denatured state.
FNfn10
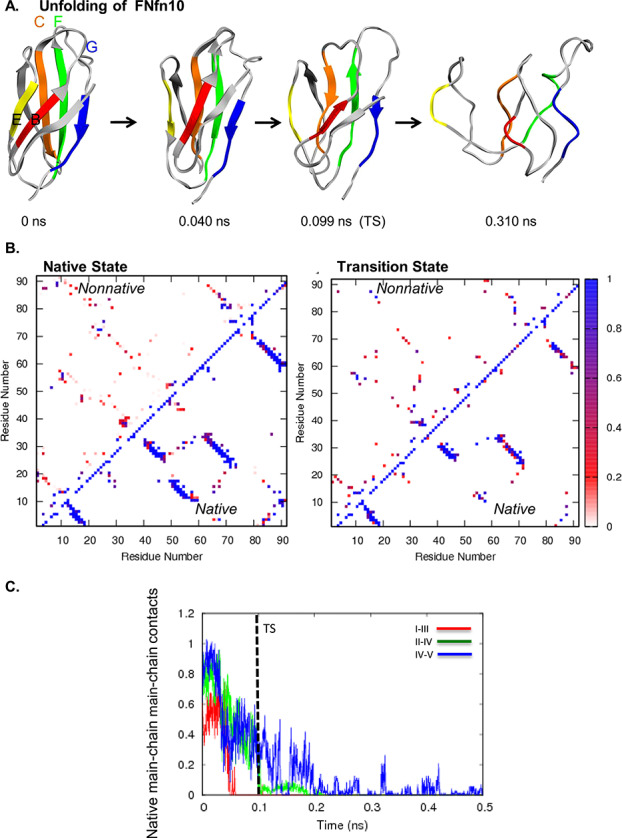
Figure 2A shows the dominant unfolding pathway of FNfn10. Strand III separated from strand I, losing all native main chain–main chain contacts before the TS (Fig. 2B). The hairpin end of strands A and I pulled away from the opposite sheet, and then strands A and I unfolded independently of the back sheet. In some simulations, strands A and IB on the front sheet unfolded after the strands on the back sheet (Fig. 2C). In the dominant pathway, central strands II, IV, and V maintained contacts through the TS. The contacts between strand II and the peripheral strand C′ were the longest lived in the majority of simulations. In the TS, strands A and B had the highest Cα RMSD from the native state structure, excluding the loop regions. The hairpin turn of strands A and I pulled away from the opposite sheet. Strand III remained packed against strands II and C′ on the opposite sheet. Of the central strands on the back sheet, strands II and IV were more structured than strand V.
Fig. 2. (A) Unfolding pathway of FNfn10. Strands colored as follows: I in red, II in orange, III in yellow, IV in green, and V in blue. (B) Contact maps show the fraction of time residues were in contact with non-native contacts (above the diagonal) or with native contacts (below). Contacts are colored from white through red and purple to blue, where white indicates that the residues were never in contact and blue those that were in contact 100% of the time. (C) Native mainchain–mainchain atom contacts between strands I and III (red), strands II and IV (green), and strands IV and V (blue). Results are provided for Simulation 1.
TTR
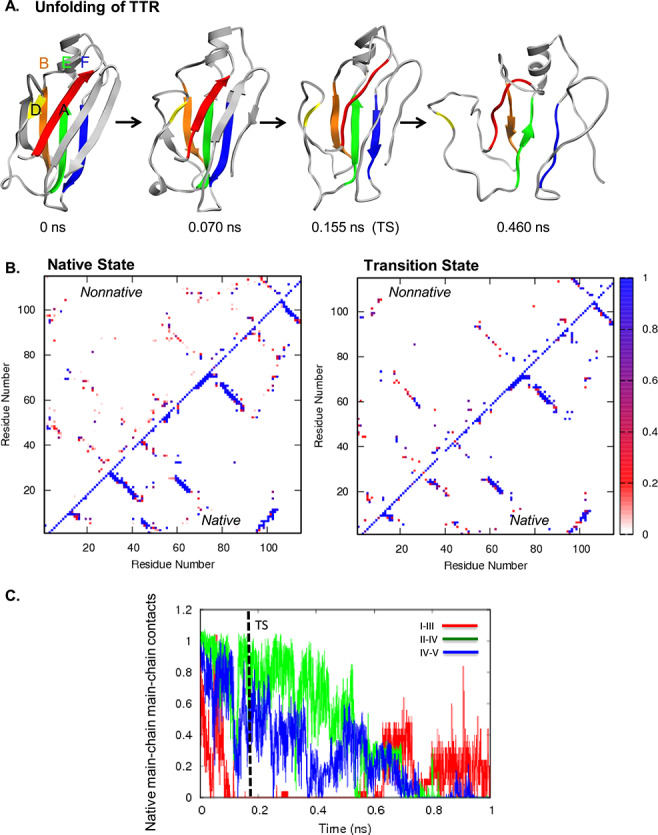
The order of unfolding events was less consistent for TTR than the previous systems. Figure 3A shows the unfolding pathway from a simulation, in which all structures in the front sheet were lost by the TS (run 4). In this simulation, the main chain–main chain contacts between strands I and III were lost early (Fig. 3B), but the contacts persisted until after the TS in 2 of 5 runs. The back sheet was generally more structured. Because the side chain contacts between strands I and III were fairly stable, the main chain contacts often reformed at later points in the runs. Main chain contacts between strands II and IV usually lasted longer than main chain contacts between IV and V (Figure 3C). The C-terminal strands G and H on the front sheet showed the greatest variation across the 5 runs and follow no consistent pattern. TTR is different from the other proteins in that the back sheet does not terminate the protein structure, in TTR the structure extends via a loop to form 2 further β-strands with the front sheet. The H strand is important in presenting 1 of the 2 dimer interfaces. The other dimer interface is on the loop between the I and II strands.
Fig. 3. (A) Unfolding pathway of TTR. Strands colored as follows: I in red, II in orange, III in yellow, IV in green, and V in blue. (B) Contact maps show the fraction of time residues were in contact with non-native contacts (above the diagonal) or with native contacts (below). Contacts are colored from white through red and purple to blue, where white indicates that the residues were never in contact and blue those that were in contact 100% of the time. (C) Native mainchain–mainchain atom contacts between strands I and III (red), strands II and IV (green), and strands IV and V (blue). Results are provided for Simulation 1.
SOD1
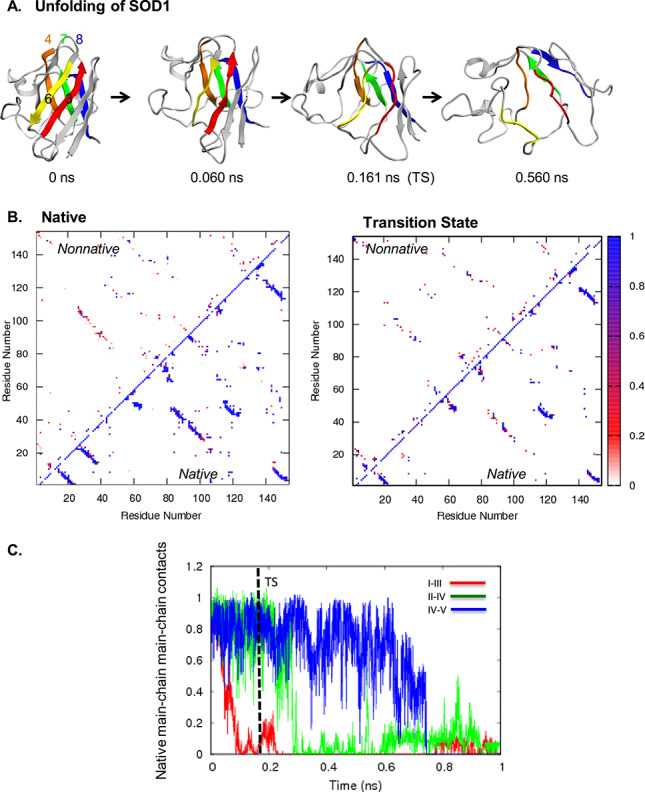
The dominant unfolding pathway of SOD1 is shown in Fig. 4A. On the front sheet, the strands I and III lost main chain contacts early. Strand III was one of the first strands to lose secondary structure. With the exception of strand β1, which had fairly stable hydrogen bonds with strand V, most structure in the front sheet was lost by the transition state (Fig. 4B). Except for β1, the back sheet was more structured than the front sheet. Contacts between strands II and IV were lost after the TS. Structure in the strands IV and V was the longest lasting (Fig. 4C). In the TS, packing between the sheets was more compact on the side by β1, IV, and V. Conversely, the other side of the protein, with strands β5 and III was very unstructured.
Fig. 4. (A) Unfolding pathway of SOD1. Strands colored as follows: I in red, II in orange, III in yellow, IV in green, and V in blue. (B) Contact maps show the fraction of time residues were in contact with non-native contacts (above the diagonal) or with native contacts (below). Contacts are colored from white through red and purple to blue, where white indicates that the residues were never in contact and blue those that were in contact 100% of the time. (C) Native mainchain–mainchain atom contacts between strands I and III (red), strands II and IV (green), and strands IV and V (blue). Results are provided for Simulation 1.
FimH lectin domain
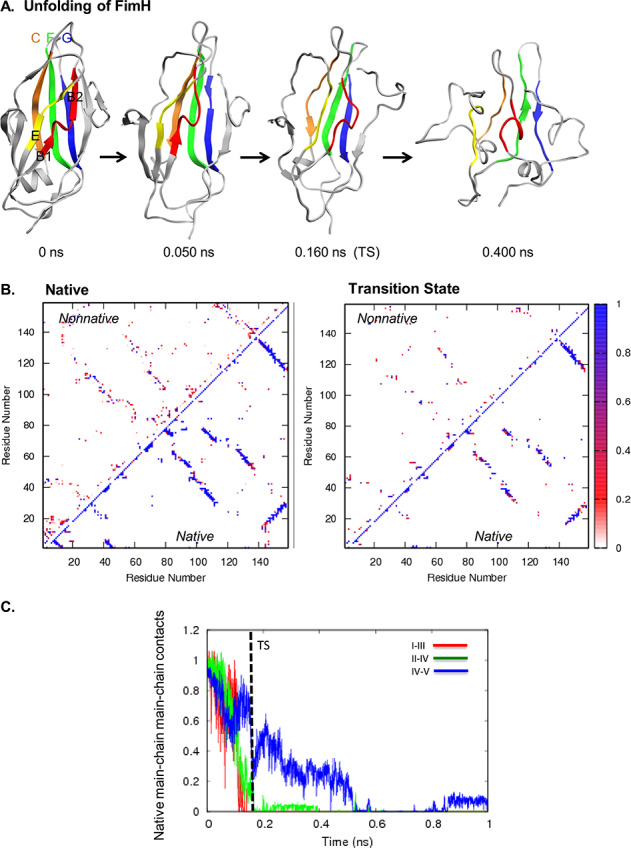
The unfolding pathway of FimH is shown in Fig. 5A. While the peripheral strands and loops in FimH showed the greatest variation between runs, the short peripheral strands A1, A′, and D2 always lost structure first. The back sheet was more structured than the front sheet in the transition state. In the transition state, peripheral strands shifted away from the core, and the side chains on strands B1, I, and III remained in contact with the side chains on the back sheet strands II, IV, and V (Fig. 5B). Following the TS, the II and IV strands lost the rest of their main chain contacts. The contacts between the IV and V strands, which were stabilized by a salt bridge, persisted the longest (Fig. 5C).
Fig. 5. (A) Unfolding pathway of FimH. Strands colored as follows: I in red, II in orange, II in yellow, IV in green, and V in blue. (B) Contact maps show the fraction of time residues were in contact with non-native contacts (above the diagonal) or with native contacts (below). Contacts are colored from white through red and purple to blue, where white indicates that the residues were never in contact and blue those that were in contact 100% of the time. (C) Native mainchain–mainchain atom contacts between strands I and III (red), strands II and IV (green), and strands IV and V (blue). Results are provided for Simulation 1.
Comparison of unfolding pathways
In these 5 Ig-like β-sandwich domains, the central back sheet strands (II, IV, and V) remained more structured throughout the unfolding process than the front sheet. In TWIg18′, strands IV and V were particularly stable due to the persistence of a native salt bridge network. In FNfn10, strand II was consistently most stable. In TTR, the central strands on the back sheet (II, IV, and V) were more stable than the front sheet in 3 of 5 runs, but in 1 run, the peripheral strands G and H retained structure the longest during unfolding. In SOD1, strands IV and V were very stable, but unlike the other proteins, V formed stable hydrogen bonds with strand β1 on the front sheet. In FimH, strands IV and V, which are the longest strands at 19 and 15 residues long, respectively, maintained their contacts the longest. Another commonality among the domains, except for FimH, was the early unfolding of strand III. This strand usually was the first central strand to lose structure, and it deviated from its native position by the transition state. In FimH, strand II was stable, with the end of the C-terminus maintaining its contacts with either strand D1 or B1.
Transition states across different Ig-like proteins
Figure 6 shows representative TS structures of all 5 domains with the consensus strands colored by average S-value, reflecting the extent of native secondary and tertiary structures in the transition state ensemble. In general, the structures in the TS ensembles obtained were partially structured (S ≥ 0.3) with native-like topology in agreement with experimental findings on other Ig-like protein domains. Residues with S-values below 0.2 were considered unstructured in the TS. Each protein also contained a small number of residues with high S-values (S ≥ 0.6). Note that in the comparisons below, β-strands are referred to by the consensus nomenclature using roman numerals, while non-consensus strands are referred to by their common labels in the literature (Table IA).
Fig. 6. Average S-values of central β-strands in the transition state in (A) TWIg18′, (B) FNfn10, (C) TTR, (D) SOD, (E) FimH. Front sheet is shown on the left, and the back sheet is shown on the right. Backbone of central β-strands colored by average S-value, red for S-values <0.3, magenta for S-values ≥0.3 and <0.6, and blue for S-values ≥ 0.6.
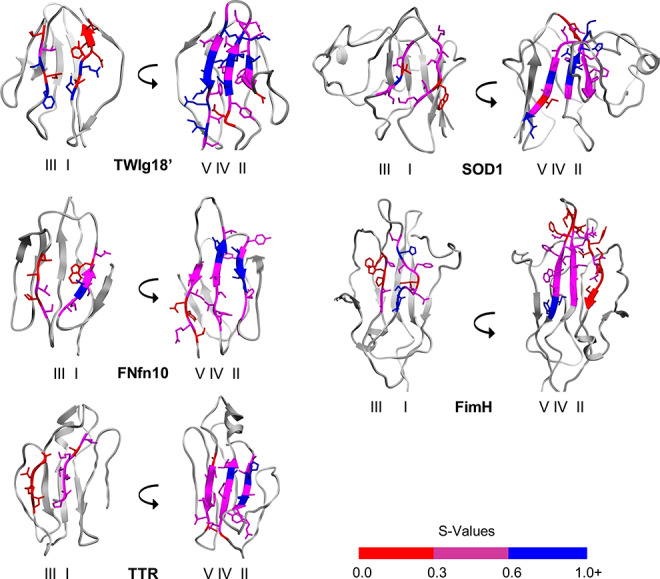
In TWIg18′ and SOD1, the highest concentration of high S-values were located on strands IV and V. The TS had more core contacts on the side of the domain with strands I, IV, and V. However, the peripheral strand D on the opposite side of TWIg18′ had high S-values, and although strand D had little secondary structure, it maintained its tertiary contacts with strands IV and V. FimH had the highest S-values on strands B1, IV, and V. Unlike FNfn10 and TTR, S-values of strand II in the FimH transition state were relatively low, with all being <0.4. The FimH TS ensemble was more similar to that of TWIg18′ and SOD1 by virtue of having a more compact core around strands IV and V. The B1 strand and short helix turn between B1 and strand I was more structured. In FNfn10 and TTR, the highest S-values were located on strands II and IV. Both strands I and III formed contacts with the opposite sheet. In TTR, strand III tended to form more contacts with the peripheral strand C than the central strands II and IV on the opposite sheet.
Using structural alignment to compare S-values
The S-values for each structure were compared for transition states across structures using the structural alignments against TWIg18'. This procedure enabled us to evaluate whether there was any conservation of S-values in the elements of secondary structure that are important in defining the core structure of the Ig-like domain.
Comparison of FNfn10 and TWIg18′ S-values
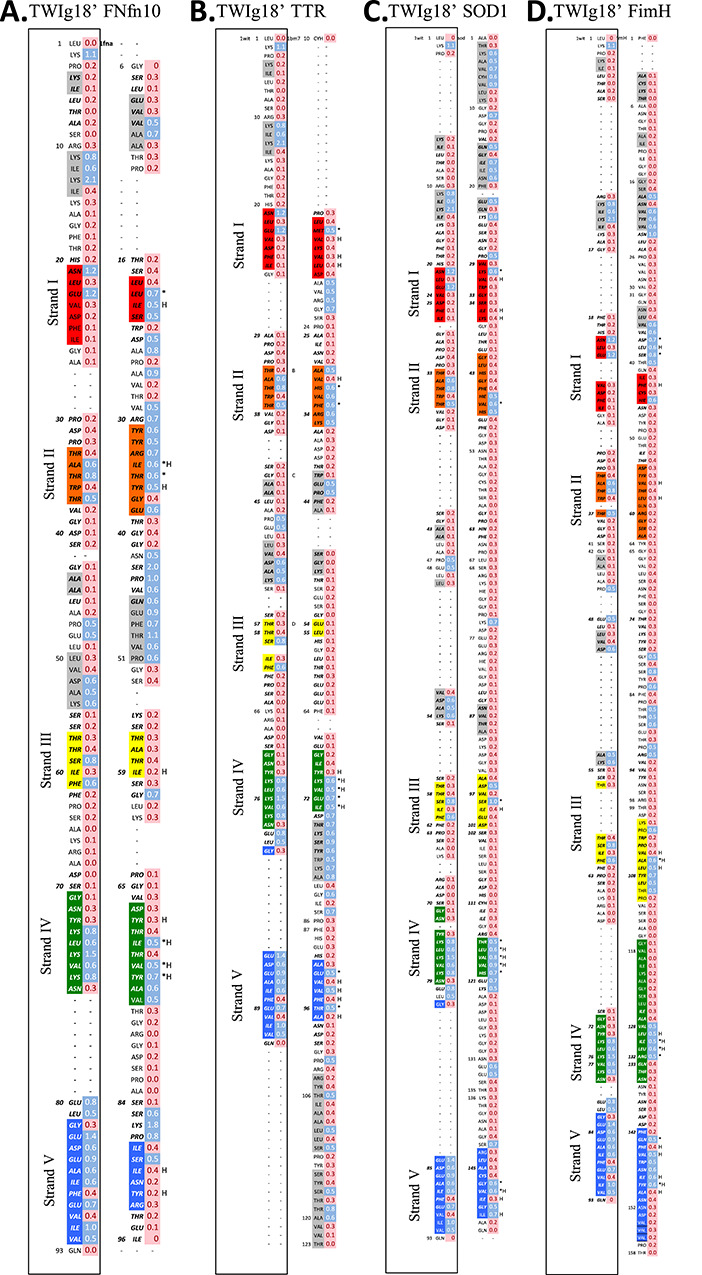
Comparing FNfn10 with TWIg18' (Fig. 7, 8), strand I in FNfn10 was shorter than that of TWIg18'. In TWIg18', there were 2 residues with high S-values N21 and E23. N21 aligns with a loop region between the A and I strands (the B strand, Table IA) in FNfn10, while E23 aligns with L18, which also had a high S-value. Residues 19 and 20 had high S-values also, indicating that the I strand was well structured in the TS. Strand II also aligned between these 2 structures, and it was longer in FNfn10 than TWIg18'. In strand II of TWIg18', there were 2 residues with high S-values, A34 and T35. These residues aligned with I34 and T35 in strand II of FNfn10. In strand II of FNfn10, all but 1 residue (G37) had high S-values, showing that this strand was well structured in the TS. The start of strand III aligned at T57 in TWIg18' and 56 in FNfn10. In TWIg18', there were 2 residues with high S-values at residues 59 and 61 in this strand. In contrast, these values were low in strand III. In strand IV (residues 71–79) in TWIg18', there were 5 residues with high S-values in the strand, residues 74–79. The aligned strand IV in FNfn10 contained the same number of residues, but there were only 3 residues with high S-values (residues 67, 73, and 74), and all three align with residues on TWIg18′. In strand V in TWIg18' (residues 82–92), 7 residues of 10 had high S-values, and 1 was relatively high at 0.5. The aligned region of the V strand in FNfn10 was much shorter and had only 1 residue with a high S-value.
Fig. 7. Transition state structures aligned by consensus domain to TWIg18′. Consensus strands colored in black in an individual structure with others in light gray. Representative structures from each replicate simulation for each protein are depicted in the same orientation as in Table IAB and Figures 1–5.
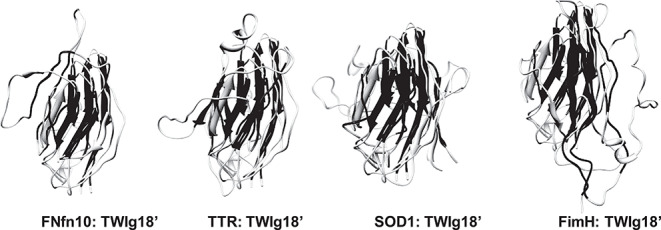
Fig. 8. Structural alignment of TWIg18' and (A) FNfn10, (B) TTR, (C) SOD1, (D) FimH using DaliLite. S-values calculated from transition state ensembles also shown for both TWIg18' and Ig-like domains for comparison. B-strands are colored from blue, to highlight where the core immunoglobulin-like domain align. *Indicates residues of conserved high structure in the TS (as determined by S-values over all simulations of each protein), and H denotes that a hydrophobic residue is conserved between domains.
Comparison of TTR and TWIg18′ S-values
The structural alignment of TTR to TWIg18' (Fig. 7, 8) shows that strand I contained little structure with 1 aligned residue with a high S-value, but overall the residues were not conserved. In TTR, the aligning strand had 1 residue with a high S-value, E13, which aligned with M23. Strand II (residues 33–37) of TWIg18' aligned with residues 29–35 in strand II of TTR. There were 3 residues with high S-values (residues 34, 35, and 37) in strand II of TWIg18', and in strand II of TTR, there were 6 residues with high S-values (residues 29, 31–35). The high S-values of residues 35 and 37 in TWIg18' were aligned with high values in residues 31 and 33 in TTR. The C strand of TWIg18' (residues 57–61) was more structured than the aligned residues in strand III in TTR (residues 54 and 55). Strand IV of TWIg18' (residues 71–79) aligned with residues 67–73 of strand IV of TTR. There were 5 residues with high S-values (residues 74–78) in TWIg18' and residues 70–73 in TTR, and these residues aligned with the residues 74–77 in TTR. The sequence differences were conservative, particularly through maintenance of hydrophobicity. Strand V of TWIg18' (residues 83–92) aligned with strand V of TTR (residues 91–97). Strand V of TWIg18' had 8 residues with high S-values (residues 83–87, 89, 91, and 92), TTR had 3 residues with high S-values (92, 94, and 96), and these aligned with residues with similar character, 85, 87, and 89 in TWIg18'.
Comparison of SOD1 and TWIg18′ S-values
Strand I of TWIg18' aligned well with strand I of SOD1 (residues 29–36, Fig. 7,8). There was only 1 residue with a high S-value in strand III of SOD1 (K30), and this position also aligned with the high S-value in strand I of TWIg18' (N21). Strand II of TWIg18 aligned with strand II of SOD1 (residues 41–48), and each contained 3 residues with high S-values, but only 1 was aligned (T37 and V47). Strand III of TWIg18' aligned with residues 95–101 strand III in SOD1, and there were 2 residues with high S-values (D96 and S98). The high S-value residue at 98 in SOD1 aligned with S59 in TWIg18', which also had a high S-value. Strand IV of TWIg18' aligned with strand IV of SOD1 (residues 116–120). All the residues in strand IV of SOD1 had high S-values, and these align with residues 74–77 of TWIg18′, and 2 of the 5 residues are identical (Val and Leu residues). Strand V of TWIg18' aligned with strand V of SOD1 (residues 143–151). There were 4 residues in strand V with high S-values (residues 147, 148, 150, 151), and 3 of these (147, 148, and 150) aligned with high S-values residues in TWIg18' (residues 87, 88, and 90).
Comparison of FimH and TWIg18′ S-values
The structural alignment for FimH and TWIg18' (Fig. 7,8) shows that strand I of TWIg18' aligned with strand I of FimH. There was 1 high S-value in strand I, but there was not a corresponding residue in strand I of TWIg18'. High S-value residues in strand II of TWIg18′ aligned with the segment preceding strand I of Fim H, however. Where strands II aligned across both structures (residues 54–63 for FimH), there were no residues with high S-values in FimH. Strand III of TWIg18' aligned with residues 101–111 of strand III of FimH with 6 residues with high S-values (residues 102, 106–110). There was alignment between residues with high S-values at F61 and A106 in TWIg18' and FimH, respectively, but overall FimH is much more structured in this region. Strand IV of TWIg18' aligned with the C-terminal half of strand IV of FimH which was much longer than that of TWIg18'. There were 5 residues with high S-values in FimH (residues 128–132), and residues 130, 131, and 132 aligned with residues with high S-values 74, 75, and 76 in TWIg18', and the different residues were fairly conservative. Strand V of TWIg18' aligned with residues 142–153 of FimH. There were 5 residues with high S-values in FimH (residues 143, 145–147, and 149), and residues 143, 145, 147, and 149 align with high S-value residues in TWIg18' (residues 85, 87, 89, and 91, respectively).
Shared transition state features across different Ig-like proteins
The only position with consistently elevated S-values across all 5 proteins was L75 in TWIg18′ (corresponding to I70 in FNfn10, V71 in TTR, L117 in SOD1, and L131 in FimH). The average S-value at this position ranged between 0.5 and0.6. This position is located in the middle of the strand that aligns to strand IV in TWIg18′. Strand IV was the middle strand on the back sheet, so L75 and equivalent residues were located in the middle of the core at a position that could interact with multiple strands, including all 4 of the central strands. L75 was a critical core residue identified by Clarke et al. (1999), and this residue aligned with V70 in TNfn3, which Shakhnovich and co-workers proposed was part of the nucl eation site (Mirny et al., 1998).
Despite the low sequence similarity of the proteins studied here, there were conserved patterns and what appeared to be a consistent prevalence for certain residue types and positions in aligned strands (Fig. 8). These aligned residues are relatively structured in the TS, indicating that similar regions of the Ig-like domain fold are likely to being structured in the TS of unrelated proteins. Consequently, structural alignment of other proteins adopting the Ig-like fold can be used to make predictions regarding the structure of the TS and hence the folding pathway. The occurrence of these consensus structured residues across the TS is not unexpected, Clarke and co-workers defined the obligate nucleus for other Ig-like domains in previous work; the obligate nucleus is comprised of residues with high Φ-values that help to drive the polypeptide chain to fold to the correct native state topology (Hamill et al., 2000a, 2000b; Cota et al., 2001; Nickson et al., 2013). The obligatory folding nucleus for Ig-like domains was found to contain hydrophobic residues in strands I, II, III, and IV (B, C, E, F using TWIg18' nomenclature). Panels A–D of Fig. 8 show the structural alignments (using DaliLite, Hasegawa and Holm, 2009) of each of our Ig-like domains with TWIg18' and highlight where residues show conserved high structure in the TS (high S-values) and hydrophobicity. The presence of the obligatory folding nucleus made up of residues distributed throughout the sequence suggests that these domains fold by a nucleation condensation mechanism in agreement with previous studies.
The denatured state across different Ig-like proteins
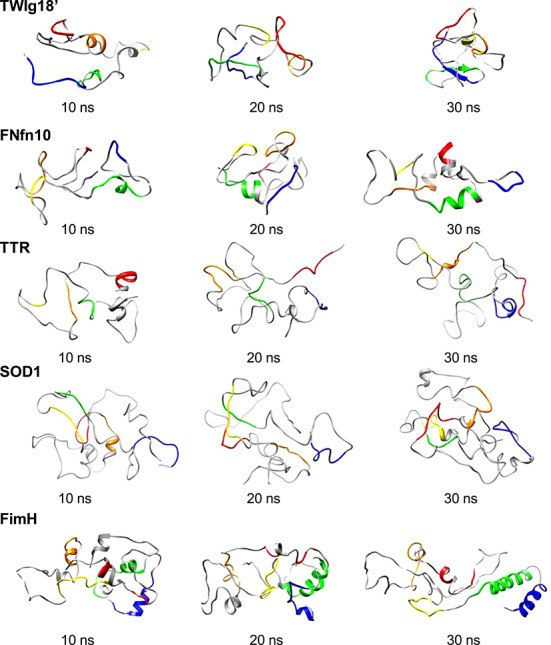
The denatured state for these simulations was defined as all structures beyond 10 ns into the simulation for the 2 longer unfolding simulations for each protein. By 10 ns, almost all native structure was lost, leaving fluctuating elements of native-like and non-native secondary structure. Some of the native turns sporadically appeared in the denatured stated, increasingly so, approaching the TS when considering the trajectory in the folding direction. This agrees with previous studies that suggest that turns allow for the correct formation of the native state structure as observed in the denatured states of cytochrome c' (Dar et al., 2011), the GAGB proteins (Scott and Daggett, 2007; Morrone et al., 2011), and barnase (Bond et al., 1997; Wong et al., 2000). Figure 9 shows snapshots from the denatured state of each protein. The denatured state ensembles were dominated by non-native interactions that maintained a relatively compact structure. The majority of the β-strands were lost rapidly, and some dynamic non-native helix formed in all the denatured states. In TWIg18', non-native helix was dynamically present throughout the sequence, and it was often long lived. Interestingly, there were long-lived sections of β-sheet in strands IV and V, which persisted into the denatured state, with the turn between these strands flickering in and out. In FNfn10, the denatured state was similar to that of TWIg18' in that there were elements of non-native helix across the sequence; however, there was no residual β-structure. Similarly, all β-strands melted out quickly in TTR, but there was some persistent non-native helix in the position of strand I, and there were also some short-lived helical turns throughout the structure. The helix at A1 was maintained throughout the denatured state in the second longer simulation. The β-strands also melted rapidly in SOD1, and there were elements of helix throughout the sequence that appeared sporadically. FimH had large amounts of fluctuating helix, especially in strands IV and V.
Fig. 9. Snapshots (10, 20, and 30 ns) from the denatured state from each protein. Representative structures from the denatured state show primarily loss of native state β-strands, gain in non-native helix, and relative compactness. Residues involved in the native state β-strands are colored on the structures using the strand coloring scheme described in Table IC.
Conclusion
Here, the unfolding pathways of 5 diverse members of the Ig-like metafold with low sequence identity were compared. Commonalities in unfolding mechanisms were observed across all unfolding simulations. The front sheet, as depicted in Table IA, was generally less stable than the back sheet owing to fewer shared hydrophobic contacts across the sheet, particularly between consensus sheets I and III. In particular, there were persistent contacts between the β-strands that align to strands IV and V, which allowed the β-sheet structure to be maintained after the unfolding transition state. Interestingly, although the 5 proteins are members of the same metafold, they are members of different superfamilies. While the consensus core of the Ig-like domain is very similar across the metafold and certain positions are important independent of the sequence, the peripheral structure can cause variations in unfolding pathways. TTR showed the most variability in unfolding, and this could partially be due to the way the C-terminal end of the protein forms a β-sheet with a β-strand at the N-terminus. TTR is a dimer of dimers, and the H strand represents 1 of the 2 dimer interfaces. Similar β-sheet interactions were not observed in the other 4 proteins.
The transition state ensembles of the Ig-like domains were overall native-like, with some segments displaying a high degree of structure, as reflected by the high S-values. S-values represent the level of structure in the TS and can be compared with experimentally derived Φ-values. The comparison of S-values across the 5 proteins when structurally aligned yielded consensus regions of the protein that were structured in the TS. In general, the important residues in the TS were distributed throughout the sequence in all proteins, illustrating the cooperative nature of the TS. β-strands IV and V were the most highly structured, with participating segments of secondary structure retained across all of the proteins; strands I, II, and III were more variable, but in all cases, there was at least 1 residue in each of these strands with high S-values participating in critical core interactions in the TS. The commonalities and differences observed here across the proteins may be useful for the design of point mutations for future Φ-value analyses and for prediction of the structure of the TS for other proteins of this fold family.
Finally, the structures in the denatured state ensembles were compared across the set of proteins, and some similarities in the non-native helical content were apparent. Also, some turns were important in maintaining the compaction of the structure and allowed the β-strands to form β-sheet as they approached the TS, considering the simulation in the folding direction. In general, β-structure was lost early in unfolding although persistent β-strand segments in strands IV and V of TWIg18' were seen late into the denatured state.
Overall, we found that proteins within the same fold family displayed similarities in their unfolding pathways even when their primary sequences and detailed tertiary interactions were different, which is in agreement with previous theoretical and experimental results; however, here we add atomic resolution detail and investigate a broader sample of the Ig-like fold family. High-ranking metafolds from our CDD (Schaeffer et al., 2011) often contain members of a number of superfamilies, and despite this, it has been shown that the folding pathways share common features across these superfamilies. These results suggest that investigating a single representative protein within a metafold can provide insight into the overall features of the folding/unfolding process of other family members, but the detailed interactions differ among the individual proteins while they preserve the overall consensus pathway.
Acknowledgements
We are grateful for financial support provided by the National Institute of General Medical Sciences of the National Institutes of Health under award number R01 GM050789.
Paper Edited by: Laura Itzhaki, Board Member for PEDS
PEDS Senior Editor: Alan Fersht.
References
- Armen R.S., Alonso D.O. and Daggett V. (2004) Structure, 12, 1847–1863. [DOI] [PubMed] [Google Scholar]
- Beck D.A.C., Alonso D.O.V., McCully M.E. and Daggett V. (2000–2019) University of Washington, Seattle. [Google Scholar]
- Beck D.A., Jonsson A.L., Schaeffer R.D., Scott K.A., Day R., Toofanny R.D., Alonso D.O. and Daggett V. (2008) Protein Eng. Des. Sel., 21, 353–368. [DOI] [PubMed] [Google Scholar]
- Beck D.A.C. and Daggett V. (2004) Methods Enzymol., 34, 112–120. [DOI] [PubMed] [Google Scholar]
- Berman H.M., Westbrook J., Feng Z. (2000) Nucleic Acids Res., 28, 235–242. [DOI] [PMC free article] [PubMed] [Google Scholar]
- Bond C.J., Wong K., Clarke J., Fersht A.R. and Daggett V. (1997) Proc. Natl. Acad. Sci. U.S.A., 94, 13409–13413. [DOI] [PMC free article] [PubMed] [Google Scholar]
- Bouckaert J., Berglund J., Schembri M. et al. (2005) Mol. Microbiol., 55, 441–455. [DOI] [PubMed] [Google Scholar]
- Childers M.C. and Daggett V. (2018) J. Phys. Chem. B, 122, 6673–6689. [DOI] [PMC free article] [PubMed] [Google Scholar]
- Clarke J., Cota E., Fowler S.B. and Hamill S.J. (1999) Structure, 7, 1145–1153. [DOI] [PubMed] [Google Scholar]
- Cota E., Steward A., Fowler S.B. and Clarke J. (2001) J. Mol. Biol., 305, 1185–1194. [DOI] [PubMed] [Google Scholar]
- Daggett V., Li A.J., Itzhaki L.S., Otzen D.E. and Fersht A.R. (1996) J. Mol. Biol., 257, 430–440. [DOI] [PubMed] [Google Scholar]
- Dar T.A., Schaeffer R.D., Daggett V. and Bowler B.E. (2011) Biochemistry, 50, 1029–1041. [DOI] [PMC free article] [PubMed] [Google Scholar]
- Day R. and Daggett V. (2007) J. Mol. Biol., 366, 677–686. [DOI] [PMC free article] [PubMed] [Google Scholar]
- Day R., Bennion B., Ham S. and Daggett V. (2002) J. Mol. Biol., 322, 189–203. [DOI] [PubMed] [Google Scholar]
- Day R., Beck D.A., Armen R.S. and Daggett V. (2003) Protein Sci., 12, 2150–2160. [DOI] [PMC free article] [PubMed] [Google Scholar]
- Dickinson C.D., Veerapandian B., Dai X.P., Hamlin R.C., Xuong N.H., Ruoslahti E. and Ely K.R. (1994) J. Mol. Biol., 236, 1079–1092. [DOI] [PubMed] [Google Scholar]
- Dietmann S., Park J., Notredame C., Heger A., Lappe M. and Holm L. (2001) Nucleic Acids Res., 29, 55–57. [DOI] [PMC free article] [PubMed] [Google Scholar]
- Fong S., Hamill S.J., Proctor M., Freund S.M., Benian G.M., Chothia C., Bycroft M. and Clarke J. (1996) J. Mol. Biol., 264, 624–639. [DOI] [PubMed] [Google Scholar]
- Fowler S.B. and Clarke J. (2001) Structure, 9, 355–366. [DOI] [PubMed] [Google Scholar]
- Haar L., Gallagher J.S. and Kell G.S.. 1984. Hemisphere, Washington, DC. [Google Scholar]
- Hamill S.J., Cota E., Chothia C. and Clarke J. (2000a) J. Mol. Biol., 295, 641–649. [DOI] [PubMed] [Google Scholar]
- Hamill S.J., Steward A. and Clarke J. (2000b) J. Mol. Biol., 297, 165–178. [DOI] [PubMed] [Google Scholar]
- Hasegawa H. and Holm L. (2009) Curr. Opin. Struct. Biol., 19, 341–348. [DOI] [PubMed] [Google Scholar]
- Kell G.S. (1967) J. Chem. Eng. Data, 12, 66–68. [Google Scholar]
- Levitt M., Hirshberg M., Sharon R. and Daggett V. (1995) Comput. Phys. Commun., 91, 215–231. [Google Scholar]
- Levitt M., Hirshberg M., Sharon R., Laidig K.E. and Daggett V. (1997) J. Phys. Chem. B, 101, 5051–5061. [Google Scholar]
- Li A.J. and Daggett V. (1994) Proc. Natl. Acad. Sci. U. S. A., 91, 10430–10434. [DOI] [PMC free article] [PubMed] [Google Scholar]
- Li A.J. and Daggett V. (1996) J. Mol. Biol., 257, 412–429. [DOI] [PubMed] [Google Scholar]
- McCully M.E., Beck D.A.C. and Daggett V. (2008) Biochemistry, 47, 7079–7089. [DOI] [PMC free article] [PubMed] [Google Scholar]
- Mirny L.A., Abkevich V.I. and Shakhnovich E.I. (1998) Proc. Natl. Acad. Sci. U. S. A., 95, 4976–4981. [DOI] [PMC free article] [PubMed] [Google Scholar]
- Morrone A., McCully M.E., Bryan P.N., Brunori M., Daggett V., Gianni S. and Travaglini-Allocatelli C. (2011) J. Biol. Chem., 286, 3863–3872. [DOI] [PMC free article] [PubMed] [Google Scholar]
- Murzin A.G., Brenner S.E., Hubbard T. and Chothia C. (1995) J. Mol. Biol., 247, 536–540. [DOI] [PubMed] [Google Scholar]
- Nickson A.A., Wensley B.G. and Clarke J. (2013) Curr. Opin. Struct. Biol., 23, 66–74. [DOI] [PMC free article] [PubMed] [Google Scholar]
- Orengo C.A., Michie A.D., Jones S., Jones D.T., Swindells M.B. and Thornton J.M. (1997) Structure, 5, 1093–1108. [DOI] [PubMed] [Google Scholar]
- Peterson S.A., Klabunde T., Lashuel H.A., Purkey H., Sacchettini J.C. and Kelly J.W. (1998) Proc. Natl. Acad. Sci. U. S. A., 95, 12956–12960. [DOI] [PMC free article] [PubMed] [Google Scholar]
- Schaeffer R.D., Jonsson A.L., Simms A.M. and Daggett V. (2011) Bioinformatics, 27, 46–54. [DOI] [PMC free article] [PubMed] [Google Scholar]
- Schmidlin T., Kennedy B.K. and Daggett V. (2009) Biophys. J., 97, 1709–1718. [DOI] [PMC free article] [PubMed] [Google Scholar]
- Schmidlin T., Ploeger K., Jonsson A.L. and Daggett V. (2013) Protein Eng. Des. Sel., 26, 503–513. [DOI] [PMC free article] [PubMed] [Google Scholar]
- Scott K.A. and Daggett V. (2007) Biochemistry, 46, 1545–1556. [DOI] [PubMed] [Google Scholar]
- Strange R.W., Antonyuk S., Hough M.A., Doucette P.A., Rodriguez J.A., Hart P.J., Hayward L.J., Valentine J.S. and Hasnain S.S. (2003) J. Mol. Biol., 328, 877–891. [DOI] [PubMed] [Google Scholar]
- Towse C.L. and Daggett V. (2012) Bioessays, 34, 1060–1069. [DOI] [PMC free article] [PubMed] [Google Scholar]
- Kamp M.W. and Schaeffer R.D. et al. (2010) Structure, 18, 423–435. [DOI] [PMC free article] [PubMed] [Google Scholar]
- Wong K., Clarke J., Bond C.J., Neira J.L., Freund S.M.V., Fersht A.R. and Daggett V. (2000) J. Mol. Biol., 296, 1257–1285. [DOI] [PubMed] [Google Scholar]
- Zarrine-Afsar A., Larson S.M. and Davidson A.R. (2005) Curr. Opin. Struct. Biol., 15, 42–49. [DOI] [PubMed] [Google Scholar]


