

Summary
Melanin-concentrating hormone (MCH)-expressing neurons are key regulators of energy and glucose homeostasis. Here, we demonstrate that they provide dense projections to the median eminence (ME) in close proximity to tanycytes and fenestrated vessels. Chemogenetic activation of MCH neurons as well as optogenetic stimulation of their projections in the ME enhance permeability of the ME by increasing fenestrated vascular loops and enhance leptin action in the arcuate nucleus of the hypothalamus (ARC). Unbiased phosphoRiboTrap-based assessment of cell activation upon chemogenetic MCH neuron activation reveals MCH-neuron-dependent regulation of endothelial cells. MCH neurons express the vascular endothelial growth factor A (VEGFA), and blocking VEGF-R signaling attenuates the leptin-sensitizing effect of MCH neuron activation. Our experiments reveal that MCH neurons directly regulate permeability of the ME barrier, linking the activity of energy state and sleep regulatory neurons to the regulation of hormone accessibility to the ARC.
Keywords: MCH neurons, hypothalamus, median eminence, VEGF, energy homeostasis, leptin, obesity, blood brain barrier, fenestrated vessels, feeding, body weight, neuroendocrinology
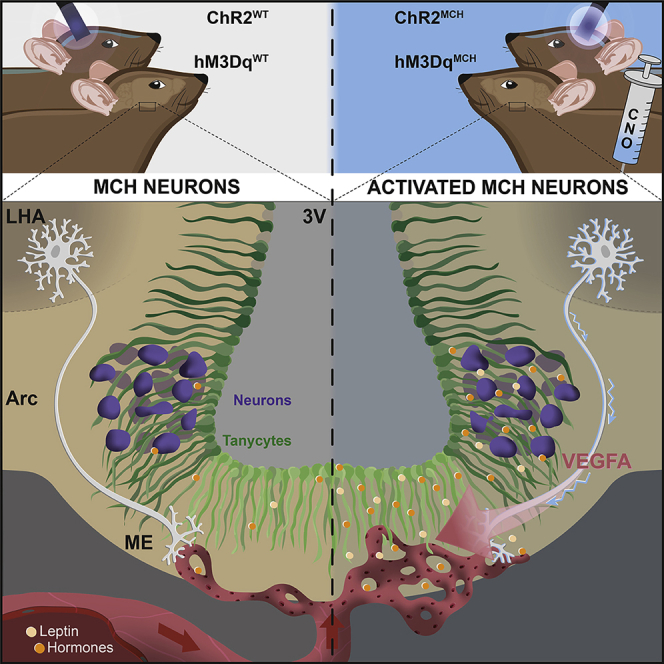
Graphical Abstract
Highlights
MCH neurons provide dense projections to the median eminence
MCH neuron activation promotes permeability of the median eminence barrier
MCH neuron activation enhances microvessel fenestration in the ME
MCH neuron activation enhances leptin action in the arcuate nucleus
Melanin-concentrating hormone (MCH)-expressing neurons in the lateral hypothalamus are regulators of energy homeostasis and sleep. Here, Jiang et al. report that they provide dense projection to the median eminence. MCH neuron activation enhances permeability of the median eminence barrier through increasing microvessel fenestration, thus facilitating leptin access to the hypothalamus.
Introduction
The median eminence (ME) as a circumventricular organ plays a major role as a blood-brain barrier (BBB)-permeable site between the periphery of the organism and the central nervous system (CNS). First, it is the site where neuronal axon terminals release secreted peptides and transmitters into the portal capillary system (Clarke, 2015). Second, it can transport blood-borne signals to their target regions in the brain (Martínez et al., 2019, Schaeffer et al., 2013). The key structures of this barrier are composed of tanycytes and fenestrated microvessel loops (Prevot et al., 2018). Tanycytes are unique cell types, which are specialized ependymal cells lining the floor of the third ventricle. They elongate single and long basal processes to either the external part of the ME or into the neighboring brain tissue, such as the mediobasal hypothalamus (Mullier et al., 2010). Another functionally important compartment of the ME is formed by a network of fenestrated capillary loops (Ciofi et al., 2009). These long loops are mainly surrounded by ME tanycyte terminals and neurosecretory endings of neuroendocrine neurons. This discrete structure makes the ME stand out as an important gate for “brain-peripheral crosstalk.” In previous studies, it was found that the ME undergoes feeding-state-dependent-plasticity by tanycyte-derived vascular endothelial growth factor A (VEGFA) release (Langlet et al., 2013). However, this model leaves open the question of whether internal-state-dependent modulation of neurons may also, in turn, contribute to state-dependent regulation of ME barrier plasticity.
Interestingly, two recent studies showed that melanin-concentrating hormone (MCH)-expressing neurons through projection sites around the third ventricle regulate the flow of the cerebrospinal fluid (CSF) and feeding behavior (Conductier et al., 2013, Noble et al., 2018). MCH neurons are distributed exclusively in the lateral hypothalamus (LH) and the zona incerta (ZI) of the brain (Bittencourt, 2011). Abundant experiments, i.e., either intracerebroventricular (i.c.v.) injection of MCH or overexpression and knockout of MCH, all point toward a critical regulatory function of MCH neurons in the integrated control of food intake, locomotor activity, and systemic glucose homeostasis (Hausen et al., 2016, Ludwig et al., 2001, Macneil, 2013, Rossi et al., 1997). Besides their role in the control of energy homeostasis, electrophysiological recordings of MCH neurons across sleep cycles and specific optogenetic manipulation of MCH neurons revealed that MCH neurons were firing more actively during rapid eye movement (REM) sleep cycles (Hassani et al., 2009) and through different projection sites across the brain, MCH neuron activation increased REM sleep (Konadhode et al., 2013). Collectively, these studies define the MCH neurocircuitry as a highly interconnected system within and beyond the hypothalamus (Diniz and Bittencourt, 2017, Komagata et al., 2019), integrating the regulation of energy homeostasis and sleep.
Here, we identify dense projections of MCH neurons from the LH and ZI to the ME region. These findings provoked the question of whether MCH neurons may modulate the ME barrier contributing to the regulation of blood-borne hormone accessibility to the hypothalamus and, thus, may have broader effects on metabolic control. By using several transgenic mouse lines for visualization as well as chemogenetic and optogenetic activation of MCH neurons, we demonstrate that these integral regulators of metabolism and sleep also control the accessibility of the mediobasal hypothalamus for blood-borne signals, as exemplified by leptin. Thus, our study adds an important mechanism to the action of MCH neurons in the regulation of energy homeostasis besides classical synaptic as well as volume transmission.
Results
MCH Neurons Provide Dense Projections to the ME and Closely Contact Tanycytes and Fenestrated Capillaries
To investigate the projection patterns of MCH neurons, we used two different MCH neuron reporter mouse lines. First, we generated mice, which express channelrhodopsin 2 (ChR2) fused to enhanced yellow fluorescent protein (eYFP) in MCH neurons including their projections by crossing MCHCre mice with those allowing for Cre-dependent expression of ChR2-eYFP from the ROSA26 locus. Here, we found that ChR2-eYFP-marked MCH neuron projections were readily detected in the ME (Figure 1A; Figure S1). To visualize whether there were potential contacts between MCH neuron projections and tanycytic processes, we performed double immunolabeling for eYFP and vimentin in ME sections from ChR2-eYFPMCH mice. Indeed, MCH neuron terminals closely contact tanycytic processes, as resolved by confocal microscopy (Figure 1A). To investigate whether these projections from MCH neurons represented synaptic terminals, we crossed MCHCre mice with animals, which allowed for Cre-dependent expression of a synaptophysin-tdTomato fusion protein from the ROSA26 locus. Here, immunostaining for tdTomato allowed visualization of synaptic vesicles in presynaptic sites of MCH neurons. Coimmunolabeling for synaptophysin-tdTomato and vimentin confirmed abundant MCH neuron terminals in close proximity to tanycyte processes (Figure 1B).
Figure 1.

MCH Neuron Projections in the ME
(A) Immunohistochemistry using anti-Vimentin (red) and anti-GFP antisera (green) in ARC/ME sections of ChR2-eYFPMCH mice; (a1)–(a)5 show enlarged exemplary regions from the ME region depicted in (A).
(B) Immunohistochemistry using anti-Vimentin (green) and anti-tdTomato (red) in ARC/ME sections of Synaptophysin-tdTomatoMCH mice; (b1)–(b4) show enlarged exemplary regions from the ME region depicted in (B).
(C) Immunohistochemistry using lectin (green) and anti-tdTomato (red) in ARC/ME sections of Synaptophysin-tdTomatoMCH mice; (c1) and (c2) show enlarged exemplary regions from the ME region depicted in (C). Dashed white square in (c1) and (c2) show the close contact between lectin-positive vessels and MCH neuron terminals.
(D) Electron microscopy of the ME sections in Synaptophysin-tdTomatoMCH mice. Tanycytic processes are marked in yellow, as defined by their elongated mitochondria; the presence of electron-dense cytoskeletal bundles as well as glycogen storage and MCH nerve terminals are marked in green that contain silver-amplified highly electron-dense particles (d1–d4). (d5) and (d6) taken from external zone of ME, where neuroendocrine terminals reach close proximity to the pericapillary space (p.s., light pink) of the pituitary portal vessel (dark pink) capillary plexus (Cap.). The two arrows in the bottom left panel show a fenestration in the endothelium. In (d6), the black arrowhead shows a tomato-immunoreactive nerve terminal (green) contacting the parenchymatous basal lamina delineating the pericapillary space; the white arrowhead shows a thin tanycytic process (yellow) inserted between the MCH nerve terminal (green) and the basal lamina. Scale bars: 10 μm in (A), 20 μm in (B), 20 μm in (C), and 2 μm in (D).
To define potential structural contacts between MCH neuron projections and another important component of the ME, i.e., fenestrated capillary loops, double-labeled staining for lectin-marked vascular cells and tdTomato in Synaptophysin-tdTomatoMCH mice showed that, in the external region of the ME, MCH neuron synaptic terminals were densely distributed in close proximity to capillary loops (Figure 1C).
Due to the resolution limitations of confocal microscopy, we could not further define the exact structural contacts between MCH neurons and ME structures by using this technology. To further address this question, we performed electron microscopy (EM) for visualization of the ultrastructural contacts of MCH neurons and ME components. Here, we found that MCH neuron terminals, which contained silver-amplified highly electron-dense particles by immunolabeled tdTomato staining of Synaptophysin-tdTomatoMCH mice, were indeed closely located around tanycytic processes in the ME (Figure 1D). In addition, in the external zones of the ME, MCH neurons had terminals, which were close to the pericapillary space (Figure 1D, d5) and even contacted the parenchymatous basal lamina (Figure 1D, d6).
Collectively, MCH neurons provide projections to the ME and have close structural contact with both tanycytic processes and the vascular wall containing the fenestrated capillaries. These anatomical findings indicate a potential functional interaction of MCH neurons with key components of the ME in control of ME barrier permeability.
Chemogenetic Activation of MCH Neurons Increases Permeability of the ME Barrier and Promotes Increased Fenestration of Microvessels
Previous studies had shown that fasting induces increased fenestration of ME microvessel loops to the arcuate nucleus of the hypothalamus (ARC) and tight-junction-complex reorganization of tanycytes in the ARC (Langlet et al., 2013). To address whether the observed structural contacts of MCH neurons with critical barrier components in the ME could functionally alter the permeability of the ME barrier, we investigated the effect of chemogenetic activation of these neurons on ME barrier permeability. To this end, mice that allowed for chemogenetic activation through transgenic expression of the activatory DREADD (Designer Receptors Exclusively Activated by Designer Drugs) receptor hM3Dq in MCH neurons (hM3DqMCH mice) were injected with 1% Evans blue dye into the tail vein to mimic access of peripheral signals to the ARC through the ME barrier. Analysis of dye distribution in the ARC revealed that activation of MCH neurons evoked a clear enhancement of Evans blue diffusion in the ARC compared to fasted and 4-h clozapine-N-oxide (CNO)-treated control mice, which did not express the DREADD receptor (hM3DqWT) (Figures 2A, 2B, and S1). Importantly, Evans blue diffusion did not differ between vehicle-treated hM3DqMCH and hM3DqWT mice, further supporting that the observed increase in ME permeability was the specific result of chemogenetic MCH neuron activation (Figures S2A and S2B).
Figure 2.

Chemogenetic Activation of MCH Neurons Enhances the Permeability of the ME Barrier
(A) Representative images of Evans blue dye diffusion into the ARC region of fasted and 4-h CNO-injected control and hM3DqMCH mice.
(B) Quantification of Evans blue dye diffusion upon CNO treatment of control (n = 5) and hM3DqMCH mice (n = 7). Bar graphs represent the min to max value, the mean value is marked as “+”. Statistical analysis: unpaired Student’s t test, ∗p < 0.05.
To investigate whether the observed changes in ME permeability represent a direct consequence of MCH neuron activation or may occur secondarily to metabolic changes induced by MCH neuron stimulation, we determined circulating insulin, leptin, ghrelin, and corticosterone concentrations as well as performed insulin and glucose tolerance tests in CNO-treated hM3DqMCH and hM3DqWT mice. These analyses revealed no changes in circulating energy-state-sensing hormones between the two groups of mice (Figures S3A–S3D). Similarly, chemogenetic MCH neuron activation had no effect on insulin sensitivity and glucose tolerance (Figures S3E and S3F). Taken together, the results show that the observed increase in ME permeability upon chemogenetic MCH neuron activation occurred in the absence of major metabolic alterations.
To investigate whether this increase in ME barrier permeability as a consequence of activating MCH neurons was accompanied by structural changes of the ME barrier, we then examined two key structures underlying this regulation, i.e., the quantity of fenestrated microvessel loops, as assessed by immunohistochemical staining for MECA-32, and the formation of tanycyte tight-junction-complexes, as assessed via ZO-1 immunohistochemistry. We found a clear increase of MECA-32-marked fenestrated microvessel loops in CNO-treated hM3DqMCH mice compared to CNO-treated control animals in both the ARC and ME (Figures 3A and 3B). In contrast, there were no differences detectable in ZO-1-marked tight junction complexes, which exhibited the classical honeycomb-like pattern of organization in the ventromedial ARC (Figures 3A and 3C). Together, these findings indicate that activation of MCH neurons promotes increased ME permeability and that this effect is accompanied by structural alterations of fenestrated capillaries in the ME and the ARC.
Figure 3.

Chemogenetic Activation of MCH Neurons Enhances the Permeability of the ME Barrier through Increased Fenestration of Microvessel Loops
(A) Representative images of anti-MECA-32 (red), anti-tight-junction-1 (ZO-1, green), and anti-Vimentin (white) immunoreactivity in the ME region. The left image shows a hemisection of a CNO-treated control animals and the right show a hemisection of a CNO-treated hM3DqMCH mouse.
(B and C) Quantification of number of MECA-32-marked microvessel loops (B) d and ZO-1-marked tight junction complexes (C) in both the ME and the ARC region of fasted and CNO treatment of control (n = 6–10) and hM3DqMCH mice (n = 9–11).
(D) Light microscopy image showing the capillaries illustrated in (E) (white square) in a 1-μm-thick semithin section.
(E) Representative electron microscopy image showing two fenestrated capillaries (see fenestrae shown by arrows in insets 1 and 2) in the ventromedial ARC of a CNO-treated hM3DqMCH mice.
(F) Quantification of capillary fenestration upon fasted and CNO-treated control (n = 4) and hM3DqMCH mice (n = 4). Bar graphs represent the min to max value, the mean value is marked as “+”. Statistical analysis: unpaired Student’s t test, ∗p < 0.05.
To further investigate the structural alterations of microvessels in the ARC upon chemogenetic MCH neuron activation, we assessed the fenestration of ME microvessel loops reaching the ventromedial ARC directly by EM-based imaging. This analysis revealed a clear enhancement of microvessel loop fenestration upon chemogenetic MCH neuron activation (Figures 3D–3F).
Taken together, our results reveal that chemogenetic MCH neuron activation enhances microvessel fenestration in the ME and the ARC.
Chemogenetic Activation of MCH Neurons Increases Leptin Action
To test whether the MCH-neuron-dependent changes in ME structure and permeability potentially also translate into an altered ability of energy-state-sensing hormones to access the ARC, we next performed leptin sensitivity experiments in hM3DqMCH mice and control littermates. Both groups of animals were treated with CNO 4 h before an intraperitoneal (i.p.) injection of vehicle or leptin. CNO administration upon subsequent vehicle treatment in 16-h fasted hM3DqMCH mice resulted in an increase in food intake upon refeeding compared to control mice (Figure S4A). These findings are consistent with previous studies revealing increased food intake upon chemogenetic activation of MCH neurons (Noble et al., 2018). However, this effect was not detectable after 4 h of refeeding (Figure S4B).
Next, we investigated the food intake suppressive effect of a single i.p. injection of leptin in CNO-treated hM3DqMCH mice and control littermates. Interestingly, following chemogenetic activation of MCH neurons upon CNO treatment of hM3DqMCH mice, leptin suppressed food intake after 1 h of refeeding compared to saline-treated animals, whereas this effect was absent in CNO-treated control animals receiving the same dose of peripherally applied leptin (Figure 4A). Calculating the ratio of food intake suppression upon leptin treatment versus saline treatment within each group of animals revealed that leptin-induced suppression of 1 h of food intake was more pronounced in hM3DqMCH than in control animals (Figure 4B). However, this effect was not detectable 4 h after leptin application, indicating that chemogenetic MCH neuron activation predominantly enhanced the rapid induction of leptin-induced feeding suppression, consistent with the increase in ME permeability, thus facilitating rapid access of leptin to the ARC (Figures S4B and S4C).
Figure 4.

Chemogenetic Stimulation of MCH Neurons Promotes Leptin Action
(A) Assessment of leptin sensitivity by comparing the effect of saline or leptin injection on 1-h refeeding food intake in CNO-treated control (n = 16) and hM3DqMCH mice (n = 13).
(B) The ratio of (food intake in leptin treated condition–food intake in saline treated condition)/food intake in saline-treated condition in CNO-treated control (n = 16) and hM3DqMCH mice (n = 13).
(C) Representative image of pSTAT3 immunoreactivity in CNO-treated control and hM3DqMCH mice with 15-min leptin stimulation.
(D) Quantification of the number of pSTAT3-positive cells in the ARC of 15-min leptin-injected, fasted, and CNO-treated control (n = 6) and hM3DqMCH mice (n = 5).
(E) Representative image of pSTAT3 immunoreactivity in CNO-treated control and hM3DqMCH mice with 45-min leptin stimulation.
(F) Quantification of the number of pSTAT3-positive cells in the ARC of 45-min leptin-injected, fasted, and CNO-treated control (n = 12) and hM3DqMCH mice (n = 13). Bar graphs represent the min to max value, the mean value is marked as “+”. Statistical analysis: unpaired Student’s t test, ∗p < 0.05, ∗∗p < 0.01, except leptin sensitivity where a paired Student’s t test was used, ∗p < 0.05.
To investigate leptin-induced signaling in the ARC on a molecular level, we assessed the dynamics of the ability of leptin to evoke STAT3 phosphorylation (pSTAT3) under the same experimental conditions. Here, leptin treatment lead to an enhanced activation of pSTAT3 in the ARC upon previous chemogenetic activation of MCH neurons as early as 15 min after leptin injection, and this effect of enhanced leptin-evoked STAT3-phosphorylation remained increased 45 min after leptin application (Figures 4C–4F).
In summary, chemogenetic activation of MCH neurons increases ME barrier permeability and enhances the ability of leptin to rapidly activate STAT3 phosphorylation in the ARC and to acutely suppress feeding.
Optogenetic Activation of MCH Neuron Projections in the ME Enhances ME Permeability and Leptin Sensitivity
Because chemogenetic activation of MCH neurons promotes the release of MCH and other peptides and neurotransmitters from these neurons across the broad neurocircuitry targeted by these cells, our previous experiments left open the question about the contribution of MCH neuron-ME projections in the regulation of ME permeability and leptin action. To address this question, we aimed at selectively targeting the MCH neuron-ME projections by optogenetic activation. Therefore, we implanted optical fibers into the third ventricle just above the ME of ChR2-tdTomatoMCH and control animals (Figure S5A). Blue light illumination of MCH neuron-ME projections (10 Hz) did not affect subsequent food intake upon vehicle injection in a refeeding paradigm when comparing ChR2-tdTomatoMCH and control animals (Figure S5B). To investigate whether the optogenetic fiber implantation potentially interferes with the ability of MCH neuron activation to increase the rapid refeeding response, we investigated the food intake stimulatory effect of chemogenetically activating MCH neurons in hM3DqMCH and hM3DqWT mice, which had been implanted with optical fibers in the same position as ChR2-tdTomatoMCH mice. This analysis revealed that fiber implantation did not interfere with the ability of chemogenetically activating MCH neurons to increase the rapid refeeding response (Figures S5C and S5D).
However, when we stimulated MCH neuron-ME projections in ChR2-tdTomatoMCH mice, this intervention enhanced Evans blue diffusion in the ME (Figures 5A and 5B) as well as increased the number of fenestrated microvessel loops in the ME and the ARC (Figures 5C and 5D). Moreover, optogenetic stimulation of MCH neuron-ME projections in ChR2-tdTomatoMCH mice enhanced the leptin-induced suppression of 1-h refeeding in ChR2-tdTomatoMCH mice but not in control animals (Figures 5E and 5F). The control mice did not show a significant response to a single peripheral application of leptin at both time points after refeeding (Figures 5E and 5F; Figure S5F).
Figure 5.

Optogenetic Stimulation of MCH-ME Projections Promotes Leptin Action
(A) Representative images of Evans blue dye diffusion into the ARC region of fasted and 3.5-h blue-light-illuminated control and ChR2MCH mice.
(B) Quantification of Evans blue dye diffusion upon blue light illuminated of control (n = 14) and ChR2MCH mice (n = 12).
(C) Representative images of anti-MECA-32 (red) and anti-Vimentin (white) immunoreactivity in the ME region. The left image (c1) shows a left hemisection of a blue-light-illuminated control mouse, and the right images shows (c2) a right hemisection of a blue-light-illuminated ChR2MCH mouse. Bottom panel shows the magnified images (c3 and c4) from (c1) and (c2).
(D) Quantification of the number of MECA-32-marked microvessel loops in both the ME and the ARC region of blue-light-illuminated control (n = 17) and ChR2MCH mice (n = 11).
(E and F) Same comparison of leptin sensitivity as depicted in Figure 4A and 4B, upon blue-light-illumination above the ME of control (n = 12) and ChR2MCH mice (n = 11). Bar graphs represent the min to max value, the mean value is marked as “+”. Statistical analysis: unpaired Student’s t test, ∗p < 0.05, ∗∗p < 0.01, and ∗∗∗p < 0.001, except leptin sensitivity comparison by paired Student’s t test, ∗p < 0.05.
Collectively, these experiments indicate that the ability of MCH neuron activation to increase the permeability of ME microvessel loops reaching the ventromedial ARC and leptin’s anorexigenic action was indeed mediated by MCH neuron-ME projections, whereas the food-intake-stimulatory effect of chemogenetic MCH neuron activation was likely due to an increased access of orexigenic hormones, such as ghrelin, to the ARC or to alternative mechanisms governed by MCH neurons, which is in line with previous reports.
MCH Does Not Modulate Tanycyte Signaling
MCH is one of main peptides released from MCH neurons and also has been extensively investigated with regard to its regulatory role in energy homeostasis. Given the effects of chemogenetic and optogenetic MCH neuron stimulation on ME barrier permeability and leptin action, we speculated that MCH may directly act on tanycytes and fenestrated capillaries. To this end, first we established in-vitro-purified tanycyte cultures as a model to test the potential effects of MCH on these cells. However, we found that mRNA expression of the MCH receptor 1 (MCHR1) is relatively low in sorted tanycytes compared to other cells in the ME region (Figure S6A). Similarly, in situ hybridization by RNA scope revealed that MCHR1 mRNA was barely expressed in tanycytes (Figure S6B). Moreover, by incubating tanycyte cultures with MCH, we failed to detect activation of ERK or AKT signaling in these cells (Figures S6C and S6D). It is well known that MCH through activation of MCHR1 suppresses forskolin-stimulated cyclic AMP (cAMP) concentrations and increases intracellular Ca2+ (Pissios et al., 2003). Therefore, we tested whether MCH incubation of tanycytes can regulate cAMP levels. Similar to what was observed for ERK and AKT signaling, we found that MCH incubation did not affect cAMP concentrations in tanycytes (Figure S6E). Together, these findings show that MCH does not affect signaling in cultured tanycytes.
However, to exclude other signaling pathways that may be involved in the MCH regulatory role of tanycytes, we used Ca2+ imaging in living brain slices containing the ME, which allowed us to directly visualize calcium activity on different cell types in the ME (Figure S6F). Nevertheless, we found that MCH peptide application onto the ME slices did not induce any changes in intracellular Ca2+ compared to a negative control (articifial cerebrospinal fluid [ACSF] treatment), whereas ATP evoked clear increases in intracellular Ca2+ in the different cell types in the ME (ARC-tanycytes/ME-tanycytes/vessels of the pars tuberalis/blood vessels below the ME) (Figure S6G). Finally, considering that MCH neurons in addition to MCH can also release glutamate or GABA, we next tested the potential effect of both transmitters on Ca2+ activity of the ME slices. However, either incubating slices with the glutamate receptor ligand glutamate (G162, Sigma, 100 μM) or the GABA receptor agonist baclofen (0417, Tocris, 1 mM) failed to elicit changes in intracellular Ca2+ concentrations in tanycytes (Figure S6H). Hence, our data argue that MCH does not modulate signaling of the classical MCH-regulated pathways in tanycytes and capillaries in the ME.
MCH Neurons Regulate Endothelial Cells in the ME
Given that stimulation of MCH neurons alters ME permeability by increasing fenestrated vessel loops and that, specifically, MCH neuron-ME projections regulate these effects, we aimed to further investigate the mechanisms underlying this regulation. Thus, we performed phosphoRiboTrap experiments to explore the nature of the cell types in the ME regulated as a consequence of chemogenetically activating MCH neurons. In previous studies, it was shown that phosphorylation of the ribosomal protein S6 as a bona fide target of mTOR signaling well reflects cell activation in response to a wide array of stimuli (Knight et al., 2012). The method builds on the fact that the S6 ribosomal protein is activated in cells upon activation of tyrosine kinase and G-protein-coupled receptor signaling. Thus, precipitation of S6-marked ribosomes and sequencing of associated mRNAs allows for the unbiased identification of cell types, in which mTOR signaling was modulated upon a defined stimulus. To identify cell types that exhibit altered mTOR signaling upon chemogenetic MCH neuron activation, fasted hM3DqMCH and control littermates (hM3DqWT) were injected with CNO (3 mg/kg i.p.). Mice were sacrificed 1 h after CNO injection. The ARC and ME region was dissected and subjected to immunoprecipitation with an anti-pS6 antibody to immunopurify ribosomes from cell types, where mTOR signaling was altered as a consequence of chemogenetic MCH neuron activation. After RNA extraction, both input RNA and that associated with immunoprecipitated (IP) ribosomes were subjected to deep mRNA sequencing in both groups of mice. By comparing the reads in the IP/input ratio, we were able to identify gene clusters, which were enriched in the ribosomes of cell types, which had undergone alterations of mTOR signaling in response to MCH neuron activation (Table S1). When we analyzed the overlap of genes enriched in the IP/input of MCH-neuron-activated mice with that of previously identified cell types by using unbiased droplet-based single-cell mRNA sequencing of cells in the mediobasal hypothalamus (Campbell et al., 2017), we identified gene clusters that represented neurons and glial cells, as well as endothelial cells, whose transcripts exhibited an enrichment in the IPs from MCH-neuron-activated mice (Figures S7A and S7B). Collectively, MCH neuron activation among other cell types alters mTOR signaling in endothelial cells of the ME/ARC.
MCH Neurons Express VEGFA and Modulate Leptin Sensitivity in a VEGFA-Dependent Manner
To define the mechanisms through which MCH neuron activation may regulate endothelial cell signaling and increases fenestration of vessel loops in the ME, we aimed to identify potential signals originating from MCH neurons and capable of regulating endothelial function. To this end, we performed single-nucleus RNA sequencing of MCH neurons, which were subjected to fluorescence-activated cell sorting (FACS) upon MCH-neuron-specific ZsGreen expression in ZsGreenMCH mice. Using this approach, we obtained single-nuclei mRNA sequencing reads from 1,266 isolated MCH neurons. An analysis of gene expression revealed the identification of previously unrecognized heterogenous cell clusters of MCH neurons (Figures 6A and 6B). These 4 clusters of MCH neurons were characterized by the expression of distinctive mRNAs (Table S2). We clustered the 1,266 cells using the R Seurat package (Butler et al., 2018) (version 3.1.1). A small cluster_resolution parameter of 0.2 ensures grouping of the cells into few clusters. The resulting marker genes for each clusters were then used as input for a Gene Ontology (GO) term analysis by using the R clusterProfiler package (Yu et al., 2012) (version 3.14.3). To avoid redundant GO terms, we used clusterProfiler’s simplify function with default parameters. The significantly regulated simplified GO terms are then sorted by rich factor, which is determined by rich factor = (significant gene count of GO term)/(total gene count of GO term). This analysis identified specific GO terms enriched in the 4 clusters of MCH neurons (Figure 6C). Interestingly, genes defining the largest cluster of MCH neurons (cluster 0) exhibited an enrichment of genes in the GO term “regulation of VEGF signaling pathway” and GO term “positive regulation of endothelial cell proliferation.” This lead us to specifically investigate the expression of VEGFA, which has been previously found to critically regulate the ME barrier (Langlet et al., 2013), across the different clusters of MCH neurons. This analysis revealed that VEGFA mRNA was indeed expressed across the different clusters of MCH neurons (Figure S7C).
Figure 6.

Single-Nucleus Sequencing of MCH Neurons
(A) Heterogenous cell clusters of MCH neurons based on single-nucleus sequencing from ZsGreenMCH reporter mice.
(B) Heatmap of cell clusters with marker genes of MCH neurons. Color code on the top same as (A). Color scale indicates gene expression level.
(C) Gene Ontology (GO) term analysis of each MCH cell cluster. GO term significance mapped to color. Percentage of significant genes depicts the ratio of significant genes in GO term to all genes defining the term in percent.
To further validate VEGFA expression in MCH neurons, we used RNAscope-based in situ hybridization for VEGFA mRNA expression in tdTomatoMCH mice. Here, we confirmed VEGFA mRNA expression in MCH neurons (Figure 7A). In addition, immunostaining was performed for visualizing VEGFA protein expression in genetically marked MCH neurons of tdTomatoMCH reporter mice. This analysis revealed a clear overlay of VEGFA immunoreactivity and tdTomato immunoreactivity in MCH neurons of the lateral hypothalamic area (LHA) (Figure 7B). Comparing the percentage of VEGFA-positive MCH neurons to that of non-MCH neurons in the LHA revealed an enrichment of VEGFA-expressing neurons in MCH compared to non-MCH neurons (Figure 7C). Collectively, several independent lines of experimental evidence revealed the expression of VEGFA in MCH neurons.
Figure 7.

VEGFA Expression in MCH Neurons
(A) Representative images from in situ hybridizations for VEGFA and MCH in LHA sections. Green, MCH; red, VEGFA; blue, 4′,6-diamidino-2-phenylindole (DAPI). In the merged image, white dashed circles show coexpression of VEGFA and MCH. Orange dashed circles in the VEGFA expression image are corresponding positions to white dashed circles.
(B) Representative images of immunoactive VEGFA, NeuN, and MCH/tdTomato signal in LHA sections. Green, anti-VEGFA; red, anti-NeuN, neuronal marker; yellow, tdTomato. In the merged image, blue arrows point out MCH neurons expressing VEGFA, and white arrows point out non-MCH neurons expressing VEGFA.
(C) Quantification of the coexpression percentage of VEGFA expression in MCH neurons, and in non-MCH neurons.
(D) Assessment of leptin sensitivity by comparing the effect of saline or leptin injection on 1-h refeeding food intake in 16-h fasted and CNO-treated-hM3DqMCH mice (n = 10) upon vehicle or Axitinib pretreatment. Data are represented in a violon plot (C); in (D), bar graphs represent the min to max value, the mean value is marked as “+”. Statistical analysis: leptin sensitivity comparison by paired Student’s t test, ∗p < 0.05. Scale bar: 50 μm in (A) and (B).
To test whether VEGFA signaling contributes to the MCH-neuron-activity-dependent regulation of ME permeability, we investigated the ability of MCH neuron activation to regulate leptin sensitivity upon pharmacological inhibition of VEGFA signaling. Pretreatment with the VEGFR blocker Axitinib attenuated the ability of chemogenetic MCH neuron activation to enhance the anorexigenic effect of peripherally applied leptin (Figure 7D). Collectively, these data indicate that, at least in part, MCH-neuron-dependent VEGFA signaling contributes to the enhancement of leptin’s acute anorexigenic effect upon chemogenetic MCH neuron activation.
Discussion
The maintenance of energy homeostasis requires the rapid transfer of energy-state-sensing signals from the periphery of the organism to the CNS. The characteristics of the ME barrier in immediate anatomical proximity to the hypothalamus play a key role in this process. Previous work had indicated not only that the concentration of these energy-state-communicating signals varies upon changes in internal state but also that ME barrier function is modulated in response to fasting (Langlet, 2013, 2019; Varela and Horvath, 2012). Our results unravel a previously unrecognized mechanism through which the activity of neurons in the hypothalamus, which are regulated during sleep and implied in control of energy homeostasis, in turn regulates vascular fenestration in the ME to enhance barrier permeability and further hormone access in a VEGFA-dependent manner.
Although most energy regulatory neurocircuits, such as melanocortin neurons in the ARC, exert their metabolism regulatory function through neuropeptide and neurotransmitter-dependent signaling in their widespread neurocircuitry in a conventional way by synaptic transmission (Betley et al., 2015, Engström Ruud et al., 2020, Fenselau et al., 2017, Steculorum et al., 2016), MCH neurons have previously been shown to exert at least part of their metabolism regulatory function through additional mechanisms. First, they densely innervate the ependymal cells of the ventricle to regulate cilia beating and CSF circulation (Conductier et al., 2013). Second, they directly project to the ventricle to release MCH into the CSF and to mediate their orexigenic effect through volume transmission (Noble et al., 2018). Our present study extends the unconventional functions of MCH neurons by demonstrating that they not only release neuropeptides and transmitters but also express considerable amounts of VEGFA, as revealed by multiple complementary approaches. Thus, we provide a model that indicates that hypothalamic neurons can modulate the vascular barrier through activity-dependent release of the angiogenic factor VEGFA. It has previously been shown that in the developing CNS, neuronal VEGF maintains neurons and endothelial cells in both paracrine and autocrine manners (Mukouyama et al., 2002, Ogunshola et al., 2002). In adult animals, hippocampal-expressing VEGF is increased during exposure to an enriched environment and upon maze exposure, contributing to the effect of environment on neurogenesis and cognition (Cao et al., 2004). In addition to a role in the CNS, it has been shown that peripheral nerves provide a template that determines the organotypic pattern of blood vessel branching and arterial differentiation in the skin, by local secretion of VEGF (Mukouyama et al., 2002, Ogunshola et al., 2002). Importantly, a recent study revealed that cultured hippocampal neurons express VEGF endogenously and VEGF localizes in vesicles, which undergo kinesin-dependent axonal transport as well as depolarization-dependent release of VEGF (Yang et al., 2017). Thus, likely a similar mechanism operates in MCH neurons, which is in line with results of Langlet et al. (2013) that showed VEGFA-dependent control of ME barrier plasticity.
The present study through use of complementary experimental approaches revealed that activating MCH neurons can modulate the permeability of the ME barrier. Future studies will have to investigate the effects on ME barrier permeability and their physiological consequences when MCH neurons are inhibited during their states of natural activation. Similarly, further defining the role of MCH-neuron-derived VEGFA will have to use mice with cell-type-specific disruption of VEGFA in these neurons.
Although MCH neurons have been implicated in both energy homeostasis and sleep regulation, only recent studies using in vivo Ca2+ imaging have unraveled the physiological regulation of these neurons in freely behaving mice. Using fiber photometry of genetically marked MCH neurons, González et al. (2016) revealed that MCH neurons increase their activity upon novel object recognition. Moreover, single-MCH-neuron-resolution-based Ca2+ imaging revealed a predominant activation of MCH neurons during REM sleep (Blanco-Centurion et al., 2019), whereas in another study, it was reported that MCH neurons exhibited a more heterogenous response dependent on sleep cycles and a majority of neurons was activated during REM sleep, but minor proportions did not respond to changes in sleep state or some even became activated upon awakening (Izawa et al., 2019). These heterogenous responses are also consistent with the molecular heterogeneity of MCH neurons revealed in our single-nuclei sequencing experiments. Unfortunately, the abovementioned studies did not investigate the regulation of MCH neuron activity across changes in nutritional state. Thus, future studies are clearly needed to investigate how MCH neurons are dynamically regulated across different nutritional states in vivo.
Nevertheless, modulation of BBB permeability and, specifically, leptin transport has been linked to circadian regulation and sleep. Here, leptin transport is increased toward the end of the light cycle and sleep increases BBB function during the day to support the exchange of metabolites across the BBB, consistent with the activation pattern of the majority of MCH neurons during daytime (Cuddapah et al., 2019, Pan and Kastin, 2001). Interestingly, sleep restriction, which presumably alters MCH neuron activity, has been shown to modulate BBB permeability, although to a different extent based on the protocols used (Gómez-González et al., 2013, He et al., 2014). Moreover, sleep deprivation has been linked to the development of leptin resistance in the ARC, although the potential contribution of reduced leptin transport to the CNS has not been addressed in this study (Hakim et al., 2015). Thus, future studies are clearly warranted to directly investigate the functional contribution of MCH neuron regulation in the sleep-dependent control of BBB permeability and leptin sensitivity.
Given, the wide projections of MCH neurons throughout multiple sites within the CNS, including the hippocampus, as well as the profound effects of VEGF in learning and memory, MCH-neuron-dependent VEGFA release may have further reaching implications beyond the regulation of BBB permeability and associated changes in metabolic homeostasis.
Finally, our single-nuclei sequencing experiments revealed the detection of at least four molecularly distinct clusters of hypothalamic MCH neurons. Here, cluster 0 was characterized by the highest level expression of Cartp as a well-defined feeding regulatory peptide. These data are consistent with studies in which chemogenetic activation of Cartp-expressing neurons in the LHA stimulates food intake (Farzi et al., 2018). The same cluster was characterized by the expression of genes associated with VEGFA signaling, indicating that the feeding-regulatory MCH neurons may also directly regulate BBB permeability. Clearly, future studies will have to use more detailed functional analyses to investigate the activity of these MCH neuron subtypes across different sleep cycles as well as in different nutritional states and, ultimately, define their potentially distinct physiological effector pathways.
Collectively, the results of our study assign MCH neurons a role in regulating ME permeability and to modulate gating of energy-sensing-hormones to the ARC, as exemplified for leptin. Future studies have to define whether this regulation also modulates the accessibility of the ARC for other periphery-born factors and may, thus, define a novel route for how, through manipulating MCH neurons, the altered transport of energy-state-sensing hormones to the CNS, as observed in obesity, may be overcome (El-Haschimi et al., 2000).
STAR★Methods
Key Resources Table
| REAGENT or RESOURCE | SOURCE | IDENTIFIER |
|---|---|---|
| Antibodies | ||
| GFP Polyclonal | Thermo Fisher Scientific | Cat#A-6455; RRID:AB_221570 |
| Living Colors® DsRed Polyclonal | Takara Bio | Cat#632496; RRID:AB_10013483 |
| Anti-Vimentin | Millipore | Cat#AB5733; RRID:AB_11212377 |
| Recombinant Anti-VEGF | Abcam | Cat#ab52917; RRID:AB_883427 |
| Living Colors® Full-Length ZsGreen Polyclonal | Clontech | Cat#632474; RRID:AB_2491179 |
| Phospho-STAT3 (Tyr705) | Cell Signaling | Cat#9145; RRID:AB_2491009 |
| Goat anti-Rabbit, Alex488 | Thermo Fisher Scientific | Cat#A-11008; RRID:AB_143165 |
| Goat anti-Chicken, Alex 641 | Thermo Fisher Scientific | Cat#A-21449; RRID:AB_2535866 |
| Goat anti-Rat, Alex594 | Thermo Fisher Scientific | Cat#A-11007; RRID:AB_10561522 |
| Phospho-S6 (Ser244, Ser247) | Invitrogen | Cat#44-923G; RRID:AB_2533798 |
| Chemicals, Peptides, and Recombinant Proteins | ||
| Clozapine N-oxide | abcam | Cat#ab141704 |
| Recombinant murine leptin | Peprotech | Cat#450-31 |
| Axitinib | Sigma-Aldrich | Cat#PZ0193 |
| Evans Blue | Sigma Aldrich | Cat#E2129 |
| Protease inhibitor EDTA free | Roche | Cat#1183617001 |
| RNAin | Promega | Cat#N2515 |
| Cycloheximide | Applichem | Cat#A0879,0001 |
| PhosSTOP | Sigma Aldrich | Cat#04906837001 |
| Calyculin A | Cell Signaling | Cat#9902S |
| DHPC | Avanti | Cat#850306p |
| Trizol | Life Technologies | Cat#10296-010 |
| Glycogen | Invitrogen | Cat#AM9510 |
| Protein A Dynabeads | Invitrogen | Cat#10002D |
| DNase I (Rnase-free) | Invitrogen | Cat#AM2223 |
| HEPES | Applichem | Cat#A3724,0500 |
| MgCl2 | Sigma Aldrich | Cat#M9272 |
| RNase Zap | Invitrogen | Cat#AM9780/9782 |
| HBSS | GIBCO | Cat#14175-053 |
| NaHCO3 | Carl Roth | Cat#6885.2 |
| Glucose | Applichem | CAS#14431-43-7 |
| KCl | Sigma Aldrich | Cat#p9541 |
| EDTA | Sigma Aldrich | Cat#E6758 |
| NP-40 | Sigma Aldrich | CAS# 9016-45-9 |
| Buprenorphine | Bayer | PZN 01498870 |
| Isofluran | CP-pharma | Isofluran-1mg/ml |
| Tramal | Grünenthal Gmbh | Cat#95005446 |
| Meloxicam | Boehringer Ingelheim | Metacam®, 2 mg/ml |
| PFA | Sigma Aldrich | CAS#30525-89-4 |
| Sucrose | Sigma Aldrich | CAS#57-50-1 |
| Acetone | VWR chemicals | CAS#67-64-1 |
| Ethanol | VWR chemicals | CAS#64-17-5 |
| Methanol | VWR France | CAS#9005-64-5 |
| DAPI | Thermo Fisher Scientific | Cat#62248 |
| DPBS (1x) | GIBCO Life Technologies | Cat#14190-094 |
| Dimethyl sulfoxide (DMSO) | Millipore | CAS#67-68-5 |
| Critical Commercial Assays | ||
| TSA Plus Fluorescence kit | Perkin Elmer | Cat#NEL741001KT |
| EZ PREP buffer | Sigma Aldrich | Cat#NUC-101 |
| Fluorescence Kit v2 for RNA scope | ACD RNAScope® | Cat#323100 |
| Rat/Mouse Ghrelin (Active) ELISA kit | Merck Millipore | Cat#EZRGRA-90K |
| Mouse Leptin ELISA kit | Crystal Chem | Cat#90030 |
| Ultra Sensitive Mouse Insulin ELISA kit | Crystal Chem | Cat#90080 |
| Mouse Corticosterone ELISA Kit | Crystal Chem | Cat#80556 |
| Chromium Single Cell 3′ Reagent Kits v3 | 10x Genomics | Cat#1000092 and 1000074 |
| VEGFA probe for RNAscope | ACD RNAScope® ISH Technology | Cat#412261-C3 |
| MCH probe for RNAscope | ACD RNAScope® ISH Technology | Cat#478721-C1 |
| MCHR1 probe for RNAscope | ACD RNAScope® ISH Technology | Cat#317491-C1 |
| DARPP32 probe for RNAscope | ACD RNAScope® ISH Technology | Cat#405901-C2 |
| Deposited Data | ||
| RNA-Seq data | This study | GEO: GSE146019 |
| Single-nucleus sequence | This study | GEO: GSE146020 |
| Experimental Models: Organisms/Strains | ||
| MCH-Cre | Kong et al., 2010 | N/A |
| ChR2-EYFP fl/fl | Jackson Laboratory | Strain#012569 |
| hM3Dq fl/fl | Steculorum et al., 2016 | N/A |
| ChR2-tdTomato fl/fl | Jackson Laboratory | Strain#012567 |
| Synaptophysin-tdTomato fl/fl | Jackson Laboratory | Strain#012570 |
| ZsGreen fl/fl | Löhr et al., 2018 | N/A |
| tdTomato fl/fl | Jackson Laboratory | Strain#021876 |
| Oligonucleotides | ||
|
MCH-SF for MCH-Cre line 5′ GAA AAG ATA AGG CCT TCA AGT GCT |
Eurogentec Germany | N/A |
|
MCH-SR for MCH-Cre line 5′ GAT CTT TCT GCA GTA TCT TCC TTC |
Eurogentec Germany | N/A |
|
CRE-FR for MCH-Cre line 5′ATC GAC CGG TAA TGC AGG CAA |
Eurogentec Germany | N/A |
|
CAGS_Fow for ROSA26 flox line 5′ AAAGTCGCTCTGAGTTGTTATC |
Eurogentec Germany | N/A |
|
CAGS_ RevWT for ROSA26 flox line 5′ GATATGAAGTACTGGGCTCTT |
Eurogentec Germany | N/A |
|
CAGS_ RevCAGS for ROSA26 flox line 5′ TGTCGCAAATTAACTGTGAATC |
Eurogentec Germany | N/A |
| Software and Algorithms | ||
| ImageJ (Version 2.0.0-rc-43/1.50e) | https://imagej.net/Welcome | https://imagej.nih.gov/ij/download.html |
| GraphPad Prism (Version 8 for Mac) | https://www.graphpad.com/scientific-software/prism/ | https://www.graphpad.com/scientific-software/prism/ |
| R | The R Foundation for Statistical Computing c/o Institute for Statistics and Mathematics Wirtschaftsuniversität Wien |
http://www.rproject.org |
| Loupe Cell Brower (Version 3.0.1) | 10x Genomics | https://support.10xgenomics.com/single-cell-gene-expression/software/visualization/latest/what-is-loupe-cell-browser |
| Equipment | ||
| Mono Fiberoptic Cannula | Doric Lenses Inc. | MFC_200/230-0.48_6.0mm_SM3(P)_FLT |
| Mono Fiberoptic Patchcord | Doric Lenses Inc. | MFP_200/230/900-0.48_0.32m_FC-CM3(P) |
| Fiberoptic Rotary Joint | Doric Lenses Inc. | FRJ_1x1_FC-FC |
| Homogenization Cylinder (borosilicate glass) | Sartorius | Cat# BBI-8542309 |
Resource Availability
Lead Contact
Further information and requests for resources and reagents should be directed to and will be fulfilled by the lead contact, Jens C. Brüning (bruening@sf.mpg.de).
Materials Availability
This study did not generate new unique reagents
Data and Code Availability
PhosphoRiboTrap sequencing data generated in this study are available under GEO accession “GSE146019”
Single nucleus sequencing data generated in this study are available under GEO accession “GSE146020.”
Experimental Model and Subject Details
Animals and Husbandry
All animal procedures were conducted in compliance with protocols approved by the local authorities (Bezirksregierung Köln) and were in accordance with NIH guidelines. Mice were housed at 22–24°C with 12 hr light/dark cycle. Animals had ad libitum access to water and a standard rodent chow (ssniff V1554, 59494 Soest, Germany). Mice were housed in individually ventilated cages (IVCs). For leptin sensitivity experiments, mice were single housed and littermates of animals from the same breedings were randomly assigned to the order of experimental treatments. All studies, except the study using Synaptophysin-tdTomatoMCH and hM3DqMCH mice for electron microscopy and investigation of MCH effect on tanycyte culture signaling, which were performed in Lille, France in the laboratory of Dr. Vincent Prevot and approved by the French Ministere de l’Education Nationale, de l’Enseignement Superieur et de la Recherche (APAFIS#2617-2015110517317420 v5) and Ca2+ imaging experiments, which were performed at the University of Lübeck in the laboratory of Prof. Markus Schwaninger, were conducted at the Max Planck Institute for Metabolism Research, Cologne, NRW, Germany.
Mouse lines
MCH-Cre mice
This line was kindly provided by the lab of Bradford B. Lowell (Kong et al., 2010). The animals were maintained by backcrossing them on a C57BL/6N background.
hM3DqMCH mice
MCH-Cre mice were mated with hM3Dq fl/fl mice, which express hM3Dq in a Cre-dependent manner from the ROSA26 locus (Steculorum et al., 2016).
ChR2-eYFPMCH and ChR2-tdTomatoMCH mice
B6;129S-Gt(ROSA)26Sortm32(CAG-COP4∗ChR2(H134R)EYFP) Ai32 and B6;129S-Gt(ROSA)26Sortm32(CAG-COP4∗ChR2(H134R)tdTomato) Ai27 mice were obtained from Jackson laboratory (Stock number # 012569 and 012567) (Madisen et al., 2012). Homozygous ChR2-eYFP+/+ or ChR2-tdTomato+/+ mice were mated with MCH-Cre tg/wt mice to generate the ChR2-eYFPMCH and ChR2-tdTomatoMCH mice.
Synaptophysin-tdTomatoMCH mice
B6;129S-Gt(ROSA)26Sortm34.1(CAG-Syp/tdTomato)Hze/J mice were obtained from Jackson laboratory (stock number #012570) (Zeng H. 2011; Direct Data Submission 2011/04/15). The homozygous mice were mated with MCH-Cre tg/wt mice to generate Synaptophysin-tdTomatoMCH mice.
ZsGreenMCH mice
R26-fl-rxΔ-ZsGreen mice have been previously described (Löhr et al., 2018). Homozygous mice were mated with MCH-Cre tg/wt mice to generate ZsGreenMCH mice.
tdTomatoMCH mice
tdTomato reporter mice were obtained from Jackon laboratory (B6;129S6-Gt(ROSA)26Sortm9(CAG-tdTomato)Hze/J) (Madisen et al., 2012). The homozygous mice were mated with MCH-Cre tg/wt mice to generate tdTomatoMCH mice.
All the mouse experiments in this study were using male mice on a C57BL/6N background (Charles River, Laboratories (Sulzfeld, Germany)) at the age of 10-16 weeks, unless otherwise mentioned.
Method Details
Evans Blue diffusion assay and barrier permeability assay
The procedure was performed as previously described (Langlet et al., 2013, Mullier et al., 2010). hM3DqMCH and ChR2-tdTomatoMCH and their corresponding litter mates at the age of 15 weeks were fasted for 16 hr (from 6pm to 10am next morning). After 12 hr of fasting, mice were intraperitoneally (i.p.) injected with CNO (3mg/kgBW) or photostimulated, (3.5 hr). After 15 hr 40 min fasting time, mice were injected with sterile 1% Evans Blue dye (Sigma) in 0.9% saline by tail vein injection and sacrificed by decapitation 20 min later. Brains were acutely removed and embed in O.C.T and frozen in cold isopentane with liquid nitrogen (−55°C). The frozen brain were cut into 10 μm-sections and directly imaged under a fluorescence microscope. For assessment of MECA-32 and ZO-1 immunoreactivity via IHC, different cohorts of animals received the same treatment. However, the frozen brains were cut into 20 μm-sections and stored in the −80°C until processing barrier immunofluorescence staining.
The protocol for barrier immunofluorescence staining has been described previously (Mullier et al., 2010), but primary antibodies used were MECA-32 (1:500, 550563, BD biosciences); ZO-1 (1:400, 61-7300, Thermo Fisher Scientific); Vimentin (1:2000, AB5733, Millipore) and secondary antibodies were goat anti-Rat Alex594 (1:500, A11007, Thermo Fisher Scientific), goat anti-Chicken Alex641 (1:500, A21449, Thermo Fisher Scientific); goat anti-Rabbit Alex488 (1:500, A11008, Thermo Fisher Scientific).
Chemogenetic MCH neuron activation for food intake and leptin sensitivity studies in vivo
hM3DqMCH mice and control littermates at the age of 10-13 weeks were single housed with food hoppers and handled for at least 3 days before the experiment started. At the experimental days, mice were fasted for 16 hr, and then given CNO (ab141704, abcam, dissolved in 1.5% DMSO, 3mg/kg body weight) via i.p. injection after 12 hr of fasting. At the time points of 16 hr fasting, mice were given saline or leptin injection (450-31, Peprotech, dissoved in saline, 6 mg/kg body weight) and 30 min later, mice were refed and food intake for each cage was measured at the 1 hr and 4 hr post-refeeding time. The mice treated with saline or leptin, in the following week were cross treated with leptin or saline. Saline treated food intake data were calculated for food intake comparison between genotypes. For individual animal, comparison between saline treated food intake and leptin treated food intake was calculated as a leptin sensitivity index.
Insulin tolerance test (ITT)
Insulin tolerance test was performed in 16 hr fasted mice. Mice were given i.p. CNO (3 mg/kg body weight) 4 hr before basal blood glucose level measurement. Mice were given i.p. injection with insulin (0.38 I.E./kg body weight, Lilly Deutschland GmbH, PNZ 02526396) and glucose concentrations in blood were measured after 15, 30 and 60 min employing a automatic glucose monitor (Bayer HealthCare Ascensia Contour).
Glucose tolerance test (GTT)
Glucose tolerance tests was performed as described for the ITT, but mice were given i.p. Glucose (20%, 10 ml/kg body weight) instead of insulin, and blood glucose concentration in blood were measured after 15, 30, 60 and 120 min.
Stereotactic Surgery
ChR2-tdTomatoMCH and control littermates at the age of 9 weeks were single housed in preparation for stereotactic surgeries of optogenetic fiber implantation. Animals were anesthetized with isofluran and placed into a stereotaxic apparatus. The stereotaxic coordinate was: AP −1.4 mm; DV 5.8 mm; ML 0 mm. Fiberoptic cannulas were obtained from Doric Lenses Inc (fiber core = 200 μm, NA = 0.48, length = 6mm, flat tip). Optical fiber was implanted above the median eminence at the stereotaxic coordinate described above and fixed to the skull with dental acrylic. Animals were i.p. injected with buprenorphine (PZN01498870, Bayer, 0.1 mg/kgBW) during the operation period and meloxicam (5 mg/kg bodyweight) was given subcutaneously (s.c.) for the analgesia in the first hour post-surgery and Tramadol was provided in the drinking water (1 mg/ml) twice a day during post-surgery periods for consecutive three days. Body weights were continuously monitored during recovery.
hM3DqMCH mice and control littermates at the age of 9 weeks underwent through same surgery for optical fiber implantation in control experiments.
After 1 week of post-surgery recovery, mice were adapted to optogenetic cages (TSE systems) or homecage with food hopper for another week and body weights were monitored every two days.
In vivo optogenetics
Fiber-implanted ChR2-tdTomatoMCH mice and control littermates were connected to patch-cords before the experiments. Mice were fasted 16 hr (from 6pm to 10am next morning), at the time points of 12 hr fasting, mice received the light illumination (pulse duration 10 μs, frequency 10 Hz, 1 s stimulation in every 5 s, 10 mW) for three and half hr. At the 16 hr fasting time, mice were given saline or leptin (6 mg/kg body weight) i.p. injection. 30 min later, mice were refed and food intake for each cage was measured at the 1 hr and 4 hr post-refeeding time. The mice treated with saline or leptin, were cross-treated with leptin or saline in the following week. At the end of experiment, all the mice were perfused with 4% PFA, brains were post-fixed and cryoprotected in 20% sucrose. The brains were frozen and cut for fiber placement validation. Only the data with correct placement of fiber implantation was included in the analysis. Data analysis was performed as described for chemogenetic experiment.
Axitinib treatment
Male hM3DqMCH mice at the age of 10-14 weeks were used for this experiment. Mice were fasted starting at 6 p.m. Axitinib (PZ0193, Sigma, 25 mg/kgBW in PEG/H2O 3:7 mixed, PH 2.5) or vehicle (PEG/H2O 3:7 mixed, PH 2.5) were injected i.p. at 5 a.m. (after 11 hr of fasting), CNO (3 mg/kgBW) was injected to all mice at 6 a.m. (after 12 hr of fasting). Leptin (6 mg/kgBW) or saline were injected i.p. at 10 a.m. (after 16 hr of fasting). 30 min after leptin/saline injection, mice were refed and food intake was monitored 1 hr and 4 hr after refeeding. In the following three weeks, mice were given cross-over injections with either vehicle/axitinib or saline/leptin.
Nuclear isolation for single nucleus sequencing
The nuclear isolation method was modified from Habib et al. (2017). Hypothalami of ZsGreenMCH mice were dissected and collected into 1ml of ice-cold EZ PREP buffer (D8938, Sigma). The tissue was homogenized with a glass dounce, twice at 250 rpm and 12 times at 1000 rpm and incubated on ice for 5 min. Nuclei were centrifuged at 500 g, 5 min after addition of 4 mL of nuclear lysis buffer and incubated on ice for 5 min. The supernatant was discarded and the pellet was resuspended in 4 mL nucleus suspension buffer (NSB, 1x PBS, 0.01% BSA, and 0.1% RNase inhibitor (352235, Clontech). Nuclei were centrifuged at 500 g for 2 min. The supernatant was discarded and isolated nuclei were resuspended in 300 μl NSB and then filtered through a 30 μm cell strainer into sorting tubes for flow cytometry sorting on a BD FACSAria IIIu.
Single nucleus sorting by flow cytometry
Nuclei suspension from ZsGreenMCH mice was stained with DAPI (1:1000, 62248, Thermo Fisher Scientific) as nuclear marker. ZsGreen positive nuclei + DAPI positive nuclei were collected as MCH neuron nuclei. A FACSAria IIIu was used for gating and sorting nuclei. Single nuclei were identified based on side scatter (SSC-A) and DAPI fluorescence (area versus width). ZsGreen fluorescence was detected with 488 nm excitation and 530 nm emission. Sorting was performed at 4°C with a 70 μm nozzle. Sorted ZsGreen positive nuclei were collected into 1xPBS buffer with 0.04% BSA for 10x genomics single cell sequencing.
Single nucleus sequencing and analysis
For snRNA library construction, Chromium Single Cell 3′ Reagent Kits v3 were used. The Single Cell 3′ Protocol upgrades short read sequencers to deliver a scalable microfluidic platform for 3′ digital gene expression profiling of up to 10,000 individual nuclei per sample. The 10x GemCode Technology samples a pool of ~750,000 barcodes to separately index each cell’s transcriptome. It does so by partitioning thousands of cells into nanoliter-scale Gel Bead-In-EMulsions (GEMs), where all generated cDNA share a common 10x Barcode. Libraries were generated and sequenced from the cDNA and the 10x Barcodes were used to associate individual reads back to the individual partitions.
Single nucleus suspensions in 1xPBS containing 0.04% BSA (700-1200 nuclei/μl) were checked for viability which should ideally exceed 75% and be free of debris and cell aggregates. To achieve single cell resolution, the cells were delivered at a limiting dilution, such that the majority (~90- 99%) of generated GEMs contains no cell, while the remainder largely contain a single cell. Upon dissolution of the Single Cell 3′ Gel Bead in a GEM, primers containing (i) an Illumina R1 sequence (read 1 sequencing primer), (ii) a 16 bp 10x Barcode, (iii) a 12 bp Unique Molecular Identifier (UMI) and (iv) a poly-dT primer sequence were released and mixed with cell lysate and Master Mix. Incubation of the GEMs produced barcoded, full-length cDNA from poly-adenylated mRNA. After incubation, the GEMs were broken and the pooled fractions were recovered. Silane magnetic beads were used to remove leftover biochemical reagents and primers from the post GEM reaction mixture. Full-length, barcoded cDNA was amplified by PCR to generate sufficient mass for library construction. Enzymatic fragmentation and size selection were used to optimize the cDNA amplicon size prior to library construction. R1 (read 1 primer sequence) were added to the molecules during GEM incubation. P5, P7, a sample index and R2 (read 2 primer sequence) were added during library construction via End Repair, A-tailing, Adaptor Ligation and PCR. The final libraries contained the P5 and P7 primers used in Illumina bridge amplification. A Single Cell 3′ Library comprised standard Illumina paired-end constructs which begin and end with P5 and P7. We allocated Illumina NovaSeq6000 S2 flowcells to sequence with the first read 28nt (cell specific barcode and UMI) and generated with the second read 90nt 3′mRNA transcriptome data. Using the v3 version of chemistry, 25k reads/nucleus were sufficient to allow comprehensive snRNA analysis.
PhosphoRiboTrap Preparation
Mice were sacrificed by decapitation. Hypothalamus sections were rapidly dissected in ice-cold 1xHBSS using a stainless brain matrix (World Precision Instruments). Arcuate nucleus and ME regions were collected into EP tubes and acutely frozen on liquid nitrogen. Collected tissues were stored at −80°C until further use.
Samples were transferred to a homogenization cylinder (Sartorius) with 1ml homogenization buffer (10 mM HEPES, 150 mM KCl, 5 mM MgCl2, 2.5 mM DTT, 1/4 tablet/ml Protease inhibitors (EDTA free), 100 units/ml RNAsin, 250 μg/ml Cycloheximide, 1 tablet/10 mL PhosSTOP, 100 nM Calyculin A). Samples were homogenized 2 times at 250 rpm, and 9 times at 750 rpm. Homogenates were transferred to Eppendorf tubes and clarified at 2,000 g for 10 min, at 4°C. Supernatants were transferred to a new EP tube on ice and 70 μL of 10% NP40 (Sigma Aldrich) and 70 μL of 1,2-dihexanoyl-sn-glycero-3-phosphocholine (DHPC, Avanti) were added. This solution was mixed by inversion, incubated on ice for 2 min and clarified by centrifugation at 17,000 g for 10 min at 4°C. The harvested supernatant was transferred to a new EP tube, 50 μL was removed to another new EP tube, 950 μL Trizol and 50 μL glycogen (5 mg/ml) were added. This sample was incubated on ice as input. 20 μL pphospho-S6 244/247 antibody (44-923G, Invitrogen) were added to the remaining harvested supernatant and mixed well. Sample-antibody solution was incubated on ice for 1.5 hr at 4°C with gentle rotation. 100 μL Protein A Dynabeads per sample was washed 3 times with washing buffer 0.15 M (10 mM HEPES, 150 mM KCl, 5 mM MgCl2, 1% NP40). The “sample-antibody” was added into the beads and incubated for 1 hr, at 4°C with gentle rotation. Sample-antibody solution was quick spinned for 2 s and placed on the cold magnet for washing 4 times with washing buffer 0.35 M (10 mM HEPES, 350 mM KCl, 5 mM MgCl2, 1% NP40, 1.25 mM DTT, 100 units/ml RNAsin, 125 μg/ml Cycloheximide, 50nM Calyculin A). Beads were collected by magnetic absorption. After the last wash, the supernatant was removed and 1 mL Trizol was added to the beads and gently resuspended by pipetting and incubated on ice for 5 min. Input and IP RNA were isolated and purified by the following steps. 200 μL CHCl3 was added to the samples, vortexed thoroughly and incubated in room temperature for 5 min. The samples were centrifuged at 12,200 g for 10 min at 4°C. The aqueous phase was collected and added to 550 μL of ice cold isopropanol and incubated on ice for 15 min for RNA precipitation. The samples were centrifuged at speed of 12,200 g for 15 min at 4°C. The precipitated RNA was washed by adding 1 mL of ice cold 80% ethanol and centrifuged at speed of 7,500 g for 15 min at 4°C. Ethanol was discarded and the RNA was DNasel digested (30 μL nuclease free water dissolved-RNA pellet, 3.7 μL DNase 10X buffer, 2 μL RNAsin inhibitor and 2 μL DNasel) for 30 min at 37°C. DNasel was deactivated by thorough vortexing. RNA concentrations were assessed employing the Invitrogen Qbit System and were stored in −80°C until being sent for RNA bulk sequencing.
RNA bulk sequence
Pre-amplification using the Ovation RNASeq System V2 was performed. Total RNA was used for first strand cDNA synthesis, using both poly(T) and random primers, followed by second strand synthesis and isothermal strand-displacement amplification. For library preparation, the Illumina Nextera XT DNA sample preparation protocol was used, with 1 ng cDNA input. After validation (Agilent 2200 TapeStation) and quantification (Invitrogen Qubit System) all 24 transcriptome libraries were pooled. The pool was quantified using the Peqlab KAPA Library Quantification Kit and the Applied Biosystems 7900HT Sequence Detection and sequenced on a Illumna NovaSeq S2 flowcell with a PE100 protocol. The RNA sequencing pipeline utilizes the GRCm38 assembly of the mouse genome as gene sets from Ensembl release 96 (Yates et al., 2015). We quantified the gene expression of each sample by (1) aligning the RNA-sequencing reads to the mm10 reference genome using hisat 2.1.0 (Kim et al., 2015). (2) computationally depleted rRNA reads using samtools 1.8.0 (Li et al., 2009) and (3) transcript assembly and quantification as well as differential analysis between the experimental conditions using the cufflinks 2.2.1 suite (Trapnell et al., 2010). Genes are denoted as statistically significant using the standard cuffdiff cutoff (). The Gene Ontology (GO) (Trapnell et al., 2010) term analysis based on the differentially expressed genes was carried out using Huang et al., 2009a, Huang et al., 2009b).
Fluorescence Immunostaining
Adult mice from ChR2-eYFPMCH and Synaptophysin-tdTomatoMCH lines were perfused with 4% PFA in PBS. Brains were postfixed with 4% PFA for 4 hr and incubated in 20% sucrose in PBS overnight for cryoprotection. Frozen brains were cut on a cryostat and the sections were kept in anti-frozen medium. The floating sections were stained with GFP antibody (A6455, Thermo Fisher Scientific, 1:1000, Rabbit) for ChR2-eYFPMCH mice and DsRed (632496, Clontech, 1:1000, Rabbit) for Synaptophysin-tdTomatoMCH mice. Brains were co-stained with anti-Vimentin (AB5733, Merck Millipore, 1:2000, Chicken) and DAPI (62248, Thermo Fisher Scientific, 1:1000). Staining procedure was performed as previously described (Hausen et al., 2016). Secondary antibodies: goat anti-Rabbit, Alex488 (A11008, Thermo Fisher Scientific); goat anti-Chicken, Alex 641 (A21449, Thermo Fisher Scientific). For pStat3 analysis, hM3DqMCH mice and control litter mates at the age of 10-13 weeks were treated with leptin treatment for 45 min. Mice were perfused with 2% PFA in PBS. Removed brains were postfixed with 2% PFA for 2 hr and incubated in 20% sucrose in PBS overnight for cryoprotection. Every fourth section throughout the Arc was processed for pSTAT3 staining. Immunostaining procedure and pSTAT3 antibody were performed as previously described (Timper et al., 2017).
For alternative assessment of leptin signaling, hM3DqMCH mice and control littermates at the age of 10-13 weeks were treated with leptin for 15 min. Mice were decapitated acutely 15 min after leptin injection. Brains were acutely removed and embed in O.C.T and frozen in cold isopentane with liquid nitrogen (−55°C). The frozen brain were cut into 20 μm-sections. Sections were fixed in 2% PF (paraformaldehyde) made in Phosphate Buffer, pH = 7.4 for 45-60 min and then rinsed in 0.02 M KPBS. Pretreatment of sections in 0.5% NaOH + 0.5% H2O2 (in 0.02M KPBS) for 20 min at room temperature, then sections were rinsed in 0.02 M KPBS for 5 min, 5 times. 0.3% Glycine (in 0.02M KPBS) for 10 min at room temperature, Then were rinsed again in 0.02M KPBS for 5 min, 5 times. After that, sections were rinsed with 0.03% SDS (in 0.02M KPBS) for 10 min at room temperature and then rinsed in 0.02M KPBS for 5 min, 5 times. Sections were incubated in blocking solution (4% Normal Goat Serum (NGS) + 0.3% Triton X-100 in 0.02M KPBS) for 30 min at room temperature. After blocking, primary antibody: Rabbit anti-pSTAT3 (Tyr 705) (Cell Signaling Ref# 9131) was diluted respectively at 1:1000 in blocking solution and incubated sections for 48 hr at 4°C. Samples were rinsed with 0.02M KPBS for 5 min, 5 times and samples were incubated with secondary antibody (goat anti-Rabbit Alexa-568 and goat anti-Rat Alex-488) diluted at 1:500 in blocking solution for 2 hr at room temperature. Samples were rinsed again afterward with 0.02M KPBS for 5 min, 5 times and counterstained with Hoechst (1:10000 in 0.02M KPBS) for 3 min at room temperature and rinsed again and covered with coverslip slightly. Samples were kept at 4°C until imaging.
tdTomatoMCH reporter mice were perfused and stained similar to ChR2-eYFPMCH-Cre and Synaptophysin-tdTomatoMCH, but primary antibodies used were NeuN (ABN91, Merck Millipore) and VEGF antibody (ab52917, Abcam).
In situ hybridization
Fluorescence in situ hybridization for simultanous detection of tdTomato and VEGFA, MCHR1 and DARPP32 was performed using RNAscope assays as previously described (Brandt et al., 2018). The tdTomato probe constitutes 20 oligo pairs, and targeted region 7-1382 (317041-C2, ACD RNAscope®), the VEGFA probe constitutes 20 oligo pairs and target region 946-2156 (Acc. No: NM_001025257.3, 412261-C3, ACD RNAscope®), The MCHR1 probe constitutes 20 oligo pairs, and targeted region 924-2145 (317491-C1, ACD RNAscope®). DARPP32 consititutes 20 oligo pairs and targeted regions 590-1674 (405901-C2, ACD RNAscope®).
Imaging and quantification
Images were captured using a confocal Leica TCS SP-8-X microscope Tile scans and Z stacks with optical section-1.0 μm were obtained for the whole ARC and Median Eminence region
For quantification of Evans blue diffusion, the Evans Blue signal was directly visualized and imaged using a 10x objective in the defined region of interest in the ARC. Images from 16 sections of 10 μm thickness per bilateral ARC per animal were taken. The defined area of ~340,000 μm2 under identical imaging settings were isolated from the whole images and the mean gray values were calculated. The averaged value of total gray values from 16 sections per ARC per animal is the value as representative of one animal. For the comparison, the normalized gray value of each animal was normalized to the mean averaged gray value of control animals.
Quantitative analysis for tight junction organization and fenestrated capillary loops was performed as previously described (Langlet et al., 2013). The whole ARC was classified in 4 different zones (see Figure S1). For fenestrated capillary loops, ARC regions from 20 μm sections were imaged under 20x glycerol lens and Z stacks with optical section-1.0 μm for quantification. MECA-32-immunoreactive vessels were visualized in zone 2, zone 3 and zone 4. The total number from zone 2 and zone 3 from 8 sections per ARC per animal were evaluated for statistical comparison. For tight junction organization, ZO-1 staining from 20 μm sections was imaged under 40x oil lens and Z stacks with optical section-1.0 μm for quantification. The ARC and Median Eminence were separately captured without tile scan. The pixel values from 8 sections in zone 2 and zone 3 per ARC per animals were averaged as a representative of one animal.
pSTAT3 positive cells were visualized in the ARC. The number of pSTAT3-positive cells in four different zones in the ARC were manually counted using ImageJ. The total number of ARC represent the sum of the average number of positive cells for sections in zone1-4 with 2-6 sections averaged per zone.
Tanycyte primary cultures
Tanycytes were isolated from tissue explants containing the median eminence and the wall of the third ventricle from 10-day-old Sprague Dawley rats (Janvier, France) as described previously (Prevot et al., 2003). Briefly, tissue chunks were collected in culture medium (DMEM high-glucose medium containing 10% fetal calf serum, 1% penicillin/streptomycin, and 2 mM L-glutamine, Thermo Fisher) on ice and were scraped through a nylon mesh (20 μm, Merck Millipore), centrifuged and resuspended in fresh culture medium. Dissociated cells were plated in 75 cm2 culture flasks and maintained under humid atmosphere of 5% CO2-95% air at 37°C. Culture medium was first changed after 10 days and subsequently every 2-3 days. When cultures reached confluency, cells were passaged using trypsin/EDTA digestion and plated in 6-well plates for experiments. At 70% of confluency, tanycytes were placed into serum-free medium (DMEM/F12 without phenol red, 1% penicillin/streptomycin and 2 mM L-glutamine, all from Thermo Fisher) containing 5 ug/mL insulin (Sigma-Aldrich, USA) and 100 μM putrescine (Sigma-Aldrich, USA) for 2 days. One hour before the experiment started, cells were placed in fresh serum-free medium and treated with MCH 1 μM (Bachem, ref: H-1482) or PBS. After treatment, cells were briefly washed in ice-cold PBS and snap-frozen on dry ice.
Immunoblotting
Cells were lysed in 100 μL in freshly prepared lysis buffer (pH 7.4, 25 mM Tris, 50mM β-glycerophosphate, 1.5 mM EGTA, 0.5 mM EDTA, 1 mM sodium pyrophosphate, 1 mM sodium orthovanadate, 10 mg/ml leupeptin and pepstatin, 10 mg/ml aprotinin, 100 mg/ml phenylmethyl sulfonyl fluoride and 1% Triton X-100). The cells lysates were cleared by centrifugation at 12,000 g for 15 min and protein content was determined using the Bradford method (BioRad, Hercules, CA). We added 4x sample buffer (Invitrogen) and 10x reducing agent (Invitrogen) to the samples and boiled them for 5 min before electrophoresis at 150V for 60 min in precast 3%–8% SDS–polyacrylamide Tris-acetate gels according to the protocol supplied with the NuPAGE system (Invitrogen, Carlsbald, CA). When necessary, the samples were stored at –80°C until use. After size-fractionation, the proteins were transferred onto Nitrocellulose membranes (0.2 mm pore-size membranes; LC2002; Invitrogen) in the blot module of the NuPAGE system (Invitrogen) for 75 min in ice. Membranes were blocked for 1 hr in TBS with 0.05% Tween 20 (TBST) and 5% non-fat milk at room temperature, incubated overnight at 4°C with their respective primary antibodies and washed four times with TBST before being exposed to horseradish peroxidase-conjugated secondary antibodies diluted in 5% non-fat milk-TBST for 1 hr at room temperature. The immunoreactions were detected with enhanced chemiluminescence (NEL101, PerkinElmer, Boston, MA). The mouse monoclonal anti-actin (A5441 Sigma; 1:5,000), rabbit monoclonal anti-phospho-AKT (Ser473; 4060 Cell Signaling; 1:1,000), rabbit monoclonal anti-AKT (4691 Cell Signaling; 1:1,000), rabbit polyclonal anti-phospho- p44/42 MAPK (p-Erk1/2) (9101 Cell Signaling; 1:1,000), rabbit polyclonal anti-p44/42 MAPK (Erk1/2) (9102 Cell Signaling; 1:1,000) were used. Secondary antibodies used for western blotting detection (anti-mouse (1:2,000) and anti-rabbit (1:2,000), all horseradish peroxidase-conjugated) were purchased from Sigma and Vector Laboratories.
cAMP assays
Primary tanycytes were seeded in 12 wells plates; at 70% confluency, cells were placed into serum-free medium (DMEM/F12 without phenol red, 1% penicillin/streptomycin and 2 mM L-glutamine, all from Thermo Fisher) and 5ug/mL insulin and 100 μM putrescine (last two from Sigma-Aldrich, USA)) for 2 additional days. 1 hr before the experiment, cells were placed into fresh serum-free medium and treated with MCH 1 μM (Bachem, H-1482), 0, 15, 30, 60 min in the presence or absence of Forskolin 10 μM (Cell Signaling, 3828), which was added 15 min before stopping treatment. At the end of the treatment, cells were washed 3 times with ice-cold PBS and 600 μL of 1x lysis buffer was added to each well. Then, cAMP levels were assessed following the instructions of the kit’s datasheet (Cell signaling, 4339).
Isolation of hypothalamic tanycytes using Fluorescence Activated Cell Sorting
Median eminences from tat-cre-injected tdTomatoloxP/loxP mice fed ad libitum (n = 8), were microdissected, and enzymatically dissociated using Papain Dissociation System (Worthington, Lakewood, NJ) to obtain single-cell suspensions as described previously (Langlet et al., 2013). FACS was performed using an EPICS ALTRA Cell Sorter Cytometer device (Beckman Coulter, Inc.). The sort decision was based on measurements of tdTomato fluorescence (excitation: 488nm; detection: bandpass 675 ± 20nm) by comparing cell suspensions from tdTomato positive and wild-type animals. For each animal, around 5000 tdTomato positive cells were sorted directly into 10 μL extraction buffer: 0.1% Triton® X-100 (Sigma-Aldrich) and 0.4 U/μl RNaseOUT™ (Life Technologies).
Quantitative RT-PCR analyses
For gene expression analyses, mRNAs obtained from FACS-sorted cells were reverse transcribed using SuperScript® III Reverse transcriptase (Life technologies) and a linear preamplification step was performed using the TaqMan® PreAmp Master Mix Kit protocol (P/N 4366128, Applied Biosystems). Real-time PCR was carried out on Applied Biosystems 7900HT Fast Real-Time PCR System using exon-boundary-specific TaqMan® Gene Expression Assays (Applied Biosystems): Mchr1 (Mchr1-Mm00653044_m1) and Control housekeeping genes: r18S (rn18S-Mm03928990_g1); ACTB (Actb-Mm00607939_s1). Gene expression data were analyzed using SDS 2.4.1 and Data Assist 3.0.1 software (Applied Biosystem).
Electrone Microscopy
To visualize MCH nerve terminals in the median eminence at the ultrastructural level, we used a preembedding immunogold procedure. Briefly, brains of Synaptophysin-tdTomatoMCH mice were perfusion-fixed with 2% paraformaldehyde, 0.2% picric acid, 0.25% glutaraldehyde in 0.1 M phosphate buffer at room temperature and post-fixed overnight at 4°C. Brains were then, cut into on 80 μm thick coronal sections on a vibratome in 0.1 M PBS. Brain sections underwent aldehyde inactivation in sodium tetrahydroborate (0.1% in PBS) for 15 min, followed by permeabilization with Triton X-100 (30 min, 0.05% in 0.1 M PBS). The tissue was incubated for 40 min in a blocking solution containing 1% of BSA and 1% of normal goat serum before overnight incubation at 4°C in rabbit anti-DsRed antibodiy (632496, Clontech, 1:500, Rabbit) in incubation buffer (Triton 0.01%, BSA 0.1% and normal goat serum in PBS). Sections were then incubatred with ultra-small gold conjugate of F(ab’)2 goat anti-rabbit (1:50, Aurion, 800.166) 2.5 hr at room temperature and post-fixed with 2% of glutaraldehyde 30 min at room temperature. Sections were then washed in Aurion enhancement conditioning solution (500.055). Silver enhancement was performed using Aurion silver enhancement reagents (Aurion R-Gent SE. EM, 500.033) 1 hr at room temperature and sections were postfixed with 0.5% OsO4 in phosphate buffer for 15 min at room temperature.
To determine the effect of the activation of MCH neurons on the fenestration of the ME capillary loops running along the wall of the third ventricle and reaching the ventromedial ARC, CNO-treated hM3DqWT and hM3DqMCH mice were killed by decapitation and tissue fragments containing ME and ARC microdissected under a stereomicroscope and immersion-fixed for 1 hr in 2% paraformaldehyde, 0.2% picric acid, 1% glutaraldehyde in 0.1 M phosphate buffer at room temperature and post-fixed overnight at 4°C. After rinses in 0.1 M phosphate buffer, tissue fragments were postfixed with 1% OsO4 for 1 hr at room temperature.
Tissues were then dehydrated through a graded series of ethanol and propylene oxide and embedded in Araldite. Semithin sections (1–2 μm thickness) were used to progressively approach the ME and ultrathin sections (80–90 nm thickness) of the region of interest were collected on Parlodion 0.8%/isoamyl acetate-coated 100 mesh grids (EMS, Fort Washington, PA). The sections were then counterstained with uranyl acetate and lead citrate before observation. Ultrathin immunolabelled sections were observed using a Zeiss transmission electron microscope 902 (Restec, Zaventem, Belgium) and images were acquired using a Gatan Orius SC1000 CCD camera (Gatan France, Grandchamp, France) at a magnifications of 7,000 x and 20,000x. All ultrastructural analyses were performed in Zone 3 (Bregma −1.82 mm; Figure S1).
Ca2+ imaging in ME slices in vitro
To measure [Ca2+]i in response to ATP, MCH, glutamate and baclofen stimulation in tanycytes, acute brain slices were loaded with Fura-2 AM. Slices were incubated with Fura-2 AM (12.5 μg/ml with 0.5% DMSO and 0.05% pluronic 127, Invitrogen) in low glucose aCSF for 30 min at 37°C. Then, they were incubated in aCSF containing probenecid (1.25 mM, 30 min 37°C) and stored at 4°C before measurement.
[Ca2+]i was measured using a high-speed calcium imaging setup (Till Photonics) mounted on the Axio Examiner D1 upright fluorescent microscope (Zeiss) coupled to the polychrome V monochromator and a high-speed CCD camera (Retiga EXi-blue, QImaging). Data acquisition and quantification were done using life acquisition and offline analysis software (FEI GmbH Munich, formerly Till Photonics). Brain slices were placed in a flow chamber. For the ratiometric measurement of Fura-2 we used excitation wavelengths 340 and 380 nm. Changes in the fluorescence ratio of F340/F380 (ΔF) were normalized to basal mean values of the first 30 s (F0) of each ROI and were shown as (ΔF/F0).
After 1 hr of recovery in the measurement buffer (ACSF; CO2, 5%; O2, 95%; pH, 7.4; flow rate, 2 ml/min) stimuli, ATP, glutamate, baclofen and phaclofen were applied via the bathing medium. MCH was administered directly to the brain slice with a patch pipette. The patch pipette was placed in the lumen of the 3rd ventricle. One min after starting the measurement, MCH (H-1482 from Bachem, 1 mM, 2 μl over 30 s), glutamate (G1626 SIGMA, 100uM), baclofen (0417, Tocris), and ATP (1 mM, 2 μl over 30 s through a glass pipette; or 100 μM during 30 s in the perfusion medium) or ACSF (2 μl over 30 s) were administered to the slice.
Quantification And Statistical Analysis
For qualitative experiments (i.e., Figures 1 and 7), representative images from 3-5 independent reporter mice are shown.
For quantitative analyses, littermates were analyzed. Similar data were obtained in at least two independent cohorts, and the pooled results for the animal numbers indicated in the figure legends are displayed.
All data from animals, which underwent in vivo experiments were collected and included into analysis without any outlier exclusions. Only in optogenetic experiments (Figures 5E, 5F, S5B, S5E, and S5F), data of animals with histologically verified correct fiber placement were included into the analysis. Experiments were performed in non-blinded manner except assessment of circulating hormones (Insulin, Leptin, Ghrelin, and Corticosterone) and insulin and glucose tolerance tests, which were performed in a blinded manner. For paired comparison experiments (i.e., leptin sensitivity and axitinib treatment), animals were randomly assigned among genotypes and treatments in a cross-over design and animals were allowed to recover at least for a week until next treatment.
Data presentation with bar graph was expressed as min to max value and mean value marked as “+” except Figure S6A, which is expressed as mean ± SEM. Data presentation with statistical analysis were conducted using GraphPad Prism (version 8.0). All the data for genotype comparison were analyzed using unpaired, two-tailed Student’s t test, except the leptin sensitivity comparison, where a paired, two-tailed Student’s t test was employed. The data to compare between both groups and genes, or both groups and time points, Two-way ANOVA was used for statistics. All p values below to 0.05 were considered significant. ∗p ≤ 0.05, ∗∗p ≤ 0.01, and ∗∗∗p ≤ 0.001, ∗∗∗∗ p ≤ 0.0001.
Acknowledgments
We are grateful for the help of Sebastian Abele from University of Lübeck and Daniele Mazur from University of Lille during Ca2+ imaging and electron microscopy experiments, respectively. Also, we are grateful for the participation of Dr. Jorge Boucas and Dr. Franziska Metge from the bioinformatics core facility at the Max Planck Institute for Biology of Ageing during initial steps of single nucleus sequencing data analysis and Dr. Astrid Schauss and Dr. Christian Jüngst from the CECAD imaging facility for imaging support. We thank Philipp Hammerschmidt and Dr. Alexander Jais for input on the manuscript. We thank Dr. Matteo Oliverio for graphical abstract design. The research leading to these results has, in part, received funding from a cooperation agreement with Novo Nordisk, Denmark. J.C.B. received funding by the DFG within the framework of the Excellence Initiative by German Federal and State Governments (CECAD). Moreover, the research leading to these results has received funding from the European Union Seventh Framework Program (FP7/2007-2013) under grant agreement no. 266408 to J.C.B. and the European Research Council Synergy Program under grant agreement no. 810331 to V.P. and M.S.
Author Contributions
H.J. and J.C.B. conceived the project, designed the experiments, and wrote the manuscript with input from the other authors. H.J. performed most of experiments and data analysis. S.G. and V.P. performed and analyzed EM and tanycyte culture signaling experiments. S.G. performed and analyzed immunoelectron microscopy stainings. A.L. and V.P. assessed capillary fenestration at the ultrastructural level. P.K. performed the bioinformatic analyses for phosphoRiboTrap data and single-nucleus RNA sequencing data. P.S. performed immunofluorescence staining. J. Alber performed Evans blue tail vein injections. C.H. performed in situ hybridizations. K.F.-D. and C.K. performed flow cytometry. J. Altmüller performed single-nucleus RNA sequencing. S.S. and M.S. performed calcium imaging experiments in vitro slices. All authors discussed the data, commented on the manuscript before submission, and agreed with the final submitted manuscript.
Declaration of Interests
The authors declare no competing interests.
Published: May 13, 2020
Footnotes
Supplemental Information can be found online at https://doi.org/10.1016/j.neuron.2020.04.020.
Supplemental Information
Tg: hM3DqMCH mice; Wt: hM3DqWT mice.
References
- Betley J.N., Xu S., Cao Z.F.H., Gong R., Magnus C.J., Yu Y., Sternson S.M. Neurons for hunger and thirst transmit a negative-valence teaching signal. Nature. 2015;521:180–185. doi: 10.1038/nature14416. [DOI] [PMC free article] [PubMed] [Google Scholar]
- Bittencourt J.C. Anatomical organization of the melanin-concentrating hormone peptide family in the mammalian brain. Gen. Comp. Endocrinol. 2011;172:185–197. doi: 10.1016/j.ygcen.2011.03.028. [DOI] [PubMed] [Google Scholar]
- Blanco-Centurion C., Luo S., Spergel D.J., Vidal-Ortiz A., Oprisan S.A., Van den Pol A.N., Liu M., Shiromani P.J. Dynamic Network Activation of Hypothalamic MCH Neurons in REM Sleep and Exploratory Behavior. J. Neurosci. 2019;39:4986–4998. doi: 10.1523/JNEUROSCI.0305-19.2019. [DOI] [PMC free article] [PubMed] [Google Scholar]
- Brandt C., Nolte H., Henschke S., Engstrom Ruud L., Awazawa M., Morgan D.A., Gabel P., Sprenger H.G., Hess M.E., Gunther S. Food Perception Primes Hepatic ER Homeostasis via Melanocortin-Dependent Control of mTOR Activation. Cell. 2018;175:1321–1335.e1320. doi: 10.1016/j.cell.2018.10.015. [DOI] [PMC free article] [PubMed] [Google Scholar]
- Butler A., Hoffman P., Smibert P., Papalexi E., Satija R. Integrating Single-Cell Transcriptomic Data Across Different Conditions, Technologies, and Species. Nat Biotechnol. 2018;36:411–420. doi: 10.1038/nbt.4096. [DOI] [PMC free article] [PubMed] [Google Scholar]
- Campbell J.N., Macosko E.Z., Fenselau H., Pers T.H., Lyubetskaya A., Tenen D., Goldman M., Verstegen A.M., Resch J.M., McCarroll S.A. A molecular census of arcuate hypothalamus and median eminence cell types. Nat. Neurosci. 2017;20:484–496. doi: 10.1038/nn.4495. [DOI] [PMC free article] [PubMed] [Google Scholar]
- Cao L., Jiao X., Zuzga D.S., Liu Y., Fong D.M., Young D., During M.J. VEGF links hippocampal activity with neurogenesis, learning and memory. Nat. Genet. 2004;36:827–835. doi: 10.1038/ng1395. [DOI] [PubMed] [Google Scholar]
- Ciofi P., Garret M., Lapirot O., Lafon P., Loyens A., Prévot V., Levine J.E. Brain-endocrine interactions: a microvascular route in the mediobasal hypothalamus. Endocrinology. 2009;150:5509–5519. doi: 10.1210/en.2009-0584. [DOI] [PMC free article] [PubMed] [Google Scholar]
- Clarke I.J. Hypothalamus as an endocrine organ. Compr. Physiol. 2015;5:217–253. doi: 10.1002/cphy.c140019. [DOI] [PubMed] [Google Scholar]
- Conductier G., Brau F., Viola A., Langlet F., Ramkumar N., Dehouck B., Lemaire T., Chapot R., Lucas L., Rovère C. Melanin-concentrating hormone regulates beat frequency of ependymal cilia and ventricular volume. Nat. Neurosci. 2013;16:845–847. doi: 10.1038/nn.3401. [DOI] [PubMed] [Google Scholar]
- Cuddapah V.A., Zhang S.L., Sehgal A. Regulation of the Blood-Brain Barrier by Circadian Rhythms and Sleep. Trends Neurosci. 2019;42:500–510. doi: 10.1016/j.tins.2019.05.001. [DOI] [PMC free article] [PubMed] [Google Scholar]
- Diniz G.B., Bittencourt J.C. The Melanin-Concentrating Hormone as an Integrative Peptide Driving Motivated Behaviors. Front. Syst. Neurosci. 2017;11:32. doi: 10.3389/fnsys.2017.00032. [DOI] [PMC free article] [PubMed] [Google Scholar]
- El-Haschimi K., Pierroz D.D., Hileman S.M., Bjørbaek C., Flier J.S. Two defects contribute to hypothalamic leptin resistance in mice with diet-induced obesity. J. Clin. Invest. 2000;105:1827–1832. doi: 10.1172/JCI9842. [DOI] [PMC free article] [PubMed] [Google Scholar]
- Engström Ruud L., Pereira M.M.A., de Solis A.J., Fenselau H., Brüning J.C. NPY mediates the rapid feeding and glucose metabolism regulatory functions of AgRP neurons. Nat. Commun. 2020;11:442. doi: 10.1038/s41467-020-14291-3. [DOI] [PMC free article] [PubMed] [Google Scholar]
- Farzi A., Lau J., Ip C.K., Qi Y., Shi Y.C., Zhang L., Tasan R., Sperk G., Herzog H. Arcuate nucleus and lateral hypothalamic CART neurons in the mouse brain exert opposing effects on energy expenditure. eLife. 2018;7:e36494. doi: 10.7554/eLife.36494. [DOI] [PMC free article] [PubMed] [Google Scholar]
- Fenselau H., Campbell J.N., Verstegen A.M., Madara J.C., Xu J., Shah B.P., Resch J.M., Yang Z., Mandelblat-Cerf Y., Livneh Y., Lowell B.B. A rapidly acting glutamatergic ARC→PVH satiety circuit postsynaptically regulated by α-MSH. Nat. Neurosci. 2017;20:42–51. doi: 10.1038/nn.4442. [DOI] [PMC free article] [PubMed] [Google Scholar]
- Gómez-González B., Hurtado-Alvarado G., Esqueda-León E., Santana-Miranda R., Rojas-Zamorano J.A., Velázquez-Moctezuma J. REM sleep loss and recovery regulates blood-brain barrier function. Curr. Neurovasc. Res. 2013;10:197–207. doi: 10.2174/15672026113109990002. [DOI] [PubMed] [Google Scholar]
- González J.A., Iordanidou P., Strom M., Adamantidis A., Burdakov D. Awake dynamics and brain-wide direct inputs of hypothalamic MCH and orexin networks. Nat. Commun. 2016;7:11395. doi: 10.1038/ncomms11395. [DOI] [PMC free article] [PubMed] [Google Scholar]
- Habib N., Avraham-Davidi I., Basu A., Burks T., Shekhar K., Hofree M., Choudhury S.R., Aguet F., Gelfand E., Ardlie K. Massively parallel single-nucleus RNA-seq with DroNc-seq. Nat. Methods. 2017;14:955–958. doi: 10.1038/nmeth.4407. [DOI] [PMC free article] [PubMed] [Google Scholar]
- Hakim F., Wang Y., Carreras A., Hirotsu C., Zhang J., Peris E., Gozal D. Chronic sleep fragmentation during the sleep period induces hypothalamic endoplasmic reticulum stress and PTP1b-mediated leptin resistance in male mice. Sleep (Basel) 2015;38:31–40. doi: 10.5665/sleep.4320. [DOI] [PMC free article] [PubMed] [Google Scholar]
- Hassani O.K., Lee M.G., Jones B.E. Melanin-concentrating hormone neurons discharge in a reciprocal manner to orexin neurons across the sleep-wake cycle. Proc. Natl. Acad. Sci. USA. 2009;106:2418–2422. doi: 10.1073/pnas.0811400106. [DOI] [PMC free article] [PubMed] [Google Scholar]
- Hausen A.C., Ruud J., Jiang H., Hess S., Varbanov H., Kloppenburg P., Brüning J.C. Insulin-Dependent Activation of MCH Neurons Impairs Locomotor Activity and Insulin Sensitivity in Obesity. Cell Rep. 2016;17:2512–2521. doi: 10.1016/j.celrep.2016.11.030. [DOI] [PubMed] [Google Scholar]
- He J., Hsuchou H., He Y., Kastin A.J., Wang Y., Pan W. Sleep restriction impairs blood-brain barrier function. J. Neurosci. 2014;34:14697–14706. doi: 10.1523/JNEUROSCI.2111-14.2014. [DOI] [PMC free article] [PubMed] [Google Scholar]
- Huang W., Sherman B.T., Lempicki R.A. Bioinformatics enrichment tools: paths toward the comprehensive functional analysis of large gene lists. Nucleic Acids Res. 2009;37:1–13. doi: 10.1093/nar/gkn923. [DOI] [PMC free article] [PubMed] [Google Scholar]
- Huang W., Sherman B.T., Lempicki R.A. Systematic and integrative analysis of large gene lists using DAVID bioinformatics resources. Nat. Protoc. 2009;4:44–57. doi: 10.1038/nprot.2008.211. [DOI] [PubMed] [Google Scholar]
- Izawa S., Chowdhury S., Miyazaki T., Mukai Y., Ono D., Inoue R., Ohmura Y., Mizoguchi H., Kimura K., Yoshioka M. REM sleep-active MCH neurons are involved in forgetting hippocampus-dependent memories. Science. 2019;365:1308–1313. doi: 10.1126/science.aax9238. [DOI] [PMC free article] [PubMed] [Google Scholar]
- Kim D., Langmead B., Salzberg S.L. HISAT: a fast spliced aligner with low memory requirements. Nat. Methods. 2015;12:357–360. doi: 10.1038/nmeth.3317. [DOI] [PMC free article] [PubMed] [Google Scholar]
- Knight Z.A., Tan K., Birsoy K., Schmidt S., Garrison J.L., Wysocki R.W., Emiliano A., Ekstrand M.I., Friedman J.M. Molecular profiling of activated neurons by phosphorylated ribosome capture. Cell. 2012;151:1126–1137. doi: 10.1016/j.cell.2012.10.039. [DOI] [PMC free article] [PubMed] [Google Scholar]
- Komagata N., Latifi B., Rusterholz T., Bassetti C.L.A., Adamantidis A., Schmidt M.H. Dynamic REM Sleep Modulation by Ambient Temperature and the Critical Role of the Melanin-Concentrating Hormone System. Curr. Biol. 2019;29:1976–1987.e1974. doi: 10.1016/j.cub.2019.05.009. [DOI] [PubMed] [Google Scholar]
- Konadhode R.R., Pelluru D., Blanco-Centurion C., Zayachkivsky A., Liu M., Uhde T., Glen W.B., Jr., van den Pol A.N., Mulholland P.J., Shiromani P.J. Optogenetic stimulation of MCH neurons increases sleep. J. Neurosci. 2013;33:10257–10263. doi: 10.1523/JNEUROSCI.1225-13.2013. [DOI] [PMC free article] [PubMed] [Google Scholar]
- Kong D., Vong L., Parton L.E., Ye C., Tong Q., Hu X., Choi B., Brüning J.C., Lowell B.B. Glucose stimulation of hypothalamic MCH neurons involves K(ATP) channels, is modulated by UCP2, and regulates peripheral glucose homeostasis. Cell Metab. 2010;12:545–552. doi: 10.1016/j.cmet.2010.09.013. [DOI] [PMC free article] [PubMed] [Google Scholar]
- Langlet F., Levin B.E., Luquet S., Mazzone M., Messina A., Dunn-Meynell A.A., Balland E., Lacombe A., Mazur D., Carmeliet P. Tanycytic VEGF-A boosts blood-hypothalamus barrier plasticity and access of metabolic signals to the arcuate nucleus in response to fasting. Cell Metab. 2013;17:607–617. doi: 10.1016/j.cmet.2013.03.004. [DOI] [PMC free article] [PubMed] [Google Scholar]
- Li H., Handsaker B., Wysoker A., Fennell T., Ruan J., Homer N., Marth G., Abecasis G., Durbin R., 1000 Genome Project Data Processing Subgroup The Sequence Alignment/Map format and SAMtools. Bioinformatics. 2009;25:2078–2079. doi: 10.1093/bioinformatics/btp352. [DOI] [PMC free article] [PubMed] [Google Scholar]
- Löhr H., Hess S., Pereira M.M.A., Reinoß P., Leibold S., Schenkel C., Wunderlich C.M., Kloppenburg P., Brüning J.C., Hammerschmidt M. Diet-Induced Growth Is Regulated via Acquired Leptin Resistance and Engages a Pomc-Somatostatin-Growth Hormone Circuit. Cell Rep. 2018;23:1728–1741. doi: 10.1016/j.celrep.2018.04.018. [DOI] [PMC free article] [PubMed] [Google Scholar]
- Ludwig D.S., Tritos N.A., Mastaitis J.W., Kulkarni R., Kokkotou E., Elmquist J., Lowell B., Flier J.S., Maratos-Flier E. Melanin-concentrating hormone overexpression in transgenic mice leads to obesity and insulin resistance. J. Clin. Invest. 2001;107:379–386. doi: 10.1172/JCI10660. [DOI] [PMC free article] [PubMed] [Google Scholar]
- Macneil D.J. The role of melanin-concentrating hormone and its receptors in energy homeostasis. Front. Endocrinol. (Lausanne) 2013;4:49. doi: 10.3389/fendo.2013.00049. [DOI] [PMC free article] [PubMed] [Google Scholar]
- Madisen L., Mao T., Koch H., Zhuo J.M., Berenyi A., Fujisawa S., Hsu Y.W., Garcia A.J., 3rd, Gu X., Zanella S. A toolbox of Cre-dependent optogenetic transgenic mice for light-induced activation and silencing. Nat. Neurosci. 2012;15:793–802. doi: 10.1038/nn.3078. [DOI] [PMC free article] [PubMed] [Google Scholar]
- Martínez F., Cifuentes M., Tapia J.C., Nualart F. The median eminence as the hypothalamic area involved in rapid transfer of glucose to the brain: functional and cellular mechanisms. J. Mol. Med. (Berl.) 2019;97:1085–1097. doi: 10.1007/s00109-019-01799-5. [DOI] [PubMed] [Google Scholar]
- Mukouyama Y.S., Shin D., Britsch S., Taniguchi M., Anderson D.J. Sensory nerves determine the pattern of arterial differentiation and blood vessel branching in the skin. Cell. 2002;109:693–705. doi: 10.1016/s0092-8674(02)00757-2. [DOI] [PubMed] [Google Scholar]
- Mullier A., Bouret S.G., Prevot V., Dehouck B. Differential distribution of tight junction proteins suggests a role for tanycytes in blood-hypothalamus barrier regulation in the adult mouse brain. J. Comp. Neurol. 2010;518:943–962. doi: 10.1002/cne.22273. [DOI] [PMC free article] [PubMed] [Google Scholar]
- Noble E.E., Hahn J.D., Konanur V.R., Hsu T.M., Page S.J., Cortella A.M., Liu C.M., Song M.Y., Suarez A.N., Szujewski C.C. Control of Feeding Behavior by Cerebral Ventricular Volume Transmission of Melanin-Concentrating Hormone. Cell Metab. 2018;28:55–68.e57. doi: 10.1016/j.cmet.2018.05.001. [DOI] [PMC free article] [PubMed] [Google Scholar]
- Ogunshola O.O., Antic A., Donoghue M.J., Fan S.Y., Kim H., Stewart W.B., Madri J.A., Ment L.R. Paracrine and autocrine functions of neuronal vascular endothelial growth factor (VEGF) in the central nervous system. J. Biol. Chem. 2002;277:11410–11415. doi: 10.1074/jbc.M111085200. [DOI] [PubMed] [Google Scholar]
- Pan W., Kastin A.J. Diurnal variation of leptin entry from blood to brain involving partial saturation of the transport system. Life Sci. 2001;68:2705–2714. doi: 10.1016/s0024-3205(01)01085-2. [DOI] [PubMed] [Google Scholar]
- Pissios P., Trombly D.J., Tzameli I., Maratos-Flier E. Melanin-concentrating hormone receptor 1 activates extracellular signal-regulated kinase and synergizes with G(s)-coupled pathways. Endocrinology. 2003;144:3514–3523. doi: 10.1210/en.2002-0004. [DOI] [PubMed] [Google Scholar]
- Prevot V., Cornea A., Mungenast A., Smiley G., Ojeda S.R. Activation of erbB-1 signaling in tanycytes of the median eminence stimulates transforming growth factor beta1 release via prostaglandin E2 production and induces cell plasticity. J. Neurosci. 2003;23:10622–10632. doi: 10.1523/JNEUROSCI.23-33-10622.2003. [DOI] [PMC free article] [PubMed] [Google Scholar]
- Prevot V., Dehouck B., Sharif A., Ciofi P., Giacobini P., Clasadonte J. The Versatile Tanycyte: A Hypothalamic Integrator of Reproduction and Energy Metabolism. Endocr. Rev. 2018;39:333–368. doi: 10.1210/er.2017-00235. [DOI] [PubMed] [Google Scholar]
- Rossi M., Choi S.J., O’Shea D., Miyoshi T., Ghatei M.A., Bloom S.R. Melanin-concentrating hormone acutely stimulates feeding, but chronic administration has no effect on body weight. Endocrinology. 1997;138:351–355. doi: 10.1210/endo.138.1.4887. [DOI] [PubMed] [Google Scholar]
- Schaeffer M., Langlet F., Lafont C., Molino F., Hodson D.J., Roux T., Lamarque L., Verdié P., Bourrier E., Dehouck B. Rapid sensing of circulating ghrelin by hypothalamic appetite-modifying neurons. Proc. Natl. Acad. Sci. USA. 2013;110:1512–1517. doi: 10.1073/pnas.1212137110. [DOI] [PMC free article] [PubMed] [Google Scholar]
- Steculorum S.M., Ruud J., Karakasilioti I., Backes H., Engström Ruud L., Timper K., Hess M.E., Tsaousidou E., Mauer J., Vogt M.C. AgRP Neurons Control Systemic Insulin Sensitivity via Myostatin Expression in Brown Adipose Tissue. Cell. 2016;165:125–138. doi: 10.1016/j.cell.2016.02.044. [DOI] [PMC free article] [PubMed] [Google Scholar]
- Timper K., Denson J.L., Steculorum S.M., Heilinger C., Engström-Ruud L., Wunderlich C.M., Rose-John S., Wunderlich F.T., Brüning J.C. IL-6 Improves Energy and Glucose Homeostasis in Obesity via Enhanced Central IL-6 trans-Signaling. Cell Rep. 2017;19:267–280. doi: 10.1016/j.celrep.2017.03.043. [DOI] [PubMed] [Google Scholar]
- Trapnell C., Williams B.A., Pertea G., Mortazavi A., Kwan G., van Baren M.J., Salzberg S.L., Wold B.J., Pachter L. Transcript assembly and quantification by RNA-Seq reveals unannotated transcripts and isoform switching during cell differentiation. Nat. Biotechnol. 2010;28:511–515. doi: 10.1038/nbt.1621. [DOI] [PMC free article] [PubMed] [Google Scholar]
- Varela L., Horvath T.L. Leptin and insulin pathways in POMC and AgRP neurons that modulate energy balance and glucose homeostasis. EMBO Rep. 2012;13:1079–1086. doi: 10.1038/embor.2012.174. [DOI] [PMC free article] [PubMed] [Google Scholar]
- Yang P., Sun X., Kou Z.W., Wu K.W., Huang Y.L., Sun F.Y. VEGF Axonal Transport Dependent on Kinesin-1B and Microtubules Dynamics. Front. Mol. Neurosci. 2017;10:424. doi: 10.3389/fnmol.2017.00424. [DOI] [PMC free article] [PubMed] [Google Scholar]
- Yates A., Beal K., Keenan S., McLaren W., Pignatelli M., Ritchie G.R., Ruffier M., Taylor K., Vullo A., Flicek P. The Ensembl REST API: Ensembl Data for Any Language. Bioinformatics. 2015;31:143–145. doi: 10.1093/bioinformatics/btu613. [DOI] [PMC free article] [PubMed] [Google Scholar]
- Yu G., Wang L.-G., Han Y., He Q.-Y. clusterProfiler: An R Package for Comparing Biological Themes Among Gene Clusters. OMICS. 2012;16:284–287. doi: 10.1089/omi.2011.0118. [DOI] [PMC free article] [PubMed] [Google Scholar]
Associated Data
This section collects any data citations, data availability statements, or supplementary materials included in this article.
Supplementary Materials
Tg: hM3DqMCH mice; Wt: hM3DqWT mice.
Data Availability Statement
PhosphoRiboTrap sequencing data generated in this study are available under GEO accession “GSE146019”
Single nucleus sequencing data generated in this study are available under GEO accession “GSE146020.”