

SUMMARY
The mitochondria-associated degradation pathway (MAD) mediates ubiquitination and degradation of mitochondrial outer membrane (MOM) proteins by the proteasome. We find that the MAD, but not other quality-control pathways including macroautophagy, mitophagy, or mitochondrial chaperones and proteases, is critical for yeast cellular fitness under conditions of paraquat (PQ)-induced oxidative stress in mitochondria. Specifically, inhibition of the MAD increases PQ-induced defects in growth and mitochondrial quality and decreases chronological lifespan. We use mass spectrometry analysis to identify possible MAD substrates as mitochondrial proteins that exhibit increased ubiquitination in response to PQ treatment and inhibition of the MAD. We identify candidate substrates in the mitochondrial matrix and inner membrane and confirm that two matrix proteins are MAD substrates. Our studies reveal a broader function for the MAD in mitochondrial protein surveillance beyond the MOM and a major role for the MAD in cellular and mitochondrial fitness in response to chronic, low-level oxidative stress in mitochondria.
Graphical Abstract

In Brief
Liao et al. find major roles for the MAD in mitochondrial proteostasis, in lifespan control, and in cellular and mitochondrial fitness under basal and mitochondrial oxidative stress conditions, and they identify MAD substrates within mitochondria. These studies reveal broader functions for the MAD in mitochondrial protein surveillance beyond the mitochondrial outer membrane.
INTRODUCTION
Mitochondria are essential for aerobic energy mobilization, synthesis of key macromolecules, Ca2+ homeostasis, and regulation of apoptosis. However, mitochondria are major sources of reactive oxygen species (ROS) (Brookes et al., 2004). Although ROS serve as signaling molecules, excess ROS react with and damage proteins, lipids, and nucleic acids (D’Autréaux and Toledano, 2007). Indeed, ROS-induced oxidative damage increases with age in bacteria (Dukan and Nyström, 1998), yeast (Aguilaniu et al., 2003; Reverter-Branchat et al., 2004), and mammals (Gibson et al., 2010; Hamilton et al., 2001) and is linked to age-related neurodegenerative disease (Federico et al., 2012).
Cells deploy antioxidant enzymes to eliminate excess ROS (Son et al., 2013). In addition, there are quality control pathways that repair or degrade mitochondria: mitochondrial chaperones promote folding of misfolded proteins; mitochondrial proteases and the mitochondria-associated degradation pathway (MAD) degrade misfolded or damaged mitochondrial proteins; and mitochondria are eliminated by mitophagic degradation in the vacuole (the lysosome in metazoans) (Ashrafi and Schwarz, 2013; Braun and Westermann, 2017; Quirós et al., 2015; Youle and Narendra, 2011).
The MAD is similar to the endoplasmic reticulum (ER)-associated degradation pathway (ERAD) (Hirsch et al., 2009). In both cases, unfolded proteins are ubiquitinated, extracted from organelles by a protein complex containing the conserved AAA-ATPase Cdc48p (VCP/p97 in mammals), deubiquitinated, and degraded by the proteasome (Heo et al., 2010; Tanaka et al., 2010; Wu et al., 2016; Xu et al., 2011). Recent studies indicate that the conserved protein Doa1p binds to ubiquitin and Cdc48, is necessary for ubiquitin-mediated degradation, and facilitates the interaction of Cdc48p with ubiquitinated substrates on mitochondria in the MAD (Mullally et al., 2006; Wu et al., 2016). Vms1p has also been implicated in recruiting Cdc48p to mitochondria in yeast under oxidative stress (Heo et al., 2010). However, recent studies indicate that Vms1p is part of a ribosome quality control pathway that protects mitochondria from the toxicity of proteins synthesized on stalled ribosomes (Izawa et al., 2017; Su et al., 2019). Finally, Ubp6p (a proteasome-associated deubiquitinase; Hanna et al., 2006; Lee et al., 2016), Bro1p (which recruits the deubiquitinase Doa4p to endosomes in the multivesicular body pathway [MVB]; Luhtala and Odorizzi, 2004), and Rsp5p (an essential ubiquitin ligase; Huibregtse et al., 1995) are also required for substrate degradation by the MAD, presumably through effects on the ubiquitination state of MAD targets (Wu et al., 2016).
Although defects in the MAD result in increased sensitivity to oxidative stress (Heo et al., 2010; Wu et al., 2016), the relative contributions of different quality control mechanisms to mitochondrial function are not well understood. Moreover, although the ERAD can identify unfolded proteins in the ER lumen and membrane and retrotranslocate them to the ER surface, current evidence indicates that the MAD exercises protein quality control only on the mitochondrial outer membrane (MOM.) Only four MOM proteins (Fzo1p, Mdm34p, Msp1p, and Tom70p) in yeast (Cohen et al., 2008; Heo et al., 2010; Wu et al., 2016) and two MOM proteins (mitofusins and Mcl-1) in mammalian cells (Tanaka et al., 2010; Xu et al., 2011) have been identified as MAD substrates. Here, we show that the MAD, but not mitophagy or select mitochondrial proteases or chaperones, is critical for cellular and mitochondrial fitness during chronic exposure to elevated mitochondrial ROS using the budding yeast Saccharomyces cerevisiae as a model system. We demonstrate a role for the MAD in chronological lifespan and find that MAD function in proteostasis extends beyond the MOM and acts on substrates in the mitochondrial inner membrane (MIM) and matrix.
RESULTS
Chronic Exposure to Low Levels of PQ Decreases Cell Fitness, Largely through Effects on Mitochondria
Paraquat (PQ) is taken up into mitochondria in a membrane potential (Δψ)-dependent manner and reacts with electrons leaking from the electron transport chain (ETC) to generate superoxides (Cochemé and Murphy, 2008). However, enzymes including NADPH oxidase initiate PQ redox cycling in other cellular compartments (Cristóvão et al., 2009). Here, we identified PQ treatment conditions that result in chronic, low-level oxidative stress in mitochondria.
We confirmed that PQ treatment results in a dose-dependent decrease in yeast growth rate in nutrient-rich glucose-based media: growth is blocked by treatment with 5 mM PQ and inhibited by 50% with 2.5-mM PQ treatment (Figure 1A). Therefore, we used 2.5 mM PQ to model chronic, low-level oxidative stress. To test whether PQ inhibits growth through effects on redox cycling of PQ in mitochondria, we treated rho0 cells, yeast lacking mitochondrial DNA (mtDNA), with PQ. Since mtDNA encodes subunits of ETC complexes I, III, and IV, mitochondria in rho0 cells have severely diminished ETC activity and Δψ. We find that the PQ-dependent decrease in growth rates is diminished in rho0 cells compared to rho+ cells, which contain mtDNA (Figure 1B). Thus, the mitochondrial ETC is a major contributor to PQ-induced declines in yeast cell fitness.
Figure 1. PQ Treatment Impairs Cell Growth, Largely through Effects on Mitochondria.
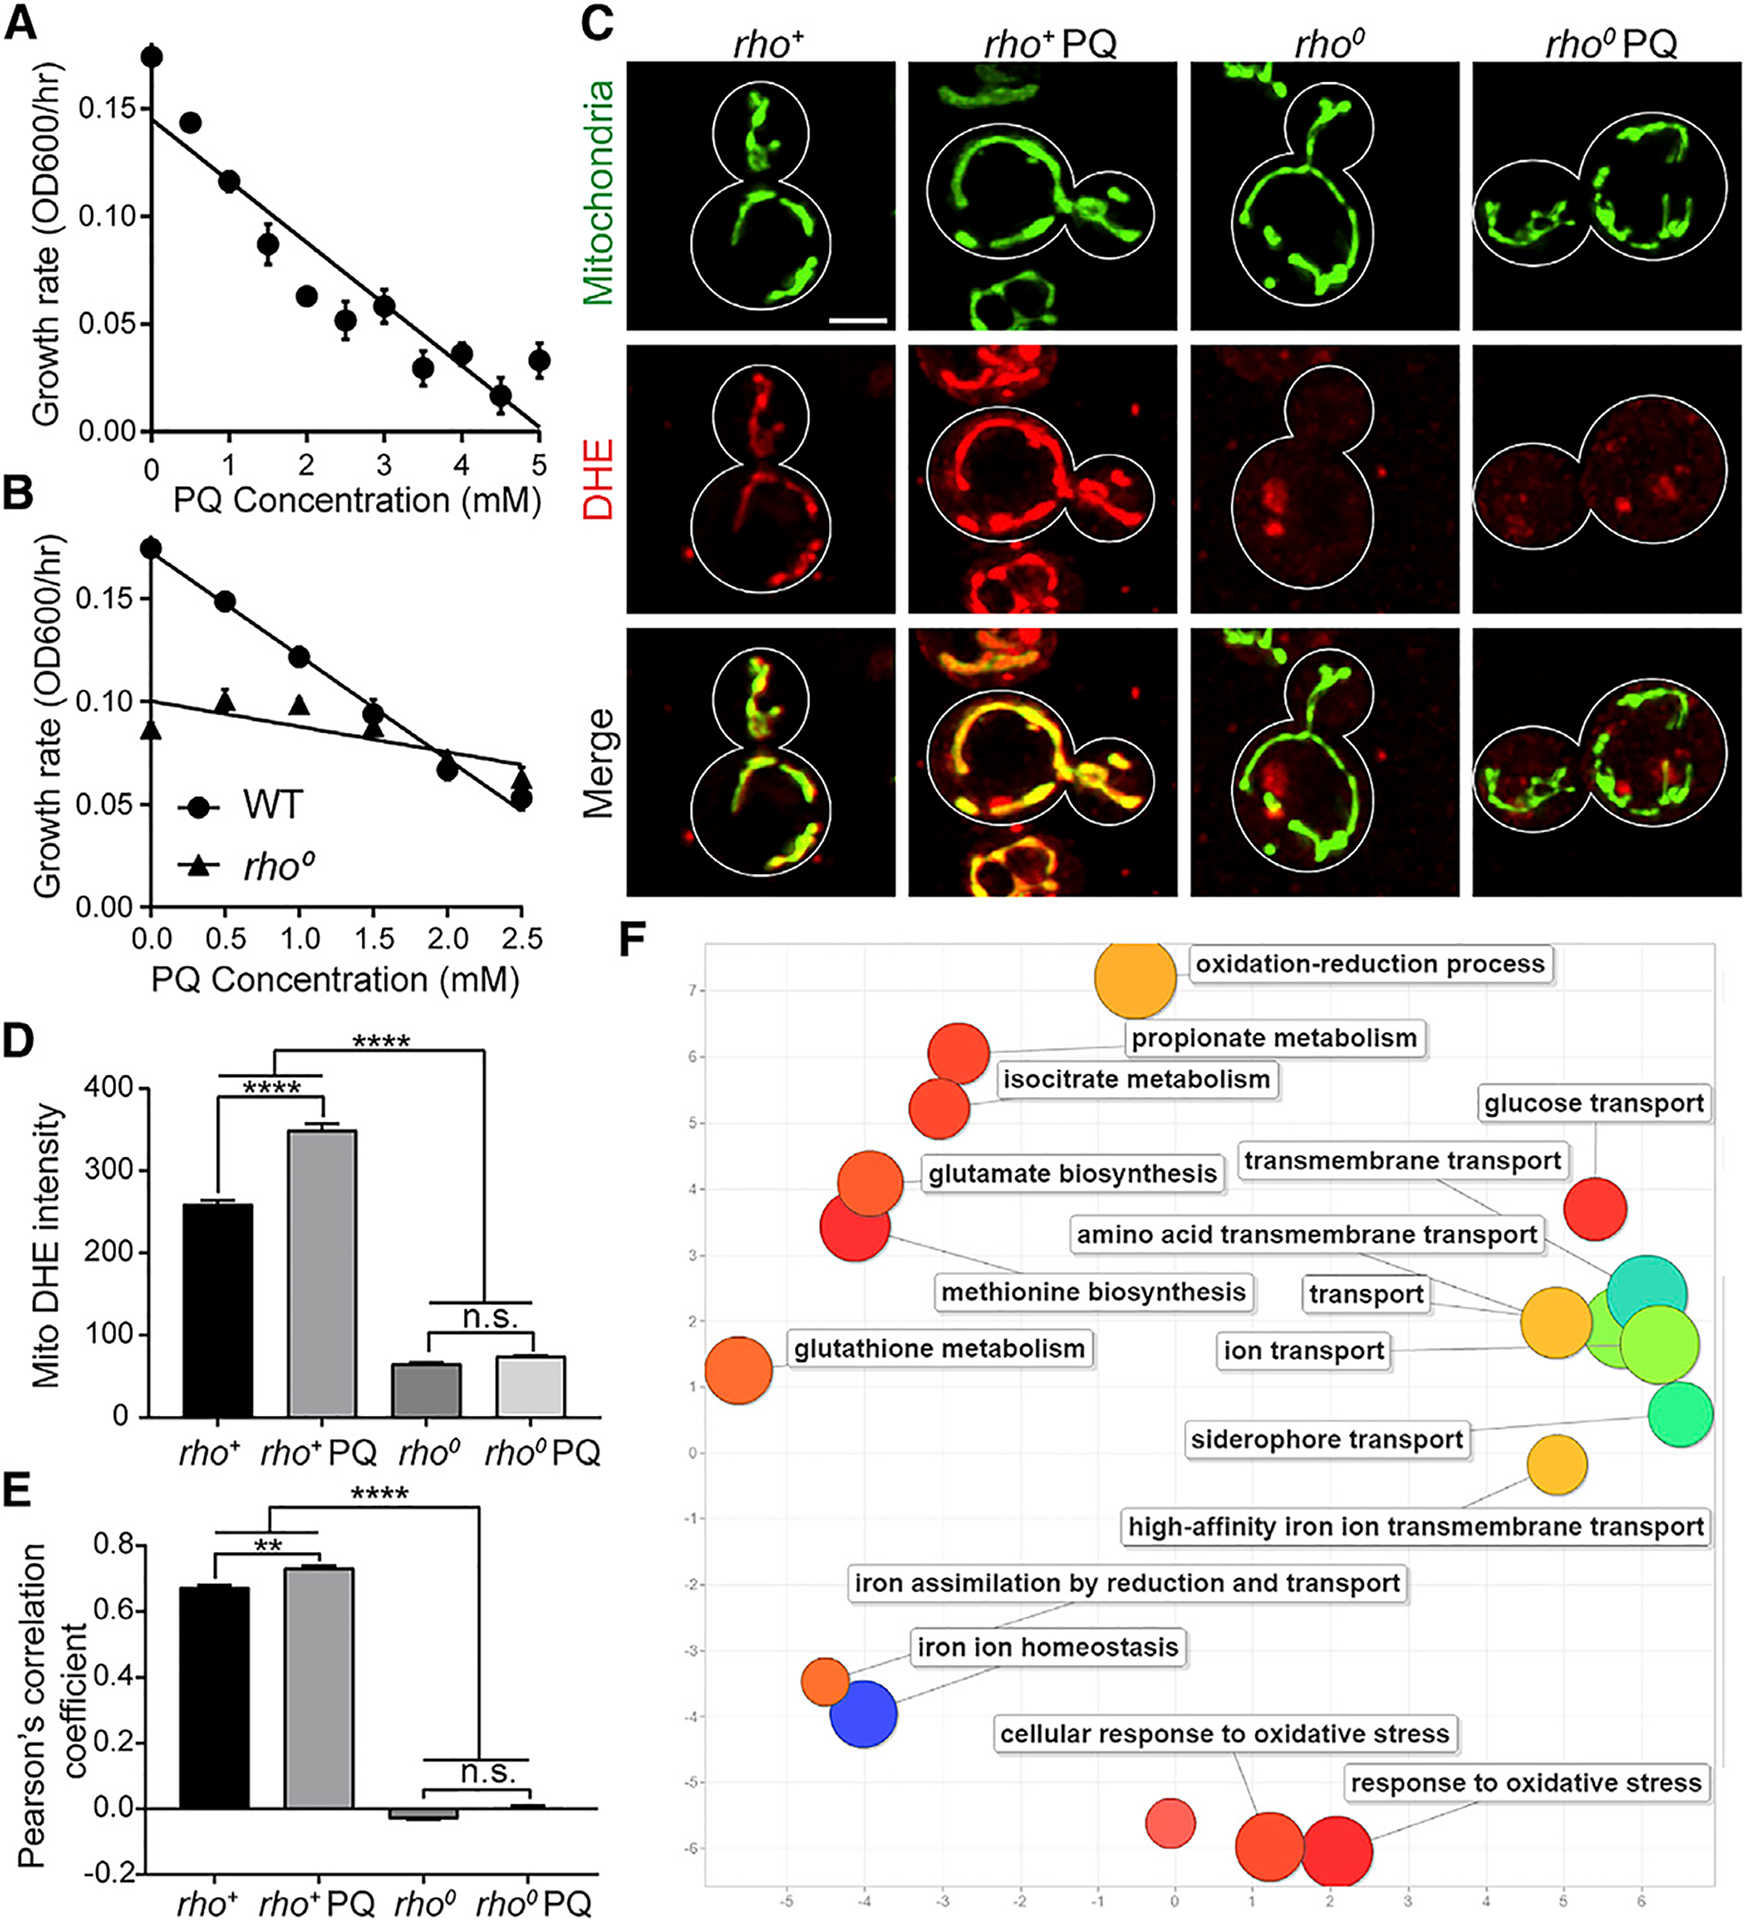
(A) Growth rates of wild-type (WT) yeast cells treated with different PQ were calculated from the maximum slope of the growth curve in mid-log phase.
(B) Growth rates of rho+ and rho0 cells treated with PQ.
(C) Representative images of DHE staining for superoxide detection in rho+ and rho0 cells ± PQ. Mitochondria were visualized using CIT1 tagged with GFPEnvy. Scale bar, 2 μm.
(D) Quantification of mitochondrial superoxide levels. (Mean + SEMs; n > 146 cells, Kruskal-Wallis test with Dunn’s multiple comparison test, ****p < 0.0001; n. s., no significance).
(E) Colocalization of DHE-stained superoxides and mitochondria using Pearson’s correlation coefficient. (Mean + SEMs; n > 192 cells, Kruskal-Wallis test with Dunn’s multiple comparison test, **p < 0.01, ****p < 0.0001; n.s., no significance).
(F) Revigo plot of GO terms associated with upregulated genes identified by RNA-seq. Bubbles with cooler colors represent more significant p values; size indicates the frequency of the GO term.
We also find that PQ treatment results in superoxide formation almost exclusively in mitochondria in yeast. Here, superoxide levels and mitochondria were visualized using dihydroethidium (DHE) (McFaline-Figueroa et al., 2011) and mitochondria-targeted GFPEnvy, respectively (Figure 1C). We confirmed that all detectable superoxides localize to mitochondria in untreated rho+ cells and found that PQ treatment increases mitochondrial superoxides in rho+ cells (Figures 1C and 1E). Interestingly, DHE-stained superoxides localize to punctate structures within mitochondria (Figure 1C), suggesting that there are hotspots for superoxide formation in the organelle. Although we detect DHE-stained superoxides in rho0 cells, the vast majority of the staining does not co-localize with mitochondria (Figures 1C and 1E). Moreover, PQ treatment has no effect on mitochondrial superoxide levels in rho0 cells (Figure 1D). These studies provide additional evidence that the ETC is required for mitochondrial superoxide formation in yeast and indicate that mitochondria are the primary site for superoxide formation in PQ-treated and untreated rho+ cells.
Using next-generation RNA sequencing (RNA-seq; GEO: GSE150804) and the FunSpec algorithm (Robinson et al., 2002) to group Gene Ontology (GO) terms in a Revigo plot (Supek et al., 2011), we find that PQ treatment results in changes in the transcripts for hundreds of genes (Figure 1F; Table S1). A notable subset of PQ-induced transcripts encodes proteins activated by the retrograde response pathway. This pathway is activated by ETC dysfunction and regulates carbohydrate metabolism to increase synthesis of biosynthetic intermediates (e.g., glutamine, acetyl coenzyme A [CoA], and oxaloacetate) through pathways including the tricarbolylic acid (TCA) cycle, glutamine biosynthetic pathway, and isocitrate metabolism (Butow and Avadhani, 2004). Transcripts encoding oxidative stress response proteins (e.g., amino acid and iron transporters and siderophores) are also more abundant in PQ-treated cells (Morano et al., 2012). Collectively, these findings indicate that mitochondria are a target for oxidative stress in response to chronic treatment with low levels of PQ.
The MAD and the Ubiquitin-Proteasome System Are Critical for Maintaining Cellular Fitness under Conditions of Chronic Mitochondrial Oxidative Stress
We find that yeast bearing deletions in genes that mediate macroautophagy (ATG1, 5, 7–9, 11, and 12) (May et al., 2012; Suzuki and Ohsumi, 2007); mitophagy (ATG32) (Kanki et al., 2009b; Okamoto et al., 2009); or selected mitochondrial proteases and chaperones including Lon protease (Pim1p) (Bender et al., 2011); AAA protease subunits Yme1p, Yta10p, and Yta12p (Arlt et al., 1998, 1996; Leonhard et al., 1996, 1999; Schnall et al., 1994); or prohibitins Phb1p and Phb2p (Nijtmans et al., 2000) are not more sensitive to the growth-inhibiting effects of PQ compared to wild-type (WT) cells (Figures 2A, S1A, and S1B). We also tested whether PQ treatment induces mitophagy using an adaptation of an established assay (Kanki et al., 2009a). We tagged the mitochondrial protein Cit1p with GFP and monitored cleavage of Cit1p-GFP to release free GFP, which is relatively protease resistant. We confirmed that nitrogen starvation induces mitophagy and find that PQ treatment does not induce mitophagy (Figure 2C). Consistent with this, atg32Δ rho+ or rho0 cells do not exhibit increased PQ sensitivity compared to WT cells (Figure 2D). Thus, neither mitophagy, macroautophagy, nor the mitochondrial proteases or chaperones tested are critical for cellular fitness in yeast challenged by low-level, chronic oxidative stress in mitochondria.
Figure 2. The MAD and the UPS, but Not Autophagy, Mitochondrial Chaperones, or Proteases, Protect Cells from PQ Toxicity.

(A) PQ sensitivity in strains bearing deletions in mitochondrial quality control pathways. PQ sensitivity was calculated as the ratio of maximum growth rate without PQ treatment to that with 2.5-mM PQ treatment (Mean + SEMs; n > 12, one-way ANOVA with Sidak’s multiple comparison test).
(B) PQ sensitivity in deletion or mutation of potential MAD components (Mean + SEMs; n > 12, one-way ANOVA with Dunnett’s multiple comparison test).
(C) Cells expressing Cit1p-GFP were grown in glucose media before exposure to either nitrogen starvation (SD-N) or 2.5 mM PQ for the times shown. Whole-cell extracts were analyzed by western blot probed with anti-GFP or hexokinase antibodies. Mitophagic degradation of Cit1-GFP is indicated by the band representing free GFP.
(D) PQ sensitivity of doa1Δ or atg32Δ cells with (+) or without (−) mtDNA (Mean + SEMs; n > 16, one-way ANOVA with Sidak’s multiple comparison test).
(E) Left, representative images of mito-roGFP1 in WT and doa1Δ cells. The ratio of the reduced to oxidized roGFP signals is shown in heatmaps. Warmer and cooler colors represent more reducing and oxidizing environments, respectively. Scale bar, 2 μm. Right, quantification of mitochondrial redox state. The box represents the middle quartile, the midline represents the median and whiskers show the 75th percentile + 1.5 IQR (inter-quartile distance) and the 25th percentle − 1.5 IQR (n > 133 cells, Kruskal-Wallis test with Dunn’s multiple comparisons test).
(F) Left, representative images of mito-roGFP1 in WT, rsp5–1, ubp6Δ, and bro1Δ cells. Scale bar, 2 μm. Right, quantification of mitochondrial redox state. The box represents the middle quartile, the midline represents the median and whiskers show the 75th percentile + 1.5 IQR and the 25th percentle − 1.5 IQR (n > 160 cells, Kruskal-Wallis test with Dunn’s multiple comparisons test). *p < 0.05; **p < 0.01; ***p < 0.001; ****p < 0.0001.
See also Figure S1.
Next, we studied the role of the MAD in this process. PQ treatment has no significant effect on the steady-state levels of Doa1p or Cdc48p (Figure S2G) or the levels of mRNAs encoding DOA1, CDC48, BRO1, UBP6, or RSP1 (Table S1). In addition, overexpression of MAD-associated genes (DOA1, BRO1, UBP6, or RSP1) or deletion of VMS1 does not affect PQ sensitivity (Figures S1I–S1L and S2A). Nonetheless, deletion or mutation of the MAD-associated genes (cdc48–3, doa1Δ, bro1Δ, ubp6Δ, or rsp5–1) or genes that affect proteasome gene expression (nas2Δ) (Mannhaupt et al., 1999; Ng et al., 2000; Owsianik et al., 2002; Xie and Varshavsky, 2001) or assembly of a proteasome regulatory particle (ufd5Δ) (Funakoshi et al., 2009; Saeki et al., 2009) increases PQ sensitivity (Figures 2A, 2B, S1C, S1D, S2B, and S2C). Conversely, expression of DOA1, BRO1, UBP6, or RSP1 in doa1Δ, ubp6Δ, bro1Δ, and rsp1–5 cells, respectively, reduces PQ sensitivity to levels observed in WT cells (Figures S1E–S1H).
The increased sensitivity of doa1Δ cells to PQ is lost upon deletion of mtDNA and is therefore dependent upon mitochondria (Figure 2D). In light of this, we used a mitochondria-targeted redox state biosensor, mito-roGFP1 (Hanson et al., 2004; Vevea et al., 2013) (Figure S1M). We find that mitochondria are more oxidized in PQ-treated cells compared to untreated cells. Interestingly, mitochondria in PQ-treated doa1Δ, ubp6Δ, and rsp5–1 cells are more oxidized compared to mitochondria in PQ-treated WT cells (Figures 2E and 2F). Collectively, our findings support a role for the MAD and the ubiquitin-proteasome system (UPS), but not Vms1p, macroautophagy, mitophagy, or the mitochondrial proteases or chaperones examined, in maintaining cellular and mitochondrial fitness under conditions of chronic low-level mitochondrial oxidative stress.
The MAD Specifically Contributes to Mitochondrial Quality Control in Response to Elevated ROS in the Organelle and Affects Yeast Cell Lifespan
Ubp6p, Bro1p, and Rsp5 are also involved in MAD-independent pathways. Specifically, Bro1 coordinates deubiquitination in the MVB pathway (Luhtala and Odorizzi, 2004). Rsp5 functions as a ubiquitin ligase for many non-mitochondrial proteins and regulates processes including MVB sorting, heat shock response, transcription, endocytosis, and ribosome stability (Huibregtse et al., 1997; Kaida et al., 2003; Katzmann et al., 2004; Somesh et al., 2005). Ubp6 functions as a deubiquitinase for non-mitochondrial proteins (Hanna et al., 2006; Lee et al., 2016). Moreover, Doa1p is required for maintenance of free ubiquitin levels (Johnson et al., 1995).
To test whether the MAD specifically is required for cellular fitness, we restored ubiquitin to WT levels in doa1Δ cells by plasmid-borne expression of ubiquitin (UBI4) (doa1Δ + Ub) (Figure 3A). We find that expression of UBI4 in doa1Δ cells reduces their PQ sensitivity. Nonetheless, the PQ sensitivity of doa1Δ + Ub cells is still increased compared to PQ-treated WT cells (Figures 3B and S2A) and is reduced by treatment with the antioxidant N-acetylcysteine (Figure S2D). Thus, the increased PQ sensitivity observed in doa1Δ cells is due in part to Doa1p function in the MAD.
Figure 3. The MAD Specifically Promotes Mitochondrial Quality Control in Response to Mitochondrial ROS and Is Required for Chronological Lifespan.

(A) Ubiquitinated proteins were probed using western blot analysis of WT or doa1Δ cells with (+) or without (−) the expression of UBI4 under control of the TEF promoter. Total protein load was assessed using trichloroethanol (TCE).
(B) PQ sensitivity in doa1Δ+Ub cells (Mean + SEMs; n = 32, unpaired t test).
(C) Oxidized protein levels in isolated mitochondria were analyzed using Oxyblots. DR, DNPH reaction; NC, negative control; asterisk denotes PQ-dependent increases in carbonylation.
(D) Left, representative images of mito-roGFP1 in WT, doa1Δ, doa1Δ+Ub, and doa1Δ+DOA1 cells. Scale bar, 2 μm. Right, quantification of mitochondrial redox state. The box represents the middle quartile, the midline represents the median and whiskers show the 75th percentile + 1.5 IQR and the 25th percentle − 1.5 IQR (n > 160 cells, Kruskal-Wallis test with Dunn’s multiple comparisons test).
(E) Chronological lifespan in WT cells and cells containing deletions or mutations of potential MAD regulators.
(F) Survival integrals calculated from (E). (Mean + SEMs; n > 3, one-way ANOVA with Dunnett’s multiple comparison test). *p < 0.05; **p < 0.01; ***p < 0.001; ****p < 0.0001.
See also Figure S2.
Next, we tested whether the MAD affects oxidative damage of mitochondrial proteins. We detect carbonylated proteins in mitochondria isolated from WT cells, even without PQ treatment, which is consistent with our finding that superoxides are present in untreated WT cells. Importantly, inhibition of the MAD in doa1Δ + Ub cells results in an increase in oxidative damage to mitochondrial proteins, and PQ treatment enhances this increase (Figure 3C). Since deletion of DOA1 has no effect on the mitochondrial superoxide levels (Figures S2E and S2F), the increase in carbonylated proteins is not due to effects on mitochondrial ROS. Rather, our findings support a role for the MAD in degrading oxidatively damaged mitochondrial proteins in both PQ-treated and untreated cells.
We also find that mitochondria are more oxidized, and therefore less fit, in PQ-treated doa1Δ+ Ub cells compared to mitochondria in PQ-treated WT cells, and the expression of DOA1 in doa1Δ cells restores the mitochondrial redox state to that observed in WT cells (Figure 3D). These data indicate that the MAD specifically contributes mitochondrial fitness in cells under chronic mitochondrial oxidative stress.
Given the established link between elevated oxidative stress and aging, we tested the effect of the MAD on chronological lifespan (CLS), which measures how long cells survive in the stationary phase and reflects cell survival under chronic stress (Fabrizio and Longo, 2003; Longo et al., 2012). We find that CLS is significantly reduced in cells containing deletions or mutation of DOA1, UBP6, BRO1, or RSP5. Furthermore, restoration of ubiquitin levels in doa1Δ cells (doa1Δ + Ub) does not restore CLS. Thus, the reduced CLS observed in doa1Δ cells is due to Doa1p function in the MAD (Figures 3E and 3F). Collectively, these data support a role for the MAD in mitochondrial fitness and cellular lifespan control under stress conditions.
Identification of Additional MAD Substrates in Different Mitochondrial Compartments
Here, we tested whether the MAD function in mitochondrial proteostasis extends beyond the four known MAD substrates in the MOM. These studies were carried out using the SUB592 strain that bears deletions of endogenous ubiquitin genes and a plasmid that expresses His- and myc-tagged ubiquitin (Peng et al., 2003; Spence et al., 2000). Deletion of DOA1 in the SUB592 strain does not affect mono-ubiquitin levels. It also increases PQ sensitivity (Figures S3A–S3C) and increases the levels of ubiquitinated proteins in whole-cell lysates and isolated mitochondria. Moreover, PQ treatment of doa1Δ cells results in a larger increase in protein ubiquitination (Figures 4A and 4B). Notably, the change in ubiquitinated protein levels is more pronounced in isolated mitochondria than in total cell lysate (Figure 4B). Thus, mitochondrial ubiquitinated proteins are a primary target for MAD-dependent degradation. Overall, our findings support a role for Doa1p in degrading ubiquitinated, damaged mitochondrial proteins in the MAD.
Figure 4. MAD Substrates are Both on and within Mitochondria under Basal and Oxidative Stress Conditions.

(A) Ubiquitinated proteins (probed with anti-His) of whole-cell or crude mitochondrial extracts from WT and doa1Δ cells ± PQ treatment.
(B) Quantification of ubiquitinated proteins in (A) (n > 7, one-way ANOVA with Sidak’s multiple comparison test).
(C) Ubiquitinated proteins in mitochondrial extracts from WT and doa1Δ cells ± PQ treatment, +/− proteinase K (100 μg/ml), or 0.5% Triton X-100 as indicated.
(D) Left, percentage of localization of potential MAD substrates identified by mass spectrometry in mitochondria. OM, outer membrane; IM, inner membrane. Right, list of potential MAD substrates.
(E) Representative images of GFP-tagged Kgd1p. Mitochondria were visualized with MitoTracker Red in WT or doa1Δ cells ± PQ treatment. Scale bar, 2 μm.
(F) Quantification of the proportion of cells containing Kgd1 puncta in (E) (n > 42 images; each dot represents the proportion of cells containing Kgd1p puncta per image; one-way ANOVA with Sidak’s multiple comparison test).
(G) Western blot of crude mitochondria (input) and total ubiquitinated proteins pulled down with Ni2+-NTA magnetic beads from isolated mitochondria (IP). Blots were probed with antibodies against GFP to detect GFP-tagged Kgd1p and against 6xHis for ubiquitin detection.
(H) Quantification of total steady-state Kgd1 (input) and ubiquitinated Kgd1 (IP) levels in (H) (n = 5, one-way ANOVA with Sidak’s multiple comparison test).
(I) Western blot of whole-cell lysates (input) and proteins immunoprecipitated with an anti- Myc antibody (IP) from whole-cell lysates of cells expressing Kgd1–13xMyc. Blots were probed with antibodies against Myc to detect Myc-tagged Kgd1p and against Cdc48p.
(J) Quantification of total steady-state Cdc48p (input) and levels of Cdc48p co-immunoprecipitated with Kgd1p (IP) in (I) (n = 7, one-way ANOVA with Sidak’s multiple comparison test). Mean + SEMs; *p < 0.05; **p < 0.01; ****p < 0.0001.
See also Figures S3 and S4.
To determine the localization of ubiquitinated mitochondrial proteins, we treated isolated mitochondria with proteinase K under conditions that degrade mitochondrial surface proteins without affecting the integrity of the organelle and tested whether ubiquitinated mitochondrial proteins are protease sensitive (Figures 4C and S3D). We find that some ubiquitinated proteins are protease sensitive and therefore are on the surface of the organelle; other ubiquitinated proteins are protease resistant and therefore are within the organelle. This finding indicates that ubiquitination of mitochondrial proteins occurs not just on the mitochondrial surface, but also within the organelle.
Next, we identified putative MAD substrates as mitochondrial proteins that exhibit increased ubiquitination upon PQ treatment when the MAD is inhibited. Specifically, we affinity purified His-tagged ubiquitinated proteins from mitochondria isolated from WT and doa1Δ SUB592 cells ± PQ treatment and used mass spectrometry to identify those isolated proteins. Our studies revealed a known MAD substrate, Tom71p, and additional candidate substrates not only in the MOM, but also within mitochondria. Indeed, 70% of the mitochondrial proteins identified localize to the MIM or matrix (Figure 4D; Table S2). These findings indicate that the MAD may have more targets than previously appreciated, including the MIM or matrix proteins.
Mitochondrial Matrix Proteins Are MAD Substrates
Kgd1p is a subunit of the α-ketoglutarate dehydrogenase (α-KDH) complex of the TCA. It contains possible ubiquitination sites (Mayor et al., 2007, 2005; Repetto and Tzagoloff, 1989), is sensitive to oxidative stress (Tretter and Adam-Vizi, 2005), and is one of the proteins identified in our analysis of ubiquitinated mitochondrial proteins. Thus, we tested whether Kgd1p is a MAD substrate.
The α-KDH complex is a part of a supercomplex with other TCA enzymes that is resolved as punctate structures in mitochondria (Lyubarev and Kurganov, 1989). We tagged KGD1 with GFP at its chromosomal locus and visualized Kgd1p-containing supercomplexes in living SUB592 cells (Figure 4E). The distribution of Kgd1p is similar in untreated WT and doa1Δ cells: it localizes primarily to punctate structures. We find that mitochondrial oxidative stress alters Kgd1p distribution: there is a significant decrease in Kgd1p puncta in PQ-treated doa1Δ cells compared to untreated doa1Δ cells and to untreated or PQ-treated WT cells (Figures 4E and 4F). Overall, our findings suggest that oxidative stress in mitochondria affects the assembly and/or stability of Kgd1p supercomplexes and support a role for the MAD in maintaining those supercomplexes under PQ-induced oxidative stress in mitochondria.
To test directly whether Kgd1p is a MAD substrate, we assessed the effect of deleting DOA1 on Kgd1p protein levels and ubiquitination in the SUB592 strain. We find that deletion of DOA1 increases the steady-state levels of Kgd1p in mitochondria and that mitochondrial Kgd1p levels are further increased by PQ treatment of doa1Δ cells (Figures 4G, 4H, and S4A). Since mRNA levels of KGD1 do not change under these conditions (Figure S3E), the increase in Kgd1p levels is due to inhibition of degradation, not increased biogenesis.
Next, we affinity purified ubiquitinated proteins from mitochondria isolated from WT or doa1Δ SUB592 cells and tested whether Kgd1p is recovered with ubiquitinated proteins (Figures 4G, 4H, and S4A). We detect a significant increase in ubiquitinated Kgd1p in mitochondria of PQ-treated doa1Δ cells compared to mitochondria of untreated WT cells (Figures 4G, 4H, and S4A). In complementary studies, we immunoprecipitated GFP-tagged Kgd1p from mitochondria isolated from WT or doa1Δ SUB592 cells and find that Kgd1p is ubiquitinated in mitochondria of doa1Δ cells and that the level of ubiquitination of this protein is further increased by PQ-induced stress in doa1Δ cells (Figures S3F, S3G, and S4B).
Since MAD substrates in the MOM interact with Cdc48p (Wu et al., 2016), we used co-immunoprecipitation analysis to determine whether Kgd1p can interact with Cdc48p and whether inhibition of the MAD affects those interactions. We find that (1) Cdc48p co-immunoprecipitates with Kgd1p, (2) PQ treatment increases the amount of Cdc48p that co-immunoprecipitates with Kgd1p, and (3) deletion of DOA1 reduces this interaction in untreated and PQ-treated cells (Figures 4I and 4J). Collectively, our findings indicate that one of the matrix proteins identified in our screen for MAD substrates is indeed a MAD substrate under basal conditions and mitochondrial oxidative stress.
Consistent with this, we find that Pim1p (the Lon protease of yeast), another protein identified in our studies, is also a MAD substrate. We find that deletion of DOA1 increases steady-state levels and ubiquitination of mitochondrial Pim1p but has no effect on PIM1 transcript levels, and PQ treatment results in a further increase in Pim1p levels and ubiquitination (Figures S3E, S3H, S3I, and S4C). Overall, these findings support a role for the MAD in the ubiquitination and degradation of two matrix proteins under basal and oxidative stress conditions.
DISCUSSION
While there are many mechanisms to repair or eliminate damaged mitochondria, the relative contributions of mitochondrial quality control pathways are not well understood. We identified PQ treatment conditions that induce chronic, low-level oxidative stress exclusively in mitochondria and find that the MAD and the UPS are major repair pathways that are active in mitochondrial proteostasis under these stress conditions. Specifically, we find that inhibition of the MAD or mutation of MAD- or UPS-associated proteins increases the sensitivity of yeast to the growth-inhibiting effects of PQ treatment. Surprisingly, deletion of selected mitochondrial proteases, chaperones, or proteins that mediate autophagy or mitophagy has no detectable effect on PQ sensitivity. Moreover, inhibition of the MAD decreases mitochondrial function, increases oxidative damage to mitochondrial proteins, and inhibits clearance of ubiquitinated and oxidatively damaged mitochondrial proteins in yeast exposed to chronic oxidative stress in mitochondria. Finally, we find that inhibition of the MAD reduces the CLS. Together, these findings support a critical role for MAD-mediated mitochondrial quality control in the oxidative stress response and in lifespan control.
Our studies also extend our understanding of the MAD. We obtained additional evidence for a role for Doa1p in the MAD and for the MAD in promoting cellular fitness under basal and oxidative stress conditions. We also find that proteins can be ubiquitinated both on the surface of and within mitochondria under basal conditions and when the MAD is disabled in both PQ-treated and untreated cells. Finally, we obtained evidence that the MAD has a broader function in mitochondrial proteostasis than previously appreciated. Specifically, we used mass spectrometry to identify candidate MAD substrates as mitochondrial proteins that undergo increased ubiquitination in response to PQ treatment in a MAD mutant. The candidates identified include additional MOM proteins and proteins in the MIM and matrix. Moreover, we obtained evidence that two candidate substrates, which localize to the mitochondrial matrix (Kgd1p and Pim1p), are degraded by the MAD: (1) inhibition of the MAD results in an increase in ubiquitination and steady-state levels of both proteins in PQ-treated yeast, (2) Kgd1p co-immunoprecipitate with Cdc48p, and (3) chronic mitochondrial oxidative stress results in an increase in the interaction of Kgd1p with Cdc48p.
Our findings that mitochondrial proteins can be ubiquitinated within the organelle, and that two validated MAD substrates localize to the mitochondrial matrix, indicate that the MAD functions beyond the MOM. They also support the existence of additional MAD components including machinery to identify and retrotranslocate proteins from the matrix and MIM to the surface of the organelle. Finally, they raise the possibility that ubiquitination may be a signal for retrotranslocation of MAD targets to the MOM.
Recent reports revealed that mitochondrial matrix and MIM proteins are ubiquitinated and that the matrix protein succinate dehydrogenase subunit A (SDHA) is ubiquitinated and degraded by the proteasome in mammalian cells (Lavie et al., 2018; Lehmann et al., 2016). Interestingly, we identified Sdh1p, the SDHA homolog in yeast, as a candidate MAD substrate in yeast. These findings raised the interesting possibility that MAD surveillance may extend to the proteins within mitochondria in other eukaryotes.
Other studies show that proteins within mitochondria can retrotranslocate to the MOM or cytosol (Azzu and Brand, 2010; Bragoszewski et al., 2015; Lavie et al., 2018; Margineantu et al., 2007). However, the mechanism underlying this process is not well understood. Tom40p, the protein translocating channel in the MOM, has been implicated as an “escape hatch” for the release of destabilized proteins from the mitochondrial intermembrane space (Bragoszewski et al., 2015). Moreover, translo-case of the outer membran (TOM) complexes can associate with Cdc48p and with the conserved MOM AAA-ATPase Msp1p that extracts ER-targeted tail-anchored proteins from mitochondria (Chen et al., 2014; Mårtensson et al., 2019; Matsumoto et al., 2019; Okreglak and Walter, 2014; Weidberg and Amon, 2018; Wu et al., 2016). Therefore, TOM proteins may serve as an exit channel for MAD or Msp1p targets.
Finally, mitophagy, mitochondrial proteases, and chaperones are targets for disease, critical for development, and linked to lifespan control. Therefore, it is surprising that these processes do not contribute to mitochondrial and cellular fitness under conditions of chronic oxidative stress in the organelle. We propose that, instead, the MAD may be an efficient response to low-level mitochondrial damage since it removes specific damaged components, rather than eliminating entire organelles. Moreover, our finding that the MAD has more substrates than previously appreciated, including mitochondrial Lon protease (Pim1p), raises the possibility that the MAD is a critical defense mechanism under the stress conditions studied because it has a greater role in mitochondrial proteostasis compared to the proteases or chaperones studied.
STAR★METHODS
Detailed methods are provided in the online version of this paper and include the following:
RESOURCE AVAILABILITY
Lead Contact
Further information and requests for resources, reagents, and strains should be directed to and will be fulfilled by the lead contact, Liza A. Pon (lap5@cumc.columbia.edu).
Materials Availability
Yeast strains generated in this study are available from the Lead Contact with a completed Materials Transfer Agreement.
Data and Code Availability
The RNA-seq generated during this study are available at GEO: GSE150804.
EXPERIMENTAL MODEL AND SUBJECT DETAILS
Yeast growth conditions
All S. cerevisiae strains were derived from the wild-type strain BY4741 or from SUB592 (Spence et al., 2000) and are shown in Table S3. To measure yeast growth rates, cells were grown in glucose-based rich media (yeast extract/peptone/dextrose, YPD). For experiments in which mitochondrial redox state was measured using mito-roGFP1, cells were grown to mid-logarithmic phase (optical density OD600 = 0.1–0.3) in synthetic complete medium without uracil (SC-Ura). For all other experiments, yeast cells were grown in SC medium. In all experiments, cells were cultured at 30°C.
Yeast strain construction
Deletion strains were generated by using homologous recombination to replace the target genes with cassettes containing the selectable markers LEU2, URA3 or KanMX6. PCR fragments containing a selectable marker flanked by 40 bp of homology to regions immediately upstream and downstream of the target gene were amplified using primers listed in Table S3 and plasmids pFA6a-kanMX6 (Bähler et al., 1998) (Addgene plasmid # 39296), pOM12 or pOM13 (Gauss et al., 2005) (Euroscarf, P30387, P30388). The PCR fragments were transformed into cells using the lithium acetate method. Transformants containing selectable markers were selected on SC-Leu, SC-Ura, or YPD plates containing 200 μg/ml Geneticin (Sigma-Aldrich, St Louis, MO).
rsp5–1 containing a T-to-C point mutation at nucleotide 2198 that results in a Leu-to-Ser alteration at amino acid 733 (Wang et al., 1999) was generated in BY4741 using CRISPR (Laughery et al., 2015). Briefly, pML104 containing both Cas9 the guide RNA expression cassette is linearized by digestion with BclI and SwaI enzymes. Oligonucleotides containing a GATC overhang, a 20-mer guide sequence immediately preceding a PAM sequence (5′-NGG-3′) near the point mutation site, and the 5′ end of the structural segment of the single guide RNA (sgRNA) were designed and hybridized. The hybridized oligonucleotides were ligated into the digested pML104 plasmid to generate the complete sgRNA expression cassette. Repair oligonucleotides containing the rps5–1 point mutation, the PAM sequence mutation that eliminates the PAM sequence but does not change amino acid sequence, and guidance sequence flanked by 40 bp of homology to regions immediately upstream and downstream of the guidance sequence were generated and hybridized. Yeast cells were transformed with both pML104 containing complete sgRNA cassette and repair oligonucleotides, and the transformants were selected on SC-Ura plates. Positive transformants were confirmed by sequencing.
To generate strains expressing 6xHis-, GFP-, or GFPEnvy-tagged proteins, PCR fragments containing 6 histidines followed by HIS3MX6 and GFP followed by bleMX6 were amplified from pFA6a-6xGly-His-tag-HIS3MX6 (Funakoshi and Hochstrasser, 2009) (Addgene plasmid # 20762), pFA6-GFP-bleMX6 (Gadaleta et al., 2013) (Addgene plasmid # 33141), and pFA6a-link-GFPEnvy-SpHis5 (Slubowski et al., 2015) (Addgene plasmid # 60782), respectively. The homology of the flanking regions was designed to insert the cassette in frame with the 3′ end of the target open reading frame. The transformants were selected using SC-His plates or YPD plates containing 200 μg/ml zeocin (Invitrogen).
Strains with gene overexpression were generated by insertion of the target gene into p416-TEF plasmid (Mumberg et al., 1995) (ATCC #87368), and then the PCR fragments containing the TEF promoter, target gene, and the CYC terminator were amplified and inserted into the HO-poly-KanMX4-HO plasmid (Voth et al., 2001) (Addgene plasmid # 51662). Yeast cells were transformed with the HO-poly-KanMX4-HO plasmid containing the TEF promoter with the target gene, and the transformants were selected using YPD plates containing 200 μg/ml Geneticin (Sigma-Aldrich, St Louis, MO).
METHOD DETAILS
Growth rate analysis
Yeast grown to mid-log phase in YPD were diluted to OD600 = 0.07. These cultures were further diluted to an OD600 of 0.0035 by adding 10 μL culture to 200 μL YPD or YPD containing 2.5 mM paraquat (PQ) in a 96-well flat-bottom plate (Corning, Corning, NY). The optical density of the culture (OD600) was measured every 20 min for 72 hr using a plate reader (Tecan Infinite M200, Research Triangle Park, NC). Each strain was plated in quintuplicate and the growth curves averaged or maximum growth rate (slope) calculated using the greatest change in OD600 over a 240-min interval in 72 hr. Growth rates were estimated using linear regression using Magellan software.
RNA sequencing
Cells were treated with 2.5 mM PQ for 8 hr in YPD. RNA was extracted from PQ-treated and non-treated mid-log phase yeast cells using the RNeasy kit (QIAGEN, Germantown, MD). RNA library preparations and sequencing reactions were conducted at GENEWIZ, LLC. (South Plainfield, NJ, USA). RNA sequencing libraries were prepared using the NEBNext Ultra RNA Library Prep Kit for Illumina using manufacturer’s instructions (NEB, Ipswich, MA, USA). The sequencing library was validated on the Agilent TapeStation (Agilent Technologies, Palo Alto, CA, USA), and quantified using a Qubit 2.0 Fluorometer (Invitrogen, Carlsbad, CA) as well as by quantitative PCR (KAPA Biosystems, Wilmington, MA, USA). The sequencing libraries were clustered on a single lane of a flowcell. After clustering, the flowcell was loaded on the Illumina HiSeq instrument 4000 according to manufacturer’s instructions. The samples were sequenced using a 2×150bp Paired End (PE) configuration. Sequence reads were trimmed to remove possible adaptor sequences and nucleotides with poor quality using Trimmomatic v.0.36. The trimmed reads were mapped to the Saccharomyces cerevisiae S288c reference genome available on ENSEMBL using the STAR aligner v.2.5.2b. Unique gene hit counts were calculated by using featureCounts from the Subread package v.1.5.2. After extraction of gene hit counts, the gene hit counts table was used for downstream differential expression analysis. Using DESeq2, a comparison of gene expression between WT and PQ-treated cells was performed. The Wald test was used to generate p values and log2 fold changes. Genes with a p value < 0.05 and absolute log2 fold change > 1 were called as differentially expressed genes. Differentially expressed genes were then analyzed using FunSpec to group the large sets of upregulated and downregulated genes by gene ontology (GO) terms (Robinson et al., 2002). REVIGO was used to remove redundant GO terms and group-related GO terms in semantic similarity-based scatterplots (Supek et al., 2011).
Mito-roGFP1 imaging
Mito-roGFP1 imaging was performed as described previously with minor modifications (McFaline-Figueroa et al., 2011; Vevea et al., 2013). Cells were transformed with a plasmid bearing the mito-roGFP1 sequence using the lithium acetate method. Cells containing mito-roGFP1 plasmids were grown in SC-Ura medium or medium containing 2.5 mM PQ for 8 hr to mid-log phase. Images were acquired on an Axioskop 2 microscope with a 100×/1.4 NA Plan-Apochromat objective (Zeiss, Thornwood, NY) and an Orca ER cooled charge-coupled device (CCD) camera (Hamamatsu Photonics, Hamamatsu City, Japan) using excitation by an LED light source (CoolLED pE-4000, Andover, UK) at 365 and 470 nm for the oxidized and reduced form, respectively. All channels were acquired with a modified GFP filter (Zeiss filter 46 HE without excitation filter, dichroic FT 515, emission 535/30). Images were collected through the entire cell depth with 21 z sections at 0.3-μm intervals and were deconvolved using a constrained iterative restoration algorithm with a calculated PSF using the following parameters: 507nm excitation wavelength, 60 iterations, 100% confidence limit (Volocity 5.5, Quorum Technologies). After subtracting background and thresholding, the reduced/oxidized ratio was calculated by dividing the intensity of the reduced channel (λex = 470nm, λem = 525nm) by the intensity of the oxidized channel (λex = 365nm, λem = 525nm) in Volocity software.
DHE staining
Cells with GFPEnvy-tagged Cit1 proteins were grown in SC medium or medium containing 2.5 mM PQ for 8 hr to mid-log phase, and incubated with 40 μM dihydroethidium (DHE) for 30 min at 30°C (McFaline-Figueroa et al., 2011). DHE-stained cells were washed with SC for 3 times and imaged as previously described using excitation using a 561 nm LED for DHE and 470 nm LED for GFPEnvy with a dual eGFP/mCherry cube (59222, Chroma, Bellows Falls, VT). Images were deconvolved using a constrained iterative restoration algorithm with calculated PSFs assuming 507 nm and 610 nm emission for GFPEnvy and DHE, respectively, using 60 iterations and a 100% confidence criterion for termination. After subtracting background and thresholding, the superoxide levels were represented as mean DHE intensity in cells or in mitochondria identified by thresholding GFPEnvy signal in Volocity software. Colocalization of superoxides with mitochondria was measured using the Pearson’s correlation coefficient between DHE and GFPEnvy signals.
Chronological lifespan measurements
Chronological lifespan was measured using a modification of a previously described method (Fabrizio and Longo, 2007). Cultures were inoculated from a few colonies into 5 mL YPD medium overnight with shaking at 30°C. The next morning, cultures were diluted 1:200 into 5 mL of fresh SC medium. This incubation time point was considered day 0. Cells were left to shake at 30°C at 200 rpm to grow logarithmically until they reached the mostly non-dividing high-metabolism postdiauxic phase after 24 hr. A 10 μl aliquot was removed from the culture and diluted to 1:10000, and 10 μl of dilution was plated onto YPD every two days starting on day 1. The plates were incubated at 30°C for 2–3 days. Viability of the cells at the time that the yeast cells were plated was assessed by counting colony forming units (CFU). The initial survival (100%) was defined as the number of CFU at day 1. Survival integral (SI) is defined as the area under the survival curve and can be estimated by the formula: where agen is the age-point and sn is the survival value at that age-point (Murakami and Kaeberlein, 2009).
Isolation of mitochondria
Mitochondria were isolated using a modification of a previously described method (Liao et al., 2018). Cells were grown to mid-log phase in SC medium or SC medium containing 2.5 mM PQ for 8 hr at 30°C with aeration. Cells were then collected by centrifugation at 1,500 × g for 5 min at 4°C, washed with water, and the weight of the “wet” cell pellet was determined. Cells were then incubated in Tris-DTT buffer (0.1M Tris-SO4, pH 9.4 and 10 mM DTT) (5 ml/g yeast wet weight) for 15 min at 30°C with shaking, washed 1 time with SP buffer (1.2M Sorbitol and 20 mM KPi, pH 7.4) (5 ml/g yeast wet weight) and incubated with SP buffer containing Zymolyase 20T (Seikagaku Corporation, Tokyo, Japan) (7.5 mg/g yeast wet weight) at 30°C for 40 min with shaking. Spheroplasts were collected by centrifugation at 4,500 × g at 4°C for 5 min, washed with ice-cold SEH buffer (0.6M Sorbitol, 20 mM HEPES-KOH, pH 7.4, 2 mM MgCl2) (5 ml/g yeast wet weight) containing a protease inhibitor cocktail (PI-1: 0.5-mg/ml Pepstatin A, 0.5 μg/ml Chymostatin, 0.5 μg/ml Antipain, 0.5 μg/ml Leupeptin, and 0.5 μg/ml Aprotinin; PI-2: 10 μM Benzamidine–HCl and 1 μg/ml 1,10-Phenanthroline; 1 mM PMSF) and 10 mM N-ethyl-maleimide (NEM), and then homogenized using 15 forceful strokes of a pre-chilled glass/glass Dounce homogenizer (Wheaton Science Products, Millville, NJ). The homogenate was subjected to low-speed centrifugation (1,500 × g) for 5 min, and the supernatant obtained was subjected to high-speed centrifugation (12,000 × g) for 10 min at 4°C. The resulting pellet was resuspended in ice-cold SEH buffer containing protease inhibitor cocktails to 1 ml/g yeast wet weight (mitochondria-enriched fraction). To further remove debris, 1 mL of mitochondria-enriched fraction was subjected to 2 rounds of low-speed centrifugation (700 × g for 5 min and 1,500 × g for 5 min) at 4°C using a benchtop microcentrifuge. The supernatant obtained was subjected to high-speed centrifugation (12,000 × g for 10 min at 4°C), and the pellet obtained was resuspended in ice-cold SEH buffer (crude mitochondria).
To obtain pure mitochondria, mitochondria in cells expressing 6xHis-tagged Tom70 were further isolated from the mitochondria-enriched fraction using Ni-NTA magnetic beads (HisPur Ni-NTA Magnetic Beads, Thermo Scientific, Grand Island, NY). 100 μl of beads (1.25 mg of beads) was used for 1 mL of mitochondria-enriched fraction. To bind mitochondria to the beads, 1 mL of the mitochondria-enriched fraction was incubated with SEH buffer-washed magnetic beads for 60 min at 4°C with gentle rotation. The mixture was then placed in the Magnetic Separation Rack (6-Tube Magnetic Separation Rack, New England Biolabs, Ipswich, MA) for 1 min at RT to separate the magnetic bead-bound mitochondria. The magnetic bead-bound mitochondria were then washed 3 times with 15 mM imidazole in ice-cold SEH buffer, and mitochondria were eluted from the magnetic beads by incubating with 50 μl of 500 mM imidazole in ice-cold SEH buffer for 5 min with rotation at 4°C. Released mitochondria were concentrated by centrifugation at 12,000 × g for 5 min at 4°C and resuspended in ice cold SEH buffer.
Oxyblot
Oxyblots (Stankowski et al., 2011) were performed using a modification of the manufacturer’s protocol (Millipore, S7150). 6 μl of cell lysates or bead-purified mitochondria (15 μg) were denatured with 6 μl of 12% SDS and derivatized by adding 12 μl of 1xDNPH solution. For the negative control, 12 μl of 1x Derivatization-Control solution was added instead of the DNPH solution. The mixture was incubated for 15 min at room temperature and the reaction was stopped by adding 9 μl of Neutralization solution. The samples were then subjected to SDS-PAGE electrophoresis and western blot analysis.
Pull-down of His-tagged proteins
6 OD of cells or 400 μg crude mitochondrial proteins were lysed in 500 μl Cell Lysis Buffer (CLB, 50 mM Tris pH 8.0, 300 mM NaCl, 0.1% Tween 20, protease inhibitor cocktail, 10 mM NEM) containing 250 μl glass beads with vortex for 4 min at 4°C. The lysates were separated from beads and debris by centrifuging at full speed (13200 rpm) and incubated with 50 μl CLB-washed Ni2+-NTA magnetic beads (HisPur Ni-NTA Magnetic Beads, Thermo Scientific, Grand Island, NY) for 1 hr at 4°C. Beads with His-tagged proteins were separated from other proteins by placing in the Magnetic Separation Rack for 1 min, and were washed with 500 μl Washing Buffer (50 mM Tris pH 8.0, 300 mM NaCl, 0.1% Tween 20, 10 mM imidazole, protease inhibitor cocktail) for 3 times. Proteins were eluted by incubating with 60 μl of Elution Buffer (50 mM Tris pH 8.0, 300 mM NaCl, 0.1% Tween 20, 300 mM imidazole, protease inhibitor cocktail) for 5 min with rotation. Protein samples were added 4xSDS Sample buffer and subjected to polyacrylamide gel electrophoresis and western blots.
Immunoprecipitation
Cells or crude mitochondria were lysed in 500 μl Cell Lysis Buffer (CLB, 50 mM Tris pH 8.0, 150 mM NaCl, 10 mM EDTA, 1% Triton X-100, 10% glycerol, protease inhibitor cocktail, 10 mM NEM) containing 250 μl glass beads with vortex for 4 min at 4°C. The lysates were separated from beads and debris by centrifuging at full speed (13200 rpm) and incubated with 10 μg antibodies overnight at 4°C. The lysates with antibodies were incubated with Pierce Protein A Magnetic Beads that were washed with Beads washing Buffer (1x TBS, 0.1% Tween-20) for 1 hr at 4°C. Beads with antibody-bound proteins were separated from other proteins by placing in the Magnetic Separation Rack for 1 min, and were washed with 500 μl Washing Buffer (50 mM Tris pH 8.0, 150 mM NaCl, 1% Triton X-100, 10% glycerol, protease inhibitor cocktail) for 3 times. Proteins were eluted by incubating with 80 μl of 1xSDS Sample Buffer (10% Glycerol, 60 mM Tris/HCl pH 6.8, 2% SDS, 90 mM DTT, 0.01% bromophenol blue) containing protease inhibitor cocktail and boiling for 5 min.
Mass spectrometry
6xHis-tagged ubiquitinated proteins were pulled down as described above and separated on 4%–20% gradient SDS-PAGE (Tru-PAGE PCG2004, Sigma-Aldrich), and stained with Bio-Safe Coomassie G-250 Stain (#1610786, BIO-RAD). In-gel digestion was performed as described earlier (Shevchenko et al., 2006), with minor modifications. Protein gel slices were excised, washed with 1:1 acetonitrile: 100 mM ammonium bicarbonate (v/v) for 30 min, dehydrated with 100% acetonitrile for 10 min, and dried in a speed-vac for 10 min without heat. Gel slices were reduced with 5 mM DTT for 30 min at 56°C in an air thermostat and then alkylated with 11 mM iodoacetamide for 30 min at room temperature in the dark. Gel slices were washed with 100 mM ammonium bicarbonate and 100 % acetonitrile for 10 min each, and excess acetonitrile was removed by drying in a speed-vac for 10 min without heat. Gel slices were then rehydrated in a solution of 25 ng/μl trypsin in 50 mM ammonium bicarbonate for 30 min on ice, and trypsin digestions was performed overnight at 37°C. Digested peptides were collected and further extracted from gel slices in extraction buffer (1:2 5% formic acid/acetonitrile (v/v)) with high-speed shaking. Supernatants were dried down in a speed-vac, and peptides were dissolved in a solution containing 3% acetonitrile and 0.1% formic acid. Peptides were desalted with C18 disk-packed stage-tips.
Desalted peptides were injected onto an EASY-Spray PepMap RSLC C18 50 cm × 75 μm column (Thermo Scientific), which was coupled to the Orbitrap Fusion Tribrid mass spectrometer (Thermo Scientific). Peptides were eluted with a non-linear 110 min gradient of 5%–30% buffer B (0.1% (v/v) formic acid, 100% acetonitrile) at a flow rate of 250 nL/min. The column temperature was maintained at a constant 50°C during all experiments. Thermo Scientific Orbitrap Fusion Tribrid mass spectrometer was used for peptide MS/MS analysis. Survey scans of peptide precursors were performed from 400 to 1575 m/z at 120K FWHM resolution (at 200 m/z) with a 2 × 10⁵ ion count target and a maximum injection time of 50 ms. The instrument was set to run in top speed mode with 3 s cycles for the survey and the MS/MS scans. After a survey scan, tandem MS was performed on the most abundant precursors exhibiting a charge state from 2 to 6 of greater than 5 × 10³ intensity by isolating them in the quadrupole at 1.6 Th. CID fragmentation was applied with 35% collision energy and resulting fragments were detected using the rapid scan rate in the ion trap. The AGC target for MS/MS was set to 1 × 10⁴ and the maximum injection time limited to 35 ms. The dynamic exclusion was set to 45 s with a 10 ppm mass tolerance around the precursor and its isotopes. Monoisotopic precursor selection was enabled.
Raw mass spectrometric data were analyzed using MaxLFQ in the MaxQuant environment v.1.6.1.0 (Cox et al., 2014; Cox and Mann, 2008) and employed Andromeda for database search (Cox et al., 2011) at default settings with a few modifications. The default was used for first search tolerance and main search tolerance: 20 ppm and 6 ppm, respectively. MaxQuant was set up to search the reference Saccharomyces cerevisiae proteome database downloaded from Uniprot. MaxQuant performed the search trypsin digestion with up to 2 missed cleavages. Peptide, Site and Protein FDR were all set to 1% with a minimum of 1 peptide needed for Identification but 2 peptides needed to calculate a protein level ratio. The following modifications were used as variable modifications for identifications and included for protein quantification: Oxidation of methionine (M), Acetylation of serine, and Deamination of asparagine or glutamine (NQ). LFQ intensity was used for analysis to compare the samples.
Protein mass spectrometry data were further sorted as follows. First, proteins with higher peptide counts in the doa1Δ group than in the WT group were analyzed. Next, only proteins with > 10 peptide counts were classified as real detectable hits. Finally, subcellular localizations of proteins were verified in the Saccharomyces Genome Database (SGD).
Western blot analysis
Western blot analysis was performed using standard procedures on PVDF membranes (Immobilon-FL; EMD Millipore, Billerica MA). Total proteins from cell lysates were collected from 2 OD of relevant cultures in 200 μL 1xSDS Sample buffer containing protease inhibitor cocktail, vortexed with 100 μL of glass beads for 5 min, and then incubated at 100°C for 5 min. Other protein samples from Oxyblots, pull-down assay, or immunoprecipitation were collected as described above. For protein detection, protein lysates were loaded onto a SDS-PAGE gel containing 0.5% trichloroethanol (TCE). Prior to transfer, the gel was exposed to UV light (300 nm) for 2.5 min to activate protein-crosslinking activity of TCE (Ladner et al., 2004). TCE-crosslinked proteins, which were used as load controls, were detected by exposure of gels to 300 nm illumination for 4 s using a ChemiDoc MP Imaging System (Bio-Rad, Hercules, CA). The gel was then transferred to a PVDF membrane (Immobilon-FL; EMD Millipore, Billerica MA). After transfer, the PVDF membrane was incubated with 5% skim milk for 1 hr blocking, and with primary and secondary antibodies. Proteins in blots were detected using Luminata Forte Western HRP substrate (MilliporeSigma, Burlington, MA) and the ChemiDoc MP Imaging System (Bio-Rad, Hercules, CA). The primary antibodies used in these studies were mouse monoclonal antibodies against GFP (#11814460001, Roche), 6x-His tag (#MA1–21315, Invitrogen), and ubiquitin (#MAB1510, Sigma-Aldrich), and rabbit polyclonal antibody against Cdc48p (#62–303, As One International Inc).
cDNA synthesis and quantitative PCR
RNA was extracted from mid-log phase WT or doa1Δ cells derived from SUB592 in the presence of absence of PQ using the RNeasy kit (QIAGEN, Germantown, MD). Genomic DNA contamination was removed using TURBO DNA-free Kit (Ambion, Carslbad, CA). 1 μg of DNA-free RNA was used for cDNA synthesis with SuperScript IV First-Strand Synthesis System (Invitrogen, Waltham, MA). cDNA was diluted and used for quantitative PCR reaction with PowerUp SYBR Green Master Mix (Applied Biosystems, Carlsbad, CA). Primers for qPCR were designed using NCBI Primer Blast (https://www.ncbi.nlm.nih.gov/tools/primer-blast/) with a PCR product size of 100 bp and max Tm difference of 2°C, and listed in Table S3. For each specified gene, ΔCT was calculated as CTgene - CTactin, and fold change was calculated as 2−ΔΔCT with actin serving as the endogenous control for each sample.
QUANTIFICATION AND STATISTICAL ANALYSIS
All data were analyzed for normal distribution with the D’Agostino and Pearson normality test. p values for simple two-group comparison were determined with a two-tailed Student’s t test for parametric distributions and a Mann-Whitney test for non-parametric data. For multiple group comparisons, p values were determined by a 1-way ANOVA with Dunnett’s or Sidak’s test for parametric distributions and a Kruskal-Wallis test with Dunn’s post hoc test for non-parametric distributions. GraphPad Prism7 (GraphPad Software) was used to conduct all statistical analysis. Bar graphs show the mean and SEM; in box and whiskers graphs, the box represents the middle quartile, the midline represents the median and whiskers show the the 75th percentile + 1.5 IQR (inter-quartile distance, the difference between the 25th and 75th percentiles) and the 25th percentle − 1.5 IQR. For all tests, p values are classified as follows: *p < 0.05; **p < 0.01; *** p < 0.001; ****p < 0.0001.
Supplementary Material
KEY RESOURCES TABLE
| REAGENT or RESOURCE | SOURCE | IDENTIFIER |
|---|---|---|
| Antibodies | ||
| Mouse monoclonal anti-GFP | Roche | Cat. #11814460001; PRID: AB_390913 |
| Mouse monoclonal anti-His | Invitrogen | Cat. #MA1–21315; PRID: AB_557403 |
| Mouse monoclonal anti-ubiquitin | Sigma-Aldrich | Cat. #MAB1510; PRID: AB_2180556 |
| Rabbit polyclonal anti-Cdc48 (S. cerevisiae) | As One International Inc | Cat. #62–303 |
| Chemicals, Peptides, and Recombinant Proteins | ||
| Paraquat | Sigma-Aldrich | Cat. #856177 |
| Dihydroethidium (DHE) | Invitrogen | Cat. #D11347 |
| Zymolyase 20T | Seikagaku Corporation | Cat. #120491 |
| Trichloroethanol (TCE) | Sigma-Aldrich | Cat. #T54801 |
| PowerUp SYBR Green Master Mix | Applied Biosystems | Cat. # A25741 |
| N-ethylmaleimide (NEM) | Sigma-Aldrich | Cat. #E3876 |
| Proteinase K | Sigma-Aldrich | Cat. #P2308 |
| Critical Commercial Assays | ||
| RNeasy Mini Kit | QIAGEN | Cat. #74106 |
| HisPur Ni-NTA Magnetic Beads | Thermo Scientific | Cat. #88831 |
| OxyBlot Protein Oxidation Detection Kit | Sigma-Aldrich | Cat. #S7150 |
| TURBO DNA-free Kit | Ambion | Cat. #AM1907M |
| SuperScript IV First-Strand Synthesis System | Invitrogen | Cat. #18091050 |
| Deposited Data | ||
| RNA-seq raw and analyzed data | This paper | GEO: GSE150804 |
| Experimental Models: Organisms/Strains | ||
| See Table S3 | ||
| Oligonucleotides | ||
| See Table S3 | ||
| Recombinant DNA | ||
| pFA6a-6xGly-His-tag-H IS3MX6 | Funakoshi and Hochstrasser, 2009 | Addgene plasmid # 20762 |
| pFA6-GFP-bleMX6 | Gadaleta et al., 2013 | Addgene plasmid # 33141 |
| pFA6a-link-GFPEnvy-SpHis5 | Slubowski et al., 2015 | Addgene plasmid # 60782 |
| pFA6a-kanMX6 | Bähler et al., 1998 | Addgene plasmid # 39296 |
| HO-poly-KanMX4-HO | Voth et al., 2001 | Addgene plasmid # 51662 |
| pOM12 | Gauss et al., 2005 | Euroscarf plasmid # P30387 |
| pOM13 | Gauss et al., 2005 | Euroscarf plasmid # P30388 |
| p416-TEF | Mumberg et al., 1995 | ATCC #87368 |
| Software and Algorithms | ||
| FunSpec | Robinson et al., 2002 | http://funspec.med.utoronto.ca/ |
| REVIGO | Supek et al., 2011 | http://revigo.irb.hr/ |
| GraphPad Prism7 | GraphPad | https://www.graphpad.com/scientific-software/prism/ |
| Volocity 5.5 | Quorum Technologies | https://www.quorumtechnologies.com/volocity/volocity-downloads/legacy |
Highlights.
The MAD is critical for mitochondrial quality control under mitochondrial oxidative stress
Inhibition of the MAD results in reduction in chronological lifespan
MAD substrates are not only on the mitochondrial surface but also within the organelle
ACKNOWLEDGMENTS
We thank members of the Pon laboratory for technical assistance and valuable discussion, Dr. Steven P. Gygi (Harvard Medical School, Boston) for providing the SUB592 strain, and Dr. Richard Gardner (University of Washington, Seattle) for providing cdc48-3 and its parental strains. This work was supported by awards from the National Institutes of Health (NIH), United States (GM45735, GM122589, and AG051047) to L.A.P. We thank Dr. Rajesh Soni in the Proteomics Shared Resource and Dr. Theresa Swayne in the Confocal and Specialized Microscopy Shared Resource for valuable discussion. Both Shared Resources are in the Herbert Irving Comprehensive Cancer Center at Columbia University Medical Center and are supported in part by an award from the NIH/NCI (5 P30 CA13696).
Footnotes
SUPPLEMENTAL INFORMATION
Supplemental Information can be found online at https://doi.org/10.1016/j.celrep.2020.107902.
DECLARATION OF INTERESTS
The authors declare no competing interests.
REFERENCES
- Aguilaniu H, Gustafsson L, Rigoulet M, and Nyström T (2003). Asymmetric inheritance of oxidatively damaged proteins during cytokinesis. Science 299, 1751–1753. [DOI] [PubMed] [Google Scholar]
- Arlt H, Tauer R, Feldmann H, Neupert W, and Langer T (1996). The YTA10–12 complex, an AAA protease with chaperone-like activity in the inner membrane of mitochondria. Cell 85, 875–885. [DOI] [PubMed] [Google Scholar]
- Arlt H, Steglich G, Perryman R, Guiard B, Neupert W, and Langer T (1998). The formation of respiratory chain complexes in mitochondria is under the proteolytic control of the m-AAA protease. EMBO J 17, 4837–4847. [DOI] [PMC free article] [PubMed] [Google Scholar]
- Ashrafi G, and Schwarz TL (2013). The pathways of mitophagy for quality control and clearance of mitochondria. Cell Death Differ 20, 31–42. [DOI] [PMC free article] [PubMed] [Google Scholar]
- Azzu V, and Brand MD (2010). Degradation of an intramitochondrial protein by the cytosolic proteasome. J. Cell Sci 123, 578–585. [DOI] [PMC free article] [PubMed] [Google Scholar]
- Bähler J, Wu JQ, Longtine MS, Shah NG, McKenzie A 3rd, Steever AB, Wach A, Philippsen P, and Pringle JR (1998). Heterologous modules for efficient and versatile PCR-based gene targeting in Schizosaccharomyces pombe. Yeast 14, 943–951. [DOI] [PubMed] [Google Scholar]
- Bender T, Lewrenz I, Franken S, Baitzel C, and Voos W (2011). Mitochondrial enzymes are protected from stress-induced aggregation by mitochondrial chaperones and the Pim1/LON protease. Mol. Biol. Cell 22, 541–554. [DOI] [PMC free article] [PubMed] [Google Scholar]
- Bragoszewski P, Wasilewski M, Sakowska P, Gornicka A, Böttinger L, Qiu J, Wiedemann N, and Chacinska A (2015). Retro-translocation of mitochondrial intermembrane space proteins. Proc. Natl. Acad. Sci. USA 112, 7713–7718. [DOI] [PMC free article] [PubMed] [Google Scholar]
- Braun RJ, and Westermann B (2017). With the Help of MOM: Mitochondrial Contributions to Cellular Quality Control. Trends Cell Biol 27, 441–452. [DOI] [PubMed] [Google Scholar]
- Brookes PS, Yoon Y, Robotham JL, Anders MW, and Sheu SS (2004). Calcium, ATP, and ROS: a mitochondrial love-hate triangle. Am. J. Physiol. Cell Physiol 287, C817–C833. [DOI] [PubMed] [Google Scholar]
- Butow RA, and Avadhani NG (2004). Mitochondrial signaling: the retrograde response. Mol. Cell 14, 1–15. [DOI] [PubMed] [Google Scholar]
- Chen YC, Umanah GK, Dephoure N, Andrabi SA, Gygi SP, Dawson TM, Dawson VL, and Rutter J (2014). Msp1/ATAD1 maintains mitochondrial function by facilitating the degradation of mislocalized tail-anchored proteins. EMBO J 33, 1548–1564. [DOI] [PMC free article] [PubMed] [Google Scholar]
- Cochemé HM, and Murphy MP (2008). Complex I is the major site of mitochondrial superoxide production by paraquat. J. Biol. Chem 283, 1786–1798. [DOI] [PubMed] [Google Scholar]
- Cohen MM, Leboucher GP, Livnat-Levanon N, Glickman MH, and Weissman AM (2008). Ubiquitin-proteasome-dependent degradation of a mitofusin, a critical regulator of mitochondrial fusion. Mol. Biol. Cell 19, 2457–2464. [DOI] [PMC free article] [PubMed] [Google Scholar]
- Cox J, and Mann M (2008). MaxQuant enables high peptide identification rates, individualized p.p.b.-range mass accuracies and proteome-wide protein quantification. Nat. Biotechnol 26, 1367–1372. [DOI] [PubMed] [Google Scholar]
- Cox J, Neuhauser N, Michalski A, Scheltema RA, Olsen JV, and Mann M (2011). Andromeda: a peptide search engine integrated into the MaxQuant environment. J. Proteome Res 10, 1794–1805. [DOI] [PubMed] [Google Scholar]
- Cox J, Hein MY, Luber CA, Paron I, Nagaraj N, and Mann M (2014). Accurate proteome-wide label-free quantification by delayed normalization and maximal peptide ratio extraction, termed MaxLFQ. Mol. Cell. Proteomics 13, 2513–2526. [DOI] [PMC free article] [PubMed] [Google Scholar]
- Cristóvão AC, Choi DH, Baltazar G, Beal MF, and Kim YS (2009). The role of NADPH oxidase 1-derived reactive oxygen species in paraquat-mediated dopaminergic cell death. Antioxid. Redox Signal 11, 2105–2118. [DOI] [PMC free article] [PubMed] [Google Scholar]
- D’Autréaux B, and Toledano MB (2007). ROS as signalling molecules: mechanisms that generate specificity in ROS homeostasis. Nat. Rev. Mol. Cell Biol 8, 813–824. [DOI] [PubMed] [Google Scholar]
- Dukan S, and Nyström T (1998). Bacterial senescence: stasis results in increased and differential oxidation of cytoplasmic proteins leading to developmental induction of the heat shock regulon. Genes Dev 12, 3431–3441. [DOI] [PMC free article] [PubMed] [Google Scholar]
- Fabrizio P, and Longo VD (2003). The chronological life span of Saccharomyces cerevisiae. Aging Cell 2, 73–81. [DOI] [PubMed] [Google Scholar]
- Fabrizio P, and Longo VD (2007). The chronological life span of Saccharomyces cerevisiae. Methods Mol. Biol 371, 89–95. [DOI] [PubMed] [Google Scholar]
- Federico A, Cardaioli E, Da Pozzo P, Formichi P, Gallus GN, and Radi E (2012). Mitochondria, oxidative stress and neurodegeneration. J. Neurol. Sci 322, 254–262. [DOI] [PubMed] [Google Scholar]
- Funakoshi M, and Hochstrasser M (2009). Small epitope-linker modules for PCR-based C-terminal tagging in Saccharomyces cerevisiae. Yeast 26, 185–192. [DOI] [PMC free article] [PubMed] [Google Scholar]
- Funakoshi M, Tomko RJ Jr., Kobayashi H, and Hochstrasser M (2009). Multiple assembly chaperones govern biogenesis of the proteasome regulatory particle base. Cell 137, 887–899. [DOI] [PMC free article] [PubMed] [Google Scholar]
- Gadaleta MC, Iwasaki O, Noguchi C, Noma K, and Noguchi E (2013). New vectors for epitope tagging and gene disruption in Schizosaccharomyces pombe. Biotechniques 55, 257–263. [DOI] [PMC free article] [PubMed] [Google Scholar]
- Gauss R, Trautwein M, Sommer T, and Spang A (2005). New modules for the repeated internal and N-terminal epitope tagging of genes in Saccharomyces cerevisiae. Yeast 22, 1–12. [DOI] [PubMed] [Google Scholar]
- Gibson GE, Starkov A, Blass JP, Ratan RR, and Beal MF (2010). Cause and consequence: mitochondrial dysfunction initiates and propagates neuronal dysfunction, neuronal death and behavioral abnormalities in age-associated neurodegenerative diseases. Biochim. Biophys. Acta 1802, 122–134. [DOI] [PMC free article] [PubMed] [Google Scholar]
- Hamilton ML, Van Remmen H, Drake JA, Yang H, Guo ZM, Kewitt K, Walter CA, and Richardson A (2001). Does oxidative damage to DNA increase with age? Proc. Natl. Acad. Sci. USA 98, 10469–10474. [DOI] [PMC free article] [PubMed] [Google Scholar]
- Hanna J, Hathaway NA, Tone Y, Crosas B, Elsasser S, Kirkpatrick DS, Leggett DS, Gygi SP, King RW, and Finley D (2006). Deubiquitinating enzyme Ubp6 functions noncatalytically to delay proteasomal degradation. Cell 127, 99–111. [DOI] [PubMed] [Google Scholar]
- Hanson GT, Aggeler R, Oglesbee D, Cannon M, Capaldi RA, Tsien RY, and Remington SJ (2004). Investigating mitochondrial redox potential with redox-sensitive green fluorescent protein indicators. J. Biol. Chem 279, 13044–13053. [DOI] [PubMed] [Google Scholar]
- Heo JM, Livnat-Levanon N, Taylor EB, Jones KT, Dephoure N, Ring J, Xie J, Brodsky JL, Madeo F, Gygi SP, et al. (2010). A stress-responsive system for mitochondrial protein degradation. Mol. Cell 40, 465–480. [DOI] [PMC free article] [PubMed] [Google Scholar]
- Hirsch C, Gauss R, Horn SC, Neuber O, and Sommer T (2009). The ubiquitylation machinery of the endoplasmic reticulum. Nature 458, 453–460. [DOI] [PubMed] [Google Scholar]
- Huibregtse JM, Scheffner M, Beaudenon S, and Howley PM (1995). A family of proteins structurally and functionally related to the E6-AP ubiquitin-protein ligase. Proc. Natl. Acad. Sci. USA 92, 2563–2567. [DOI] [PMC free article] [PubMed] [Google Scholar]
- Huibregtse JM, Yang JC, and Beaudenon SL (1997). The large subunit of RNA polymerase II is a substrate of the Rsp5 ubiquitin-protein ligase. Proc. Natl. Acad. Sci. USA 94, 3656–3661. [DOI] [PMC free article] [PubMed] [Google Scholar]
- Izawa T, Park SH, Zhao L, Hartl FU, and Neupert W (2017). Cytosolic Protein Vms1 Links Ribosome Quality Control to Mitochondrial and Cellular Homeostasis. Cell 171, 890–903. e818. [DOI] [PubMed] [Google Scholar]
- Johnson ES, Ma PC, Ota IM, and Varshavsky A (1995). A proteolytic pathway that recognizes ubiquitin as a degradation signal. J. Biol. Chem 270, 17442–17456. [DOI] [PubMed] [Google Scholar]
- Kaida D, Toh-e A, and Kikuchi Y (2003). Rsp5-Bul1/2 complex is necessary for the HSE-mediated gene expression in budding yeast. Biochem. Biophys. Res. Commun 306, 1037–1041. [DOI] [PubMed] [Google Scholar]
- Kanki T, Kang D, and Klionsky DJ (2009a). Monitoring mitophagy in yeast: the Om45-GFP processing assay. Autophagy 5, 1186–1189. [DOI] [PMC free article] [PubMed] [Google Scholar]
- Kanki T, Wang K, Cao Y, Baba M, and Klionsky DJ (2009b). Atg32 is a mitochondrial protein that confers selectivity during mitophagy. Dev. Cell 17, 98–109. [DOI] [PMC free article] [PubMed] [Google Scholar]
- Katzmann DJ, Sarkar S, Chu T, Audhya A, and Emr SD (2004). Multivesicular body sorting: ubiquitin ligase Rsp5 is required for the modification and sorting of carboxypeptidase S. Mol. Biol. Cell 15, 468–480. [DOI] [PMC free article] [PubMed] [Google Scholar]
- Ladner CL, Yang J, Turner RJ, and Edwards RA (2004). Visible fluorescent detection of proteins in polyacrylamide gels without staining. Anal. Biochem 326, 13–20. [DOI] [PubMed] [Google Scholar]
- Laughery MF, Hunter T, Brown A, Hoopes J, Ostbye T, Shumaker T, and Wyrick JJ (2015). New vectors for simple and streamlined CRISPR-Cas9 genome editing in Saccharomyces cerevisiae. Yeast 32, 711–720. [DOI] [PMC free article] [PubMed] [Google Scholar]
- Lavie J, De Belvalet H, Sonon S, Ion AM, Dumon E, Melser S, Lacombe D, Dupuy JW, Lalou C, and Bénard G (2018). Ubiquitin-Dependent Degradation of Mitochondrial Proteins Regulates Energy Metabolism. Cell Rep 23, 2852–2863. [DOI] [PubMed] [Google Scholar]
- Lee BH, Lu Y, Prado MA, Shi Y, Tian G, Sun S, Elsasser S, Gygi SP, King RW, and Finley D (2016). USP14 deubiquitinates proteasome-bound substrates that are ubiquitinated at multiple sites. Nature 532, 398–401. [DOI] [PMC free article] [PubMed] [Google Scholar]
- Lehmann G, Ziv T, Braten O, Admon A, Udasin RG, and Ciechanover A (2016). Ubiquitination of specific mitochondrial matrix proteins. Biochem. Biophys. Res. Commun 475, 13–18. [DOI] [PubMed] [Google Scholar]
- Leonhard K, Herrmann JM, Stuart RA, Mannhaupt G, Neupert W, and Langer T (1996). AAA proteases with catalytic sites on opposite membrane surfaces comprise a proteolytic system for the ATP-dependent degradation of inner membrane proteins in mitochondria. EMBO J 15, 4218–4229. [PMC free article] [PubMed] [Google Scholar]
- Leonhard K, Stiegler A, Neupert W, and Langer T (1999). Chaperone-like activity of the AAA domain of the yeast Yme1 AAA protease. Nature 398, 348–351. [DOI] [PubMed] [Google Scholar]
- Liao PC, Boldogh IR, Siegmund SE, Freyberg Z, and Pon LA (2018). Isolation of mitochondria from Saccharomyces cerevisiae using magnetic bead affinity purification. PLoS ONE 13, e0196632. [DOI] [PMC free article] [PubMed] [Google Scholar]
- Longo VD, Shadel GS, Kaeberlein M, and Kennedy B (2012). Replicative and chronological aging in Saccharomyces cerevisiae. Cell Metab 16, 18–31. [DOI] [PMC free article] [PubMed] [Google Scholar]
- Luhtala N, and Odorizzi G (2004). Bro1 coordinates deubiquitination in the multivesicular body pathway by recruiting Doa4 to endosomes. J. Cell Biol 166, 717–729. [DOI] [PMC free article] [PubMed] [Google Scholar]
- Lyubarev AE, and Kurganov BI (1989). Supramolecular organization of tricarboxylic acid cycle enzymes. Biosystems 22, 91–102. [DOI] [PubMed] [Google Scholar]
- Mannhaupt G, Schnall R, Karpov V, Vetter I, and Feldmann H (1999). Rpn4p acts as a transcription factor by binding to PACE, a nonamer box found upstream of 26S proteasomal and other genes in yeast. FEBS Lett 450, 27–34. [DOI] [PubMed] [Google Scholar]
- Margineantu DH, Emerson CB, Diaz D, and Hockenbery DM (2007). Hsp90 inhibition decreases mitochondrial protein turnover. PLoS ONE 2, e1066. [DOI] [PMC free article] [PubMed] [Google Scholar]
- Mårtensson CU, Priesnitz C, Song J, Ellenrieder L, Doan KN, Boos F, Floerchinger A, Zufall N, Oeljeklaus S, Warscheid B, and Becker T (2019). Mitochondrial protein translocation-associated degradation. Nature 569, 679–683. [DOI] [PubMed] [Google Scholar]
- Matsumoto S, Nakatsukasa K, Kakuta C, Tamura Y, Esaki M, and Endo T (2019). Msp1 Clears Mistargeted Proteins by Facilitating Their Transfer from Mitochondria to the ER. Mol. Cell 76, 191–205. e110. [DOI] [PubMed] [Google Scholar]
- May AI, Devenish RJ, and Prescott M (2012). The many faces of mitochondrial autophagy: making sense of contrasting observations in recent research. Int. J. Cell Biol 2012, 431684. [DOI] [PMC free article] [PubMed] [Google Scholar]
- Mayor T, Lipford JR, Graumann J, Smith GT, and Deshaies RJ (2005). Analysis of polyubiquitin conjugates reveals that the Rpn10 substrate receptor contributes to the turnover of multiple proteasome targets. Mol. Cell. Proteomics 4, 741–751. [DOI] [PubMed] [Google Scholar]
- Mayor T, Graumann J, Bryan J, MacCoss MJ, and Deshaies RJ (2007). Quantitative profiling of ubiquitylated proteins reveals proteasome substrates and the substrate repertoire influenced by the Rpn10 receptor pathway. Mol. Cell. Proteomics 6, 1885–1895. [DOI] [PubMed] [Google Scholar]
- McFaline-Figueroa JR, Vevea J, Swayne TC, Zhou C, Liu C, Leung G, Boldogh IR, and Pon LA (2011). Mitochondrial quality control during inheritance is associated with lifespan and mother-daughter age asymmetry in budding yeast. Aging Cell 10, 885–895. [DOI] [PMC free article] [PubMed] [Google Scholar]
- Morano KA, Grant CM, and Moye-Rowley WS (2012). The response to heat shock and oxidative stress in Saccharomyces cerevisiae. Genetics 190, 1157–1195. [DOI] [PMC free article] [PubMed] [Google Scholar]
- Mullally JE, Chernova T, and Wilkinson KD (2006). Doa1 is a Cdc48 adapter that possesses a novel ubiquitin binding domain. Mol. Cell. Biol 26, 822–830. [DOI] [PMC free article] [PubMed] [Google Scholar]
- Mumberg D, Müller R, and Funk M (1995). Yeast vectors for the controlled expression of heterologous proteins in different genetic backgrounds. Gene 156, 119–122. [DOI] [PubMed] [Google Scholar]
- Murakami C, and Kaeberlein M (2009). Quantifying yeast chronological life span by outgrowth of aged cells. J. Vis. Exp (27), 1156. [DOI] [PMC free article] [PubMed] [Google Scholar]
- Ng DT, Spear ED, and Walter P (2000). The unfolded protein response regulates multiple aspects of secretory and membrane protein biogenesis and endoplasmic reticulum quality control. J. Cell Biol 150, 77–88. [DOI] [PMC free article] [PubMed] [Google Scholar]
- Nijtmans LG, de Jong L, Artal Sanz M, Coates PJ, Berden JA, Back JW, Muijsers AO, van der Spek H, and Grivell LA (2000). Prohibitins act as a membrane-bound chaperone for the stabilization of mitochondrial proteins. EMBO J 19, 2444–2451. [DOI] [PMC free article] [PubMed] [Google Scholar]
- Okamoto K, Kondo-Okamoto N, and Ohsumi Y (2009). Mitochondria-anchored receptor Atg32 mediates degradation of mitochondria via selective autophagy. Dev. Cell 17, 87–97. [DOI] [PubMed] [Google Scholar]
- Okreglak V, and Walter P (2014). The conserved AAA-ATPase Msp1 confers organelle specificity to tail-anchored proteins. Proc. Natl. Acad. Sci. USA 111, 8019–8024. [DOI] [PMC free article] [PubMed] [Google Scholar]
- Owsianik G, Balzi I L, and Ghislain M (2002). Control of 26S proteasome expression by transcription factors regulating multidrug resistance in Saccharomyces cerevisiae. Mol. Microbiol 43, 1295–1308. [DOI] [PubMed] [Google Scholar]
- Peng J, Schwartz D, Elias JE, Thoreen CC, Cheng D, Marsischky G, Roelofs J, Finley D, and Gygi SP (2003). A proteomics approach to understanding protein ubiquitination. Nat. Biotechnol 21, 921–926. [DOI] [PubMed] [Google Scholar]
- Quirós PM, Langer T, and López-Otín C (2015). New roles for mitochondrial proteases in health, ageing and disease. Nat. Rev. Mol. Cell Biol 16, 345–359. [DOI] [PubMed] [Google Scholar]
- Repetto B, and Tzagoloff A (1989). Structure and regulation of KGD1, the structural gene for yeast alpha-ketoglutarate dehydrogenase. Mol. Cell. Biol 9, 2695–2705. [DOI] [PMC free article] [PubMed] [Google Scholar]
- Reverter-Branchat G, Cabiscol E, Tamarit J, and Ros J (2004). Oxidative damage to specific proteins in replicative and chronological-aged Saccharomyces cerevisiae: common targets and prevention by calorie restriction. J. Biol. Chem 279, 31983–31989. [DOI] [PubMed] [Google Scholar]
- Robinson MD, Grigull J, Mohammad N, and Hughes TR (2002). Fun-Spec: a web-based cluster interpreter for yeast. BMC Bioinformatics 3, 35. [DOI] [PMC free article] [PubMed] [Google Scholar]
- Saeki Y, Toh-E A, Kudo T, Kawamura H, and Tanaka K (2009). Multiple proteasome-interacting proteins assist the assembly of the yeast 19S regulatory particle. Cell 137, 900–913. [DOI] [PubMed] [Google Scholar]
- Schnall R, Mannhaupt G, Stucka R, Tauer R, Ehnle S, Schwarzlose C, Vetter I, and Feldmann H (1994). Identification of a set of yeast genes coding for a novel family of putative ATPases with high similarity to constituents of the 26S protease complex. Yeast 10, 1141–1155. [DOI] [PubMed] [Google Scholar]
- Shevchenko A, Tomas H, Havlis J, Olsen JV, and Mann M (2006). In-gel digestion for mass spectrometric characterization of proteins and proteomes. Nat. Protoc 1, 2856–2860. [DOI] [PubMed] [Google Scholar]
- Slubowski CJ, Funk AD, Roesner JM, Paulissen SM, and Huang LS (2015). Plasmids for C-terminal tagging in Saccharomyces cerevisiae that contain improved GFP proteins, Envy and Ivy. Yeast 32, 379–387. [DOI] [PMC free article] [PubMed] [Google Scholar]
- Somesh BP, Reid J, Liu WF, Søgaard TM, Erdjument-Bromage H, Tempst P, and Svejstrup JQ (2005). Multiple mechanisms confining RNA polymerase II ubiquitylation to polymerases undergoing transcriptional arrest. Cell 121, 913–923. [DOI] [PubMed] [Google Scholar]
- Son Y, Kim S, Chung HT, and Pae HO (2013). Reactive oxygen species in the activation of MAP kinases. Methods Enzymol 528, 27–48. [DOI] [PubMed] [Google Scholar]
- Spence J, Gali RR, Dittmar G, Sherman F, Karin M, and Finley D (2000). Cell cycle-regulated modification of the ribosome by a variant multiubiquitin chain. Cell 102, 67–76. [DOI] [PubMed] [Google Scholar]
- Stankowski JN, Codreanu SG, Liebler DC, and McLaughlin B (2011). Analysis of Protein Targets by Oxidative Stress Using the OxyBlot and Biotin-Avidin-Capture Methodology. Neuromethods 56, 365–381. [Google Scholar]
- Su T, Izawa T, Thoms M, Yamashita Y, Cheng J, Berninghausen O, Hartl FU, Inada T, Neupert W, and Beckmann R (2019). Structure and function of Vms1 and Arb1 in RQC and mitochondrial proteome homeostasis. Nature 570, 538–542. [DOI] [PubMed] [Google Scholar]
- Supek F, Bošnjak M, Škunca N, and Šmuc T (2011). REVIGO summarizes and visualizes long lists of gene ontology terms. PLoS ONE 6, e21800. [DOI] [PMC free article] [PubMed] [Google Scholar]
- Suzuki K, and Ohsumi Y (2007). Molecular machinery of autophagosome formation in yeast, Saccharomyces cerevisiae. FEBS Lett 581, 2156–2161. [DOI] [PubMed] [Google Scholar]
- Tanaka A, Cleland MM, Xu S, Narendra DP, Suen DF, Karbowski M, and Youle RJ (2010). Proteasome and p97 mediate mitophagy and degradation of mitofusins induced by Parkin. J. Cell Biol 191, 1367–1380. [DOI] [PMC free article] [PubMed] [Google Scholar]
- Tretter L, and Adam-Vizi V (2005). Alpha-ketoglutarate dehydrogenase: a target and generator of oxidative stress. Philos. Trans. R. Soc. Lond. B Biol. Sci 360, 2335–2345. [DOI] [PMC free article] [PubMed] [Google Scholar]
- Vevea JD, Alessi Wolken DM, Swayne TC, White AB, and Pon LA (2013). Ratiometric biosensors that measure mitochondrial redox state and ATP in living yeast cells. J. Vis. Exp (77), 50633. [DOI] [PMC free article] [PubMed] [Google Scholar]
- Voth WP, Richards JD, Shaw JM, and Stillman DJ (2001). Yeast vectors for integration at the HO locus. Nucleic Acids Res 29, E59–9. [DOI] [PMC free article] [PubMed] [Google Scholar]
- Wang G, Yang J, and Huibregtse JM (1999). Functional domains of the Rsp5 ubiquitin-protein ligase. Mol. Cell. Biol 19, 342–352. [DOI] [PMC free article] [PubMed] [Google Scholar]
- Weidberg H, and Amon A (2018). MitoCPR-A surveillance pathway that protects mitochondria in response to protein import stress. Science 360, eaan4146. [DOI] [PMC free article] [PubMed] [Google Scholar]
- Wu X, Li L, and Jiang H (2016). Doa1 targets ubiquitinated substrates for mitochondria-associated degradation. J. Cell Biol 213, 49–63. [DOI] [PMC free article] [PubMed] [Google Scholar]
- Xie Y, and Varshavsky A (2001). RPN4 is a ligand, substrate, and transcriptional regulator of the 26S proteasome: a negative feedback circuit. Proc. Natl. Acad. Sci. USA 98, 3056–3061. [DOI] [PMC free article] [PubMed] [Google Scholar]
- Xu S, Peng G, Wang Y, Fang S, and Karbowski M (2011). The AAA-ATPase p97 is essential for outer mitochondrial membrane protein turnover. Mol. Biol. Cell 22, 291–300. [DOI] [PMC free article] [PubMed] [Google Scholar]
- Youle RJ, and Narendra DP (2011). Mechanisms of mitophagy. Nat. Rev. Mol. Cell Biol 12, 9–14. [DOI] [PMC free article] [PubMed] [Google Scholar]
Associated Data
This section collects any data citations, data availability statements, or supplementary materials included in this article.
Supplementary Materials
Data Availability Statement
The RNA-seq generated during this study are available at GEO: GSE150804.