

Abstract
Differential gene expression in the airway epithelium of asthmatics vs. controls has been reported in several studies. However, there is no consensus on which genes are reproducibly affected in asthma. We sought to identify a consensus list of differentially expressed genes (DEGs) using a meta-analysis approach.
We identified eight studies with data that met defined inclusion criteria. In total, these studies were comprised of 355 cases and 193 controls and involved sampling of either bronchial or nasal epithelium. We conducted study-level analyses, followed by a meta-analysis. Likewise, we applied a meta-analysis framework to the results of study-level pathway enrichment.
We identified 1,273 DEGs, 431 of which had not been identified in previous studies. 450 DEGs exhibited large effect sizes and were robust to study population differences in age, sex, race/ethnicity, medication use, smoking status, and exacerbations. The magnitude of differential expression of these 450 genes was highly similar in bronchial and nasal airway epithelia. Meta-analysis of pathway enrichment revealed a number of consistently dysregulated biological pathways, including putative transcriptional and post-transcriptional regulators.
In total, we identified a set of genes that are consistently dysregulated in asthma, link to known and novel biological pathways, and will inform asthma sub-type identification.
Introduction
Multiple lines of evidence indicate that the airway epithelium plays an important role in the pathogenesis of asthma. Pattern recognition receptors, cytokines, and alarmins secreted by airway epithelia play critical roles in the initiation of allergic inflammation [1]. Results from genome-wide association studies (GWAS) also implicate genes expressed by the airway epithelium, such as IL33 and TSLP [2]. Protease containing allergens (e.g., house dust mite) disrupt epithelial barrier intregity, and there is evidence of decreased barrier function in asthmatics [3]. Lastly, the hallmark asthma phenotype of mucus hyper-secretion is caused by changes in the function and activity of secretory cells in the airway and submucosal glands [4].
Transcriptomic studies of airway epithelium have provided a snapshot of the state of this tissue after disease onset. Woodruff et al. first reported on the identification of 22 genes that were differentially expressed between asthma cases and controls [6]. This group later showed that that the expression of just three genes (POSTN, CLCA1, and SERPINB1) distinguished “Th2-high” from “Th2-low” sub-types of asthma and was associated with response to inhaled corticosteroids [7]. Other studies have shown that changes in gene expression are mirrored by changes in the epithelial methylome [7, 8] and that distinct gene sets are associated with asthma exacerbations [10, 11]. Thus, the airway epithelium may not only be crucially involved in disease pathogenesis, but can also provide information about disease status (i.e., exacerbations) and therapeutic response.
Since the initial studies of gene expression in epithelial cells in asthma, more have followed, including studies with larger sample sizes and different demographics. While these more recent studies have contributed to our newly appreciated understanding of epithelial responses in asthma, with few exceptions there is no consensus on which genes and pathways are reproducibly affected in asthma. We therefore set out to utilize existing gene expression datasets to identify which genes were consistently dysregulated in the airway epithelium of asthma cases versus controls using a meta-analysis approach. In lieu of sampling bronchial epithelium, some studies utilized nasal epithelia, allowing us to assess the concordance of results between nasal and bronchial epithelia. We also used the asthma case-control gene expression data to evaluate enrichment of biological pathways implicated in a similar meta-analysis framework.
Methods
Additional information on methods is available in the Supplement.
Study identification
Case-control studies were identified in PubMed, NCBI’s Gene Expression Omnibus (GEO) and EMBL EBI’s ArrayExpress using search terms including “asthma”, “airway epithelia”, “bronchial epithelia”, and “nasal epithelia” (or combinations thereof). In total, we identified 18 studies (Supplementary Table 1). Some publications contained overlapping study populations, thus we chose one study from each set to avoid duplication (see Supplement for details). Prior to reviewing the studies, we designated a set of study exclusion criteria. These included: (1) lacking a case definition, (2) sample size less than five in any study group (cases or controls), which would limit power, or (3) unavailability of gene expression or covariate (age, sex and smoking) data. Covariate data were obtained either through the data repository or through contact with the study investigators. Application of the aforementioned exclusion criteria resulted in the exclusion of six studies (listed in Supplementary Table 1). After these exclusions, our meta-analysis consisted of eight studies comprising 548 subjects in total (355 cases and 193 controls). All eight studies used brushes to sample airway epithelium: two studies sampled nasal epithelia while the rest sampled bronchi. All studies but one utilized microarray platforms. Descriptions of each study are provided in Table 1.
Table 1.
Descriptive Summary of Studies Included in Gene Expression Meta-Analysis
| GEO ID | PMID | Expression measurement platform |
Epithelia source |
Asthma (#) |
Controls (#) |
Total Sample size |
Outliers (#) |
Mean Age (Range) |
Male / Female (%) |
Race/Ethnicity (%Caucasian / African American / Hispanic / Other) |
Covariates used in analysis |
DEGs* (#up / #down) |
|---|---|---|---|---|---|---|---|---|---|---|---|---|
| GSE19187 | 22005912 | Affymetrix Human Gene 1.0 ST Array | nasal | 13 | 11 | 24 | 0 | 11 (6-16) | 53/47 | 100/0/0/0 | age, sex | 116 (104/12) |
| GSE67472 | 25611785 | Affymetrix Human Genome U133 Plus 2.0 Array | bronchial | 62 | 43 | 105 | 1 | 35 (20-68) | 49/51 | 51/15/19/14 | age, sex, race, array batch | 6504 (4112/2392) |
| GSE63142 | 25338189 | Agilent-014850 Whole Human Genome Microarray 4x44K | bronchial | 125 | 27 | 152 | 6 | 36 (14-63) | 36/64 | 62/29/0/9 | age, sex, race | 1078 (662/416) |
| GSE65205 | 27745942 | Agilent-028004 SurePrint G3 Human GE 8x60K Microarray | nasal | 36 | 33 | 69 | 3 | 11 (9-12) | 49/51 | 0/100/0/0 | age, sex, study site | 147 (59/88) |
| GSE104472 | 28294656 | Agilent-028004 SurePrint G3 Human GE 8x60K Microarray | bronchial | 12 | 12 | 24 | 1 | 36 (24-74) | 42/58 | 100/0/0/0 | age, sex | 20 (13/7) |
| GSE64913 | 28045928 | Affymetrix HG U133 plus 2.0 | bronchial | 13 | 23 | 36 | 0 | 31 (19-63) | 59/41 | 100/0/0/0 | age, sex, array batch | 9 (7/2) |
| GSE89809 | 28933920 | Affymetrix HT HG− U133+ | bronchial | 38 | 16 | 54 | 3 | 38 (20-67) | 57/43 | 100/0/0/0 | age, sex, smoking | 2 (2/0) |
| GSE85568 | 27942592 | RNA-seq | bronchial | 56 | 28 | 84 | 3 | 39 (19-62) | 32/68 | 34/60/0/5 | age, sex, race, smoking | 17 (9/8) |
| 355 | 193 | 548 | ||||||||||
at FDR q-value < 0.1
Data processing, normalization, and annotation
The overall workflow for data acquisition, normalization, study-level analysis and meta-analysis is shown in Supplementary Figure 1. Data were obtained either from GEO or directly from the study investigator. Affymetrix array data were normalized using robust multi-array averaging [11] and Agilent array data were quantile normalized and then log2 transformed (see Supplementary Table 2). Normalized read counts from the single RNA-seq dataset (GSE85568) were also log2 transformed. In most cases, we used the array probe-gene annotation provided in GEO corresponding to the array platform used (see Supplementary Table 2).
Study level analyses
To identify outlier samples within each study, we used Bolstad’s relative log expression method [12]. We then conducted an analysis to identify differentially expressed genes using LIMMA [13], adjusting at a minimum for age, sex and race, but in some cases also smoking status and array hybridization batch (see Table 1). For each study, p-values were adjusted using the false discovery rate (FDR) correction method [14], and we recorded the t statistic, beta, p-value, log fold change, Cohen’s D and Hedges’ adjusted g for use in the meta-analysis.
Meta-analysis
We estimated summary effect sizes for each gene using an inverse variance model as advocated by Ramasamy et al. [15]. Specifically, we calculated pooled effect sizes using Hedges’ adjusted g and included the use of a random effects model to account for between study heterogeneity. This analysis was carried out using the R package meta [16]. We declared genes as differentially expressed (DE) if the meta-analysis false discovery rate (FDR) adjusted p-value (q value) was less than 0.05 and the gene was evaluated in at least two of the eight studies.
Overlap of Asthma DEGs with GWAS hits
To assess whether any of the differentially expressed genes (DEGs) we identified by meta-analysis were also implicated by GWAS, we merged our meta-analysis results with data the NHGRI-EBI Catalog of published GWAS (https://www.ebi.ac.uk/gwas/, accessed on 1/31/2018) [17]. To be inclusive, we applied a GWAS p-value threshold of 1x10⁻⁷. We used the gene reported by the original study as the key identifier, acknowledging that the gene implicated by GWAS is not necessarily the causal gene. If the same gene was reported from multiple GWAS, we report the single most significant result.
Pathway Enrichment Meta-Analysis
We evaluated pathway enrichment in each study using Gene Set Variation Analysis (GSVA) [18]. Briefly, GSVA works by estimating a gene set score in an unsupervised way by calculating an enrichment statistic for each gene set in each study (see Supplement). In this way, the gene by sample matrix is transformed to a matrix of gene set by sample. The gene set by sample matrix was then used for study-level differential expression analysis, followed by meta-analysis using the same methods as described above for individual genes. Gene sets for analysis were collected from Enrichr (http://amp.pharm.mssm.edu/Enrichr/) and include KEGG and Biocarta pathways, transcription factor targets from ENCODE, and many others (see Supplement).
Results
Study level analyses
We obtained gene expression and covariate data for 355 cases and 193 controls from eight studies (Table 1). Demographic variables differed considerably between studies. For example, two studies were comprised exclusively of children, while the remaining were comprised largely of adults of a wide age range (20-74 years). Across studies the percent of study subjects that were female ranged from ~40 to 70%. While by and large most study subjects were Caucasian, some studies involved African-Americans, Hispanics, Asians, or other racial/ethnic categories. Except for two studies, most studies involved exclusively non-smoking subjects.
For each study, we conducted an analysis to identify DEGs after the exclusion of outliers (Supplementary Figure 2). Because different studies utilized different array platforms (or RNA-seq) with different numbers of genes tested, we compared the eight studies by plotting the fraction of genes identified as DE (Supplementary Figure 3, Supplementary Table 2). These values ranged from 0.01% to 27%, with no obvious correlation between sample size and the fraction of DEGs detected.
Meta-analysis
We then applied a meta-analysis approach, using a random effects model to allow for heterogeneity in effect sizes across studies. In total, we identified 1,273 genes that were DE with q-values < 0.05 (Figure 1, Supplementary Table 3), the majority (64%) of which were upregulated. Notably, more than one third of these DEGs (n = 431 or 34%) were not identified as DE in any single study (at FDR q<0.05), highlighting the utility of the approach to reveal genes of interest. In terms of effect size, CST1 (up) and APELA (down) were the most extreme genes; in terms of statistical significance, CEACAM5 (up) and C3 (down) were the most affected genes.
Figure 1. DEGs identified by meta-analysis.

Genes are color-coded by the number of studies (k, from 2 to 8) in which they were evaluated, and those with adjusted p-values < 1x10⁻⁵ and pooled effect size > 0.7 are labeled.
As expected, the three Th2 biomarker genes (POSTN, CLCA1, and SERPINB1) were consistently upregulated, though with some heterogeneity in effect size across studies (Figure 2). Likewise, genes positively associated with mucus production (e.g., IL13, FOXA3, and MUC5AC) were increased significantly, while MUC5B and FOXA2 were downregulated. Genes related to endoplasmic reticulum stress (e.g., AGR2 and ERN1), which has been linked to mucin hyper-secretion [19, 20], were also upregulated, though XBP1 was not (see Supplementary Figure 4).
Figure 2. Differential gene expression across studies for emblematic genes.
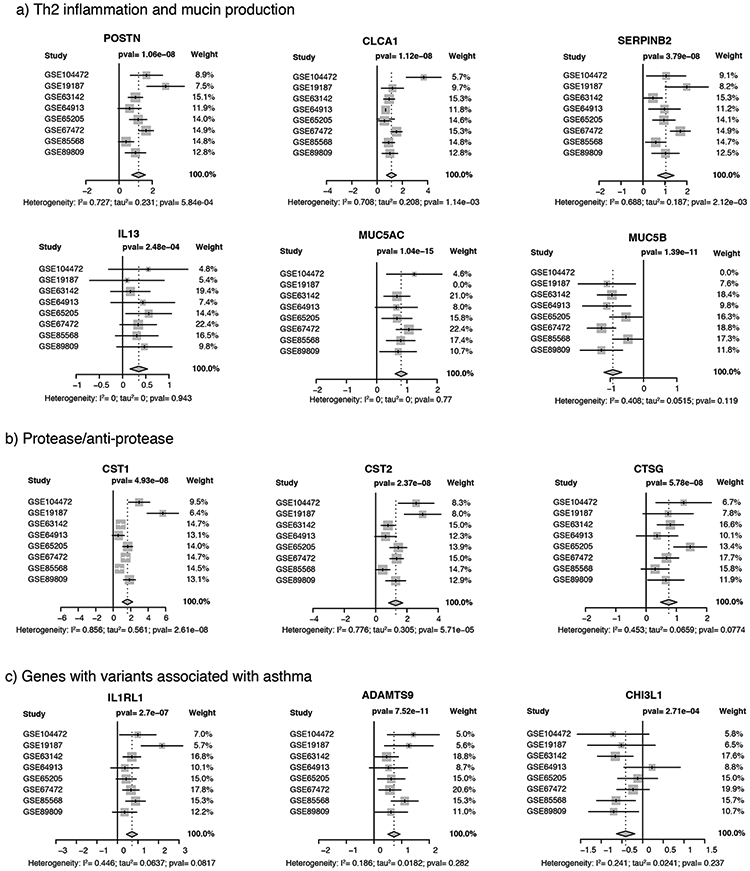
Forest plots for (a) genes related to Th2 mediated inflammation (POSTN, CLCA1, and SERPINB1) and mucin production (IL13, MUC5AC, and MUC5B); (b) Protease anti-protease balance (CST1, CST2, and CTSG); (c) Genes with variants associated with asthma (IL1RL1, ADAMTS9, and CHI3L1). White whiskers (for CST1) indicate that confidence interval is completely contained within the box representing the point estimate. Additional forest plots are provided in Supplementary Figure 4.
We noted an obvious enrichment of genes involved in protease/antiprotease pathways, including serine protease inhibitors (SERPINB2, SERPINB4, SERPINB8, and SERPINB10), cathepsins (CTSC and CTSG were upregulated while CTSL was down regulated), and cystatins (CST1, CST2, CST3, CST4, CST6, and CSTA) (Figure 2, Supplementary Figure 4). In contrast, genes involved in barrier function (including CLDN1, CLDN18, CLDN4, TJP1, TJP2, TJP3, OCLN, and CDH1) were not DE, with the sole exception of TJP1 (ZO1). Six genes reflective of recruited leukocytes were DE, including CCL26 and CLC, markers of eosinophils, and TPSAB1, CPA3, MS4A2 and HDC, markers of mast cells and/or basophils (see Supplementary Figure 4).
Seventeen genes implicated by GWAS were in the list of DEGs (Supplementary Table 4). While overall there was no over-representation of upregulated versus downregulated genes in this list, the five most differentially expressed genes in terms of effect size (LRRC8A, ALOX15, IL18R1, IL1RL1, ADAMTS9) were all upregulated. Conversely, all three HLA genes (HLA-DOA, HLA-DPA1, HLA-DRA) were downregulated. Surprisingly, we found that expression of the asthma associated gene CHI3L1 [21] was decreased among cases (Figure 2). Genes identified by positional cloning, including ADAM33, DPP10, PCDH1, HLA-G, and SPINK5, were not DE, nor was CDHR3 [22], a gene associated with asthma exacerbations.
A large number of genes (n = 450) were consistently DE across many of the eight studies and had large effect sizes, which we defined as pooled effect size (Hedges’ g) values greater than 0.5 (Figure 3, Supplementary Table 5). These findings indicate that differential expression of these genes is robust to differences in age, sex, smoking status, race/ethnicity, exacerbations, and tissue type (bronchial vs. nasal). We further examined the commonality of differential gene expression between bronchial and nasal epithelia by comparing the pooled effect sizes from the six studies involving bronchial epithelia versus the pooled effect size from the two studies involving nasal epithelia (Figure 4). This analysis revealed that the pattern of differential gene expression across tissue types was completely consistent for these 450 genes, and the magnitude of differential expression for most genes was only marginally decreased in nasal compared to bronchial epithelia (slope = 0.91, p<0.01 for test that slope = 1), though CST1 was more pronounced in nasal epithelia compared to bronchial epithelia.
Figure 3. Consistency of differential expression for DEGs with large effect size.

DEGs with adjusted p-values < 0.05 and pooled effect size > 0.5 are shown. Absolute log2 fold change values > than 2 or < −2 were set to 2 or −2. Missing values are shown in gray. 450 genes were identified with some degree of missingness across studies. For ease of viewing, the 349 genes with the least missingness are shown. A similar heatmap for all 1273 DEGs is provided in Supplementary Figure 5.
Figure 4. Similarity of differential expression in bronchial vs. nasal epithelium.

A comparison of pooled effect sizes for the top 450 DEGs is shown, along with best-fit linear regression line (red) and the line of identity (blue; i.e., if nasal = bronchial). The outlier gene at the top right is CST1.
Heterogeneity
While the consistency of differential gene expression signal in asthma cases versus controls was clear for many genes, in particular the Th2 marker genes POSTN, CLCA1, and SERPINB1, this level of analysis obscures potential heterogeneity which could inform disease mechanism and treatment [6]. To examine this, we plotted the distribution of aggregate expression scores for POSTN, CLCA1, and SERPINB1 (Figure 5). We found that while on average cases had higher levels of expression of these genes in aggregate, within each study the distribution ranged widely and was in some cases bimodal (e.g., GSE67472). Additionally, in some studies there were cases with lower Th2 gene expression than controls (e.g., GSE63142).
Figure 5. Variation in Th2 marker gene expression among studies and samples.

The sum of gene expression for POSTN, CLCA1, and SERPINB2 (in log2 units), are plotted as a function of case-control status across each study. Cases are shown in red and controls in blue. In these violin plots, white dots denote median, the thick black bars correspond to first to third quartiles of the distribution, and the bottom and top whiskers correspond to the first quartile − 1.5*IQR and the third quantile + 1.5*IQR, respectively, where IQR = interquartile range.
Effect of Steroids
The lack of data on medication use precluded a systematic analysis of inhaled corticosteroid (ICS) effect. Hence, we compared our list of DEGs to previous studies which examined the effect ICS on airway epithelia transcriptomes [5, 23], which in aggregate identified 111 genes. Fifteen asthma DEGs were also a part of this list of ICS-responsive genes, including ALOX15B, POSTN, CLCA1, and SERPINB1, and CST1 (Supplementary Table 6).
Pathway Meta-analyses
To examine the effect of differential gene expression at the level of biological pathways, which could be reveal additional disease-associated effects that are not apparent at the single gene level, we conducted a meta-analysis of pathway enrichment. First, we conducted study-level pathway analysis using the GSVA method [18] to examine variation in the expression of defined gene sets (e.g., KEGG pathways and other pre-defined gene sets) between cases and controls in each study. It is important to note that in this analysis, genes that were not called DE in either the single study analysis or meta-analysis could still contribute to pathway enrichment. Since GSVA works by combining expression scores across a pre-defined set of genes, modest differences in the expression of genes that would not reach statistical significance (for each gene individually) can still cumulatively result in a differential expression of a gene set. Following single study analysis, we conducting a meta-analysis of pathway expression scores across all eight studies to identify consistently altered pathways (Figure 6, Supplementary Table 7, Supplementary Table 8). Some of the most prominent pathways that were increased in expression in cases were linked to mucin synthesis and post-translational modification of mucins, as were pathways related to the synthesis of prostaglandins, thromboxanes, and eicosatetraenoic acid derivatives. In controls, interferon gamma signaling, tryptophan metabolism, NOTCH and Hedgehog signaling were among the more highly expressed pathways. Additionally, this analysis identified TCF12, XBP1 and FOSL2 as putative transcriptional regulators of upregulated genes, and miR-380-5p as a post-transcriptional regulator of genes that are more highly expressed in controls. We also queried three protein interaction databases and identified 335 putative protein interaction partners (at FDR q-values < 0.05) of the asthma DEGs (Supplementary Table 9), the majority of which have not been linked to asthma previously.
Figure 6. Consistency of differential pathway expression revealed by meta-analysis.

A heatmap of fold change (log2 scale) for top pathways identified by meta-analysis of pathway enrichment across eight studies is shown. In some cases, pathway names have been truncated for ease of viewing. The full list of pathway names is provided in Supplementary Table 7. In Supplementary Table 8, we provide a cross referencing of DEGs to pathways.
Discussion
Our meta-analyses of eight studies revealed that 1,273 genes, roughly 5% of the protein coding genes in the human genome, are consistently dysregulated in the airway epithelium of asthmatics, and more than one third of these DEGs had large effect sizes. The robustness of our meta-analysis results is largely a function of the similarity of differential gene expression across each of the eight studies, and the fact that the eight studies utilized different expression measurement platforms makes the results particularly convincing. Part of the utility of this analysis lies in the identification of genes that did not stand out in any single study, which comprise 34% of the total number of DEGs. PPP1R3B is one such example. This gene was nominally differentially expressed in four out of the eight studies but after correction for multiple testing was not called DE in a single study. This gene is associated with lipid metabolism [24] and Alzheimer’s disease [25], but has not been linked to asthma previously.
The results of our pathway meta-analysis clearly indicate that multiple pathways are consistently dysregulated in asthma, though we cannot infer whether these pathways are causally related to the development of disease or are a consequence of disease. Genes related to Th2-mediated inflammation and MUC5AC production and post-translational modification of mucins were consistently and strongly upregulated in asthma cases. The pathway analysis also implicated ER stress (IRE1 and XBP1 pathways), which is a known consequence of exaggerated mucin production [19, 20]. Interesting, while XBP1 was identified as a putative regulator of asthma DEGs, XBP1 gene expression did not differ by case-control status, suggesting that activation of XBP1 function may occur independently of XBP1 transcription. In contrast to heightened mucin gene expression, genes involved in NOTCH signaling were more highly expressed in controls. Collectively, these particular pathway enrichment results seem to point to both alterations in mucus production and to changes in goblet vs. ciliated cell numbers in the airways.
The clear enrichment of genes from the serpin, cystatin and cathepsin gene families in the list of DEGs highlights the role of protease-antiprotease imbalance and the consequences thereof, perhaps most prominently extracellular matrix remodeling. Previous findings suggest that some of the protease expression is likely derived from recruited white blood cells, such as mast cell tryptase and carboxypeptidase, and neutrophil-derived Cathepsin G and elastase. It is worth noting that heightened expression of such proteases has also been linked to altered biophysical properties of mucins in the airway potentially leading to mucus plugging [26]. The upregulation of cystatins, which are protease inhibitors, may also be indicative of a compensatory response to exposure to protease containing allergens such as house dust mite, as has been suggested in the case of eosinophilic chronic rhinosinusitis [27]. However, we did not find strong evidence in support of a barrier defect in the asthmatic airway epithelium, as one would expect based on the known effect of proteases on epithelial integrity [3]. Nor did we find evidence of a pervasive effect of steroids on DEGs, but this result was based on a limited analysis of previous data and therefore a more robust analysis is merited.
One of our key findings was that dysregulated gene expression in asthma is reflected in the nasal epithelium in a magnitude that is highly similar to the bronchial epithelium. This result corroborates earlier findings of similarities in gene expression [28] and DNA methylation [8] based on comparisons of matched samples. Because our results are based on comparisons across studies, we conclude that this commonality of expression patterns is generalizable to multiple study populations. Notably, this commonality of differential expression includes genes that likely represent leukocyte infiltration, namely CCL26, CLC, TPSAB1, CPA3, MS4A2 and HDC). Heightened expression of CLC and HDC has also been observed in allergic rhinitis [29] and eosinophilic esophagitis [30] (see Supplement for more details), suggesting this is a common feature of eosinophilic inflammation across tissues.
Seventeen genes implicated by GWAS were found to be DE in the airway epithelium of asthmatics. Caution must be exerted in the interpretation of this result because the assignment of a gene from an association signal (in the GWAS) based on physical proximity is not proof positive of causality. For IL1RL1 and CHI3L1, however, there is ample evidence from other studies that these two genes are causally related to asthma. Interestingly, for these two genes, there is an apparent discrepancy between the directionality of gene expression and case status indicated by our meta-analysis and how genetic variants at these loci affect gene expression in relation to disease risk. For IL1RL1, expression is upregulated in asthma, yet the risk variants associated with asthma (as well as serum IgE and peripheral blood eosinophil counts) [31] are associated with lower gene expression [32]. This suggests that asthma status may cause an increase in IL1RL1 gene expression in airway epithelia and/or that recruited white blood cells present in the asthmatic airway epithelium express IL1RL1. For CHI3L1, which encodes YKL-40, genetic variants associated with increased risk of asthma are strongly associated with higher levels of serum YKL-40 [21] and gene expression in whole lung tissue [33], and YKL-40 is expressed in the bronchial epithelium, macrophages and neutrophils of severe asthmatics [34]. Yet, our results show that the gene expressed at lower levels in cases versus controls overall. It is unclear whether this discrepancy is attributable to variation in cell type composition of the airways, disease severity, or whether there is a distinction between gene expression in the airway epithelium before and after disease onset that may affect this relationship. Lastly, genetic variants downstream of ALOX15 have been associated with asthma [35] and this gene was also significantly and highly upregulated in asthmatics. This gene encodes Arachidonate 15-Lipoxygenase, and enzyme that converts arachidonic acid into several eicosatetraenoic acid species (which was also identified in the pathway meta-analysis), some of which have been shown to affect mucin production by bronchial epithelial cells [36, 37]. Thus, the expression and GWAS data contribute to a biologically coherent argument in favor of a role for this gene in asthma.
While our results clearly indicate that a sizeable number of genes are DE in asthma, this is not to say there are not differences between studies or heterogeneity among asthmatics. Indeed some studies identified a comparatively large number of DEGs compared to others, and this was not simply a function of sample size. This result suggests that real biological differences between study populations led to the observed differences in gene expression signals. It seems possible that the presence of different asthma sub-types could lead to either increased or decreased power. The presence of Th2 low asthma cases, for example, could act to dilute differences between cases and controls for Th2 related genes. Alternatively, Th2-low cases could provide power to detect non-Th2 related expression differences. Variation in three-gene marker of Th2-mediated inflammation (POSTN, CLCA1, and SERPINB1) among cases was indeed present. In at least three studies, the distribution of aggregate Th2-gene expression was bimodal, and some asthmatics had lower expression of these genes than any control. Identifying the genetic and clinical correlates of this asthma sub-type is clearly an imperative. More broadly, the use of gene expression data to identify biological underpinnings of asthma subtypes (or endotypes) is a promising approach [6, 38]. This will depend in large part on the availability of study subject data (clinical and/or biomarker) that can be used to assess correlations with gene expression. The identification of 1,273 consistently dysregulated genes in the airways of asthmatics represents one starting point for these analyses in the future.
Supplementary Material
Acknowledgements
We are grateful to all study investigators that deposited data into the public domain or provided their data directly to us, especially Drs. Akul Singhania and Timothy Hinks for early access to their data, so that we could conduct these analyses. We also thank Lauren Donoghue for her critical review of the manuscript and assistance with preparation of figures. This work was supported by NIH grants R01 HL122711 and 5P30CA01608.
Footnotes
Publisher's Disclaimer: This is an author-submitted, peer-reviewed version of an article that has been accepted for publication in the European Respiratory Journal, prior to copy-editing, formatting and typesetting. This version of the article may not be duplicated or reproduced without prior permission from the copyright owner, the European Respiratory Society. The publisher is not responsible or liable for any errors or omissions in this version of the article or in any version derived from it by any other parties. The final, copy-edited, published article, which is the version of record, is available online from the European Respiratory Journal without a subscription 18 months after the date of issue publication.
References
- 1.Hammad H, Lambrecht BN. Barrier Epithelial Cells and the Control of Type 2 Immunity Immunity Elsevier Inc.; 2015; 43: 29–40. [DOI] [PubMed] [Google Scholar]
- 2.Ortiz RA, Barnes KC. Genetics of Allergic Diseases Immunol. Allergy Clin. North Am Elsevier Inc; 2015; 35: 19–44. [DOI] [PMC free article] [PubMed] [Google Scholar]
- 3.Georas SN, Rezaee F. Epithelial barrier function: at the front line of asthma immunology and allergic airway inflammation J. Allergy Clin. Immunol Elsevier Ltd; 2014; 134: 509–520. [DOI] [PMC free article] [PubMed] [Google Scholar]
- 4.Fahy JV, Dickey BF. Airway Mucus Function and Dysfunction. N. Engl. J. Med 2010; 363: 2233–2247. [DOI] [PMC free article] [PubMed] [Google Scholar]
- 5.Woodruff PG, Boushey H a, Dolganov GM, Barker CS, Yang YH, Donnelly S, Ellwanger A, Sidhu SS, Dao-Pick TP, Pantoja C, Erle DJ, Yamamoto KR, Fahy JV. Genome-wide profiling identifies epithelial cell genes associated with asthma and with treatment response to corticosteroids. Proc. Natl. Acad. Sci. U. S. A 2007; 104: 15858–15863. [DOI] [PMC free article] [PubMed] [Google Scholar]
- 6.Woodruff PG, Modrek B, Choy DF, Jia G, Abbas AR, Ellwanger A, Arron JR, Koth LL, Fahy JV. T-helper type 2-driven inflammation defines major subphenotypes of asthma. Am. J. Respir. Crit. Care Med 2009; 180: 388–395. [DOI] [PMC free article] [PubMed] [Google Scholar]
- 7.Yang IV, Pedersen BS, Liu AH, O’Connor GT, Pillai D, Kattan M, Misiak RT, Gruchalla R, Szefler SJ, Khurana Hershey GK, Kercsmar C, Richards A, Stevens AD, Kolakowski CA, Makhija M, Sorkness CA, Krouse RZ, Visness C, Davidson EJ, Hennessy CE, Martin RJ, Togias A, Busse WW, Schwartz DA. The nasal methylome and childhood atopic asthma J. Allergy Clin. Immunol Elsevier Inc.; 2017; 139: 1478–1488. [DOI] [PMC free article] [PubMed] [Google Scholar]
- 8.Yang IV, Richards AJ, Davidson E, Stevens A, Kolakowski C, Martin R, Schwartz D. The Nasal Methylome: A Key to Understanding Allergic Asthma. Am J Respir Crit Care Med 2017; 195: 829–831. [DOI] [PMC free article] [PubMed] [Google Scholar]
- 9.Guajardo JR, Schleifer KW, Daines MO, Ruddy RM, Aronow BJ, Wills-Karp M, Hershey GKK. Altered gene expression profiles in nasal respiratory epithelium reflect stable versus acute childhood asthma. J. Allergy Clin. Immunol 2005; 115: 243–251. [DOI] [PubMed] [Google Scholar]
- 10.Giovannini-Chami L Distinct epithelial gene expression phenotypes in childhood respiratory allergy Eur. Respir. J European Respiratory Society; 2012; 39: 1197–1205. [DOI] [PubMed] [Google Scholar]
- 11.Irizarry RA. Exploration, normalization, and summaries of high density oligonucleotide array probe level data. Biostatistics 2003; 4: 249–264. [DOI] [PubMed] [Google Scholar]
- 12.Bolstad BM, Collin F, Brettschneider J, Simpson K, Cope L, Irizarry RA, Speed T. Quality Assessment of Affymetrix Genechip data. Bioinforma. Comput. Biol. Solut. Using R Bioconductor 2005. p. 33–47. [Google Scholar]
- 13.Ritchie ME, Phipson B, Wu D, Hu Y, Law CW, Shi W, Smyth GK. Limma powers differential expression analyses for RNA-sequencing and microarray studies. Nucleic Acids Res. 2015; 43: e47. [DOI] [PMC free article] [PubMed] [Google Scholar]
- 14.Benjamini Y, Hochberg Y. Controlling the false discovery rate: a practical and powerful approach to multiple testing. J. R. Stat. Soc. Ser. B 1995; 57: 289–300. [Google Scholar]
- 15.Ramasamy A, Mondry A, Holmes CC, Altman DG. Key issues in conducting a meta-analysis of gene expression microarray datasets. PLoS Med. 2008; 5: 1320–1332. [DOI] [PMC free article] [PubMed] [Google Scholar]
- 16.Schwarzer G, Carpenter JR, Rücker G. Meta-Analysis with R. First Heidelberg: Springer; 2015. [Google Scholar]
- 17.Welter D, MacArthur J, Morales J, Burdett T, Hall P, Junkins H, Klemm A, Flicek P, Manolio T, Hindorff L, Parkinson H. The NHGRI GWAS Catalog, a curated resource of SNP-trait associations. Nucleic Acids Res. 2014; 42: D1001–D1006. [DOI] [PMC free article] [PubMed] [Google Scholar]
- 18.Hänzelmann S, Castelo R, Guinney J. GSVA: gene set variation analysis for microarray and RNA-Seq data. BMC Bioinformatics 2013; 14: 7. [DOI] [PMC free article] [PubMed] [Google Scholar]
- 19.Martino MB, Jones L, Brighton B, Ehre C, Abdulah L, Davis CW, Ron D, O’Neal WK, Ribeiro CMP. The ER stress transducer IRE1β is required for airway epithelial mucin production. Mucosal Immunol. 2013; 6: 639–654. [DOI] [PMC free article] [PubMed] [Google Scholar]
- 20.Schroeder BW, Verhaeghe C, Park SW, Nguyenvu LT, Huang X, Zhen G, Erle DJ. AGR2 is induced in asthma and promotes allergen-induced mucin overproduction. Am. J. Respir. Cell Mol. Biol 2012; 47: 178–185. [DOI] [PMC free article] [PubMed] [Google Scholar]
- 21.Ober C, Tan Z, Sun Y, Possick JD, Pan L, Nicolae R, Radford S, Parry RR, Heinzmann A, Deichmann KA, Lester LA, Gern JE, Lemanske RF Jr., Nicolae DL, Elias JA, Chupp GL. Effect of Variation in CHI3L1 on Serum YKL-40 Level, Risk of Asthma, and Lung Function. N Engl J Med 2008; 358: 1682–1691. [DOI] [PMC free article] [PubMed] [Google Scholar]
- 22.Bønnelykke K, Sleiman P, Nielsen K, Kreiner-Møller E, Mercader JM, Belgrave D, Den Dekker HT, Husby A, Sevelsted A, Faura-Tellez G, Mortensen LJ, Paternoster L, Flaaten R, Mølgaard A, Smart DE, Thomsen PF, Rasmussen MA, Bonàs-Guarch S, Holst C, Nohr EA, Yadav R, March ME, Blicher T, Lackie PM, Jaddoe VWV, Simpson A, Holloway JW, Duijts L, Custovic A, Davies DE, et al. A genome-wide association study identifies CDHR3 as a susceptibility locus for early childhood asthma with severe exacerbations Nat. Genet Nature Publishing Group; 2014; 46: 51–55. [DOI] [PubMed] [Google Scholar]
- 23.Leigh R, Mostafa MM, King EM, Rider CF, Shah S, Dumonceaux C, Traves SL, McWhae A, Kolisnik T, Kooi C, Slater DM, Kelly MM, Bieda M, Miller-Larsson A, Newton R. An inhaled dose of budesonide induces genes involved in transcription and signaling in the human airways: enhancement of anti- and proinflammatory effector genes. Pharmacol. Res. Perspect 2016; 4: e00243. [DOI] [PMC free article] [PubMed] [Google Scholar]
- 24.Wu Y, Waite LL, Jackson AU, Sheu WHH, Buyske S, Absher D, Arnett DK, Boerwinkle E, Bonnycastle LL, Carty CL, Cheng I, Cochran B, Croteau-Chonka DC, Dumitrescu L, Eaton CB, Franceschini N, Guo X, Henderson BE, Hindorff LA, Kim E, Kinnunen L, Komulainen P, Lee WJ, Le Marchand L, Lin Y, Lindström J, Lingaas-Holmen O, Mitchell SL, Narisu N, Robinson JG, et al. Trans-Ethnic Fine-Mapping of Lipid Loci Identifies Population-Specific Signals and Allelic Heterogeneity That Increases the Trait Variance Explained. PLoS Genet. 2013; 9: e1003379. [DOI] [PMC free article] [PubMed] [Google Scholar]
- 25.Kamboh MI, Demirci FY, Wang X, Minster RL, Carrasquillo MM, Pankratz VS, Younkin SG, Saykin AJ, Jun G, Baldwin C, Logue MW, Buros J, Farrer L, Pericak-Vance MA, Haines JL, Sweet RA, Ganguli M, Feingold E, Dekosky ST, Lopez OL, Barmada MM. Genome-wide association study of Alzheimer’s disease. Transl. Psychiatry 2012; 2: e117. [DOI] [PMC free article] [PubMed] [Google Scholar]
- 26.Innes AL, Carrington SD, Thornton DJ, Kirkham S, Rousseau K, Dougherty RH, Raymond WW, Caughey GH, Muller SJ, Fahy JV. Ex vivo sputum analysis reveals impairment of protease-dependent mucus degradation by plasma proteins in acute asthma. Am. J. Respir. Crit. Care Med 2009; 180: 203–210. [DOI] [PMC free article] [PubMed] [Google Scholar]
- 27.Kouzaki H, Matsumoto K, Kikuoka H, Kato T, Tojima I, Shimizu S, Kita H, Shimizu T. Endogenous protease inhibitors in airway epithelial cells contribute to eosinophilic chronic rhinosinusitis. Am. J. Respir. Crit. Care Med 2017; 195: 737–747. [DOI] [PMC free article] [PubMed] [Google Scholar]
- 28.Poole A, Urbanek C, Eng C, Schageman J, Jacobson S, O’Connor BP, Galanter JM, Gignoux CR, Roth LA, Kumar R, Lutz S, Liu AH, Fingerlin TE, Setterquist RA, Burchard EG, Rodriguez-Santana J, Seibold MA. Dissecting childhood asthma with nasal transcriptomics distinguishes subphenotypes of disease. J. Allergy Clin. Immunol 2014; 133: 670–678.e12. [DOI] [PMC free article] [PubMed] [Google Scholar]
- 29.Imoto Y, Tokunaga T, Matsumoto Y, Hamada Y, Ono M, Yamada T, Ito Y, Arinami T, Okano M, Noguchi E, Fujieda S. Cystatin SN Upregulation in Patients with Seasonal Allergic Rhinitis. PLoS One 2013; 8: e67057. [DOI] [PMC free article] [PubMed] [Google Scholar]
- 30.Blanchard C Eotaxin-3 and a uniquely conserved gene- expression profile in eosinophilic esophagitis. Jci 2006; 116. [DOI] [PMC free article] [PubMed] [Google Scholar]
- 31.Savenije OEM, Kerkhof M, Reijmerink NE, Brunekreef B, De Jongste JC, Smit HA, Wijga AH, Postma DS, Koppelman GH. Interleukin-1 receptor-like 1 polymorphisms are associated with serum IL1RL1-a, eosinophils, and asthma in childhood. J. Allergy Clin. Immunol. 2011; 127: 750–756. [DOI] [PubMed] [Google Scholar]
- 32.Gordon ED, Palandra J, Wesolowska-Andersen A, Ringel L, Rios CL, Lachowicz-Scroggins ME, Sharp LZ, Everman JL, MacLeod HJ, Lee JW, Mason RJ, Matthay MA, Sheldon RT, Peters MC, Nocka KH, Fahy JV., Seibold MA. IL1RL1 asthma risk variants regulate airway type 2 inflammation. JCI Insight 2016; 1: 1–13. [DOI] [PMC free article] [PubMed] [Google Scholar]
- 33.The GTEx Consortium. The Genotype-Tissue Expression (GTEx) pilot analysis: Multitissue gene regulation in humans. Science (80-. ). 2015; 348: 648–660. [DOI] [PMC free article] [PubMed] [Google Scholar]
- 34.Chupp GL, Lee CG, Jarjour N, Shim YM, Holm CT, He S, Dziura JD, Reed J, Coyle AJ, Kiener P, Cullen M, Grandsaigne M, Dombret M-C, Aubier M, Pretolani M, Elias JA. A chitinase-like protein in the lung and circulation of patients with severe asthma. N. Engl. J. Med 2007; 357: 2016–2027. [DOI] [PubMed] [Google Scholar]
- 35.Ferreira MA, Vonk JM, Baurecht H, Marenholz I, Tian C, Hoffman JD, Helmer Q, Tillander A, Ullemar V, Van Dongen J, Lu Y, Rüschendorf F, Esparza-Gordillo J, Medway CW, Mountjoy E, Burrows K, Hummel O, Grosche S, Brumpton BM, Witte JS, Hottenga JJ, Willemsen G, Zheng J, Rodríguez E, Hotze M, Franke A, Revez JA, Beesley J, Matheson MC, Dharmage SC, et al. Shared genetic origin of asthma, hay fever and eczema elucidates allergic disease biology. Nat. Genet 2017; 49: 1752–1757. [DOI] [PMC free article] [PubMed] [Google Scholar]
- 36.Jayawickreme SP, Gray T, Nettesheim P, Eling T. Regulation of 15-lipoxygenase expression and mucus secretion by IL-4 in human bronchial epithelial cells. Am. J. Physiol. - Lung Cell. Mol. Physiol 1999; 276: L596–L603. [DOI] [PubMed] [Google Scholar]
- 37.Zhao J, Maskrey B, Balzar S, Chibana K, Mustovich A, Hu H, Trudeau JB, O’Donnell V, Wenzel SE. Interleukin-13-induced MUC5AC is regulated by 15-lipoxygenase 1 pathway in human bronchial epithelial cells. Am. J. Respir. Crit. Care Med 2009; 179: 782–790. [DOI] [PMC free article] [PubMed] [Google Scholar]
- 38.Modena BD, Tedrow JR, Milosevic J, Bleecker ER, Meyers DA, Wu W, Bar-Joseph Z, Erzurum SC, Gaston BM, Busse WW, Jarjour NN, Kaminski N, Wenzel SE. Gene expression in relation to exhaled nitric oxide identifies novel asthma phenotypes with unique biomolecular pathways. Am. J. Respir. Crit. Care Med 2014; 190: 1363–1372. [DOI] [PMC free article] [PubMed] [Google Scholar]
Associated Data
This section collects any data citations, data availability statements, or supplementary materials included in this article.