Abstract
Purpose:
A recent study reported that 5-fluorouracil (5FU)-based chemotherapy is less effective in treating advanced colorectal cancer (CRC) patients demonstrating hypermethylation of TFAP2E gene. The aim of our study was to confirm and validate these findings in large, uniformly treated, well-characterized patient cohorts.
Experimental design:
Two cohorts of 783 CRC patients: 532 from a population-based, multicenter cohort (EPICOLON I) and 251 patients from a clinic-based trial were used to study the effectiveness of TFAP2E methylation and expression as a predictor of response of CRC patients to 5FU-based chemotherapy. DNA methylation status of the TFAP2E gene in CRC patients was assessed by quantitative bisulfite pyrosequencing analysis. IHC analysis of the TFAP2E protein expression was also performed.
Results:
Correlation between TFAP2E methylation status and IHC staining was performed in 607 CRC. Among 357 hypermethylated tumors, only 141 (39.6%) exhibited loss of protein expression. Survival was not affected by TFAP2E hypermethylation in stage IV patients (HR 1.21; 95% CI 0.79–1.87; log rank p 0.6). In stage II-III cases disease-free survival was not influenced by TFAP2E hypermethylation status in 5-FU treated (HR 0.91; 95% CI 0.52–1.59; log rank p 0.9) as well as in non-treated patients (HR 0.88; 95% CI 0.5–1.54; log rank p 0.7).
Conclusion:
TFAP2E hypermethylation does not correlate with loss of its protein expression. Our large, systematic and comprehensive study indicates that TFAP2E methylation and expression may not play a major role in predicting response to 5FU-based chemotherapy in CRC patients.
Keywords: Colon cancer, 5FU chemotherapy, response to cancer therapy, methylation
INTRODUCTION
The TFAP2E (transcription factor AP-2 epsilon) gene methylation was reported as a potential marker of responsiveness to 5-fluorouracil (5FU)-based chemotherapy in colorectal cancer (CRC) patients1 by Ebert and colleagues, who suggested the lack of response to 5FU is probably mediated by DKK4, a downstream effector of TFAP2E gene implicated in chemoresistance to 5FU in CRC cell lines2,3,4. Although evidence was presented, this study had several important limitations which warrant further evaluation before consideration of the clinical usefulness of this marker. Primarily, this study interrogated a relatively small cohort of patients with CRCs (n=220), which was actually a combined collection of patients with advanced CRC from 4 different prospective trials that were analyzed together as a one large cohort. Secondly, only a very small subset of the entire cohort was analyzed for methylation and expression status of the TFAP2E gene, as well as expression of the DKK4 protein. Thirdly, the treatment regimen in this cohort was quite heterogeneous; some patients received 5FU-based chemotherapy, others received antibody-based mono-targeted therapy, while others underwent radiation therapy and a subset of these received combined chemo-radiation therapy. Thus, in order to truly appreciate whether TFAP2E methylation status could be a clinically-relevant epigenetic marker for responsiveness to 5FU in CRC, we believe that external validation is important before an extended use into routine clinical practice. Based on Ebertś results we evaluated the Overall Survival and Disease Free Survival in CRC patients treated with 5FU-based chemotherapy belonged from two large, uniformly treated, well-characterized CRC patient cohorts, in relation of their TFAP2E methylation status.
METHODS
Patients
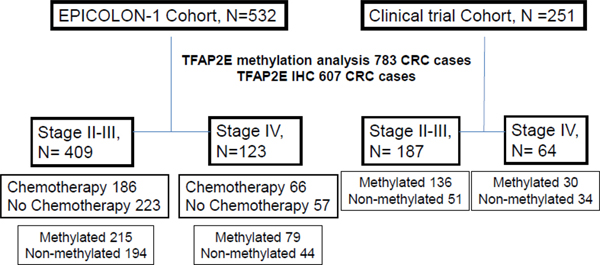
This retrospective, analytic observational study included a total of 783 CRC patients that were enrolled as part of two different groups. First group, 532 stages II-IV patients enrolled as part of the population-based, EPICOLON-I project, between years 2000–2001, where patients received primarily 5FU-based chemotherapy according to clinical criteria following standard schedules and doses5–8. Vast majority of patients in this cohort received 5-FU+leucovorin and only 9% received FOLFOX (5FU+oxaliplatin) or FOLFIRI (5FU+irinotecan) regimes. In patients at stage IV, 79% received 5-FU+leucovorin as first line and 21% received FOLFOX or FOLFIRI. Second group, 251 patients enrolled from a clinic-based trial where all patients with non-metastatic disease received 5FU-based adjuvant chemotherapy, and stage IV CRC patients received the FOLFOX regimen9. The patients included in this study were enrolled between 1996 and 2008. All stage II and III patients were treated with 5-FU-based adjuvant chemotherapy for 6 months subsequent tumor resection, and all stage IV patients were treated with 5-FU and oxaliplatin until the treatment failed. The clinico-pathological and molecular features of patients are described in Supplementary Tables 1 & 2. A flow diagram of the patients included in the study can be seen at Figure 1. The study was approved by the institutional ethics committee of each participant hospital and written informed consent was obtained from all patients.
Figure 1.
Flow diagram of the participants in the study
Specimen characteristics, DNA extraction and bisulfite modification
DNA from formalin-fixed, paraffin-embedded material (colorectal tumours, normal colorectal tissue), was extracted using the QIAamp DNA Mini Kit and the QIAcube (QIAGEN, Germany), according to the manufacturer’s protocol. Genomic DNA was modified with sodium-bisulfite using the EZ Methylation Gold Kit (Zymo Research, Orange, CA) prior to PCR amplification for determination of the methylation status of the TFAP2E gene.
TFAP2E Methylation status
DNA methylation status of the TFAP2E gene in CRC patients was assessed by quantitative bisulfite pyrosequencing analysis using a PSQ HS 96A pyrosequencing system (QIAGEN, Valencia, CA) on a bisulfate-modified genomic DNA template 10,11. We designed two different pyrosequencing assays that encompassed both CpG islands mapped to the TFAP2E gene, first located within its promotor region/exon 1 and second located within intron 3, both reported by Ebert et al1 (Supplementary Figure 1). As is specified in Supplementary content, we calculated the threshold to distinguish methylated versus non-methylated samples using matched tissues from tumor (C) and adjacent mucosa (NC) and a within-subject. Receiver Operating Characteristics (ROC) analysis was performed. Primer sequences used for the methylation studies can be seen in Supplementary Table 3.
Immunohistochemistry (IHC) of TFAP2E protein expression
IHC analysis of the TFAP2E protein expression was performed only in the EPICOLON cohort, using the staining protocol and polyclonal anti-TFAP2E antibody generously provided by Dr. C. Rocken 1. Staining was evaluated and scored by two expert pathologists (C.E. and C.A.), who were blinded to the results of TFAP2E methylation for the samples. A tumor was considered to have normal expression for TFAP2E when unequivocal nuclear staining was observed in the neoplastic epithelial cells, while samples were not scored when no staining of internal control was visible. . A tumor was considered to have normal expression for TFAP2E when unequivocal nuclear staining was seen in some neoplastic epithelial cells, with or without cytoplasmic staining. When the staining intensity was strong and homogeneous at 10X, the case was scored as 3; if the staining was strong but heterogeneous at 20X, it was scored as 2, and the patient was considered to have a score of 1 when the staining was light and heterogeneous at 40X (Figure 2). Samples were not scored when no staining of internal control was visible. Tumour cells were judged as negative for protein expression only if they lacked nuclear staining in a sample in which stroma cells were stained. (Figure 2).
Figure 2. Inmunohistochemical evaluation of TFAP2E expression.
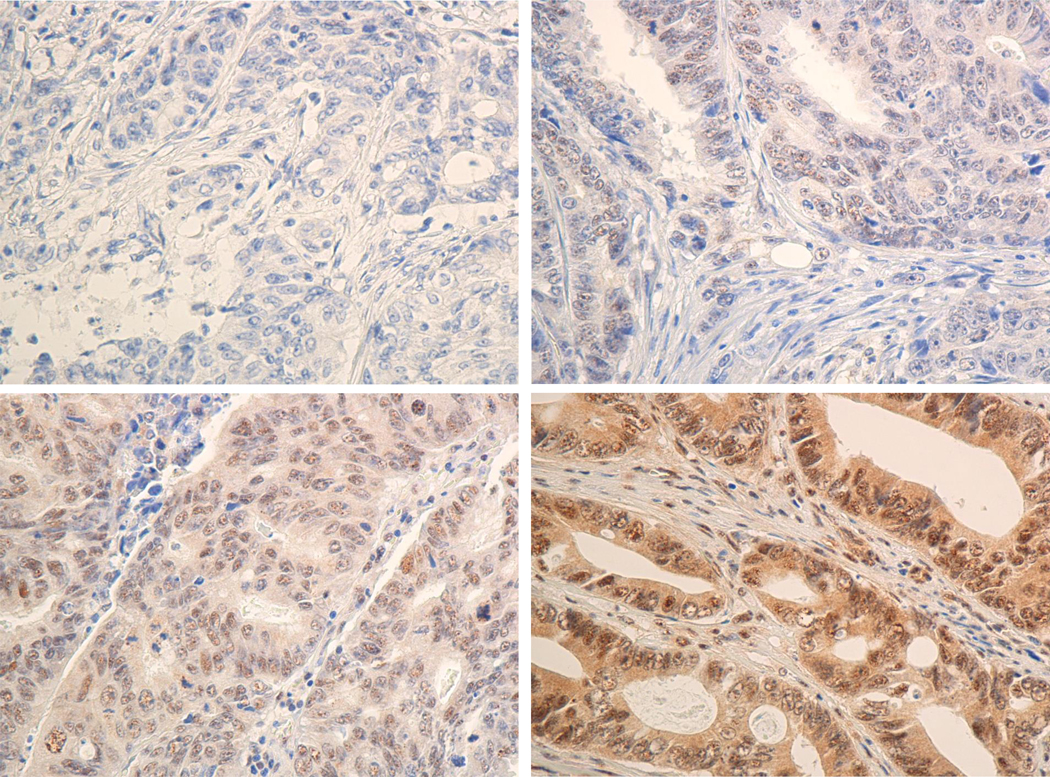
Inmunohistochemical staining with a polyclonal anti-TFAP2E antibody was broken down into 2 categories in CRC epithelial cells: positive (B, C & D) and negative (A) TFAP2E expression. Positive samples were estimated on scales of 1 to 3 depending of the intensity of tumor cells staining on each slide. (B) Score 1 for CRC epithelial cells with weak and heterogeneous positive TFAP2E expression (C) Score 2 for CRC epithelial cells with strong and heterozygous positive TFAP2E expression and score 3 (D) CRC epithelial cells with strong and homozygous positive TFAP2E expression. Left panels show 40X amplification, right panels show 20X amplification.
Statistical Analysis
Continuous variables are reported as mean ± standard deviation, while categorical variables are reported as frequency or percentages. The determination of the cut-off value of methylation was performed using within-subject Receiver-operating-characteristic (ROC) analysis. Differences in the probability of overall survival (OS) or disease-free survival (DFS) were analyzed using the v2-test. Survival curves were generated according to the Kaplan Meier method and univariate survival distributions were compared using a log-rank test. A multivariate analysis for determining the hazard risk ratios for death or tumor recurrence was performed using Cox’s proportional hazards regression analysis. All reported p-values are two-sided, and p-values of less than 0.05 were considered to be significant.
RESULTS
TFAP2E methylation at the two TFAP2E CpG islands
Methylation analysis of TFAP2E gene was performed in 783 cases. We found 58.7% (460) CRCs with TFAP2E hypermethylated. TFAP2E methylation was predominantly found in CpG-island2 (intron 3) and very rarely in CpG-island1 (promoter/Exon) (Supplementary Figure 2A). Methylation levels were significantly higher in tumor tissues (C) compared to adjacent normal mucosa (NC) in CpG-island2 within intron 3 region of the TFAP2E gene (p<0.001) (Supplementary Figure 2B–C); however, no differences were observed within the promoter region. We determined the TFAP2E methylation cut-off threshold at 40% that could distinguish methylated versus non-methylated samples in intron 3 region using a quantitative pyrosequencing assay (Supplementary Figure 2D).
TFAP2E gene methylation status and its correlation with TFAP2E protein expression
TFAP2E protein expression was determined by immunohistochemistry from all paraffin-embedded CRC tissues from EPICOLON-I patients (660) (Figure 2). 607 samples were successfully scored for TFAP2E staining, while 53 cases had no internal control stain and were excluded from further analysis. Based upon IHC analysis, 65.8% (399/607) CRC patients were classified as TFAP2E-positive.
Correlation between TFAP2E methylation status and IHC staining was performed in these 607 CRC samples. Only 141 (39.6%) from 357 hypermethylated tumors, exhibited loss protein expression. It should be noted that 184 tumors from 250 tumors TFAP2E hypomethylated, retained TFAP2E immunoexpression (73,6%), therefore no correlation between TFAP2E methylation and IHC expression was found. These results suggest that TFAP2E hypermethylation is a stochastic event and have no bearing on regulation of its expression (Supplementary Figure 3A–D).
Influence of TFAP2E methylation on prognosis and chemotherapeutic response in metastatic CRC patients (mCRC) from EPICOLON-I cohort.
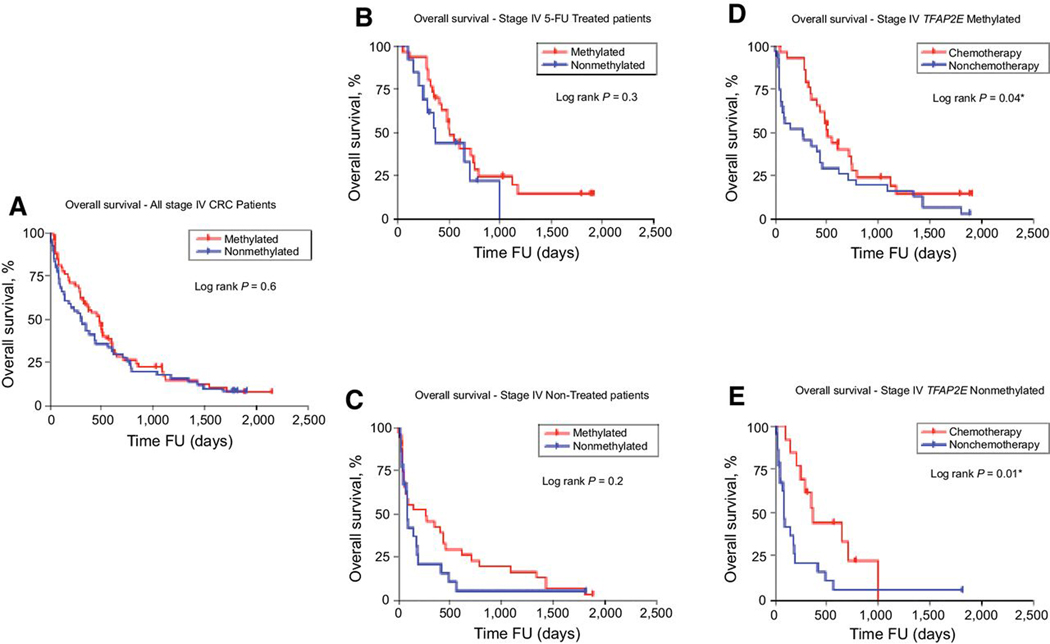
From EPICOLON-I cohort, 123 patients in mCRC were available with a median follow up of 518 days (1.4 years; range 0–2148 days), 64.2% (79/123) patients had TFAP2E hypermethylated tumors and there were no differences in overall survival (OS) according to TFAP2E hypermethylation status, (HR= 1.21; 95% CI, = 0.79–1.87; log rank p=0.6; Figure 3A). Within this subset of patients, 53.7% (66/123) received chemotherapy treatment, and 65.2% (43/66) of them 5-FU based chemotherapy. Patients who received 5FU-based chemotherapy, had similar OS independently of their TFAP2E hypermethylation status (Methylated: 69.7%, non-methylated: 30.3%; HR= 0.677; 95% CI, = 0.28–1.46; log rank p=0.3; Figure 3B). Likewise, patients who non received chemotherapy (n=57), the OS was not affected by TFAP2E hypermethylation status (Methylated: 60%, non-methylated: 40%; HR= 1.4; 95% CI, = 0.78–2.71; log rank p=0.2; Figure 3C).
Figure 3. Epicolon I. Overall Survival Stage IV CRC Patients. TFAP2E Methylation.
(A) Overall survival of patients with stage IV disease during FU (follow-up), according to TFAP2E methylation status. (B) Overall survival of patients that received or did not receive (C) chemotherapy according to TFAP2E methylation status. (D) Overall survival of patients with stage IV disease and TFAP2E methylated tumors and (E) TFAP2E non-methylated tumors
Furthermore, when we analyzed the 5FU-chemotherapy effect on OS by TFAP2E methylation status in mCRC patients, we realize that OS improved in both groups; patients with TFAP2E-methylated tumors (Chemotherapy: 47.6%, non-chemotherapy:52.4%; HR= 0.58; 95% CI, = 0.33–0.99; log rank p=0.04; Figure 3D) and TFAP2E non-methylated tumors (Chemotherapy: 37.1%, non-chemotherapy:62.9%; HR= 0.39; 95% CI, = 0.17–0.79; log rank p=0.01; Figure 3E). Thus, advanced CRC patients significantly benefit from 5FU chemotherapy treatment independently of TFAP2E methylation status.
In the same way, there were no differences in OS regarding TFAP2E IHC expression status (HR= 0.84; 95% CI, = 0.47–1.48; log rank p=0.6) between mCRC patients (Supplementary Figure 4A).These lack of association was similar in treated (HR= 0.62; 95% CI, = 0.29–1.35; log rank p=0.2; Supplementary Figure 4B) or non-treated patients (HR= 1.1; 95% CI, = 0.45–2.72; log rank p=0.8; Supplementary Figure 4C).
Influence of TFAP2E methylation on prognosis and treatment response in patients with non-metastatic CRC in the EPICOLON-I cohort.
A total of 409 patients from the EPICOLON-I cohort, stage II-III were analyzed (55.5% stage II). Median follow-up of these patients was 1187 days (3.2 years; range 0–2184 days). Of the 409 patients, 215 (52.6%) had TFAP2E hypermethylated tumor. At end of follow-up period, 36.2% (148/409) patients died, and median follow-up for this group was 703 ± 518 days (1.9 ± 1.4 years). Tumor recurrence following surgery was seen in 29.9% (120/409) patients, with a median recurrence time of 1015 ± 559 days (2.9 ± 1.5 years). Adjuvant chemotherapy was given to 45.5% (186/409) patients, which included 177 who received 5FU+leucovorin.
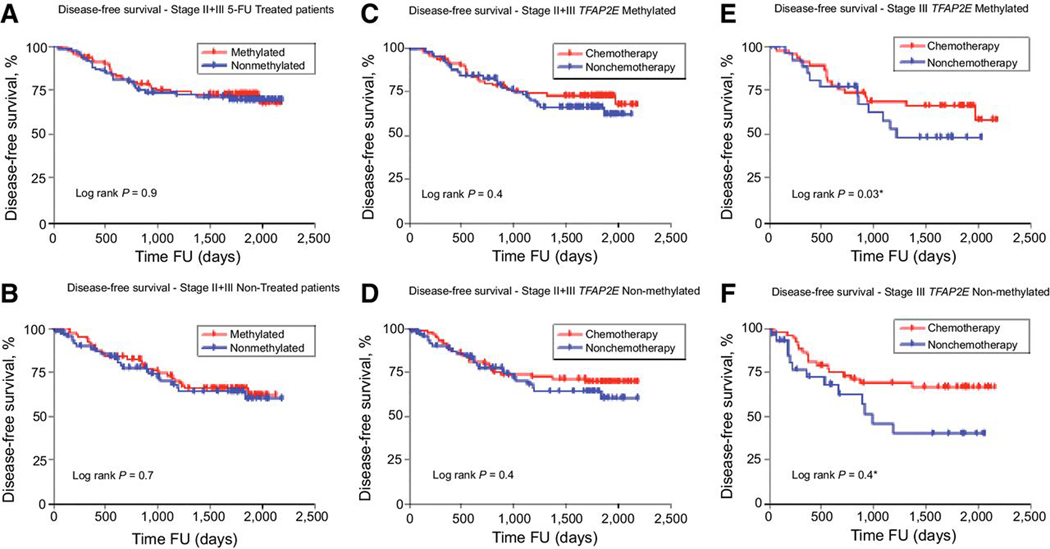
We analyzed the effect on Disease Free Survival (DFS) of TFAP2E methylation status in stage II-III CRC patients 5-FU treated and non-treated. There were not differences in DFS of 5-FU treated (Methylated: 51.4%, non-methylated: 48.6%; HR= 0.91; 95% CI, = 0.52–1.59; log rank p=0.9; Figure 4A) or Non-treated patients (Methylated: 56.4%, non-methylated: 43.6%; HR= 0.88; 95% CI, = 0.5–1.54; log rank p=0.7; Figure 4B). This lack of difference remained unchanged when we analyzed separately stage II (227 patients, 119, 51.5% methylated; 102, 48.5% non-methylated; log rank p=0.7) and stage III (182 patients, 87, 47.8% methylated; 95, 52.2% non-methylated) patients (log rank p=0.9).
Figure 4. EPICOLON I. Disease Free Survival Stages II and III CRC. TFAP2E Methylation.
Disease Free Survival of patients with stage II and III disease during FU (follow-up) that received (A) or did not receive (B) adjuvant chemotherapy according to TFAP2E methylation status. (C) Disease Free Survival of patients with stage II+III CRC and TFAP2E methylated and (D) TFAP2E non-methylated tumors (E) Disease Free Survival of patients with stage III CRC and TFAP2E methylated and (F) TFAP2E non-methylated tumors.
At the same time, we found that 5-FU based chemotherapy not improved DFS in stage II-III patients, independently of TFAP2E methylation tumors status (TFAP2E methylated: Chemotherapy: 51.4%, non-chemotherapy:48.6%; HR= 0.78; 95% CI, = 0.45–1.35; log rank p=0.4, Figure 3C; and TFAP2E non-methylated: Chemotherapy: 52.1%, non-chemotherapy: 47.9%; HR= 0.79; 95% CI, = 0.44–1.41; log rank p=0.4; Figure 4D).
In addition, chemotherapy with 5-FU only in stage III CRC patients, improved DFS in both, patients with TFAP2E methylated tumors (Chemotherapy: 46.6%, non-chemotherapy: 53.4%; HR= 0.57; 95% CI, = 0.31–0.96; log-rank p=0,03, Figure 4E) and TFAP2E non-methylated tumors (Chemotherapy: 54.4%, non-chemotherapy:45.6%; HR= 0.51; 95% CI, = 0.20–0.99; log rank p=0,04, Figure 4F).
Alike, when we analyzed the effect of TFAP2E IHC expression in stage II-III CRC patients, we found that DFS was not affected (HR= 0.83; 95% CI, = 0.52–1.35; log rank 0.5; Supplementary Figure 4D) by low or high expression, and also there were no differences regarding TFAP2E expression in 5-FU treated (HR= 0.8; 95% CI, = 0.33–1.3; log rank 0.6, Supplementary Figure 4E) or non-treated patients (HR= 0.63; 95% CI, = 0.33–1.29; log rank 0.2, Supplementary Figure 4F).
Influence of TFAP2E methylation on survival in clinical cohort of colorectal cancers
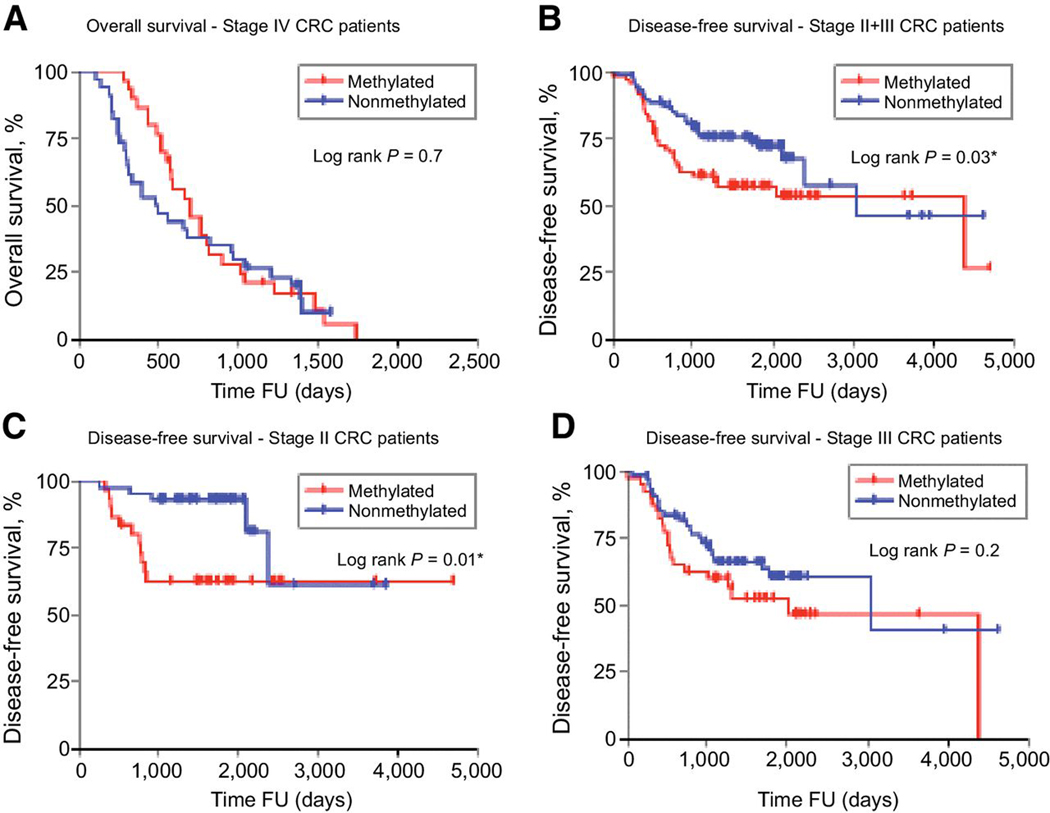
A total of 64 mCRC patients were included from 251 clinic-based cohort. All this subjects received FOLFOX (5FU+Oxaliplatin) and the median follow-up was 734 days (2 years; range 0–2511 days). 46.9% (30/64) patients had TFAP2E hypermethylated tumors and the OS was not affected by TFAP2E methylated status (Methylated: 46.9%, non-methylated: 53.1%; HR= 0.89; 95% CI, = 0.52–1.51; log rank p=0.7; Figure 5A).
Figure 5. Clinical cohort. Overall Survival Stage IV CRC Patients. Disease Free Survival Stages II and III CRC Patients. TFAP2E Methylation.
(A) Overall Survival of patients with stage IV CRC during FU (follow-up), according to TFAP2E methylation status. (B) Disease Free Survival of patients with stage II+III CRC, according to TFAP2E methylation status (C) Disease Free Survival of patients with stage II CRC, according to TFAP2E methylation status (D) Disease Free Survival of patients with stage III CRC, according to TFAP2E methylation status.
A total of 187 stage II and III patients from this cohort were analyzed (38.5% stage II). All patients underwent 5FU+leucovorin adjuvant chemotherapy after surgery. There were 40 (21.4%) deaths over the mean follow-up time of 1028± 867days (2.8 ± 2.3 years), 33 patients died due to cancer-related causes, while 7 patients had other causes of death. Tumor recurrence was seen in 36.4% (68/187) patients, at a median time of 801 ± 723 days (2.1±1.8 years) after surgery.
In this cohort, a total of 136 patients (72.7%) showed TFAP2E hypermethylation. Patients treated with 5FU-containing adjuvant chemotherapy who had TFAP2E hypermethylation tumors showed worse outcome than patients with non-methylated tumors (log rank p=0.03, Figure 5B). This trend was maintained in the subgroup analysis for stage II patients (log rank p=0.01, Figure 5C), but not for stage III patients (log rank p=0.2; Figure 5D).
In the multivariable Cox regression analysis TFAP2E methylation was an independent predictor of early recurrence for stage II-III and stage II CRC patients, respectively (stage II+III: HR=1.91; 95%CI,1.02–3.58; p=0.045, stage II: HR=1.91; 95% CI, 1.2–25.95, p=0.029; Table 1), hence suggesting a prognostic value from TFAP2E methylation in curative CRC patients who received uniform 5FU adjuvant treatment.
Table1.
Multivariate analysis of Disease Free Survival in patients with stage II and III CRC from the clinical cohort.
| Stage II + III | Univariate | Multivariate | ||||
|---|---|---|---|---|---|---|
| Covariate | HR | 95% CI | P-value | HR | 95% CI | P-value |
| *Age (>Median (66) vs <Median) | 1.02 | 0.65–1.61 | 0.93 | - | - | - |
| Gender (Male vs Female) | 1.02 | 0.64–1.62 | 0.94 | - | - | - |
| *Tumor size(>45mm vs <45mm) | 1.08 | 0.66–1.76 | 0.76 | - | - | - |
| Vascular Invasion (Positive vs Negative) | 1.29 | 0.74–2.49 | 0.47 | - | - | - |
| Mucinous (Positive vs Negative) | 1.36 | 0.64–2.62 | 0.32 | - | - | - |
| Perineural Invasion (Positive vs Negative) | 1.87 | 1.01–3.45 | 0.046 | 1.73 | 0.89–3.34 | 0.11 |
| Lymph node (Positive vs Negative) | 1.89 | 1.14–3.12 | 0.014 | 2.17 | 1.06–4.46 | 0.034 |
| TFAP2E methylation (high vs low) | 1.81 | 1.10–2.98 | 0.019 | 1.91 | 1.02–3.58 | 0.045 |
| Stage II | Univariate | Multivariate | ||||
| Covariate | HR | 95% CI | P-value | HR | 95% CI | P-value |
| *Age (>Median (66) vs <Median) | 0.66 | 0.27–1.63 | 0.37 | |||
| Gender (Male vs Female) | 0.76 | 0.32–1.78 | 0.53 | - | - | - |
| *Tumor size(>45mm vs <45mm) | 0.89 | 0.35–2.25 | 0.79 | - | - | - |
| Mucinous (Positive vs Negative) | 0.8 | 0.18–3.47 | 0.77 | - | - | - |
| Perineural Invasion (Positive vs Negative) | 1.5 | 0.46–4.86 | 0.49 | - | - | - |
| Vascular Invasion (Positive vs Negative) | 2.17 | 0.67–7.05 | 0.2 | 2.11 | 0.59–7.51 | 0.25 |
| TFAP2E methylation (high vs low) | 3.14 | 1.09–9.01 | 0.035 | 1.91 | 1.20–25.95 | 0.029 |
Abbreviations: HR: Hazard Ratio; CI : Confidence Interval; * Median values used. TFAP2E methylation (high >40%; low ≤40%)
DISCUSSION
This study was designed to evaluate the role of TFAP2E methylation, a novel biomarker previously reported1, as predictive factor of therapeutic response and prognosis to 5FU-based chemotherapy in patients with colorectal cancer. Ebert and colleagues had presented evidence that 5FU-based chemotherapy was ineffective in CRC patients with TFAP2E hypermethylation; however, this is based on the analysis of a relatively small, heterogeneous subset of advanced CRC patients who were treated with non-uniform chemotherapeutic regimens and, as we know there is no validation reports of these findings in a larger sample group. This step is crucial before testing this biomarker in an appropriate prospective trial, and implementing its use in molecular diagnostic laboratories. Therefore, we used two large and well-characterized cohorts of CRC patients; one a population-based study and the other a clinic-based trial. Both cohorts of CRC patients were uniformly treated with 5FU-based chemotherapeutic regimens. As a result, our large, systematic and comprehensive analysis shows two things. First, TFAP2E hypermethylation does not correlate with loss of TFAP2E protein expression, and second, neither TFAP2E methylation nor TFAP2E expression predict response to 5FU-based adjuvant chemotherapy.
Previous analysis about this biomarker was conducted in a small group of CRC patients (N=28), and this inverse correlation between methylation and expression levels did not reach statistical significance1, however, they concluded that hypermethylation of the TFAP2E gene conveys suppression of TFAP2E protein expression. In contrast, following a systematic evaluation of the relationship between TFAP2E hypermethylation and TFAP2E protein expression in our population-based cohort, we unequivocally demonstrated that although the intron-3 CpG island within the TFAP2E gene is heavily methylated in tumor samples compared to normal mucosa, this epigenetic alteration does not lead to the transcriptional suppression of TFAP2E expression in the colon. This was further highlighted by our observation for co-existence of significant hypermethylation but no loss of the corresponding protein expression for TFAP2E in our large subset of CRCs. Although unclear, we hypothesized that this lack of correlation between methylation and expression might be due to the fact that gene methylation could be analyzed in CpG whitin a non-regulatory region of the gene1. Recent evidence has shown the association of intronic methylation with alternative splicing12,13 and non-coding RNAs regulation14; however, its relationship with gene silencing is not clear,15,16 and often is related to intron 117,18. This may be due to an extension of methylation changes in the regulatory exon 1 CpG island within genes. Other possibilities such as post-translational changes can also explain these discrepancies between methylation and protein expression.
The most important conclusion made by Ebert and colleagues was that CRC patients with TFAP2E hypermethylated tumors do not benefit from 5FU-based chemotherapy1. In other study performed in a cohort of I-III stage CRC (Park SJ, Oncology 2015) an independent correlation between TFAP2E methylation and better prognosis was found, receiving or not adjuvant chemotherapy. However, our extensive validation of these results were unsuccessful in the two patient cohorts we analyzed, wherein, the presence of TFAP2E methylation in tumors did not have any effect on the response to 5FU-based chemotherapy in metastatic colorectal cancers patients. Furthermore, we found that TFAP2E methylation levels seems not to influence DFS in stage II and III CRC patients from EPICOLON-I treated or no with 5FU-based chemotherapy. The results of our validation suggest that TFAP2E methylation status may not be a predictive marker for response to adjuvant 5FU-based chemotherapy in CRC patients. However, our results do not allow us to discard a prognostic value for this marker, especially in 5FU-treated stage II CRC patients.
Nevertheless, it is important to point out that our study may have some limitations. In our population-based cohort, the treatment decision was not random, and chemotherapy was decided using clinical criteria. In the clinical cohort, there was no group of non-treated patients. Moreover, follow-up duration was not very long, and possibly some recurrences can be missed. However, these limitations aside, given the strength of our large, well-characterized group of CRC patients, we believe that our interpretation is a reliable reflection of the role of TFAP2E in CRC.
In summary, in this study of the role methylation and expression of theTFAP2E gene may play in the response to 5FU-based chemotherapy, we demonstrated that although methylation in the TFAP2E intron 3 is tumor-related, it does not correlate with loss of its protein expression, and more importantly, TFAP2E methylation does not play any role in predicting response to 5FU-based chemotherapy in CRC patients. Interestingly, we did make the observation that TFAP2E methylation was an independent predictor of early recurrence, especially for stage II CRC patients in the clinical cohort of patients. Further appropriate retrospective or prospective clinical trials are required to confirm these results in future.
Supplementary Material
KEY POINTS.
Question
Hypermethylation of TFAP2E gene predicts poor response in CRC treated with 5FU regimen?
Findings
In this retrospective, analytic observational study, the disease-free survival was not influenced by TFAP2E hypermethylation status in 5-FU treated (HR 0.91; 95% CI 0.52–1.59; log rank p 0.9) as well as in non-treated patients (HR 0.88; 95% CI 0.5–1.54; log rank p 0.7) in stages II-IV CRC
Meaning
TFAP2E METHYLATION AND EXPRESSION MAY NOT PLAY A MAJOR ROLE FOR PREDICTING RESPONSE TO 5FU-BASED CT IN CRC PATIENTS.
Acknowledgments
Funding: The present work was supported by the grants CA72851, CA181572, CA184792, CA187956 and CA202797 from the National Cancer Institute, National Institute of Health, a grant (RP140784) from the Cancer Prevention Research Institute of Texas (CPRIT), pilot grants from the Baylor Sammons Cancer Center and Foundation, as well as funds from the Baylor Research Institute. This work was also supported by Instituto de Salud Carlos III (PI08/0726, PI11/2630 INT-12–078, INT13–196, PI14/01386). Lucia Perez-Carbonell is a recipient of a post-doctoral grant from Fundación Alfonso Martín Escudero 2012.
Abbreviations:
- TFAP2E
Transcription factor AP-2 epsilon
- DKK4
Homo sapiens dockkopf homolog 4
- 5FU
5-Fluorouracil
- CRC
colorectal cancer
- 5-AZA
OS: Overall Survival
- DFS
Disease Free Survival
Footnotes
Conflicts of interest: None of the authors have any potential conflicts to disclose.
REFERENCES
- 1.Ebert MP, Tanzer M, Balluff B, et al. : TFAP2E-DKK4 and chemoresistance in colorectal cancer. N Engl J Med 366:44–53, 2012 [DOI] [PubMed] [Google Scholar]
- 2.Xi Y, Nakajima G, Schmitz JC, et al. : Multi-level gene expression profiles affected by thymidylate synthase and 5-fluorouracil in colon cancer. BMC Genomics 7:68, 2006 [DOI] [PMC free article] [PubMed] [Google Scholar]
- 3.Xi Y, Formentini A, Nakajima G, et al. : Validation of biomarkers associated with 5-fluorouracil and thymidylate synthase in colorectal cancer. Oncol Rep 19:257–62, 2008 [PubMed] [Google Scholar]
- 4.Chung W, Kwabi-Addo B, Ittmann M, et al. : Identification of novel tumor markers in prostate, colon and breast cancer by unbiased methylation profiling. PLoS One 3:e2079, 2008 [DOI] [PMC free article] [PubMed] [Google Scholar]
- 5.Pinol V, Andreu M, Castells A, et al. : Frequency of hereditary non-polyposis colorectal cancer and other colorectal cancer familial forms in Spain: a multicentre, prospective, nationwide study. Eur J Gastroenterol Hepatol 16:39–45, 2004 [DOI] [PubMed] [Google Scholar]
- 6.Pinol V, Castells A, Andreu M, et al. : Accuracy of revised Bethesda guidelines, microsatellite instability, and immunohistochemistry for the identification of patients with hereditary nonpolyposis colorectal cancer. Jama 293:1986–94, 2005 [DOI] [PubMed] [Google Scholar]
- 7.Jover R, Zapater P, Castells A, et al. : Mismatch repair status in the prediction of benefit from adjuvant fluorouracil chemotherapy in colorectal cancer. Gut 55:848–55, 2006 [DOI] [PMC free article] [PubMed] [Google Scholar]
- 8.Jover R, Nguyen TP, Perez-Carbonell L, et al. : 5-Fluorouracil adjuvant chemotherapy does not increase survival in patients with CpG island methylator phenotype colorectal cancer. Gastroenterology 140:1174–81, 2011 [DOI] [PMC free article] [PubMed] [Google Scholar]
- 9.Takahashi M, Cuatrecasas M, balaguer F, et al. : The clinical significance of MiR-148a as a predicitive biomarker in patients with advanced colorectal cancer. PLoSOne 2012;7:e46684. [DOI] [PMC free article] [PubMed] [Google Scholar]
- 10.Goel A, Xicola RM, Nguyen TP, et al. : Aberrant DNA methylation in hereditary nonpolyposis colorectal cancer without mismatch repair deficiency. Gastroenterology 138:1854–62, 2010 [DOI] [PMC free article] [PubMed] [Google Scholar]
- 11.Dejeux E, Audard V, Cavard C, et al. : Rapid identification of promoter hypermethylation in hepatocellular carcinoma by pyrosequencing of etiologically homogeneous sample pools. J Mol Diagn 9:510–20, 2007 [DOI] [PMC free article] [PubMed] [Google Scholar]
- 12.Anastasiadou C, Malousi A, Maglaveras N, et al. : Human epigenome data reveal increased CpG methylation in alternatively spliced sites and putative exonic splicing enhancers. DNA Cell Biol 30:267–75, 2011 [DOI] [PubMed] [Google Scholar]
- 13.Malousi A, Kouidou S: DNA hypermethylation of alternatively spliced and repeat sequences in humans. Mol Genet Genomics 287:631–42, 2012 [DOI] [PMC free article] [PubMed] [Google Scholar]
- 14.Cheung HH, Davis AJ, Lee TL, et al. : Methylation of an intronic region regulates miR-199a in testicular tumor malignancy. Oncogene 30:3404–15, 2011 [DOI] [PMC free article] [PubMed] [Google Scholar]
- 15.van Roon EH, de Miranda NF, van Nieuwenhuizen MP, et al. : Tumour-specific methylation of PTPRG intron 1 locus in sporadic and Lynch syndrome colorectal cancer. Eur J Hum Genet 19:307–12, 2011 [DOI] [PMC free article] [PubMed] [Google Scholar]
- 16.Lin J, Lai M, Huang Q, et al. : Methylation patterns of IGFBP7 in colon cancer cell lines are associated with levels of gene expression. J Pathol 212:83–90, 2007 [DOI] [PubMed] [Google Scholar]
- 17.Nagai H, Li Y, Hatano S, et al. : Mutations and aberrant DNA methylation of the PROX1 gene in hematologic malignancies. Genes Chromosomes Cancer 38:13–21, 2003 [DOI] [PubMed] [Google Scholar]
- 18.Chantepie SP, Vaur D, Grunau C, et al. : ZAP-70 intron1 DNA methylation status: determination by pyrosequencing in B chronic lymphocytic leukemia. Leuk Res 34:800–8, 2010 [DOI] [PubMed] [Google Scholar]
Associated Data
This section collects any data citations, data availability statements, or supplementary materials included in this article.


