Abstract
Topic:
Systematic review and meta-analysis of the natural history of atrophy secondary to Choroideremia (CHM).
Clinical Relevance:
A sensitive and reliable anatomic measure to monitor disease progression is needed in treatment trials for CHM. However, the long-term natural history of the residual retinal pigment epithelium (RPE) is unclear, with reported RPE area decline rates varying widely among patients.
Methods:
We searched in 7 literature databases up through July 17, 2019 to identify studies that assessed the residual RPE area in untreated eyes with CHM using fundus autofluorescence (FAF). We sought individual eye data and investigated the RPE decline pattern using 3 models: the area linear model (ALM), radius linear model (RLM), and area exponential model (AEM), in which the area, radius, and log-transformed area of RPE changes linearly with time, respectively. To account for different eyes’ entry times into the studies, we added a horizontal translation factor to each dataset. The RPE decline rate was estimated using a 2-stage random-effects meta-analysis. We assessed the risk of bias using the Quality In Prognosis Studies tool.
Results:
Of 807 articles screened, we included 9 articles containing cross-sectional data (257 eyes) from 6 studies and longitudinal data (229 visits from 68 eyes) from 5 studies. The residual RPE area followed a trend of exponential decay as a function of patient age. After the introduction of horizontal translation factors to longitudinal datasets of individual eyes, the datasets fit along a straight line in the AEM over nearly 60 years (r2 = 0.997). The decline rate of log-transformed RPE area was 0.050 (95% CI, 0.046-0.055) log(mm2)/year, and was independent of the baseline RPE area (r = −0.18; P = 0.15) and age (r = 0.06; P = 0.63). In contrast, the decline rates of the area and effective radius of residual RPE strongly correlated with the baseline RPE area (r = 0.90 and 0.61, respectively; P < 0.001).
Conclusions:
The loss of residual RPE area in untreated eyes with CHM follows the AEM over approximately 60 years. Log-transformed residual RPE area measured by FAF can serve as an anatomic endpoint to monitor CHM.
Precis:
The loss of residual retinal pigment epithelium area in eyes affected by choroideremia follows a one-stage exponential decay over approximately 60 years, with a decline rate of 0.050 (95%CI, 0.046-0.055) log(mm2)/year.
Choroideremia (CHM) is an X-linked recessive disease of the retina and choroid affecting approximately 1:50000 individuals.1–3 It is caused by mutations of the CHM gene on chromosome Xq 21.2, which encodes Rab escort protein-1 (REP1).4, 5 In the early stage of CHM, atrophy typically develops in the peripapillary and mid-peripheral retina with the loss of the retina, retinal pigment epithelium (RPE), and choroid.6 Over time, the atrophy progresses centrally towards the fovea and results in a shrinking residual central retina, with a distinctive scalloped appearance.3, 6, 7 This shrinkage leads to progressive visual field constriction and eventual total blindness in late adulthood.3, 6, 8–11 Although there are currently no approved treatment options for CHM, several trials are currently underway (e.g., NCT03507686, NCT03496012, NCT02671539, and NCT02407678) and initial results from phase I/II human clinical trials of gene therapy are encouraging,2, 12–16 It is therefore essential to establish a reliable and sensitive outcome measure to monitor the natural history of disease progression.
The most commonly used primary endpoint in previous gene therapy trials is best-corrected visual acuity (BCVA).2, 12–16 However, BCVA has several significant limitations in monitoring CHM progression. One limitation is that the BCVA is commonly unaffected in CHM patients under 30 years old,3, 9–11 which makes detecting treatment benefit in young patients challenging. Furthermore, the decline rate of BCVA in untreated patients with CHM varies widely across individual eyes with a retrospective, longitudinal study reporting 5-year BCVA change ranging from −0.07 to 0.91 logMAR.17 Besides, several longitudinal studies estimated the mean decline rate of BCVA as only 0.1 logMAR every 5 to 10 years.11, 17, 18 Since the current clinical trials have time frames of only 1 to 2 years, BCVA may not be sensitive enough to capture the disease progression within this relatively short time period, particularly in eyes enrolled with good baseline visual acuity.3, 9–11
Due to the limitations of BCVA as an endpoint, many clinical trials have chosen the residual RPE area, as measured by fundus autofluorescence (FAF), as a secondary outcome measure.14–16 However, the long-term natural history of the residual RPE area is currently unknown due to the relatively small number of patients (generally less than 50) and the limited longitudinal data in previous studies.3, 6, 7, 19–23 There are at least 3 models that we propose could describe the natural RPE decay in CHM (Table 1, available at http://www.ophthalmology-retina.org). One possible model is that the residual RPE area declines linearly over time in 1 or multiple stages. This model may be supported by an apparent 2-stage linear relationship between the residual visual field and age in a previous study.10 A second model is that the effective radius (square root of [residual RPE area/π]) of residual RPE area declines linearly with time, and the corresponding outcome measure is the rate of change of the effective radius of the equivalent RPE area. Previous studies by our group,24, 25 as well as others,26, 27 have found that the enlargement of the effective radius of RPE atrophy secondary to age-related macular degeneration (AMD) and Stargardt disease follows a linear model over time. A third possible model is that there is an exponential relationship between the residual RPE area and the elapsed time. A few recent studies have supported this model with the associated outcome measure being the log-transformed residual RPE area.3, 7, 19
In addition to considering the different models of growth, previous results in the literature have suggested a significant variation between individual eyes. For example, a retrospective case series has shown that the annual decline rate of the residual FAF area varies from 2.4 to 64.2 mm2/year in their cohort,6 and the correlation coefficient (r2) between the residual RPE size and age was only around 0.50 based on an exponential fit7, 19 and 0.67 in a logarithmic fit.20 Therefore, it is currently unknown if the RPE decline follows the same model across different individual eyes and whether there are 1 or multiple stages in the natural decline of residual RPE area. This variation poses a challenge to using residual FAF as an outcome measure in clinical trials for CHM.
The purpose of this study is to determine the long-term natural history of atrophy in CHM. Herein we sought individual-level data in the literature regarding residual RPE area measured by FAF in untreated eyes with CHM. We then performed a meta-analysis using both cross-sectional and longitudinal data of individual eyes. Based on the results, we demonstrate that the log-transformed residual RPE area measured by FAF declines linearly over approximately 60 years, and can serve as an anatomic outcome measure to monitor CHM progression.
Methods
This meta-analysis was conducted and reported in accordance with the Preferred Reporting Items for a Systematic Review and Meta-analysis of Individual Participant Data statement (PRISMA-IPD; Table 2, available at http://www.ophthalmology-retina.org).28 We did not register the study. Our study adhered to the tenets of the Declaration of Helsinki. Since this is a systematic review article with meta-analyses of published studies and does not involve human subjects, no informed consent from patients was needed.
Sources and Search Methods
An experienced medical librarian (HKGN) consulted on methodology and ran a medical subject heading analysis of known key articles provided by the research team. In each database, we ran scoping searches and used an iterative process to translate and refine the searches. To maximize sensitivity, the formal search used both controlled vocabulary terms and synonymous free-text words to capture the concepts of “choroideremia” and concepts of “residual retinal pigment epithelium”. We searched the following 7 literature databases up through July 17, 2019: MEDLINE, Ovid Embase, Web of Science Core Collection, PubMed, BIOSIS Citations, Scopus, and clinicaltrials.gov. BIOSIS and Embase were chosen to include grey literature indexes. We did not restrict the study type, language or published date. A full search strategy for Ovid MEDLINE is included in Table 8 (available at http://www.ophthalmology-retina.org). A flowchart per PRISMA-IPD statement is presented in Figure 1 (available at http://www.ophthalmology-retina.org).28
Figure 1.
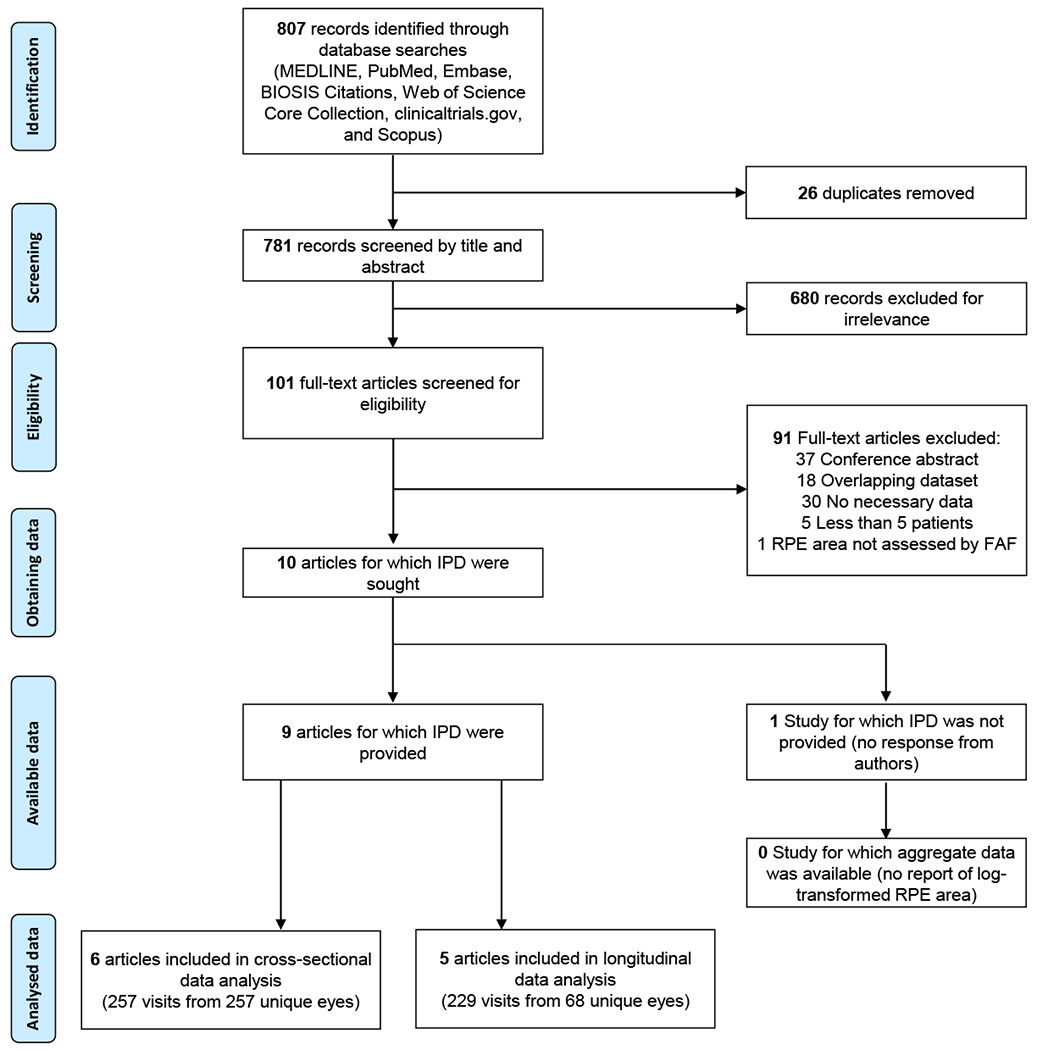
Schematic showing preferred reporting items for systematic reviews and meta-analyses (PRISMA) flowchart of identification and screening of studies that reported of individual participant data (IPD). FAF = fundus autofluorescence; RPE = retinal pigment epithelium.
Selection Criteria
The inclusion criteria were as follows: (1) recruited a group of patients (at least 5) diagnosed of CHM in 1 or both eyes without any treatment; (2) assessed residual RPE area of the affected eye by FAF on at least 1 occasion; (3) reported data of individual patients’ ages and residual RPE area. In the present study, we did not restrict the diagnostic method of CHM which could be based on clinical examinations, genetic confirmation, or both. In the event of multiple publications derived from an overlapping study population, the articles with the largest and most recent dataset were selected.
Data Collection
Two reviewers (L.L.S. and M.S.) independently screened all records found in the literature search and resolved disagreements through discussion. For each included study, 2 reviewers (L.L.S. and A.A.) independently extracted data regarding study quality, demographic characteristics, and residual RPE area (mean, standard error [SE], and standard deviation [SD]) in individual untreated eyes. We extracted the individual patient data from the text, tables, and figures in the previous publications. To extract individual data points presented in figures, we used a data extraction program (DataThief III29) which was previously validated in a study.30 If the necessary data were not available in the original manuscripts, we contacted the primary authors to request the data. We calculated the aggregate data of each study from the individual-level data. To check the data consistency, we compared the calculated aggregate data with the reported mean of RPE area in each study. The data extraction methods for each included study were detailed in Table 3 and 4 (available http://www.ophthalmology-retina.org).
Study Quality and Risk of Bias Assessment
The risk of bias and quality of studies were assessed by 2 reviewers (L.L.S. and A.A.) using the modified Quality In Prognosis Studies (QUIPS) tool (Table 5, available at http://www.ophthalmology-retina.org).31 The QUIPS tool was suggested by the Cochrane Collaboration and allows us to assess the risk of bias of studies in 6 bias domains: study participation, study attrition, prognostic factor measurement, outcome measurement, study confounding, and analysis and reporting. Since the present meta-analysis did not assess the impact of prognostic factors, we removed the “prognostic factor measurement” item from the QUIPS tool (Table 5, available at http://www.ophthalmology-retina.org). Disputes between the reviewers were resolved through discussion until there was a consensus.
We analyzed the publication bias of included studies using funnel plots which plotted the SE versus mean of the decline rate of log-transformed RPE area. After visual inspection of the funnel plots, we conducted a funnel plot-based test (the Egger test) to assess the publication bias quantitatively.32
Data Synthesis and Statistical Analysis
We performed the statistical analysis in MATLAB (The MathWorks, Inc., Natick, MA, USA) and R 3.5.1 (R Foundation for Statistical Computing, Vienna, Austria). We first investigated the correlation in the residual RPE area between the right and left eyes using individual patient data from the first available visit. To determine the decline pattern of the residual RPE area in eyes with CHM, we analyzed both cross-sectional and longitudinal data of individual patients. In the analysis of cross-sectional data, we investigated the correlation between the baseline residual RPE area in individual eyes and the age of patients at the time of imaging. In the analysis of longitudinal data, we compared 3 progression models: the area linear model (ALM), radius linear model (RLM), and area exponential model (AEM), in which the area, radius, and base-10 log-transformed area changes linearly with time, respectively.24, 25 We estimated the effective radius of RPE as the square root of (“residual RPE area”/π). In the present meta-analysis, we defined the maximal measurable area of residual RPE as the mean maximal measurable RPE area on a 55° field of view image (201.4 mm2), which was previously suggested by Jolly et al19, and comparable with the maximal field of view of imaging devices employed in other studies.7, 14, 20, 21 For each model, we first plotted residual RPE size (area, effective radius, or log-transformed area) as a function of time after enrollment for all patients. To correct for the differences in patients’ entry time into the clinical studies, we added a horizontal translation factor (in years) to each dataset, which essentially converts the horizontal axis from “time after enrollment” to “inferred duration of measurable atrophy”, where [“inferred duration of measurable atrophy” = “time after enrollment” + “translation factor”]. We restricted the y-intercept to the maximal measurable area of residual RPE on a 55° field of view (201.4 mm2).19 Since the true duration of measurable atrophy for each eye was unknown, we estimated the translation factors by adjusting 1 translation factor by 1 month at a time within a ± 80-year interval and repeated this process iteratively until the r2 was maximized for a cumulative trendline.24, 25, 33–39 Since this process was too computationally intensive (1920100 possible combinations for 100 datasets), we employed a binary search approach to narrow down the interval by half at a time until it was down to 1 month and then repeated the entire binary search until r2 no longer increased. We described the realignment algorithm in a program flowchart (Figure 2, available at http://www.ophthalmology-retina.org) and implemented the algorithm using a custom MATLAB based program. The datasets realignment method had been previously applied in our studies investigating other retinal diseases.24, 25, 33–39 We performed the same analysis for both individual eye data and aggregate data.
Figure 2.
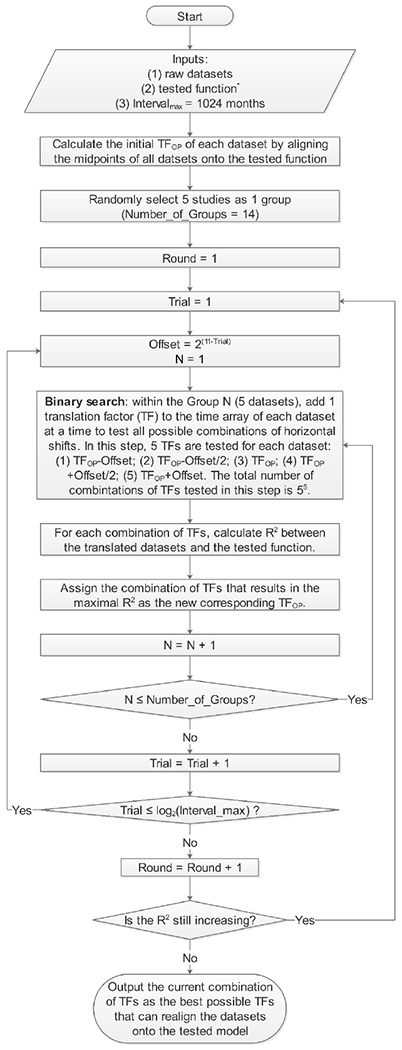
Graph showing the flowchart of the optimal realignment algorithm that searches for the best possible combination of horizontal translation factors that can realign datasets onto the tested model. The tested function is Effect Size = a × Time, where the effect size is the area of residual RPE in the area linear model, the effective radius of residual RPE in the radius linear model, and the log area of residual RPE in the area exponential model. Of note, the program could be adapted to other research questions by changing the inputs.
To further investigate the validity of each model, we investigated the correlation between the decline rate of the area, radius, or log-transformed area (mm2/year, mm/year, or log(mm2)/year) and the baseline residual RPE area using Pearson correlation coefficients (r). The RPE decline rate in each eye was determined by fitting a linear regression through all visits. If the model was correct, the RPE decline rate would be independent of the baseline residual RPE area.24, 26, 40
To correlate with previously reported visual function data in CHM, we predicted the patients’ ages when the residual RPE area decreased to 26.06 mm2, equivalent to a residual circular region with an effective diameter of 20° (assuming 1° visual angle = 0.288 mm on the retina41). The predicted age of 20° residual RPE diameter was determined by subtracting the optimized translation factor from the baseline age of each patient. Here, the translation factors were calculated using the best model and the “entry time realignment” method with y-intercept restricted to 26.06 mm2 so that the translation factors would represent the inferred duration of atrophy within 20° field at the time of entry into studies.
We determined the natural decline rate of residual RPE size using a 2-stage approach, in which we first used linear mixed-effects model to estimate the mean and SD of RPE decline rate for each study (i.e., aggregate data) and then combined the aggregate data using a random-effects meta-analysis.28, 42 The linear mixed-effects model and the random-effects meta-analysis were performed using lme4 package43 and metafor package44 in R, respectively. Heterogeneity in meta-analysis refers to the inconsistency of the outcomes between studies and was assessed by the I2 statistic.45 A low I2 suggests very little variation in the outcomes between different studies. In addition, we performed a sensitivity analysis by removing 1 study at a time and repeated the random-effects meta-analysis to assess whether a single study influenced the lesion growth rate significantly. We also investigated the impact of 4 potential confounding factors (age, duration of follow-up, study type, and diagnostic method) on the RPE decline rate. For the categorical variables (study type and diagnostic method), we performed subgroup analysis and compared the RPE decline rates using unpaired 2 tailed t-test. For continuous variables (age and duration of follow-up), we conducted univariate linear regression to investigate the correlation between RPE decline rate and the potential confounding factor.
Results
Database and Study Quality
The final search retrieved 781 records after de-duplication. There were 2 stages of the screening. The first stage was to screen by title and abstract, and we excluded 680 records for irrelevance in the first step. The common reasons for the exclusions included wrong types of studies (e.g. case report, review articles, ex vivo studies, and animal studies), female carriers with CHM gene mutation, patients with other diseases (e.g., retinitis pigmentosa, age-related macular degeneration, and progressive bifocal chorioretinal dystrophy), or unrelated topics with the same “CHM” abbreviations (e.g. canopy height model, Chinese herbal medicine, common hispanic mutation, cholesterol monohydrate, chitosan hollow microspheres, chondromodulin). In the second stage, we screened the full-text of the remaining articles and excluded another 91 articles (reasons for exclusions were listed in Table 6, available at http://www.ophthalmology-retina.org). In the end, we identified 10 articles meeting our inclusion criteria. We sought individual participant data from all 10 articles and obtained residual RPE data in 9 articles7, 12, 14, 15, 19–21, 23, 46; data were not obtained for 1 article due to no response from authors18 (PRISMA flowchart in Figure 1, available at http://www.ophthalmology-retina.org).
Among the included articles, 6 independent studies reported cross-sectional data of residual RPE area in individual eyes (including 257 visits from 257 unique eyes; Table 3, available at http://www.ophthalmology-retina.org); Figure 3 (available at http://www.ophthalmology-retina.org) shows the raw cross-sectional data of individual eyes for each study. Five independent studies reported longitudinal data of residual RPE area in individual patients (comprising of 229 visits from 68 unique eyes; Table 4, available at http://www.ophthalmology-retina.org); Figure 4 (available at http://www.ophthalmology-retina.org) shows the raw longitudinal data of individual eyes. We found the extracted individual-level data and the reported study-level data were consistent in all studies. On the study level, the mean age of patients ranged from 28.3 to 54.5 years, and the mean baseline residual RPE area measured by FAF ranged from 4.54 to 27.91 mm2 across studies. On the individual level, the age of patients with CHM ranged from 11 to 74 years, and the baseline residual RPE area ranged from 0 to 168.70 mm2. The detailed descriptive information of the included studies is in Table 3 and 4, available at http://www.ophthalmology-retina.org.
Figure 3.
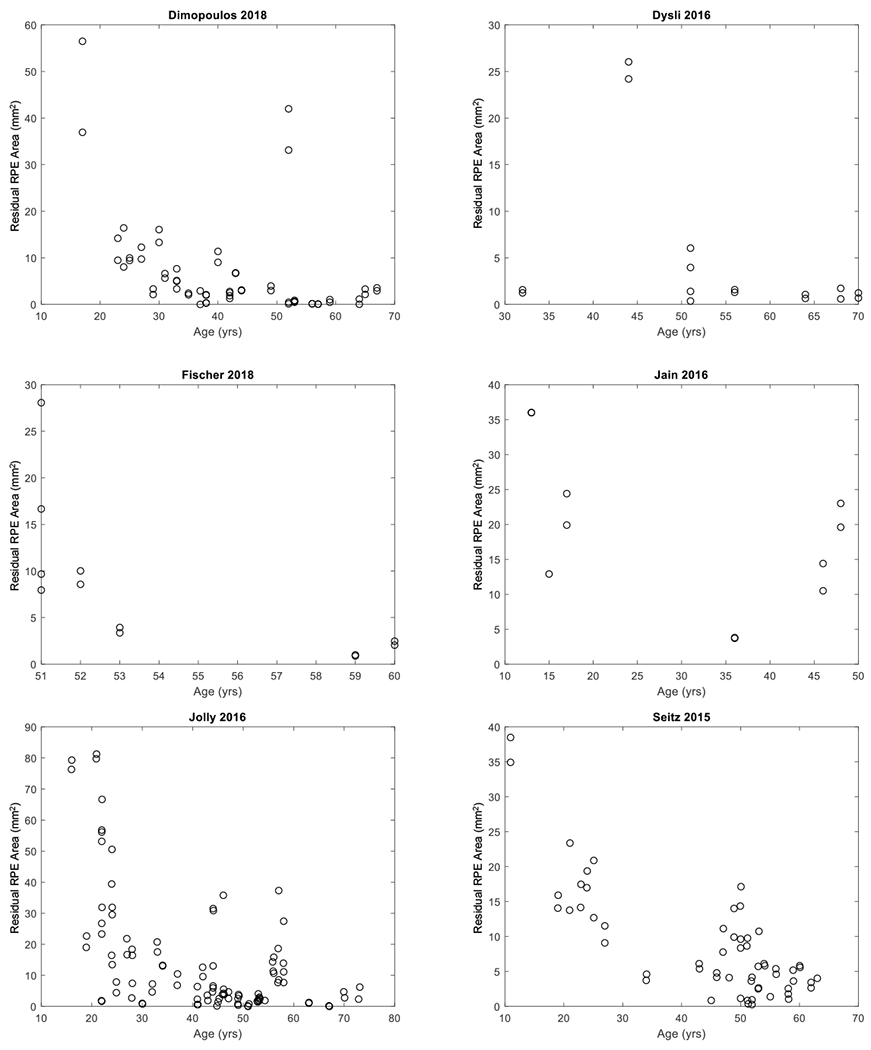
Graphs showing cross-sectional individual participant data extracted from six studies. Each circle represents the area of residual retinal pigment epithelium (RPE) in one eye at the patient’s age of examination.
Figure 4.
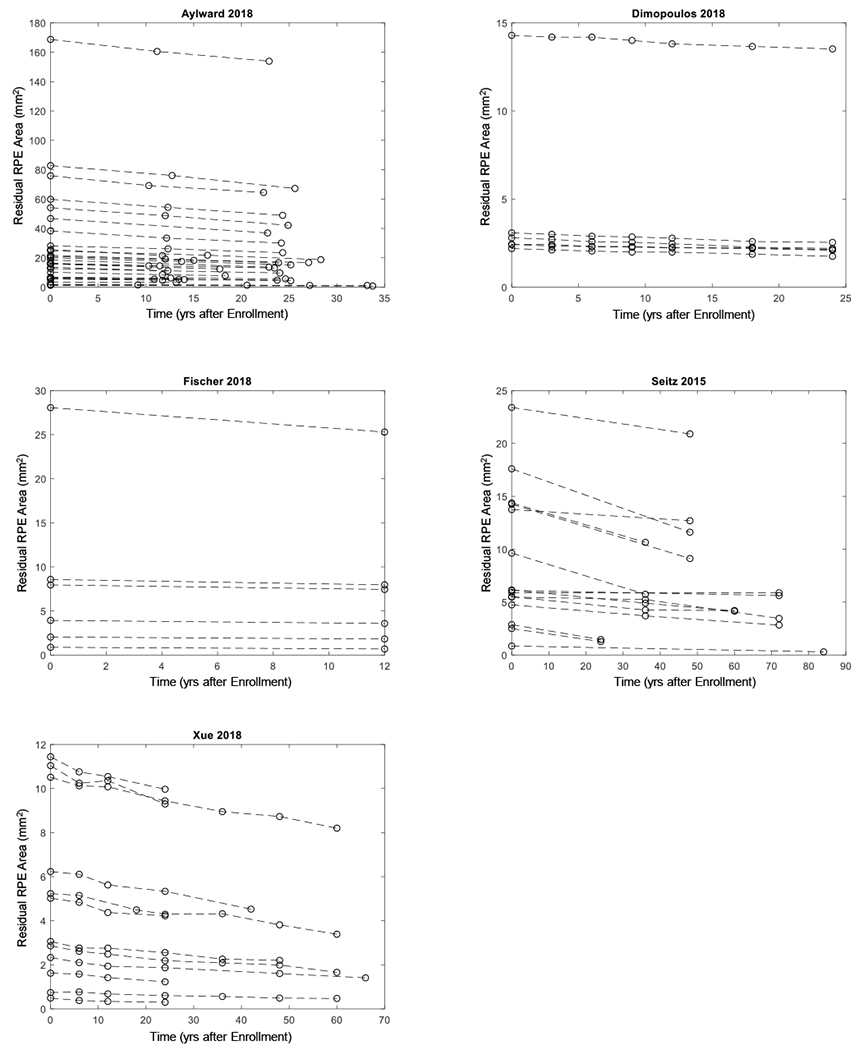
Graphs showing longitudinal data extracted from five studies. Each dashed line represents one eye with Choroideremia, and the circles on the dashed line represent residual area of retinal pigment epithelium (RPE) at baseline and subsequent follow-up(s).
Table 7 (available at http://www.ophthalmology-retina.org) shows the results of the assessment for the risk of bias using the QUIPS tool.31 Since the present study consisted of meta-analysis using cross-sectional and longitudinal data, we assessed the quality of each study separately. The included studies generally had good quality and low risk of bias. Of the 6 studies included in the cross-sectional data analysis, 1 study was judged to have low risk of bias in all 5 bias domains, and the remaining 5 studies were rated as having 1 domain with moderate risk of bias and 4 domains with low risk of bias (Table 7A, available at http://www.ophthalmology-retina.org). Of the 5 studies included in the longitudinal data analysis, 2 studies were found to have low risk of bias in all 5 bias domains, and the remaining 3 studies were assessed as having 1 domain with moderate risk of bias and 4 domains with low risk of bias (Table 7B, available at http://www.ophthalmology-retina.org). We did not find any evidence of publication bias regarding the RPE decline rate effect size based on the symmetrical funnel plot and Egger’s test (P = 0.25; Figure 5, available at http://www.ophthalmology-retina.org).
Figure 5.
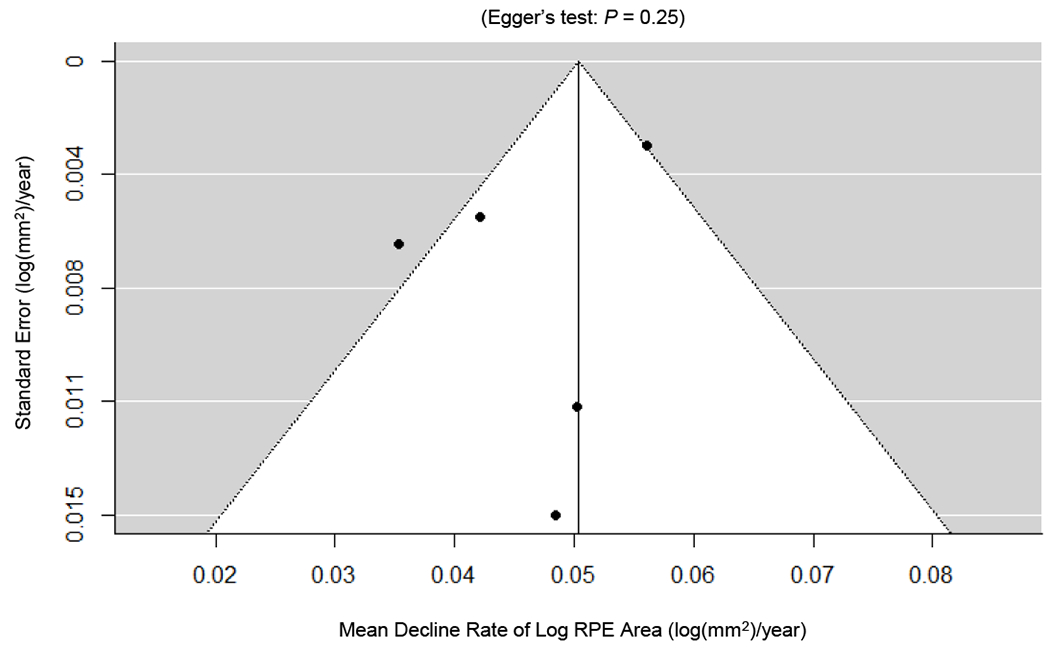
Publication biases as assessed by funnel plots and Egger’s test. Each circle represents a standard error at a mean decline rate of log area of retinal pigment epithelium (RPE) in an included study with longitudinal data. The vertical line represents the estimate of mean value of the decline rate of log RPE area, and the diagonal lines are pseudo 95% confidence intervals. We did not find any evidence of significant publication bias in the reported decline rate of residual RPE, as demonstrated by the symmetrical funnel plots and Egger’s test (P = 0.25).
Cross-sectional Data Demonstrate Inter-eye Symmetry and a Trend of Exponential Decay of the Residual RPE Area
There was a strong concordance of the residual RPE area between the right and left eyes (Pearson’s r = 0.94; Figure 6). Also, the line of equality (blue line in Figure 6) was within the 95% confidence interval (CI), further indicating an excellent inter-eye symmetry in residual RPE area between the 2 eyes. Figure 7 shows the residual RPE area in 257 untreated eyes as a function of age at examination. The residual RPE area was negatively correlated with the age (P < 0.001), suggesting that the residual RPE area of patients affected by CHM declined over time. Based on the data, there appeared to be a trend of exponential decline of residual RPE area over time with the exponential decay constant (λ) of −0.096 years−1. However, the data points appeared very scattered, and the exponential fit was poor with an r2 of only 0.30, which was comparable to previous reports.7, 19, 20 One possible explanation for the poor fit between RPE area and age was that patients might have different ages of onset of measurable RPE atrophy within the imaging devices’ field of view.7 This hypothesis was supported by the relatively large residual RPE area in some eyes at advanced ages (around 50 years). Thus, to determine the natural history of the decline of RPE area in CHM, it was necessary to analyze the longitudinal data and correct for different ages of onset of measurable atrophy in individual eyes.
Figure 6.
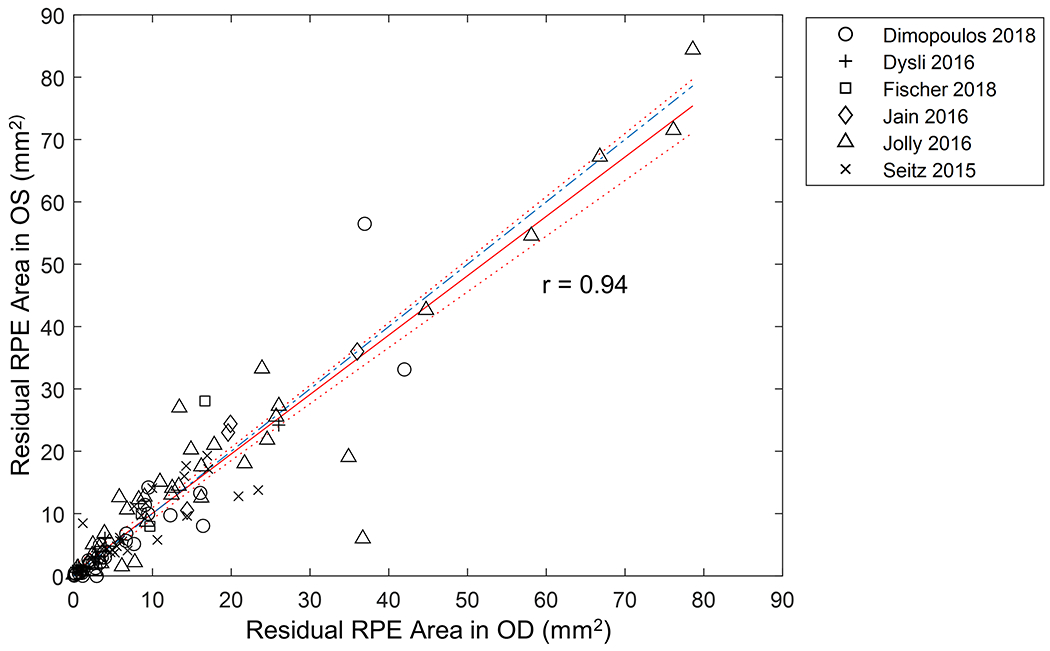
Graph showing strong inter-eye symmetry of the residual RPE area in 117 patients (234 eyes) affected by Choroideremia (Pearson’s r = 0.94). The red solid red line represents the best-fitted trendline. The dotted lines represent the 95% confidence interval of the trendline. The blue dash-dotted line represents the line of equality (slope= 1) between the right and left eyes and was within the 95% confidence interval of the trendline.
Figure 7.
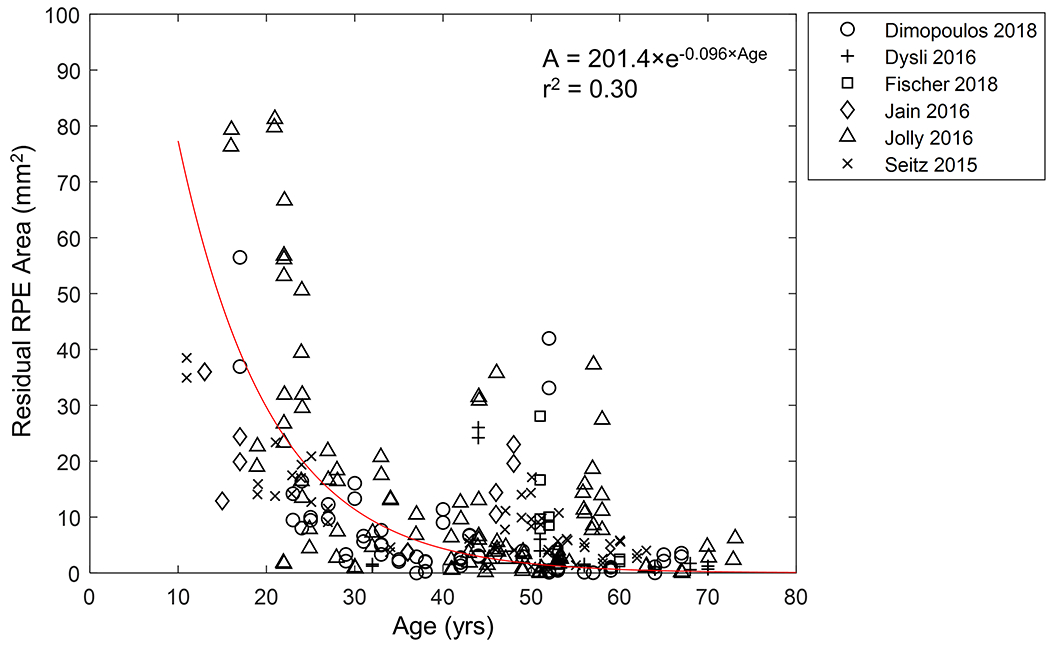
Graph showing the residual area of retinal pigment epithelium (RPE) as a function of age in 257 untreated eyes. The data appear to follow an exponential decay (r2 = 0.30) with data points scattered along the trendline. Note, some eyes have relatively large residual RPE area at advanced ages. We restricted the y-intercept of the exponential trendline (in red) to the mean maximal measurable RPE area in a 55° image (201.4 mm2), as suggested by Jolly et al19.
The Residual RPE Area Follows an Exponential Decay over Nearly 60 Years Based on Longitudinal Data
Figure 8A shows the residual RPE area of 68 individual eyes as a function of time after enrollment into studies. Note that the baseline RPE area varied widely among individual eyes and that the slopes (i.e., the decline rate of RPE area) appeared to decrease with decreasing baseline RPE area (Figure 8A). Interestingly, after converting RPE area to log-transformed area in Figure 8B, the datasets became much more parallel to one another, although the baseline sizes still varied. After introducing a horizontal translation factor (Figure 9, available at http://www.ophthalmology-retina.org) to each eye to correct for different entry times, the log-transformed RPE area fit along a straight line as a function of inferred duration of measurable atrophy (i.e., the AEM) with a very high r2 value of 0.997 over a course of nearly 60 years (compare Figure 8B with Figure 8C). The reconstructed natural history of the residual RPE area as a function of time (linear scale in y-axis) was shown in Figure 10 (available at http://www.ophthalmology-retina.org). Based on the longitudinal data, the exponential decay constant (λ) of the RPE decline in CHM was −0.113 years−1, comparable to the value determined using the cross-sectional data (λ = −0.096 years−1).
Figure 8.
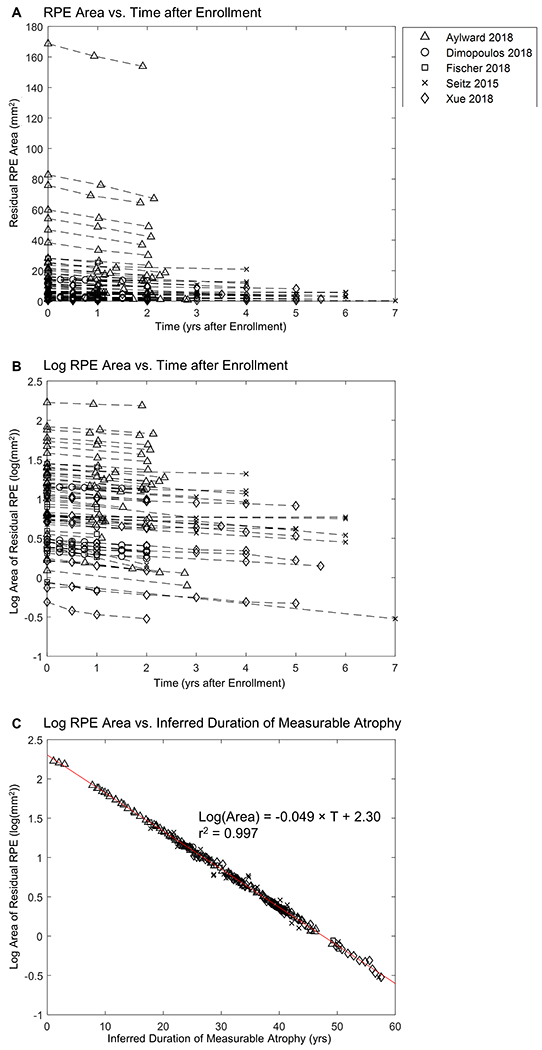
Graphs showing the size of residual retinal pigment epithelium (RPE) as a function of time. A, Individual-level raw data from prior publications (the raw data for individual studies are shown in Figure 4, available at http://www.ophthalmology-retina.org). The plot shows a series of 68 lines representing the decline in residual RPE area in 68 untreated individual eyes with Choroideremia (CHM) at 229 visits. Each dashed line represents 1 eye with CHM, and the markers on the dashed line represent residual RPE area at baseline and subsequent follow-up(s). Note that the initial area of residual RPE (time = 0) varies across different patients and that the slopes (i.e., decline rate in RPE area) of datasets appear to decrease with decreasing baseline RPE area (on the y-axis). B, Data generated by converting residual RPE area (mm2) in (A) to log-transformed area (log(mm2)); note that the lines appear to be more parallel to one another. C, Data generated by adding a horizontal translation factor (expressed in years in Figure 9, available at http://www.ophthalmology-retina.org) to each dataset in (B) to correct for different entry times of patients into studies. The horizontal axis now represents the duration of disease rather than years after enrollment into studies. After the introduction of horizontal translation factors, datasets from all 68 eyes now fit along a straight line in the area exponential model with a slope of 0.049 log(mm2)/year (r2 = 0.997).
Figure 9.
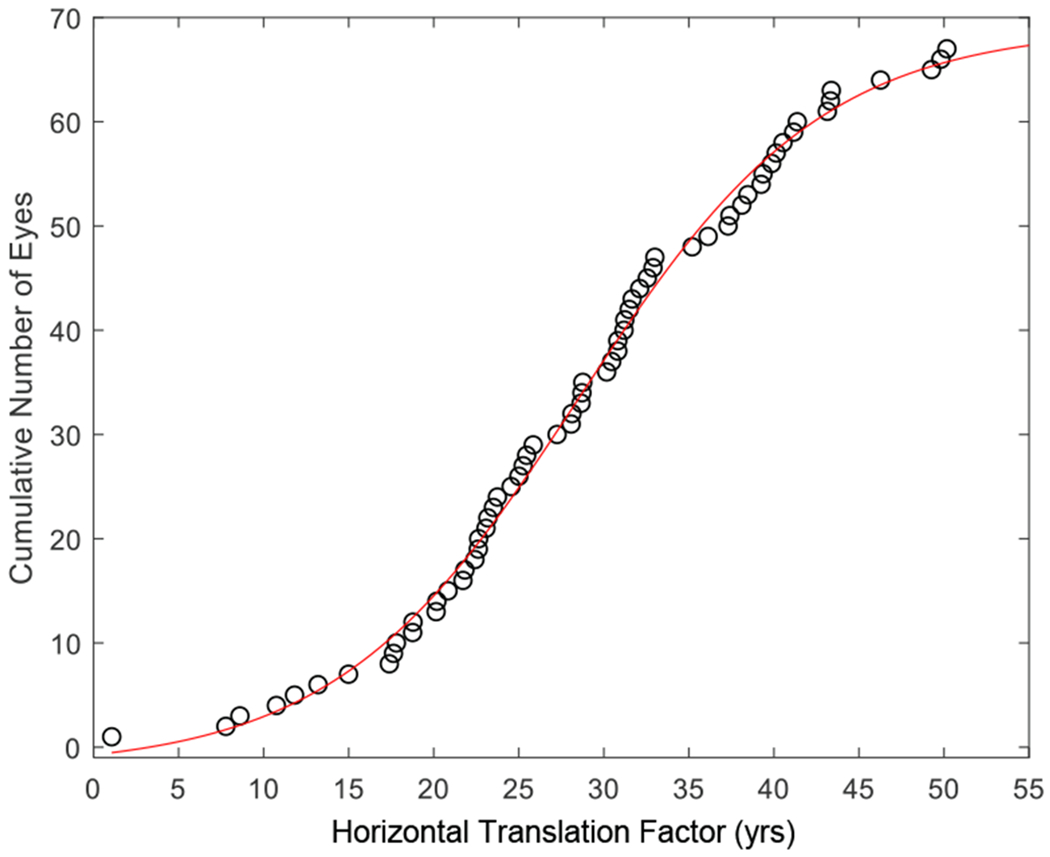
Graph showing the distribution of translation factors that transformed datasets in Figure 8B to 8C. The translation factors represent the inferred duration of measurable retinal pigment epithelium atrophy for the 68 individual eyes. The cumulative number of eyes as a function of translation factors fits a sigmoid curve, indicating that the translation factors follow a normal distribution.
Figure 10.
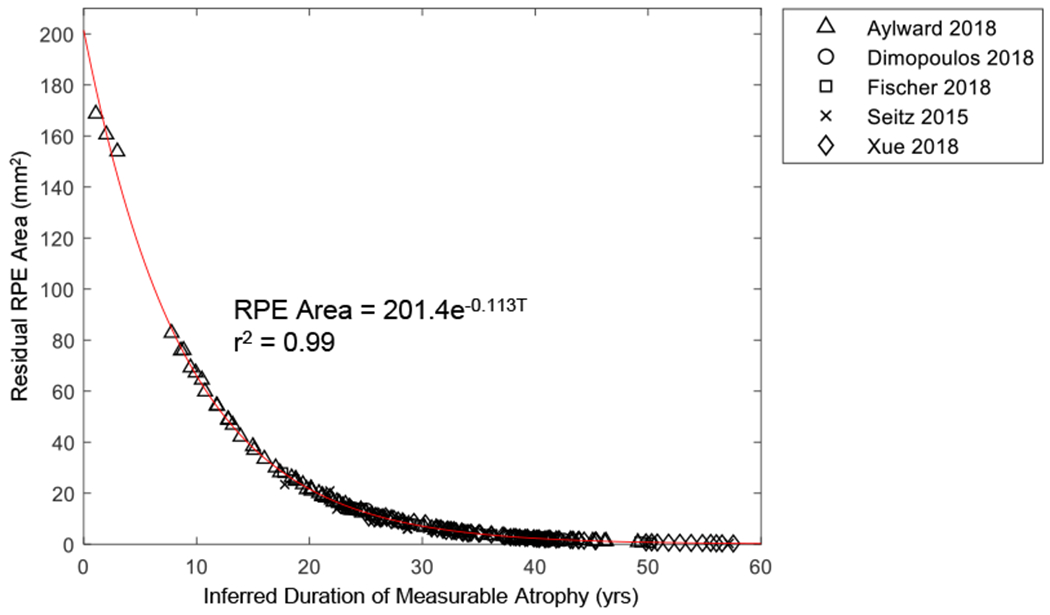
Graph showing the residual area of retinal pigment epithelium (RPE) as a function of inferred duration of measurable atrophy. Data generated by converting the y-axis (log area) of Figure 8C to area. The exponential decay constant determined from the longitudinal data (λ = −0.113 year−1) is comparable to the λ determined from the cross-sectional data (λ = −0.096−1) shown in Figure 7.
The aggregate data demonstrated similar results (Figure 11, available at http://www.ophthalmology-retina.org). Figure 11A (available at http://www.ophthalmology-retina.org) shows that the mean baseline RPE size varied across different studies, suggesting that the “average” patients of different studies had distinct durations of measurable RPE atrophy at the time of entry into studies. After introducing horizontal translation factors to correct for the different entry times, the mean log-transformed RPE area fit along a straight line with a very high r2 of 0.998, further suggesting the AEM (compare Figure 11A with Figure 11B, available at http://www.ophthalmology-retina.org).
Figure 11.
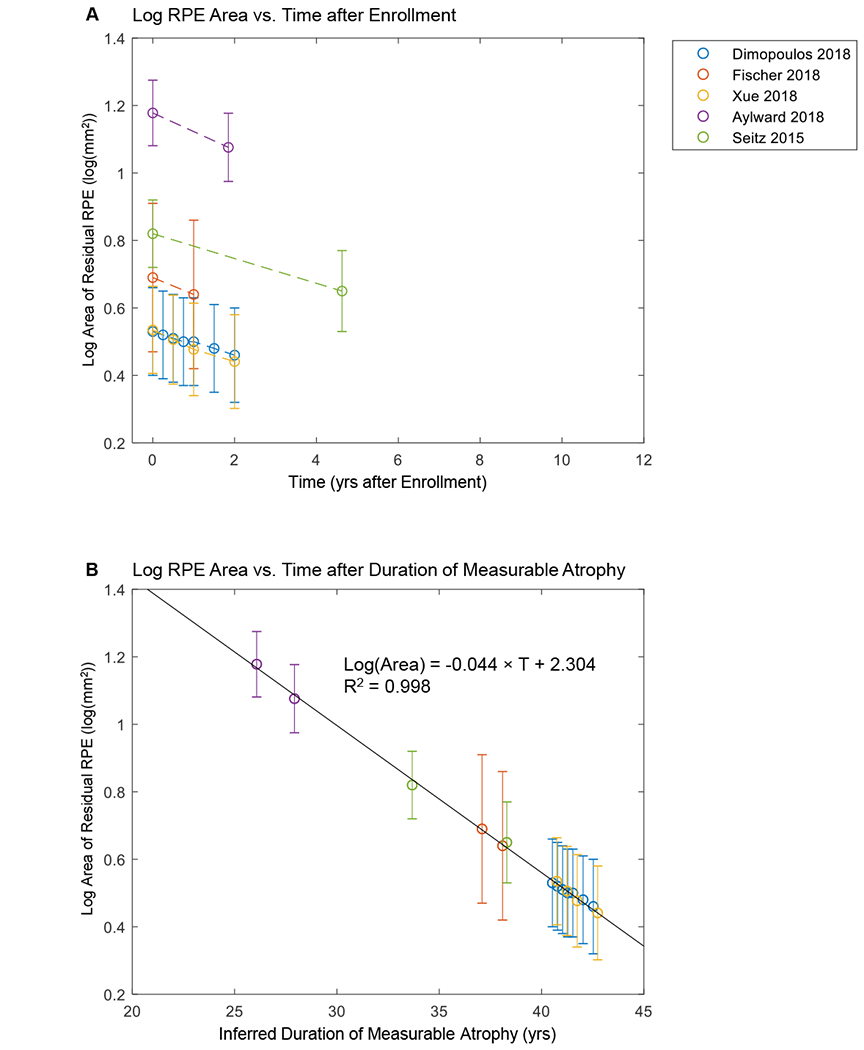
Size of residual retinal pigment epithelium (RPE) as a function of time using aggregate data. A, Aggregate raw data from prior publications (error bars = standard errors). The plot shows a series of lines for the decline of log area of residual RPE in untreated eyes with Choroideremia (CHM). Note that the initial size of residual RPE (time = 0) varies across different studies. B, Data generated by adding a horizontal translation factor (expressed in years) to each data set in (A) to correct for different entry times of the patients at the time of enrollment. Horizontal axis now represents inferred duration of disease rather than years after enrollment into studies. After the introduction of horizontal translation factors, data sets from all 5 studies now fit along a straight line in the area exponential model (r2 = 0.998).
The decline rate of the log RPE area did not significantly correlate with the baseline RPE area (r = −0.18, P = 0.15; Figure 12A), further supporting the good fit of the AEM. However, in the ALM and RLM, the decline rates strongly correlated with the baseline RPE area (r = 0.90 and P < 0.001 for the ALM; r = 0.61 and P < 0.001 for the RLM), suggested poor fits (Figure 12B and C). Thus, using the log-transformed area as the outcome measure could dramatically reduce the dependence of the decline rate on baseline RPE area among different eyes in clinical trials.
Figure 12.
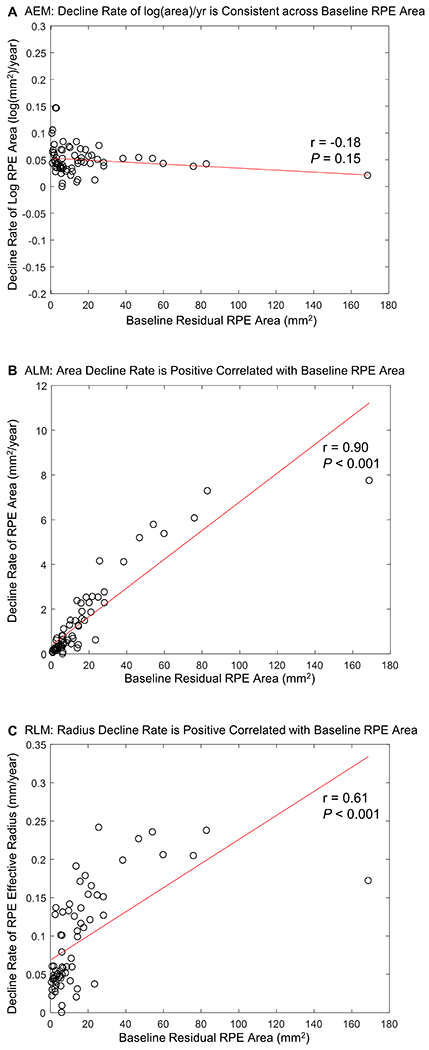
Graphs showing the relationship between the decline rate of residual RPE and baseline residual area of retinal pigment epithelium (RPE) in (A) the area exponential model (AEM), (B) the area linear model (ALM), (C) the radius linear model (RLM). (B) and (C) show that the RPE decline rate strongly depends on the baseline residual RPE area in the ALM and AEM (r = 0.90 and P < 0.001 for the ALM; r = 0.61 and P < 0.001 for the RLM). In contrast, (A) illustrates that using the logarithm-transformed area of RPE reduces the dependence of the decline rate on the baseline RPE area greatly (r = −0.18 and P = 0.15 for the AEM).
Based on the AEM, we predicted the ages at 20° residual RPE diameter (i.e., residual RPE area dropped to 26.06 mm2) in individual eyes (Figure 13 A and B). The predicted ages followed a normal distribution among individual eyes (27.0 ± 11.8 years). The prediction corresponded well to the visual field data reported in a previous study (including 128 patients with CHM) by Freund et al, who reported a median visual field width of 25 degrees in age 20-30 years, and 15 degrees in age 30-40 years.10
Figure 13.
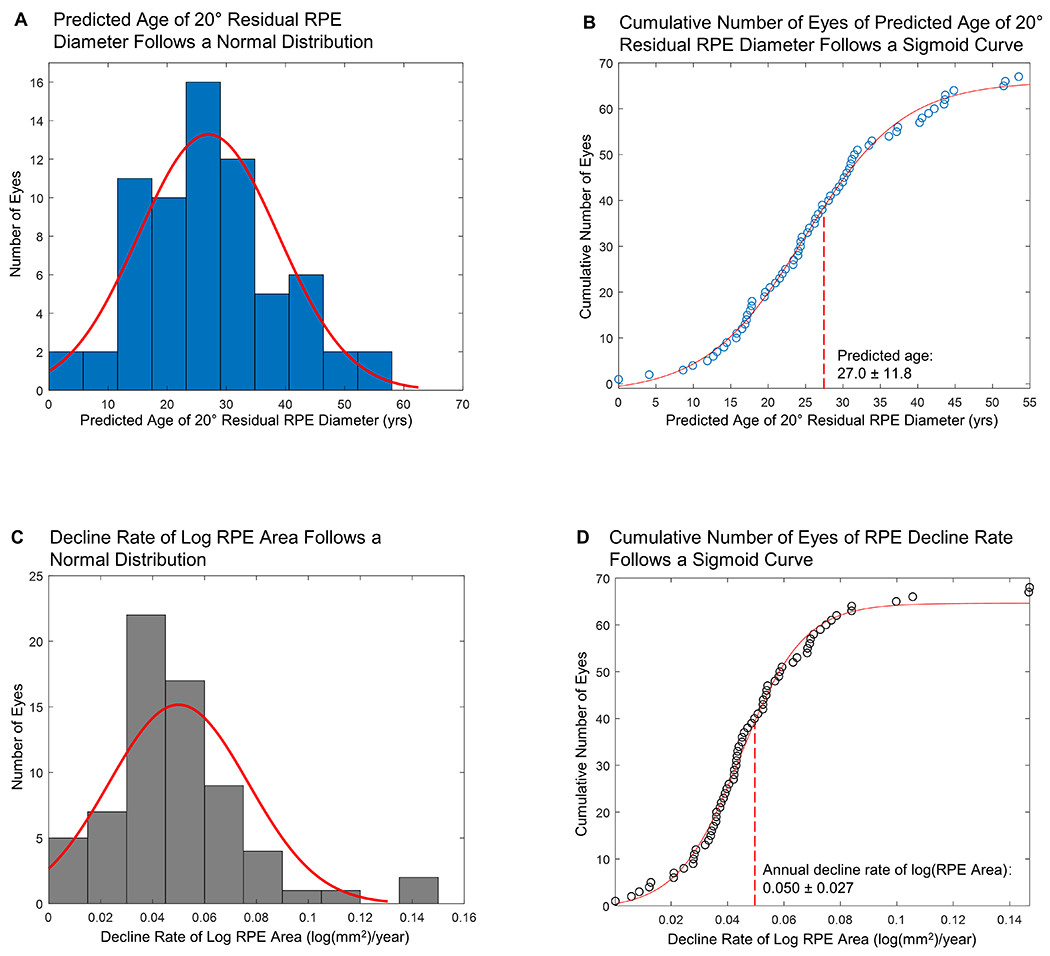
Graphs demonstrating the normal distribution of (A, B) predicted age when the effective diameter of the residual retinal pigment epithelium (RPE) drops to 20 degrees, and (C, D) decline rates of log RPE area (N = 68 eyes). The mean (± SD) predicted age of 20 degrees residual RPE diameter is 27.0 ± 11.8 years. The mean (± SD) decline rate of log RPE area is 0.050 ± 0.027 log(mm2)/year. SD = standard deviation.
Natural Decline Rates of the Residual RPE in Choroideremia
Based on both cross-sectional and longitudinal data, we found that the AEM was the best fit to describe the natural decline of residual RPE in CHM. Figure 13 C and D show that the decline rate of log RPE area followed a normal distribution among the 68 individual eyes. Based on the random-effects meta-analysis (Figure 14, available at http://www.ophthalmology-retina.org), the decline rate of log RPE area was 0.050 log (mm2)/year (95% CI, 0.046-0.055 log(mm2)/year), equivalent to a loss rate of residual RPE area by 10.88% (95% CI, 10.05-11.90%) per year. Based upon the data, the half-life of residual RPE area was 6.0 years (95% CI, 5.5-6.5 years). The I2 was 0%, suggesting no evidence of heterogeneity between different studies. Sensitivity analysis showed that the decline rate of log RPE area ranged from 0.041 to 0.053 log(mm2)/year after removing one study repeatedly, suggesting no single study significantly affected the pooled RPE decline rate.
Figure 14.
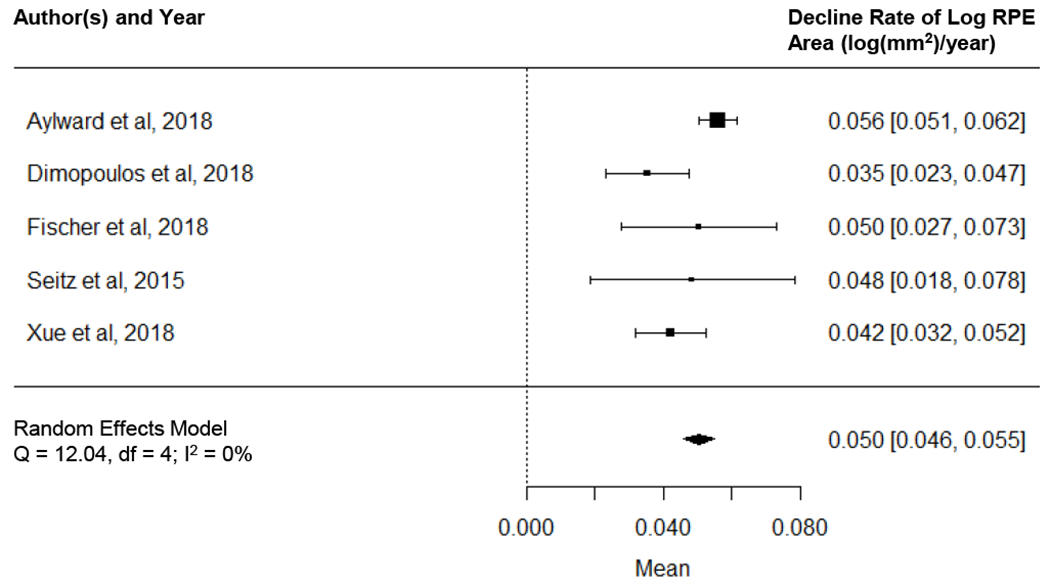
Graph showing random-effects meta-analysis on the decline rate of logarithm of residual area of retinal pigment epithelium (RPE) in eyes with Choroideremia (CHM). Data were generated using a 2-stage approach: we first used linear mixed model to estimate the decline rate of log RPE area for each study separately (i.e., aggregate data) and then we synthesized the aggregate data using a random-effects meta-analysis. The size of the marker represents the weight of the corresponding study. The diamond in the bottom represents the overall effect estimate of the decline rate of log RPE area (width of the diamond represents the 95% confidence interval).
In the analysis of confounding factors, we found that the study type, diagnostic method, age of patients, and duration of follow-up did not affect the decline rate of log RPE area significantly. More specifically, the RPE decline rate was 0.054 ± 0.029 log(mm2)/year in observational studies which was comparable to the RPE decline rate (0.043 ± 0.021 log(mm2)/year) in interventional studies (P = 0.11). In studies using clinical diagnosis without excluding patients who did not receive genetic confirmations, the RPE decline rate was 0.054 ± 0.029 log(mm2)/year which was also comparable to the RPE decline rate (0.043 ± 0.021 log(mm2)/year) in studies using genetic diagnosis (P = 0.11). Also, we found that the decline rate of log RPE area was independent of the age of patients at baseline (r = 0.06, P = 0.63; Figure 15A), suggesting the steady and consistent decline rate of log RPE area across a wide range of ages (age ranges from 12 to 72 years in Figure 15A). Finally, using the first and second visits of each eye, we found that the decline rate of log RPE area was consistent across different durations of follow-up (r = −0.17, P = 0.18; Figure 15A). The RPE decline rate assessed in eyes with ≤ 1 year follow-up (0.053 ± 0.041 log(mm2)/year; n = 33 eyes) was similar to the decline rate determined in eyes with > 1 year follow-up (0.051 ± 0.032 log(mm2)/year; n = 35 eyes) (P = 0.83), suggesting that log-transformed residual RPE area may be used in clinical trials with relatively short time frames.
Figure 15.
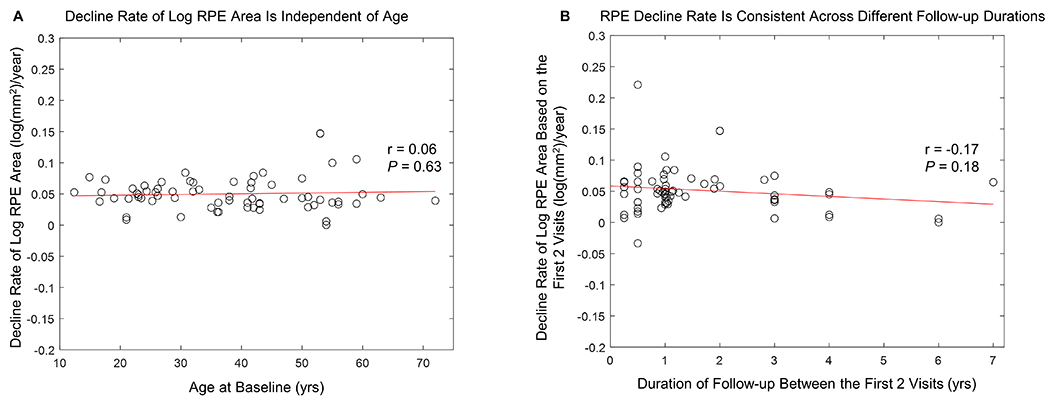
A, Graph showing the decline rate of the log-transformed area of residual retinal pigment epithelium (RPE) was independent of patients’ ages (Pearson’s r = 0.06, P = 0.63). B. Graph showing the decline rate of log-transformed area of residual retinal pigment epithelium (RPE) determined using the first and second visits of each eye was consistent across different durations of follow-up between first and second visits (Pearson’s r = −0.17, P = 0.18). The mean (± SD) RPE decline rate assessed in eyes with ≤1 year follow-up (0.053 ± 0.041 log(mm2)/year) was similar to the decline rate determined in eyes with >1 year follow-up (0.051 ± 0.032 log(mm2)/year) (P = 0.83).
Discussion
To the best of our knowledge, this is the first systematic review and meta-analysis to determine the long-term natural history of RPE atrophy in patients with CHM. The current study was motivated by the need for a sensitive and reliable outcome measure to monitor the progression of CHM among patients in ongoing and upcoming gene therapy trials. To date, only a few studies with a relatively small number of patients have investigated the natural history of residual RPE in patients affected by CHM.3, 7, 19, 20, 22 Most were limited by the nature of cross-sectional data and only correlated the residual RPE area with the age at examination.3, 19, 20, 22 Similar to the scattered data points shown in Figure 7, the previous studies also found significant variations among individual eyes with a poor fit between residual RPE area and age (r2 = 0.48-0.67).3, 7, 19, 20, 22 A priori, the reasons for the differences among different eyes are not known, but at least 2 possibilities exist. First, it is possible that different eyes represent different phenotypes or subpopulations of CHM, which may be associated with the genotypes, demographic factors, disease stages, or environmental factors. However, a simpler and more unifying hypothesis is that the progression of RPE atrophy in eyes with CHM has a uniform, 1-stage behavior, with the same underlying decline pattern of the residual RPE area over decades. If the latter hypothesis is correct, the variations of the residual RPE area in eyes with similar ages may simply arise from differences in the ages of onset of measurable RPE atrophy (i.e., different durations of atrophy at the time of entry into the studies). Examination of Figure 8A and Figure 16 (available at http://www.ophthalmology-retina.org) suggests that this is indeed the case. The eyes had a wide range of initial residual RPE areas (Figure 8A), presumably because larger baseline residual RPE sizes were present in eyes entering into the studies earlier in the course of their disease. We first attempted to use the patients’ ages to correct for the different entry times, but the fit was inferior with an r2 of 0.19 (Figure 16, available at http://www.ophthalmology-retina.org). However, the datasets appeared parallel to one another and scattered around the trendline, suggesting that the eyes may have similar RPE decline rates but have different ages of onset of measurable RPE atrophy. To correct for the different ages of onset and entry times, we introduced horizontal translation factors and realigned the datasets (i.e., “entry time realignment”) to reconstruct the long-term natural history of CHM.24, 25, 33–38 Figure 8C reveals the success of this approach, which resulted in a high correlation (r2 = 0.997) between log-transformed RPE area and the elapsed time in all individual eyes over a course of nearly 60 years (Figure 8C). Thus, in the present meta-analysis, we demonstrated that the decline of RPE area in untreated eyes with CHM follows a 1-stage exponential function (i.e., the AEM), in which the log-transformed RPE area declines linearly over nearly 60 years. The data were uniform across different individual eyes, with variation mainly in age of onset.
Figure 16.
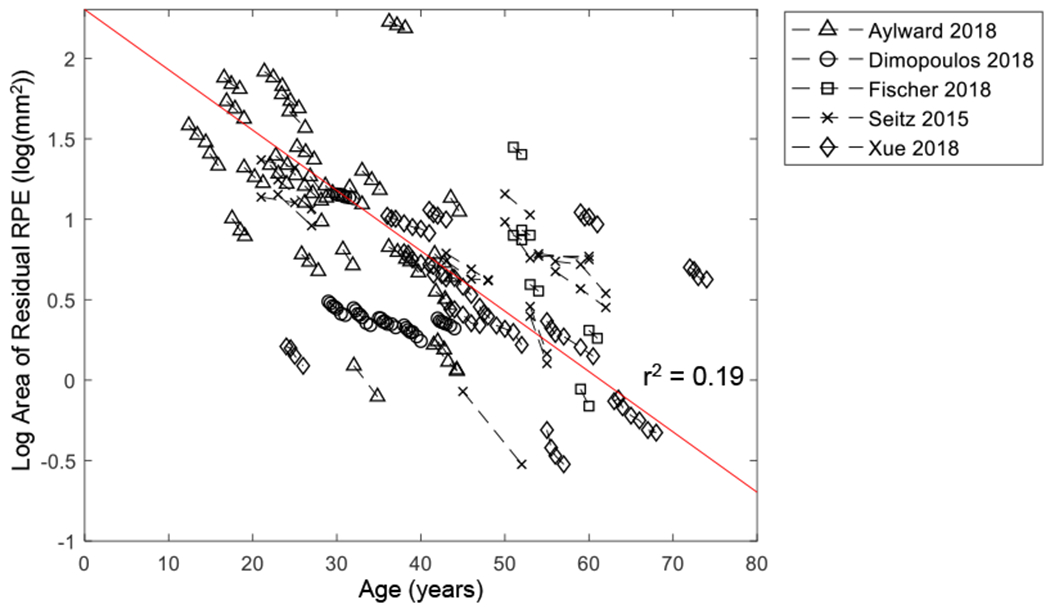
Graph showing log-transformed area of residual retinal pigment epithelium (RPE) as a function of age. Each dashed line represents one eye with Choroideremia, and the circles on the dashed line represent log area of residual RPE at baseline and subsequent follow-up(s). The data sets appear to be parallel to one another and scattered around the trendline (r2 = 0.19), suggesting patients may have similar RPE decline rates but have different ages of onset of measurable RPE atrophy.
After establishing that the log-transformed residual RPE area declined linearly over time, we used the random-effects meta-analysis (2-stage approach) to estimate the decline rate of log RPE area as 0.050 log (mm2)/year (95% CI, 0.046-0.055 log(mm2)/year; Figure 14, available at http://www.ophthalmology-retina.org), which was equivalent to 10.88% (95% CI, 10.05-11.90%) per year. We also found that the decline rate of log RPE area was independent of the baseline residual RPE area (r = −0.18, P = 0.15, Figure 12A) and the patients’ ages at baseline (r = 0.06, P = 0.63; Figure 15A). When we used the AEM model to predict the age at which 20° of residual RPE diameter remained, we found 27.0 ± 11.8 years, comparable to the previously reported visual field data (median visual field width = 25° in age 20-30 years, and 15° in age 30-40 years10).
Our meta-analysis provides several insights. Although BCVA is the most commonly used primary endpoint in gene therapy trials for CHM,12–15 BCVA has several limitations in monitoring CHM progression including 1) unaffected BCVA in most young CHM patients,3, 6, 9–11 2) widely varied BCVA decline rates among individual eyes (−0.07 to 0.91 logMAR per 5 years),17 and 3) a low mean decline rate of BCVA (approximately 1 line every 5 to 10 years reported in previous longitudinal studies).11, 17, 18 Due to these limitations, BCVA may not be sensitive enough to detect CHM progression in some patients, especially within the relatively short time frame of clinical trials. In the present study, we have found that an alternative and potentially more reliable outcome measure (i.e., the log-transformed residual RPE area measured by FAF) to monitor CHM progression. The use of the log RPE area as an endpoint has the potential to avoid the above 3 limitations. First, the log RPE area can be used to monitor CHM progression across all age groups because the decline rate of the log RPE area was found consistent across a wide range of baseline ages (12-72 years; Figure 15A). Second, the decline of the log RPE area was uniform and steady across different eyes over nearly 60 years (Figure 8C), thus allowing for direct comparisons among patients at different stages of the disease. Third, a relatively short duration of follow-up (e.g., 1 year) was able to detect a significant decline in the log RPE area (Figure 15B), indicating that the log RPE area may potentially be sensitive to determine a treatment effect within short time frames. Besides, our findings supported the current use of the fellow eyes as controls in gene therapy trials.14–16 There was a strong inter-eye symmetry of the residual RPE area (r = 0.94; Figure 6). Also, among patients receiving gene therapy treatments in the study eyes, the RPE decline rate in the fellow eyes (0.043 ± 0.021 log(mm2)/year) was relatively unchanged compared to the RPE decline rate in patients without treatments in any eyes (0.053 ± 0.029 log(mm2)/year) (P = 0.11). Of note, a similar anatomic measure (i.e., size of RPE atrophy) is currently the most common primary endpoint in clinical trials designed for geographic atrophy secondary to non-exudative age-related macular degeneration47 and Stargardt disease (clinicaltrials.gov).
However, it is important to recognize several potential pitfalls of utilizing the log-transformed residual RPE area as a clinical trial outcome for CHM. Despite a thorough search in 7 literature databases, we were only able to identify and extract 68 eyes with a longitudinal follow-up of residual RPE area. Therefore, a future prospective, longitudinal, observational study with a large number of CHM patients is needed to further establish the reliability and sensitivity of using the log-transformed residual RPE area as an outcome measure. We recommend future studies to apply the “entry time realignment” technique to account for the vastly different age of onset of measurable atrophy among patients and to identify outlier patients who may not follow the AEM. Moreover, prognostic factors for the decline rate of log-transformed residual RPE area in CHM are largely unknown and should be explored in future studies to assist the design of treatment trials and interpretation of study results. As a starting point, future studies may investigate previously identified prognostic factors for RPE atrophy progression rate in atrophic AMD and other retinal degenerations (e.g., number of atrophic lesions, the perimeter of lesions, FAF patterns, topographic locations, the progression rate of the fellow eye).35–37, 39, 48–51 Besides, the relationship between the residual RPE area and visual function is currently unclear and needs to be established in future studies. A sensitive visual function measure is essential to monitor the treatment impact on patients’ daily functions. Several visual function measures including retinal sensitivity, visual field, and color vision have been proposed and assessed as secondary outcome measures in gene therapy trials.12–15 However, the current longitudinal data on these visual function measures are limited and need to be further investigated in future studies.
The natural history data in the present study may also provide help in predicting the prognosis of individual eyes with CHM based on the present residual RPE area. Personalized prognostic predictions can be crucial in developing individual plans for follow-up visits and treatment options for patients. Based upon the estimated RPE decline rate of 10.88% (95%CI, 10.05-11.90%) per year, we can predict the residual RPE area in individual eyes harboring different baseline residual RPE area. For a baseline residual RPE area of 200 mm2, 100 mm2, 50 mm2, and 30 mm2, the area of enlarging atrophy will be 21.7 mm2, 10.9 mm2, 5.4 mm2, and 3.3 mm2 after 1 year, respectively. The substantial differences in the total loss of RPE area over 1 year suggest early interventions may be necessary to preserve the maximal viable chorioretinal area upon the establishment of effective treatments.
With the natural history data on the residual RPE area, we can also draw inferences about visual field loss in CHM patients. As observed in prior studies, the atrophy in CHM typically starts in the mid-periphery and progresses centrally in a steady fashion towards the fovea over a patient’s lifetime.6, 9, 19 As the atrophy progresses, patients experience a similar and progressive constriction of the visual field.9, 11, 52 In addition, a previous longitudinal study has shown that the visual field loss may also follow an exponential function with an estimated loss rate of 8.3% per year for the V-4e target,9 comparable to the decline rate of the residual RPE area in our present study (10.88% per year). The correlation between the atrophy progression and visual field loss is likely explained by the fact that the residual retinal islands in CHM have relatively preserved visual function while the completely atrophic regions have dense scotomas.53, 54 Thus, we may use the residual RPE area to approximate and predict the residual visual field if we assume a direct correlation between residual RPE area and visual field and a roughly circular retinal island when the residual RPE area is small.19 Based on these 2 assumptions, we predicted the age when the effective diameter of the RPE drops to 20 degrees (i.e., RPE area drops to 26.06 mm2) as 27.0 ± 11.8 years (Figure 13A and B), corresponding well to a previous report, in which the median visual field width was 25 degrees in age 20-30 years and 15 degrees in age 30-40 years.10 To estimate the age of 20 degrees residual visual field width (a criteria for legal blindness in many countries55–57) in individual patients with CHM, we can estimate the number of years it takes for the residual RPE area in the better eye to drop to 26.06 mm2 by using a mean RPE decline rate of 0.050 log(mm2)/year or 10.88% per year. As an extension of the previous example, for a baseline residual RPE area of 200 mm2, 100 mm2, 50 mm2, and 30 mm2, it will take approximately 17.7, 11.7, 5.7, and 1.2 years, respectively, until the residual visual field diameter drops to 20 degrees. Due to the limited longitudinal data on the visual field in the literature, a future longitudinal study with a large cohort of patients is needed to establish the natural history of the visual field in untreated eyes with CHM to facilitate better predictions of the residual visual field.
It is interesting to note that after the introduction of horizontal translation factors to correct for different entry times, the datasets from individual eyes in different studies were able to be realigned onto a linear line with excellent correlation (r2 = 0.997, Figure 8C). This suggests that patients affected by CHM may have a uniform chorioretinal atrophy progression after the onset of atrophy, despite different genetic variants in the CHM gene reported in primary studies.7, 12, 14, 15, 20 Some variations in RPE decline rates among individual may be caused by area measurement error and the irregular shapes of residual RPE area.7 This finding is consistent with previous reports that no apparent genotype-phenotype associations have been established for atrophic lesions in CHM to date.10, 11, 22 However, the present study demonstrates that the age of onset of measurable atrophy appears to vary widely across individual eyes (Figure 13 and Figure 16, available at http://www.ophthalmology-retina.org). The cause for this finding is currently unclear, but may be due to multiple contributors to atrophy development and progression, including genotypes,10, 11, 22 CHM/REP1 transcript expression,11 environmental factors,58 and nutrition59. To better understand the factors that may trigger chorioretinal atrophy in CHM, future studies are needed to investigate the relationship between the possible prognostic factors and the age of onset of atrophy.
Interestingly, the exponential decay of the residual RPE area in CHM corresponds well with a “one-hit” model of cell death in inherited neuronal degenerations proposed by Clarke et al.60 However, since the progressive loss of residual RPE area usually results from the expansion of multiple atrophic patches,6 it is unknown if the progression of an individual atrophic lesion still follows an exponential model. One alternative hypothesis is that the expansion of an individual lesion in CHM may follow a similar progression pattern as atrophy in AMD and Stargardt disease (i.e., the effective radius of a single lesion enlarges linearly over time);24–27 and the primary distinction among the 3 diseases is that in CHM, multiple atrophic lesions progress from the periphery to the center. If the unifying model is proven to be correct, it may dramatically improve our understanding of the underlying mechanism of RPE atrophy progression. Unfortunately, as a meta-analysis study, we do not have access to longitudinal FAF images of eyes with CHM, and we are unable to investigate the progression of individual lesions in CHM. We suggest future studies investigate the unifying RPE atrophy progression model by assessing the linear growth rate of the border of individual RPE atrophy in CHM across multiple time points.
Quality of the Evidence
This study constitutes a thorough literature search and extensive meta-analysis on the progression of atrophy in patients with CHM. We analyzed cross-sectional individual eye data (6 studies with 257 eyes), longitudinal individual eye data (5 studies with 229 visits from 68 eyes), and the aggregate data. All data showed consistent results regarding the decay pattern and decline rate of residual RPE size measured by FAF. The included studies have relatively high quality (Table 7, available at http://www.ophthalmology-retina.org) with no evidence of interstudy heterogeneity (I2 = 0%) or significant publication bias (Figure 5, available at http://www.ophthalmology-retina.org). Of note, the publication bias analysis is limited by the relatively small number of included studies (fewer than 10).45 Among the 4 confounding factors (age, duration of follow-up, study type, and diagnostic method) we assessed, we did not find any significant impact of the confounding factors on the decline rate of log RPE area. The sensitivity analysis revealed that no single study significantly affected the decline rate of log RPE area (0.041 to 0.053 log(mm2)/year after the removal of 1 study at a time).
Study Limitations
The present meta-analysis is not without its limitations. First, the amount of longitudinal data is relatively small. Despite exhaustive literature search and screening of 7 literature databases, we were only able to find 5 studies (229 visits from 68 eyes) that reported residual RPE area assessed by FAF in individual eyes over at least 2 visits. This is not surprising given the low prevalence of CHM (approximately 1:50000 individuals1–3), relatively low research attention and small number of longitudinal studies until recent promising results from gene therapy trials,2, 12–16 and limited use of imaging modality in studies to assess anatomic changes in eyes with CHM (most previous studies focused on BCVA). However, it is reassuring that the results from cross-sectional individual data (257 eyes), longitudinal individual data, and aggregate data were consistent; and the RPE decline appeared very uniform across different individual eyes from different studies (r2 = 0.997 after the optimal realignment of raw datasets; Figure 8C). Second, several confounding factors may have affected our analysis in the RPE decline pattern and rate. Although we have assessed the impact of 4 confounding factors (age, duration of follow-up, study type, and diagnostic method), other factors (e.g., number of residual RPE islands, shapes of residual RPE, genetics, environmental factors, demographic factors) may affect the degeneration of RPE and were not able to be assessed in the present study. Third, most eyes included in our meta-analysis had baseline residual RPE area between 0.3 and 80 mm2, and it is unclear if the RPE decline will follow the same model and rate for eyes with baseline RPE area outside this range. Fourth, most studies included in the meta-analysis only assessed RPE atrophy within the central 55°. However, eyes in the early stage of CHM may only have RPE atrophy in the periphery.6 Since the choroidal anatomy and photoreceptor composition differ substantially in the retinal periphery than in the posterior pole, it is currently unknown if the progression of RPE atrophy would still follow the AEM at a similar rate beyond 55°. Future studies utilizing ultra-wide field imaging are needed to investigate the RPE progression in the retinal periphery, which can be important for future clinical trials to include young patients with early stages of CHM. Finally, some patients included in the meta-analysis were clinically diagnosed of CHM without genetic confirmations in the primary studies. Although the clinical diagnosis of CHM is often obvious, some cases are more difficult to distinguish from other inherited retinal degenerations (e.g., X-linked retinitis pigmentosa). Thus, the lack of consistent molecular confirmation may confound our results. Also, the relatively small number of patients with genotype data limits our ability to investigate any potential genotype-specific variations in the progression rate of RPE atrophy.
Conclusions
This meta-analysis of individual-level data demonstrated that the loss of residual RPE area in eyes affected by CHM follows a 1-stage exponential decay over approximately 60 years. The RPE decline was steady and uniform across different individual eyes. The decline rate of log RPE area (0.050 log(mm2)/year; 95%CI, 0.046-0.055 log(mm2)/year) was independent of baseline RPE area and ages. Future clinical trials can use the log-transformed residual RPE area measured by FAF as an anatomic endpoint to monitor the progression of CHM.
Supplementary Material
Acknowledgments
The authors would like to thank Dr. Mark E. Pennesi (Casey Eye Institute, Oregon Health & Science University, Portland, OR), Dr. Immanuel P. Seitz (University Eye Hospital, University of Tübingen, Tübingen, Germany), and Dr. M. Dominik Fischer (University Eye Hospital, University of Tübingen, Tübingen, Germany) for agreeing to share us the data of their study. We also thank Mary Hughes, and Vermetha Polite (Cushing/Whitney Medical Library, Yale University, New Haven, CT) for technical support and Alyssa Grimshaw (Cushing/Whitney Medical Library, Yale University, New Haven, CT) for peer review of the search strategies. Research reported in this publication was supported by the National Institute on Aging of the National Institutes of Health under Award Number T35AG049685. The content is solely the responsibility of the authors and does not necessarily represent the official views of the National Institutes of Health.
Financial Support: Research reported in this publication was supported by the National Institute on Aging of the National Institutes of Health under Award Number T35AG049685 (Recipient: Shen). The sponsor or funding organization had no role in the design or conduct of this research.
Abbreviations and Acronyms
- AEM
area exponential model
- ALM
area linear model
- AMD
age-related macular degeneration
- BCVA
best-corrected visual acuity
- CHM
choroideremia
- CI
confidence interval
- FAF
fundus autofluorescence
- PRISMA-IPD
Preferred Reporting Items for a Systematic Review and Meta-analysis of Individual Participant Data statement
- QUIPS
Quality In Prognosis Studies
- REP1
Rab escort protein-1
- RLM
radius linear model
- RPE
retinal pigment epithelium
- SD
standard deviation
- SE
standard error
Footnotes
Meeting Presentation: None
Conflict of Interest: L. L. Shen, None; M. Sun, None; H. K. Grossetta Nardini, None; L. V. Del Priore, Astellas Institute for Regenerative Medicine (Consultant).
References
- 1.Sankila EM, Tolvanen R, van den Hurk JA, et al. Aberrant splicing of the CHM gene is a significant cause of choroideremia. Nat Genet 1992;1(2):109–13. [DOI] [PubMed] [Google Scholar]
- 2.MacLaren RE, Groppe M, Barnard AR, et al. Retinal gene therapy in patients with choroideremia: initial findings from a phase 1/2 clinical trial. Lancet 2014;383(9923):1129–37. [DOI] [PMC free article] [PubMed] [Google Scholar]
- 3.Aleman TS, Han G, Serrano LW, et al. Natural history of the central structural abnormalities in choroideremia: a prospective cross-sectional study. Ophthalmology 2017;124(3):359–73. [DOI] [PMC free article] [PubMed] [Google Scholar]
- 4.Cremers FP, van de Pol DJ, van Kerkhoff LP, et al. Cloning of a gene that is rearranged in patients with choroideraemia. Nature 1990;347(6294):674. [DOI] [PubMed] [Google Scholar]
- 5.Seabra MC, Brown MS, Goldstein JL. Retinal degeneration in choroideremia: deficiency of rab geranylgeranyl transferase. Science 1993;259(5093):377–81. [DOI] [PubMed] [Google Scholar]
- 6.Khan KN, Islam F, Moore AT, Michaelides M. Clinical and genetic features of choroideremia in childhood. Ophthalmology 2016;123(10):2158–65. [DOI] [PubMed] [Google Scholar]
- 7.Aylward JW, Xue K, Patricio MI, et al. Retinal degeneration in choroideremia follows an exponential decay function. Ophthalmology 2018;125(7):1122–4. [DOI] [PubMed] [Google Scholar]
- 8.Jolly JK, Xue K, Edwards TL, et al. Characterizing the natural history of visual function in choroideremia using microperimetry and multimodal retinal imaging. Invest Ophthalmol Vis Sci 2017;58(12):5575–83. [DOI] [PMC free article] [PubMed] [Google Scholar]
- 9.Heon E, Alabduljalil T, McGuigan ID, et al. Visual function and central retinal structure in choroideremia. Invest Ophthalmol Vis Sci 2016;57(9):OCT377–87. [DOI] [PubMed] [Google Scholar]
- 10.Freund PR, Sergeev YV, MacDonald IM. Analysis of a large choroideremia dataset does not suggest a preference for inclusion of certain genotypes in future trials of gene therapy. Mol Genet Genomic Med 2016;4(3):344–58. [DOI] [PMC free article] [PubMed] [Google Scholar]
- 11.Di Iorio V, Esposito G, De Falco F, et al. CHM/REP1 transcript expression and loss of visual function in patients affected by choroideremia. Invest Ophthalmol Vis Sci 2019;60(5):1547–55. [DOI] [PubMed] [Google Scholar]
- 12.Fischer MD, Ochakovski GA, Beier B, et al. Changes in retinal sensitivity after gene therapy in choroideremia. Retina 2018. [DOI] [PubMed] [Google Scholar]
- 13.Lam BL, Davis JL, Gregori NZ, et al. Choroideremia gene therapy phase 2 clinical trial: 24-month results. Am J Ophthalmol 2019;197:65–73. [DOI] [PubMed] [Google Scholar]
- 14.Xue K, Jolly JK, Barnard AR, et al. Beneficial effects on vision in patients undergoing retinal gene therapy for choroideremia. Nat Med 2018;24(10):1507–12. [DOI] [PMC free article] [PubMed] [Google Scholar]
- 15.Dimopoulos IS, Hoang SC, Radziwon A, et al. Two-year results after aav2-mediated gene therapy for choroideremia: the alberta experience. Am J Ophthalmol 2018;193:130–42. [DOI] [PubMed] [Google Scholar]
- 16.Fischer MD, Ochakovski GA, Beier B, et al. Efficacy and safety of retinal gene therapy using adeno-associated virus vector for patients with choroideremia: a randomized clinical trial. JAMA ophthalmology 2019. [DOI] [PMC free article] [PubMed] [Google Scholar]
- 17.Roberts MF, Fishman GA, Roberts DK, et al. Retrospective, longitudinal, and cross sectional study of visual acuity impairment in choroideraemia. Br J Ophthalmol 2002;86(6):658–62. [DOI] [PMC free article] [PubMed] [Google Scholar]
- 18.Abbouda A, Lim WS, Sprogyte L, et al. Quantitative and qualitative features of spectral-domain optical coherence tomography provide prognostic indicators for visual acuity in patients with choroideremia. Ophthalmic Surg Lasers Imaging Retina 2017;48(9):711–6. [DOI] [PubMed] [Google Scholar]
- 19.Jolly JK, Edwards TL, Moules J, et al. A qualitative and quantitative assessment of fundus autofluorescence patterns in patients with choroideremia. Invest Ophthalmol Vis Sci 2016;57(10):4498–503. [DOI] [PMC free article] [PubMed] [Google Scholar]
- 20.Seitz IP, Zhour A, Kohl S, et al. Multimodal assessment of choroideremia patients defines pre-treatment characteristics. Graefes Arch Clin Exp Ophthalmol 2015;253(12):2143–50. [DOI] [PubMed] [Google Scholar]
- 21.Dimopoulos IS, Freund PR, Knowles JA, MacDonald IM. The natural history of full-field stimulus threshold decline in choroideremia. Retina 2018;38(9):1731–42. [DOI] [PubMed] [Google Scholar]
- 22.Simunovic MP, Jolly JK, Xue K, et al. The spectrum of CHM gene mutations in choroideremia and their relationship to clinical phenotype. Invest Ophthalmol Vis Sci 2016;57(14):6033–9. [DOI] [PMC free article] [PubMed] [Google Scholar]
- 23.Dysli C, Wolf S, Tran HV, Zinkernagel MS. Autofluorescence lifetimes in patients with choroideremia identify photoreceptors in areas with retinal pigment epithelium atrophy. Invest Ophthalmol Vis Sci 2016;57(15):6714–21. [DOI] [PubMed] [Google Scholar]
- 24.Shen LL, Sun M, Grossetta Nardini HK, Del Priore LV. Natural history of autosomal recessive Stargardt disease in untreated eyes: a systematic review and meta-analysis of study- and individual-level data. Ophthalmology 2019;126(9):1288–96. [DOI] [PubMed] [Google Scholar]
- 25.Shen L, Liu F, Grossetta Nardini H, Del Priore LV. Natural history of geographic atrophy in untreated eyes with nonexudative age-related macular degeneration: a systematic review and meta-analysis. Ophthalmology Retina 2018;2(9):914–21. [DOI] [PubMed] [Google Scholar]
- 26.Yehoshua Z, Rosenfeld PJ, Gregori G, et al. Progression of geographic atrophy in age-related macular degeneration imaged with spectral domain optical coherence tomography. Ophthalmology 2011;118(4):679–86. [DOI] [PMC free article] [PubMed] [Google Scholar]
- 27.Feuer WJ, Yehoshua Z, Gregori G, et al. Square root transformation of geographic atrophy area measurements to eliminate dependence of growth rates on baseline lesion measurements: a reanalysis of age-related eye disease study report no. 26. JAMA Ophthalmology 2013;131(1):110–1. [DOI] [PMC free article] [PubMed] [Google Scholar]
- 28.Stewart LA, Clarke M, Rovers M, et al. Preferred reporting items for a systematic review and meta-analysis of individual participant data: the PRISMA-IPD statement. JAMA 2015;313(16):1657–65. [DOI] [PubMed] [Google Scholar]
- 29.Tummers B DataThief III. 2006. [Google Scholar]
- 30.Flower A, McKenna JW, Upreti G. Validity and reliability of GraphClick and DataThief III for data extraction. Behav Modif 2016;40(3):396–413. [DOI] [PubMed] [Google Scholar]
- 31.Hayden JA, van der Windt DA, Cartwright JL, et al. Assessing bias in studies of prognostic factors. Ann Intern Med 2013;158(4):280–6. [DOI] [PubMed] [Google Scholar]
- 32.Egger M, Smith GD, Schneider M, Minder C. Bias in meta-analysis detected by a simple, graphical test. BMJ 1997;315(7109):629–34. [DOI] [PMC free article] [PubMed] [Google Scholar]
- 33.Liu TYA, Shah AR, Del Priore LV. Progression of lesion size in untreated eyes with exudative age-related macular degeneration: a meta-analysis using Lineweaver-Burk plots. JAMA Ophthalmol 2013;131(3):335–40. [DOI] [PubMed] [Google Scholar]
- 34.Shah AR, Del Priore LV. Progressive visual loss in subfoveal exudation in age-related macular degeneration: a meta-analysis using Lineweaver-Burke plots. Am J Ophthalmol 2007;143(1):83–9. [DOI] [PubMed] [Google Scholar]
- 35.Shen LL, Liu F, Nardini HG, Del Priore LV. Reclassification of fundus autofluorescence patterns surrounding geographic atrophy based on progression rate: a systematic review and meta-analysis. Retina 2019;39(10):1829–39. [DOI] [PubMed] [Google Scholar]
- 36.Shen LL, Liu F, Grossetta Nardini HK, Del Priore LV. Fellow eye status is a biomarker for the progression rate of geographic atrophy: a systematic review and meta-analysis. Ophthalmology Retina 2019;3(4):305–15. [DOI] [PubMed] [Google Scholar]
- 37.Shen LL, Sun M, Khetpal S, et al. Topographic variation of the growth rate of geographic atrophy in nonexudative age-related macular degeneration: a systematic review and meta-analysis. Invest Ophthalmol Vis Sci 2020;61(1):2-. [DOI] [PMC free article] [PubMed] [Google Scholar]
- 38.Shah AR, Del Priore LV. Natural history of predominantly classic, minimally classic, and occult subgroups in exudative age-related macular degeneration. Ophthalmology 2009;116(10):1901–7. [DOI] [PubMed] [Google Scholar]
- 39.Shen LL, Sun M, Grossetta Nardini HK, Del Priore LV. Natural history of unifocal and multifocal geographic atrophy in untreated eyes with nonexudative age-related macular degeneration: a systematic review and meta-analysis. Manuscript submitted for publication. [DOI] [PubMed] [Google Scholar]
- 40.Rosenfeld PJ, Dugel PU, Holz FG, et al. Emixustat hydrochloride for geographic atrophy secondary to age-related macular degeneration: a randomized clinical trial. Ophthalmology 2018;125(10):1556–67. [DOI] [PubMed] [Google Scholar]
- 41.Drasdo N, Fowler CW. Non-linear projection of the retinal image in a wide-angle schematic eye. Br J Ophthalmol 1974;58(8):709–14. [DOI] [PMC free article] [PubMed] [Google Scholar]
- 42.Burke DL, Ensor J, Riley RD. Meta-analysis using individual participant data: one-stage and two-stage approaches, and why they may differ. Stat Med 2017;36(5):855–75. [DOI] [PMC free article] [PubMed] [Google Scholar]
- 43.Bates D, Mächler M, Bolker B, Walker S. Fitting linear mixed-effects models using lme4. arXiv preprint arXiv:14065823 2014. [Google Scholar]
- 44.Viechtbauer W Conducting meta-analyses in R with the metafor package. Journal of statistical software 2010;36(3):1–48. [Google Scholar]
- 45.Green S, Higgins J. Cochrane handbook for systematic reviews of interventions version 5.1.0 [updated March 2011]. The Cochrane Collaboration 2011. [Google Scholar]
- 46.Jain N, Jia Y, Gao SS, et al. Optical coherence tomography angiography in choroideremia: correlating choriocapillaris loss with overlying degeneration. JAMA Ophthalmol 2016;134(6):697–702. [DOI] [PMC free article] [PubMed] [Google Scholar]
- 47.Sadda SR, Chakravarthy U, Birch DG, et al. Clinical endpoints for the study of geographic atrophy secondary to age-related macular degeneration. Retina 2016;36(10):1806–22. [DOI] [PMC free article] [PubMed] [Google Scholar]
- 48.Fleckenstein M, Mitchell P, Freund KB, et al. The progression of geographic atrophy secondary to age-related macular degeneration. Ophthalmology 2018;125(3):369–90. [DOI] [PubMed] [Google Scholar]
- 49.Strauss RW, Kong X, Ho A, et al. Progression of Stargardt disease as determined by fundus autofluorescence over a 12-month period: ProgStar report No. 11. JAMA Ophthalmol 2019. [DOI] [PMC free article] [PubMed] [Google Scholar]
- 50.Domalpally A, Danis RP, White J, et al. Circularity index as a risk factor for progression of geographic atrophy. Ophthalmology 2013;120(12):2666–71. [DOI] [PubMed] [Google Scholar]
- 51.Bax NM, Valkenburg D, Lambertus S, et al. Foveal Sparing in Central Retinal Dystrophies. Invest Ophthalmol Vis Sci 2019;60(10):3456–67. [DOI] [PubMed] [Google Scholar]
- 52.Mitsios A, Dubis AM, Moosajee M. Choroideremia: from genetic and clinical phenotyping to gene therapy and future treatments. Therapeutic advances in ophthalmology 2018;10:2515841418817490-. [DOI] [PMC free article] [PubMed] [Google Scholar]
- 53.Tuten WS, Vergilio GK, Young GJ, et al. Visual function at the atrophic border in choroideremia assessed with adaptive optics microperimetry. 2019;08:08. [DOI] [PMC free article] [PubMed] [Google Scholar]
- 54.Dimopoulos IS, Radziwon A, St Laurent CD, MacDonald IM. Choroideremia. Curr Opin Ophthalmol 2017;28(5):410–5. [DOI] [PubMed] [Google Scholar]
- 55.Administration SS. Disability evaluation under social security. SSA pub 2002(64–039). [Google Scholar]
- 56.Belkin M, Kalter-Leibovici O, Chetrit A, Skaat A. Time trends in the incidence and causes of blindness in Israel. Am J Ophthalmol 2013;155(2):404. [DOI] [PubMed] [Google Scholar]
- 57.Munier A, Gunning T, Kenny D, O’Keefe M. Causes of blindness in the adult population of the Republic of Ireland. Br J Ophthalmol 1998;82(6):630–3. [DOI] [PMC free article] [PubMed] [Google Scholar]
- 58.Glickman RD. Ultraviolet phototoxicity to the retina. Eye Contact Lens 2011;37(4):196–205. [DOI] [PubMed] [Google Scholar]
- 59.Duncan JL, Aleman TS, Gardner LM, et al. Macular pigment and lutein supplementation in choroideremia. Exp Eye Res 2002;74(3):371–81. [DOI] [PubMed] [Google Scholar]
- 60.Clarke G, Collins RA, Leavitt BR, et al. A one-hit model of cell death in inherited neuronal degenerations. Nature 2000;406(6792):195–9. [DOI] [PubMed] [Google Scholar]
Associated Data
This section collects any data citations, data availability statements, or supplementary materials included in this article.


