

SUMMARY
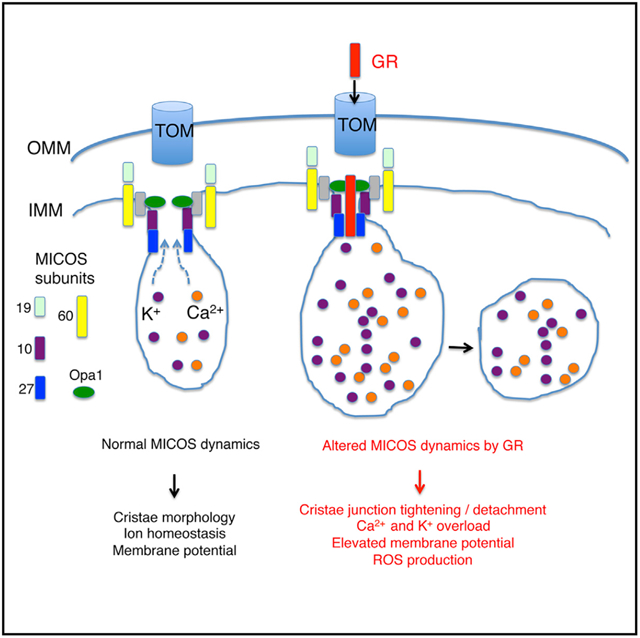
Amyotrophic lateral sclerosis (ALS) manifests pathological changes in motor neurons and various other cell types. Compared to motor neurons, the contribution of the other cell types to the ALS phenotypes is under-studied. G4C2 repeat expansion in C9ORF72 is the most common genetic cause of ALS along with frontotemporal dementia (C9-ALS/FTD), with increasing evidence supporting repeat-encoded poly(GR) in disease pathogenesis. Here, we show in Drosophila muscle that poly(GR) enters mitochondria and interacts with components of the Mitochondrial Contact Site and Cristae Organizing System (MICOS), altering MICOS dynamics and intra-subunit interactions. This impairs mitochondrial inner membrane structure, ion homeostasis, mitochondrial metabolism, and muscle integrity. Similar mitochondrial defects are observed in patient fibroblasts. Genetic manipulation of MICOS components or pharmacological restoration of ion homeostasis with nigericin effectively rescue the mitochondrial pathology and disease phenotypes in both systems. These results implicate MICOS-regulated ion homeostasis in C9-ALS pathogenesis and suggest potential new therapeutic strategies.
Graphical Abstract
In Brief
G4C2 repeat expansion in C9ORF72 is the most common genetic cause of ALS. Repeat-encoded poly(GR) is believed to contribute to disease, albeit with not fully defined mechanisms. Li et al. show that poly(GR) targets the MICOS complex, causing mitochondrial toxicity. Manipulating MICOS is beneficial in animal models and patient cells.
INTRODUCTION
Amyotrophic lateral sclerosis (ALS) is characterized primarily by the progressive degeneration of upper motor neurons (UMNs) in the motor cortex and lower motor neurons (LMNs) in the brain-stem and spinal cord (Brown and Al-Chalabi, 2017), with possible LMN to UMN spread (Chou and Norris, 1993). The earliest pathophysiological events initiating the disease remain to be elucidated, although accumulating evidence suggests that pathological changes can occur distally at the neuromuscular junction (NMJ) in advance of MN loss and onset of clinical symptoms (Moloney et al., 2014). Traditionally considered a MN disease, ALS is emerging as a “multisystem” disease with pathological changes in various cell types, including peripheral immune cells, neurons, microglia, astrocytes, and muscle cells (Pansarasa et al., 2014; Loeffler et al., 2016). Skeletal muscle defects are common and occur early in ALS (Pansarasa et al., 2014; Loeffler et al., 2016). In the copper-zinc superoxide dismutase (SOD1)-G93A mouse model of ALS, for example, muscle dysfunction represents one of the earliest pathological events, preceding MN death (Dobrowolny et al., 2008), and the muscle-specific expression of SOD1-G93A can lead to MN death (Wong and Martin, 2010). One possible mechanism of muscle contribution to MN health in ALS is NMJ stability; defects in the NMJ can cause MN denervation and death in a dying-back manner (Moloney et al., 2014). In C9-ALS patients (Jokela et al., 2016), BAC transgenic mice (Liu et al., 2016), and patient induced pluripotent stem cell (iPSC)-derived muscle fibers (Lynch et al., 2019), muscle cell pathology is observed, underlining the relevance of muscle to the pathogenesis of this most common form of ALS. However, the nature of muscular defects in ALS, its pathogenic mechanism, and its contribution to the broad spectrum of disease phenotypes are not well understood.
Expansion of G4C2 repeats in C9ORF72 accounts for ~40% of familial and 5%–10% of sporadic ALS cases, with repeat numbers ranging from a few dozen to thousands (DeJesus-Hernandez et al., 2011; Renton et al., 2011). A number of mechanisms of disease pathogenesis by G4C2 repeat expansion have been proposed, including haplo-insufficiency of C9ORF72, toxicity associated with RNA foci formed by sense and anti-sense RNAs, or proteotoxicity induced by dipeptide repeat (DPR) proteins translated from G4C2 repeat-carrying transcripts (Taylor et al., 2016; Gendron and Petrucelli, 2018). Increasing evidence emphasizes the contribution of DPR toxicity in C9-ALS/frontotemporal dementia (FTD), especially arginine-containing DPR proteins (GR and PR), with diverse processes ranging from nucleolar function and nucleocytoplasmic transport to RNA granule dynamics, mRNA splicing and translation, and the DNA repair pathway having been implicated (Taylor et al., 2016; Gendron and Petrucelli, 2018; Yuva-Aydemir et al., 2018). The relative contribution of the various mechanisms to the onset and progression of this multisystem disease, however, remains uncertain. Drosophila has been an excellent model organism for investigating pathogenic mechanisms of human neurological disorders (Jaiswal et al., 2012), and a large body of work has been done on C9-ALS/FTD-related models in Drosophila (Xu et al., 2013; Mizielinska et al., 2014; Freibaum et al., 2015; Yang et al., 2015; Zhang et al., 2015; Lee et al., 2016; Simone et al., 2018; Xu and Xu, 2018; Berson et al., 2019; He et al., 2019; Lopez-Gonzalez et al., 2019; Moens et al., 2019). Almost all of these studies are focused on neuronal settings. Thus, whether disease gene products associated with C9-ALS/FTD affect muscle cells to cause the ALS aspects of the C9-ALS/FTD spectrum of phenotypes, and if so, the cellular mechanisms involved, remains unclear.
RESULTS
Muscle Mitochondrial Defects Caused by Poly(GR) Expression in Flies
We used Drosophila as a model to assess the effect of GR in muscle. Available poly(GR) transgenic lines (Mizielinska et al., 2014; Yang et al., 2015) were specifically expressed in fly muscle using the UAS-Gal4 system. To discern the effect of repeat length on toxicity, transgenes expressing GR36, GR80, and GR100 were used. The GR80 protein has a FLAG tag at the N termini to aid protein detection (Yang et al., 2015). A G4C2–36 transgene potentially expressing all types of DPRs and a 36RO transgene expressing G4C2–36 repeat RNA only (Mizielinska et al., 2014) was also included. The development, morphology, behavior, or survival appeared normal in newly enclosed flies of all genotypes. Around 1 week after eclosion, however, ~50% of the GR100 and GR80 transgenic flies started to exhibit held-up or droopy wing postures. After 2–3 weeks, virtually 100% of the flies showed abnormal wing posture and were flightless (Figures 1A, S1A, and S1B). GR36 and G4C2–36 transgenic flies exhibited a later onset and less penetrant wing posture phenotype than GR100 and GR80 flies, whereas 36RO flies were phenotypically normal (Figures S1A and S1B). Quantification of GR expression in the various lines (Figure S1C) indicated that GR100 was expressed at a slightly lower level than GR80. However, GR36 expression level was higher than GR100, although its phenotype was weaker. Thus, GR repeat length correlates with toxicity. In subsequent studies, we focused on analyzing GR80 flies, because this is the only GR line with a FLAG tag at the N terminus that facilitates later biochemical and cell biological studies of GR protein, and we have length-matched and FLAG-tagged GA80 and PR80 as controls, which did not show obvious wing phenotype (Figure S1A).
Figure 1. Mitochondrial Defects in GR80 Transgenic Fly Muscle.
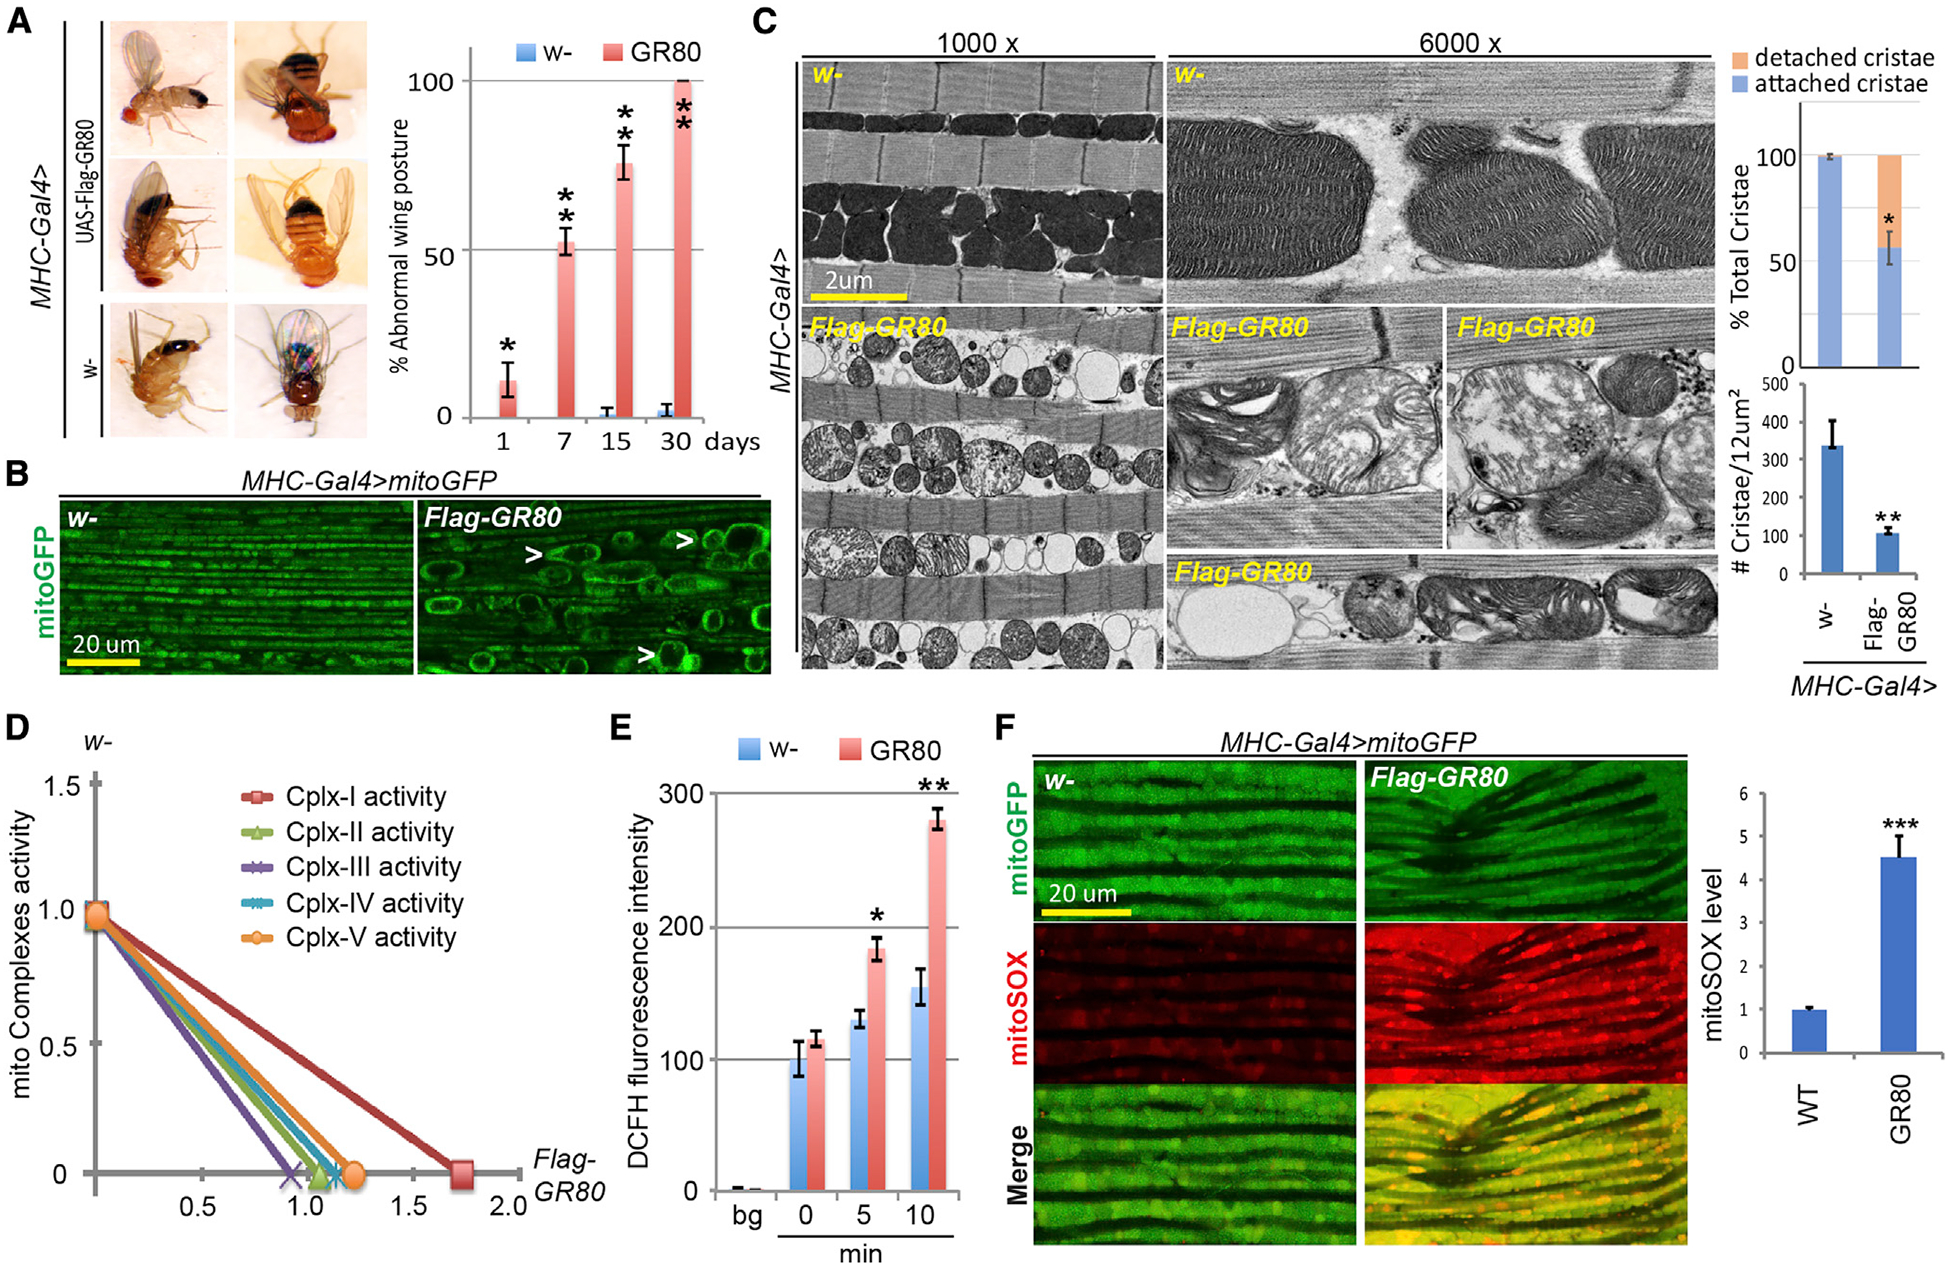
(A) Images showing abnormal wing posture phenotypes in Mhc-Gal4>GR80 flies. The bar graph shows age-dependent progression of the wing posture phenotype (n = 90 flies, 3 biological repeats). The error bars signify standard deviation (SD) in this and all of the other figures.
(B) Monitoring of mitochondrial morphology in thoracic flight muscle of Mhc-Gal4>GR80 flies expressing a mito-GFP reporter. The images are representative of 3 independent samples.
(C) TEM images of IFM mitochondria of control (Mhc-Gal4/w-) and Mhc-Gal4>GR80 flies at lower (1,000×) and higher (6,000×) magnifications. The graphs show quantification (n = 5 sections from 3 independent samples).
(D) Mitochondrial respiratory chain activities in GR80 compared to control (Mhc-Gal4/w-) flies. The data represent 1-time experiment.
(E) Quantification of ROS levels measured with DCFH fluorescence in GR80 fly muscle (n = 3).
(F) Mito-SOX staining of mitochondrial ROS levels in control and GR80 flies expressing mito-GFP. The graph shows quantification (n = 3).
*p < 0.05 and **p < 0.01, 1-way ANOVA test followed by Student-Newman-Keuls (SNK) test plus Bonferroni correction. See also Figure S1.
The wing posture phenotype in the various fly lines correlated with indirect flight muscle (IFM) integrity (Figure S1D), which is often associated with mitochondrial health. We examined mitochondrial morphology in GR80 fly IFM using a matrix-targeted mito-GFP reporter. Compared to the controls, GR80 fly muscle contained swollen mitochondria when analyzed at 2–3 weeks of age (Figure 1B). Many mitochondria were round and had areas of matrix devoid of mito-GFP. Transmission electron microscopy (TEM) revealed swollen mitochondria, as well as small and round mitochondria devoid of electron-dense matrix material in GR80 flies (Figure 1C). Closer examination further revealed aberrant cristae structure. Compared to control muscle mitochondria abundant in lamellar cristae, each connected to the inner mitochondrial membrane (IMM) via cristae junctions (CJs), many mitochondria in GR80 flies were devoid of CJs, forming concentric cristae stacks inside the matrix or short tubular cristae detached from IMM, indicating that GR80 damages CJ structures. Similar mitochondrial defects were seen in GR100 flies (Figures S1E and S1F). No obvious mitochondria defect was observed in length-matched GA100, PA100, or PR100 fly muscle (Figures S1E and S1F) or GA80 and PR80 fly muscle (Figure S1G), despite similar levels of expression of FLAG-tagged GA80, PR80, and GR80 (Figure S1H).
We next analyzed mitochondrial function in GR80 fly muscle. There was increased ATP production in GR80 and GR100 flies (Figures S1I and S1J). This suggests that ATP production by oxidative phosphorylation (OxPhos), a key function of mitochondria, was not compromised in GR80 flies, or that it was compensated for by other means. We also found that complex I activity was elevated, whereas complex II–V were largely unaltered in GR80 flies (Figure 1D). Elevated complex I activity may account for the increased ATP level. As complex I is the major site of reactive oxygen species (ROS) production, we tested whether the redox state is altered in GR80 flies. Using the ROS dyes DCFH (Figure 1E) and MitoSOX (Figure 1F), we detected elevated ROS in GR80 fly IFM. GR80 thus causes structural and functional changes in muscle mitochondria.
Mitochondrial Localization of Poly(GR)
Our observation of mitochondrial changes in GR80 flies raised the possibility that GR80 may associate with mitochondria. Using confocal microscopy, we could detect the cytosolic localization of GR80, with some colocalizing with mitochondria in fly muscle (Figure 2A) and mammalian cells (Figure 2B). Using immunoelectron microscopy (immuno-EM), we confirmed GR80 mitochondrial localization (Figure 2C). To further confirm this, and to determine the specific compartment of GR80 localization, we purified mitochondria from GR80 fly muscle and prepared mitochondrial subfractions. Western blot analysis indicated the robust expression of GR80 in fly muscle (Figure S2A). The majority of mitochondrial GR80 was localized to the IMM in a pattern similar to the intermembrane space (IMS)/IMM marker Opa1 (Figure 2D). GR80 was sensitive to proteinase K treatment of mitoplasts but not intact mitochondria preparations, suggesting that it is facing the IMS (Figure S2B). The enriched mitochondrial localization was rather specific for GR80, as neither GA80 nor PR80 exhibited obvious mitochondrial localization (Figures S2C and S2D).
Figure 2. Mitochondrial Localization and Opa1 Interaction of GR80.
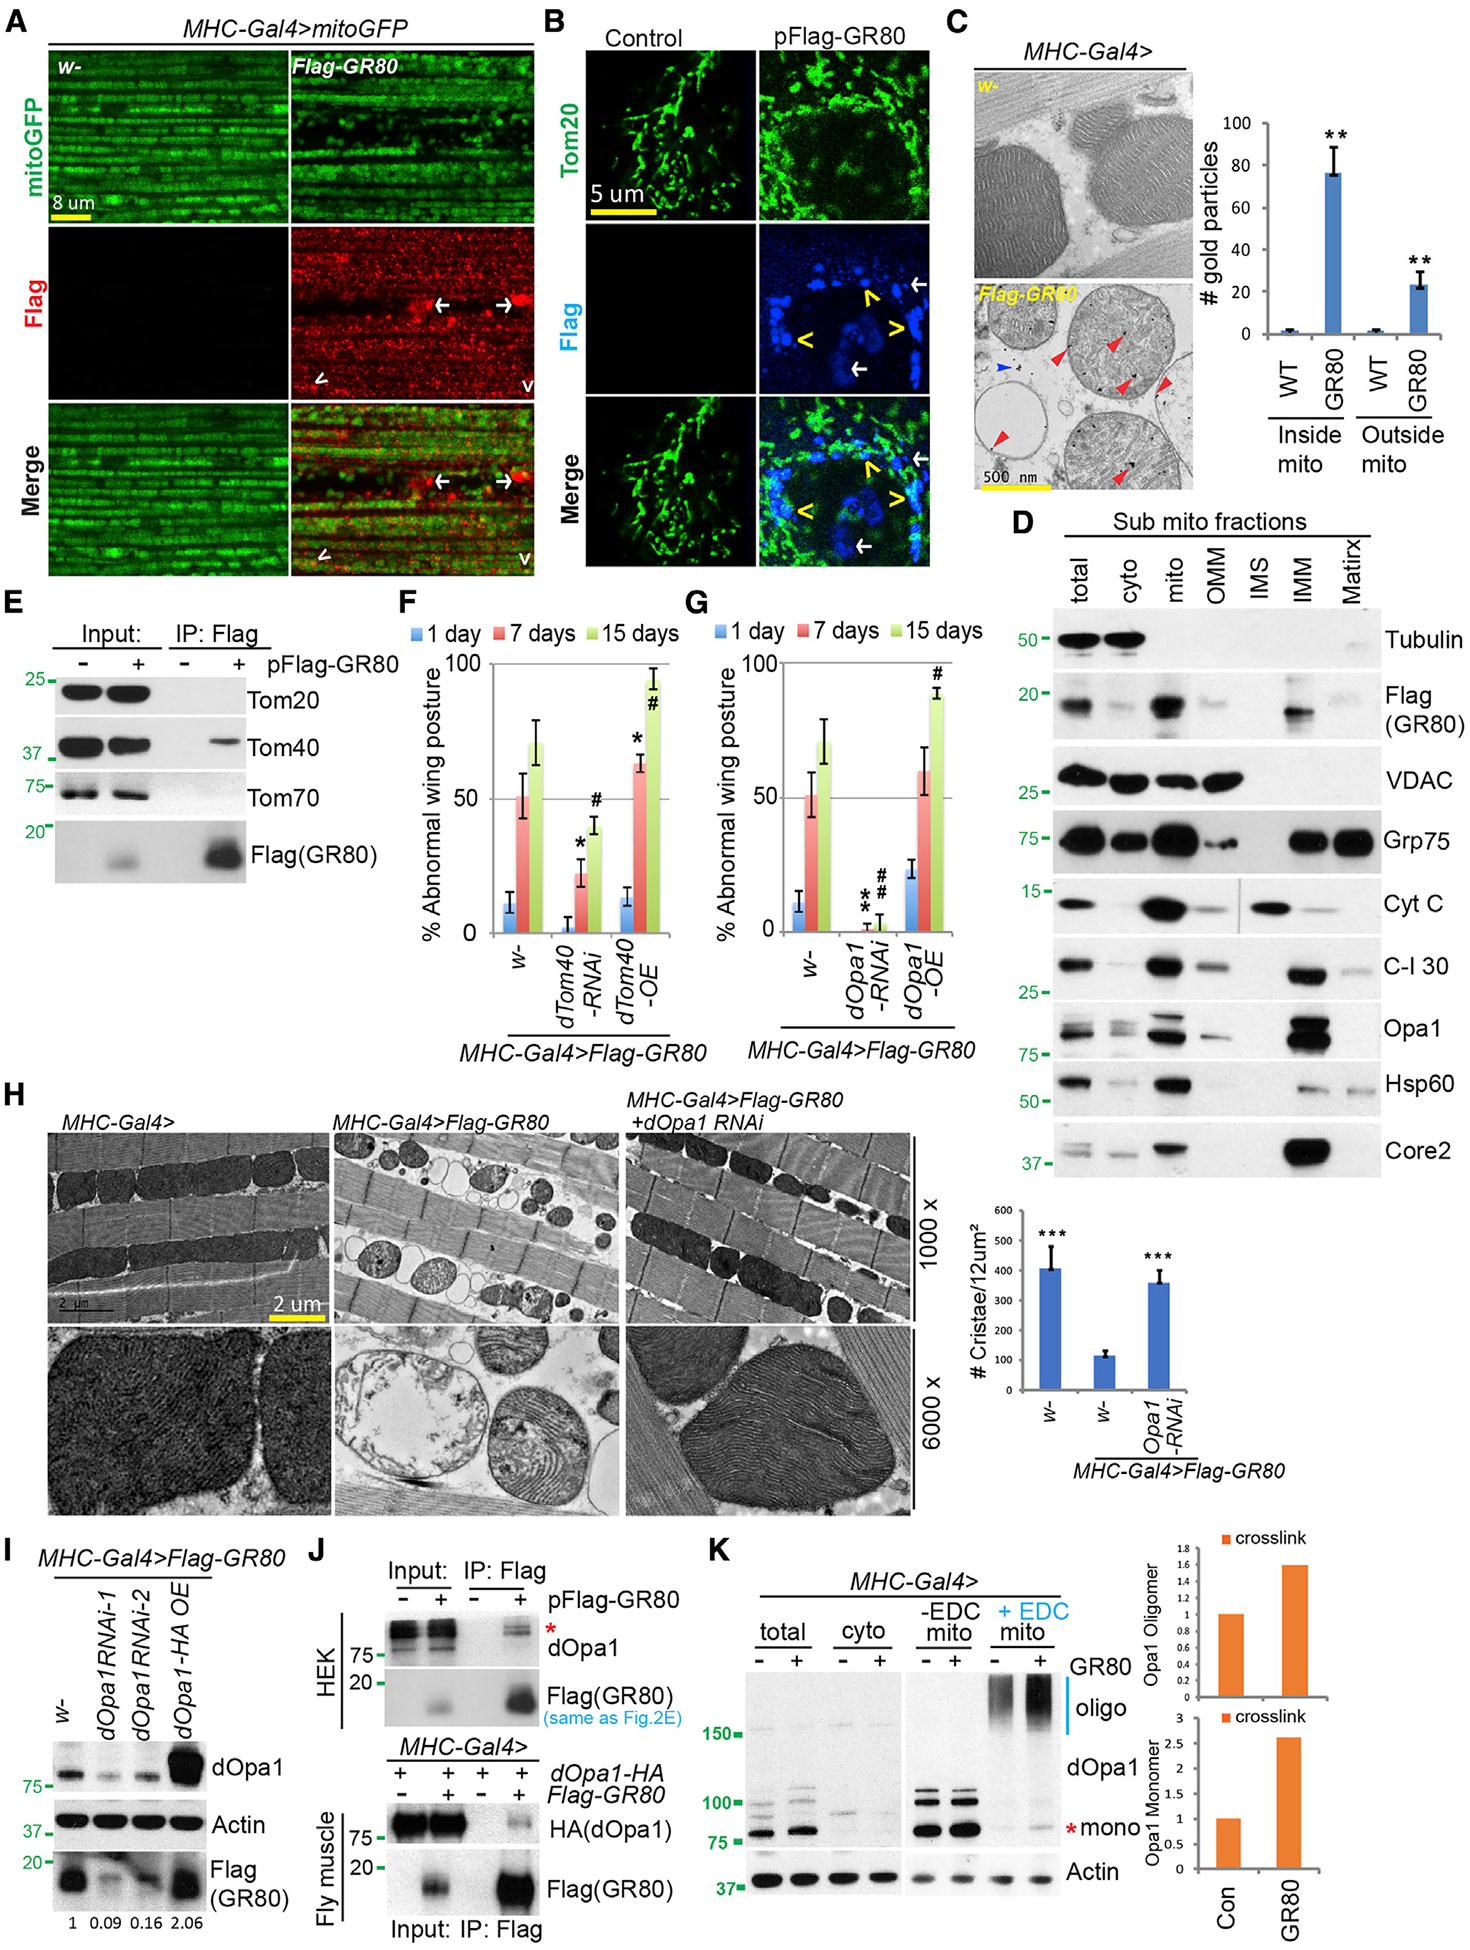
(A and B) Immunostaining showing mitochondrial localization of FLAG-GR80 in transgenic fly muscle (A) or transfected HeLa cells (B). Mito-GFP (A) or Tom20 staining (B) marks the mitochondria. Arrowhead: mitochondrial localization; arrow: non-mitochondrial localization. The images are representative of 3 independent samples.
(C) Immuno-EM analysis showing mitochondrial localization of FLAG-GR80 in fly muscle. Red and blue arrows mark the signals inside and outside the mitochondria, respectively. The graph shows quantification (n = 4, 3 biological repeats).
(D) Immunoblots of sub-mitochondrial fractions, with various mitochondrial marker proteins showing localization pattern of FLAG-GR80.
(E) CoIP assays using FLAG-GR80-transfected HEK293T cells to show specific GR80-Tom40 interaction.
(F) Bar graph showing quantification of the effect of Tom40 RNAi or overexpression (OE) on the wing posture in GR80 flies (n = 90 flies, 3 biological repeats).
(G) Bar graph showing quantification of the effect of Opa1 RNAi or OE on GR80 induced wing posture defect (n = 90 flies, 3 biological repeats).
(H) TEM images showing effect of Opa1 RNAi on GR80-induced mitochondrial morphology defect in fly thoracic muscle. The graph shows quantification (n = 5 sections, 3 biological repeats).
(I) Immunoblots showing effect of Opa1 RNAi or OE on GR80 protein level in GR80 fly muscle.
(J) CoIP assay showing GR80-Opa1 interaction in HEK293T cells (top) and fly muscle (bottom).
(K) Immunoblots showing effect of GR80 on Opa1 oligomer formation in fly thoracic muscle. 1-Ethyl-3- (3-dimethylaminopropyl)-carbodiimide (EDC) was used to cross-link Opa1. The positions of Opa1 monomer (mono) and oligomers (oligo) are indicated. The graph shows quantification (n = 2).
*p < 0.05, #p < 0.05, **p < 0.01, and ##p < 0.01, 1-way ANOVA test followed by SNK test plus Bonferroni correction. The immunoblots are representative of at least 2 independent repeats. See also Figure S2.
For GR80 to reach IMS/IMM, it most likely has to go through the translocase of the outer membrane/inner membrane (TOM/TIM) import complex, and interact with Tom40, a key component of the TOM complex forming the import channel. GR80 interacted with Tom40, but not Tom20 or Tom70, in co-immuno-precipitation (coIP) assays (Figure 2E). Functionally, Tom40 overexpression (OE) increased the GR80 protein level and enhanced the GR80-induced wing posture phenotype, whereas partial Tom40 knockdown by RNAi had opposite effects (Figures 2F, S2E, and S2F).
Opa1 Mediates the Effects of Poly(GR) on CJ
We next investigated how GR80 instigates mitochondrial toxicity. By binding to Tom40, GR80 may clog the TOM/TIM channel, thereby impairing mitochondrial import globally. Inconsistent with this idea was our observation that the import of mito-GFP was not significantly affected by GR80. Given the IMS/IMM localization of GR80 and its profound effects on CJ structure, we tested whether GR80 may alter IMS/IMM structures related to CJ formation. Using immuno-EM, we observed GR80 localization to CJ (Figure S2G). Tuning down the expression of Opa1, a key determinant of CJ remodeling (Frezza et al., 2006), completely suppressed GR80 effect on wing posture and cristae morphology, which was accompanied by a reduction in GR80 level (Figures 2G–2I). In contrast, Opa1 OE significantly enhanced GR80 toxicity and protein level (Figures 2G and 2I). Although Opa1 is known to act in mitochondrial fusion, its modulation of GR80 toxicity is most likely unrelated to that, as altering fission-fusion balance by the loss- or gain-of-function of Drp1, Fis1, or Marf had no obvious effect on GR80 toxicity (Figures S2H and S2I). These results implicate CJ as a key site of GR80 toxicity.
We next assessed the molecular basis underlying the genetic interaction between GR80 and Opa1. In coIP assays we detected an association between GR80 and the long-form of Opa1 (Figure 2J), suggesting that they may interact inside mitochondria. More supporting evidence came from immuno-EM, which showed a juxtaposition of GR80 and Opa1 near CJs (Figure S2J). Next, we tested the effect of GR80 on the formation of Opa1 oligomers, the presumed molecular staples that constrict and hold the inner membranes at CJs (Frezza et al., 2006). GR80 promoted Opa1 oligomer formation and also had a mild effect on the total Opa1 (monomer) level (Figures 2K and S2K). It is possible that by promoting Opa1 oligomer formation, GR80 causes moderate overall stabilization of steady-state Opa1 monomers. Consistent with the biochemical data, GR80 fly muscle mitochondria exhibited narrower and presumably tightened CJs, which could be loosened by reducing Opa1 oligomer formation through Opa1 RNAi (Figures S2L–S2N).
Alteration of Mitochondrial Contact Site and Cristae Organizing System (MICOS) Structure and Function by Poly(GR)
The Opa1 interactome in Drosophila includes components of the Mic60-Mic19 subcomplex of MICOS (Banerjee and Chinthapalli, 2014), which is centrally involved in CJ formation and function (Koob and Reichert, 2014; Schorr and van der Laan, 2018). We therefore tested whether GR80 may affect MICOS. In coIP assays, GR80 exhibited a physical association with MICOS components in mammalian cells (Figure 3A) and fly muscle (Figure 3B). Functionally, as with Opa1, the partial reduction of components of the Mic60-Mic19 subcomplex effectively rescued the GR80-induced wing posture phenotype (Figure S3A). This was correlated with the restoration of cristae number and the reduction in the GR80 protein level (Figures 3C and 3D). Note that the knockdown of Mic60 and Mic19 resulted in characteristic concentric cristae, a characteristic phenotype seen when these factors are inhibited (John et al., 2005). Conversely, Mic19 (CHCHD3) OE led to an increased GR80 level and an enhanced GR80 toxicity on wing posture (Figures 3E and S3B). It thus appears that at least part of the GR80 toxicity comes from its effect on the Mic60-Mic19 subcomplex. Moreover, MICOS may affect GR80 metabolism, as the GR80 level is altered by genetic manipulations of MICOS components.
Figure 3. Effect of GR80 on MICOS and Mitochondrial Ion Homeostasis.
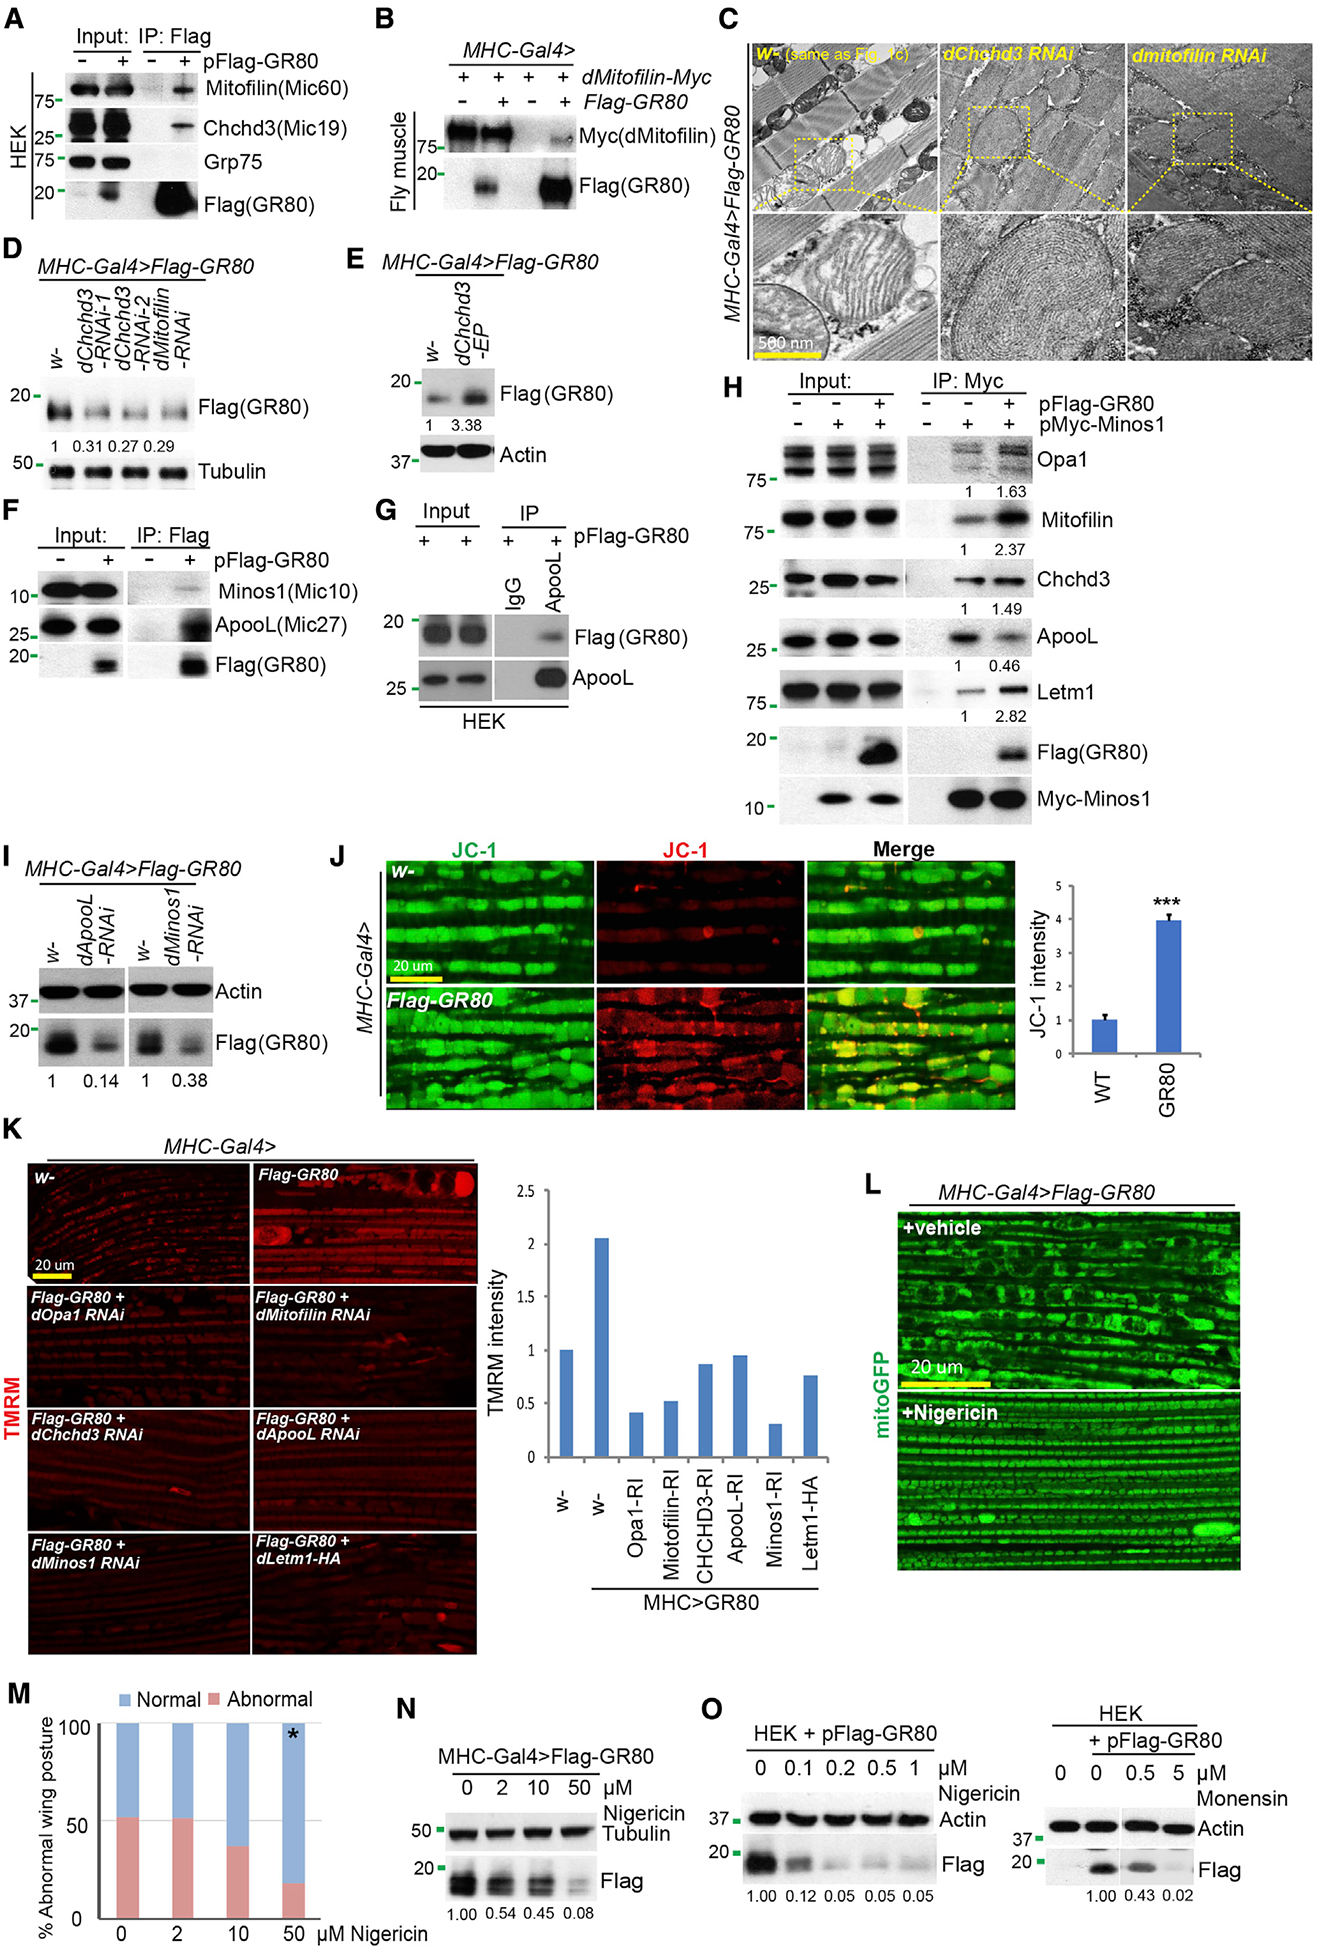
(A and B) CoIP assay showing FLAG-GR80 interaction with MICOS components Mic60 (Mitofillin) and Mic19 (CHCHD3) in HEK293T cells (A) or between FLAG-GR80 and Myc-tagged mitofilin in fly muscle tissue (B).
(C) TEM images showing effect of RNAi of Mic19 or Mic60 on cristae morphology in GR80 flies.
(D and E) Immunoblots showing effects of Mic19 or Mic60 RNAi (D) or Mic19 OE (E) on GR80 level in fly muscle.
(F) CoIP assay showing stronger GR80-Mic27 interaction compared with GR80-Mic10 (Minos1) interaction in HEK293T cells.
(G) Reverse coIP under non-crosslinking condition showing Mic27/GR80 interaction.
(H) CoIP assay showing the effect of GR80 on Mic10 interaction with other MICOS components in HEK293 cells.
(I) Immunoblots showing the effect of Mic27 or Mic10 RNAi on GR80 protein level in fly muscle.
(J and K) Increased MMP in GR80 fly muscle as detected with the tetraethylbenzimidazolylcarbocyanine iodide (JC-1) (I) or tetramethylrhodamine methyl ester (TMRM) (K) dye, and its rescue by the genetic manipulation of MICOS components (K). The graphs show quantification (n = 5, 3 biological repeats). ***p < 0.001 in Student’s t test.
(L and M) Effect of nigericin treatment on mitochondrial morphology (L) and wing posture (M) of GR80 flies. *p < 0.05, χ2 test (n = 1).
(N and O) Immunoblots showing the effect of nigericin on GR80 level in fly muscle (N) and the effect of nigericin or monensin on GR80 level in HEK293T cells (O). Immunoblots are representative of at least 2 independent repeats. See also Figure S3.
MICOS is organized into the Mic60-Mic19 and Mic10 (Minos1)-Mic27 (Apool) subcomplexes, which are presumably connected by Mic12 (QIL1) (Guarani et al., 2015). We next tested the relationship between GR80 and the Mic10-Mic27 complex. In coIP assays, we found robust GR80 interaction with Mic27 and weaker interaction with Mic10 (Figures 3F and S3C). Interaction was confirmed by coIP in the reverse direction (IP with Mic27/Apool and detection of GR80) and under non-crosslinking conditions (Figure 3G). Mic27 is the only MICOS factor that exhibited strong coIP with GR80 under such conditions, suggesting that it is the more proximal subunit of MICOS directly interacting with GR80. In the presence of GR80, the interaction between Mic10 and Mic27 was weakened, whereas the interactions of Mic10 with Mic60, Mic19, Opa1, and LETM1 were strengthened (Figure 3H), suggesting that GR80 alters MICOS dynamics and intersubunit interactions. Functionally, RNAi of Mic10 or Mic27, the efficiency of which was verified by qRT-PCR (Figure S3D), reduced the GR80 protein level (Figure 3I) and rescued the GR80-induced wing posture defect (Figure S3E).
Based on the biochemical and genetic data, we hypothesized that GR80 may enter MICOS and cause the malformation and tightening of CJ, impairing the exchange of metabolites and osmolytes. This may affect ion homeostasis and, in turn, the mitochondrial membrane potential (MMP). GR80 fly mitochondria maintained a high MMP (Figures 3J and S3F) and contained a higher Ca2+ level as monitored with the genetically encoded mito-GCaMP indicator and the Rhod2-AM dye (Figure S3G), in keeping with MMP being a driving force of calcium entry into mitochondria. Tuning down levels of MICOS components lowered the MMP (Figure 3K), suggesting that GR80 acts through MICOS to alter MMP and mitochondrial ion homeostasis. This is presumably mediated by GR80 interference with the activity of LETM1, a protein with K+ and Ca2+ transporter activity (Nowikovsky et al., 2004; Jiang et al., 2009) and an interacting partner of the Mic60/Mic19/Opa1 subcomplex (Banerjee and Chinthapalli, 2014). There was an increased mito-K+ level as detected with MitoPOP (Austin et al., 2017) in GR80 fly muscle (Figure S3H). Moreover, LETM1 OE or knockdown of the MICOS component decreased the mito-K+ level (Figures S3H and S3L). This was also accompanied by a reduction in GR80 level (Figure S3I), suggesting that the restoration of mitochondrial ion homeostasis may affect the MICOS structure and, in turn, GR80 stability.
To further test the roles of MMP and altered ion homeostasis in GR80 toxicity, we treated GR80 flies with nigericin, a K+/H+ antiporter that can re-balance mitochondrial matrix ion levels (Nowikovsky et al., 2007). Treatment with low concentrations of nigericin effectively restored mitochondrial morphology (Figure 3L), accompanied by the rescue of the fly wing posture defect (Figure 3M). The GR80 level was also significantly reduced by nigericin treatment (Figure 3N). The nigericin effect on the GR80 protein level was specific, as it did not affect the GA80 level (Figure S3J). A similar effect on GR80 was observed in mammalian cells treated with nigericin or monensin, another ionophore with a similar mechanism of action (Figure 3O). Moreover, the aberrant interactions between MICOS subunits caused by GR80 (Figure S3K) and the elevated mito-K+ in GR80 flies were rescued after nigericin treatment (Figures S3H and S3L). Thus, by restoring mitochondrial ion homeostasis, nigericin may affect the MICOS structure and, in turn, GR80 stability, similar to the effects of the genetic manipulation of MICOS, although other mechanisms of nigericin action cannot be excluded.
Rescue of Mitochondrial Defects in C9-ALS/FTD Patient Fibroblasts by Genetic Manipulation of MICOS Components or by Nigericin Treatment
Finally, we tested whether the pathogenic mechanisms uncovered in flies are relevant to GR toxicity in patient cells. In fibroblasts from C9-ALS/FTD patients carrying C9ORF72 G4C2 repeat expansion (Kramer et al., 2016), GR was present in the mitochondrial fraction, as shown by dot blot (Figure S4A) and immunostaining (Figure S4B), although nuclear GR was also detected (Figure S4B). There was increased mitochondrial complex I activity (Figure 4A) and ATP production (Figure S4C) in patient cells and detachment and loss of cristae in patient mitochondria, as revealed by EM (Figure 4B). There was also increased MMP, mito-Ca2+, mitochondrial ROS, and mito-K+ in patient fibroblasts (Figure 4C). Thus, altered mitochondrial inner membrane structure and ion homeostasis are conserved features of C9-ALS. We also observed GR interactions with Mic27/Apool in patient fibroblasts (Figure S4D). Nigericin treatment (Figures 4D–4F) or knockdown of key MICOS components (Figures S4E–S4G) rescued the mitochondrial defects in patient fibroblasts. Nigericin treatment also reduced the GR-induced mito-K+ increase in HEK293 cells transfected with GR80 (Figure S4H). Nigericin treatment (Figure 4G) or knockdown of key MICOS components (Figure S4I) reduced the GR level in patient cells, but nigericin had no effect on the GA level (Figure S4J). The coexistence of GR and other DPRs (GA and PR), the mitochondrial accumulation of GR, and the specific effect of nigericin on the GR level were observed in independent patient fibroblast cell lines (Figures S4K–S4M). These data support the notion that poly(GR)-induced alterations of MICOS and ion homeostasis contribute to mitochondrial toxicity in C9-ALS.
Figure 4. Mitochondrial Defects in C9-ALS Patient Fibroblasts and Effect of Nigericin and Genetic Manipulation of MICOS Components.
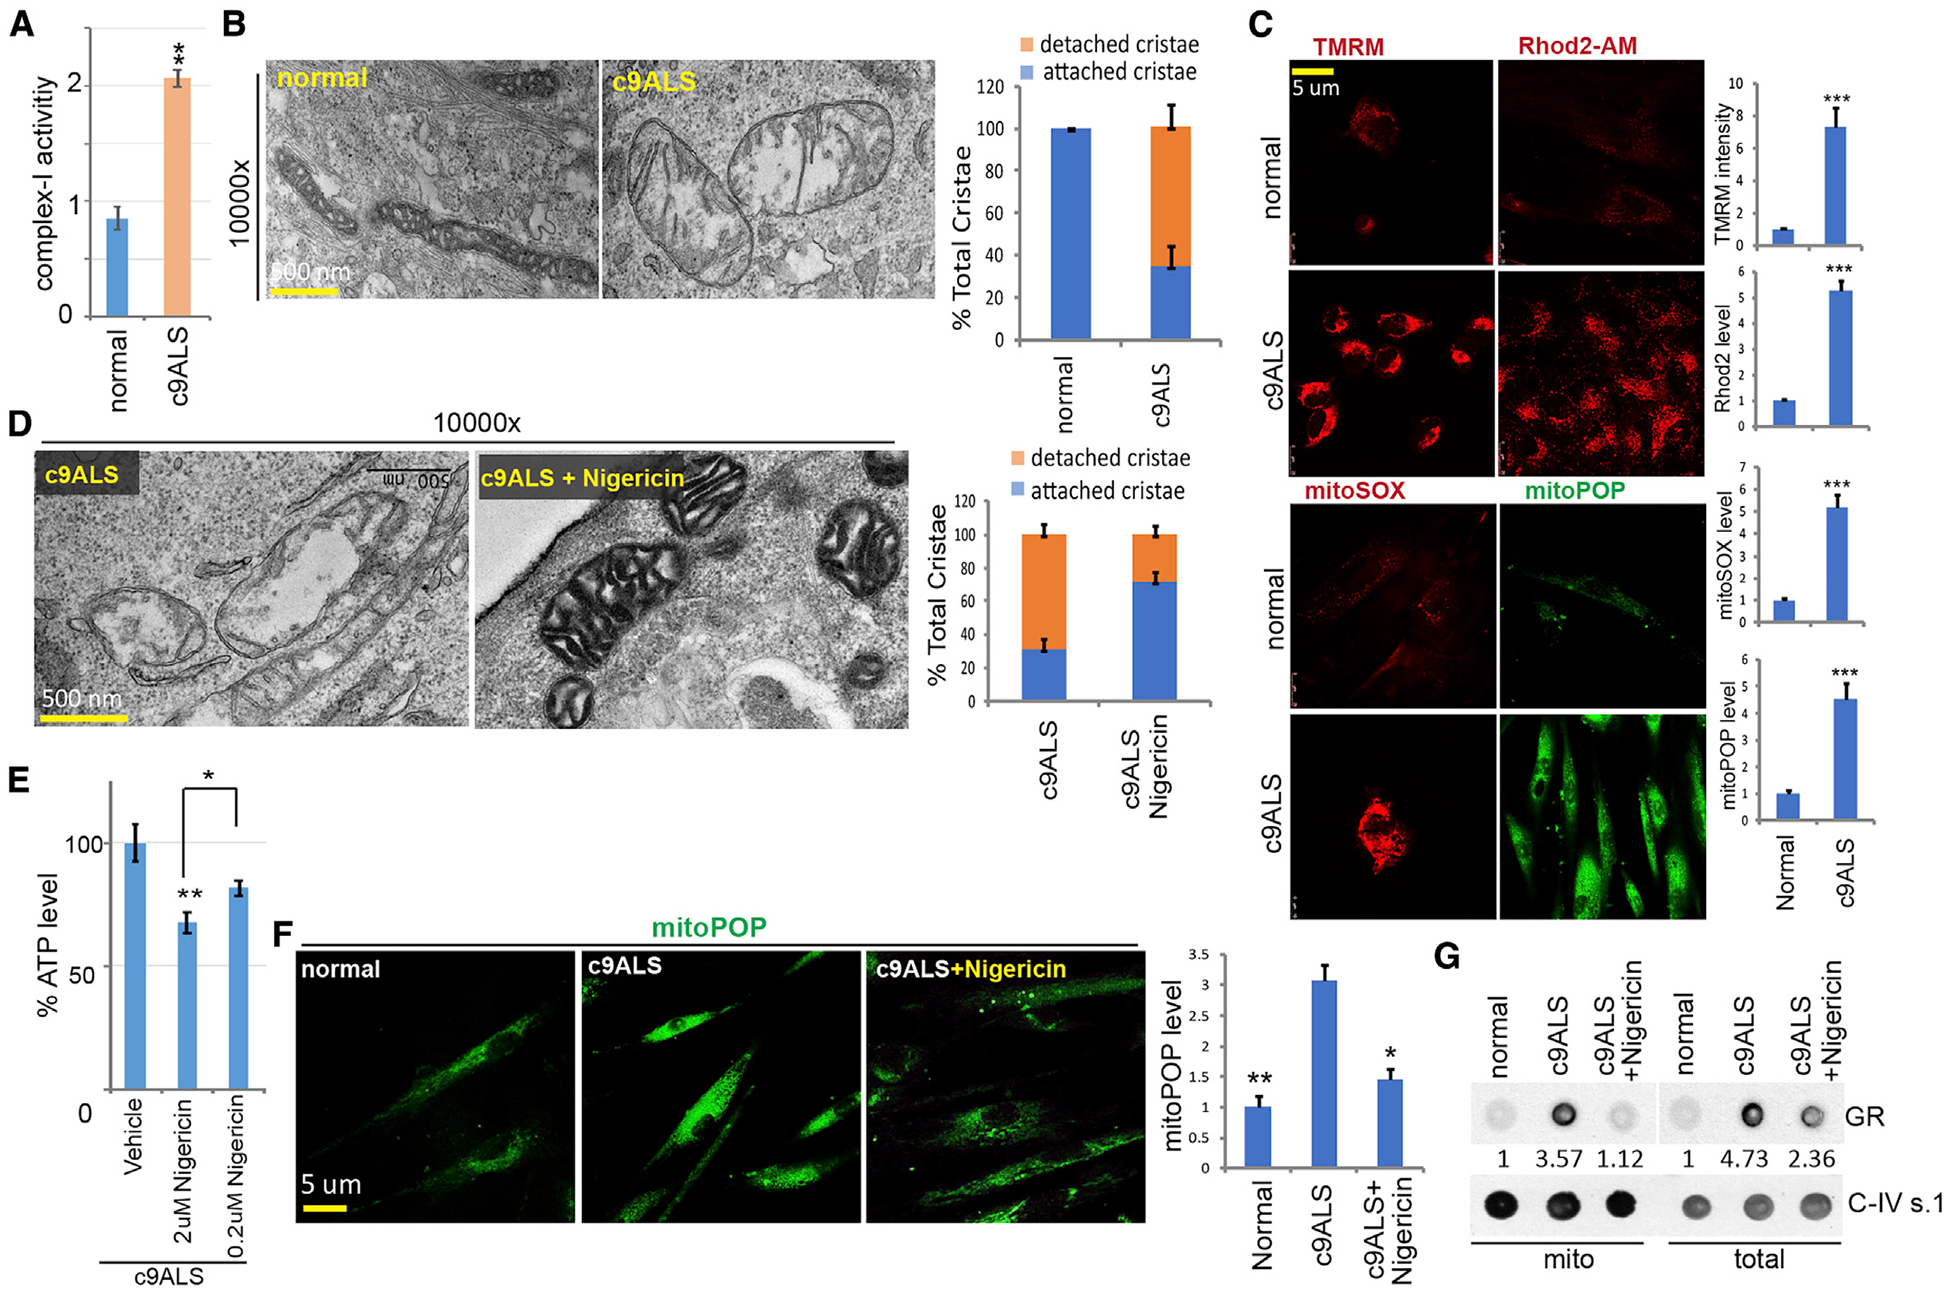
(A) Measurement of complex I activity in control and patient fibroblasts (n = 3).
(B) TEM images of mitochondria in control and patient fibroblasts. The graph shows quantification (n = 3).
(C) Altered MMP, mito-Ca2+, mito-ROS, and mito-K+ in patient fibroblasts. The graphs show quantification (n = 3).
(D–F) Effects of nigericin treatment on mitochondrial morphology (D), ATP level (E), or mito-K+ level (F) in patient fibroblasts. The graphs show quantification (n = 4).
(G) Dot blot assay showing effect of nigericin on GR protein levels in total or mitochondrial fraction (top) in patient fibroblasts. Complex IV subunit 1 (upper) or actin (lower) serves as a loading control.
*p < 0.05, **p < 0.01, and ***p < 0.001, 1-way ANOVA test followed by SNK test plus Bonferroni correction (E and F), or 2-tailed Student’s t test (A and C). Immunoblots are representative of at least 2 independent repeats. See also Figure S4.
DISCUSSION
Mitochondrial dysfunction is a common and early feature observed in neurodegenerative diseases. The pathogenic role of mitochondrial dysfunction has been extensively studied in SOD1-linkd ALS (Palomo and Manfredi, 2015) and is also linked to C9-ALS/FTD (Yang et al., 2015; Konrad et al., 2017; Choi et al., 2019), but the underlying mechanism is not well defined. We show that poly(GR) can enter mitochondria and associate with MICOS, altering the balance and stoichiometry of the MICOS subcomplexes and impairing mitochondrial function. Our findings of poly(GR) entering mitochondria and causing mitochondrial toxicity resonate with previous studies (Choi et al., 2019) that identify mitochondrial protein ATP5A1 as a binding partner of poly(GR). These results support the notion that G4C2 repeat-derived DPRs can target diverse essential organelles and cellular structures to cause cellular toxicity and contribute to C9-ALS/FTD pathogenesis. The composition and length of DPRs produced in disease have not been systematically determined. It is possible that they vary in a cell-type-specific manner and may interact with different partners or interfere with different cellular structures. This may confer cell-type selectivity of vulnerability. Supporting this notion, a recent study found a specific increase in poly-GR among the DPRs tested, and evidence of mitochondrial defect, in iPSC-derived C9-ALS/FTD muscle cells (Lynch et al., 2019). Future studies will test whether MICOS defects may underlie the mitochondrial defects in patient iPSC-derived C9-ALS/FTD muscle cells.
Our results implicate a causal and direct link between MICOS dysfunction and C9-ALS/FTD. MICOSs are dynamic structures that organize the IMM into domains of a broader respiratory network. In addition to forming membrane boundaries that limit the dynamic distribution of membrane proteins, the MICOSs at CJ help partition metabolites between the intracristal spaces and IMSs and thus influence OxPhos. How these structures change their number, composition, position, morphology, and interactions with other mitochondrial complexes in response to metabolic demand or stress is poorly understood. Our results indicate that by interacting with MICOS component Mic27, poly(GR) weakens the interaction between Mic27 and Mic10 while strengthening the interaction between Mic10 and Mic60/Mic19/Opa1/LETM1 proteins. Mic10 and Opa1 have both been shown to form oligomers, which are required for membrane bending at the CJ in the case of Mic10 (Barbot et al., 2015), and CJ remodeling in response to metabolic demand and apoptotic stimuli in the case of Opa1 (Frezza et al., 2006). We show that GR80 promotes Opa1 oligomer formation and tightening of CJ and that by interacting with MICOS components, poly(GR) itself becomes stabilized. This vicious loop may perpetuate GR toxicity in the disease state.
We find that genetic manipulation of MICOS has a profound effect on poly(GR) level, suggesting that a dynamic equilibrium between the mitochondrial and extra-mitochondrial pools of poly(GR) exists and that mitochondria play an important role in poly(GR) metabolism. How poly(GR) interacts with and impairs these multi-protein assemblies and the mechanism of MICOS and mitochondria in regulating poly(GR) metabolism are interesting questions for future investigation. Since aberrant cristae morphology is frequently seen in disease (Wollweber et al., 2017) and during aging (Takahashi et al., 1970), other disease-causing genes or the aging process may directly or indirectly affect the MICOS to alter mitochondrial structure and function, and further studies of the mechanisms involved will offer novel insights into the pathophysiology.
Our results also implicate altered mitochondrial ion homeostasis in C9-ALS/FTD pathogenesis. The K+/H+ antiporter nigericin can effectively rescue mitochondrial cristae morphology and various physiological parameters in fly models and independent patient fibroblast cell lines. Nigericin was previously shown to rescue LETM1 deficiency-induced mitochondrial swelling and ion dyshomeostasis in yeast and mammalian cells (Nowikovsky et al., 2007; Dimmer et al., 2008), suggesting that LETM1 dysfunction may be relevant to poly(GR) toxicity. Nigericin can also affect cancer-related signaling and has been explored as an anticancer agent in preclinical studies (Hegazy et al., 2016). However, given its prominent pro-inflammatory activity, its use in ALS patients may require the careful determination of an effective therapeutic window, as inflammation is implicated in ALS pathogenesis (McCauley and Baloh, 2019). Should future studies validate the beneficial effects of MICOS modification and nigericin treatment in animal models that do not rely on GR OE and in C9-ALS/FTD patient iPSC-derived muscle cells or motor neurons, further modification of nigericin or related K+/H+ antiporters is warranted to develop potential therapeutic agents.
STAR★METHODS
RESOURCE AVAILABILITY
Lead Contact
Further information and requests for resources and reagents may be obtained from the Lead Contact, Bingwei Lu (bingwei@stanford.edu)
Materials Availability
All unique/stable reagents generated in this study are available from the Lead Contact with a completed Materials Transfer Agreement.
Data and Code Availability
Original/source data for all figures in the paper is available at Mendeley Data: https://data.mendeley.com/datasets/sd3rtdy7sn/1
EXPERIMENTAL MODEL AND SUBJECT DETAILS
Drosophila Stocks
The indicated UAS RNAi and OE fly lines were crossed to Mhc-Gal4 driver line for muscle expression. See Key Resources Table for genotypes. Fly culture and crosses were performed according to standard procedures and raised at indicated temperatures. Flies were generally raised at 25°C and with 12/12 hr dark/light cycles. Fly food was prepared with a standard receipt (Water, 17 L; Agar, 93 g; Cornmeal, 1,716 g; Brewer’s yeast extract, 310 g; Sucrose, 517 g; Dextrose, 1033 g). Unless otherwise indicated in the figure legend, male flies at 2–3 weeks of age were used for the experimental procedures described.
KEY RESOURCES TABLE
| REAGENT or RESOURCE | SOURCE | IDENTIFIER |
|---|---|---|
| Antibodies | ||
| Mouse anti-FLAG | Sigma-Aldrich | F1804 |
| Rabbit anti-FLAG | Sigma-Aldrich | F7425 |
| Chicken anti-GFP | Abcam | ab13970 |
| Mouse anti-TOM20 | Santa Cruz Biotech | sc17764 |
| Mouse anti-Opa1 | BD Biosciences | 612806 |
| Mouse anti-Tom40 | Santa Cruz Biotech | sc365467 |
| Mouse anti-Tom70 | Santa Cruz Biotech | sc390545 |
| Mouse anti-VDAC1 | Santa Cruz Biotech | sc390996 |
| Rabbit anti-cytochrome C | Abcam | ab90529 |
| Rabbit anti-C-I30 | Abcam | ab14711 |
| Mouse anti-Core2 | Santa Cruz Biotech | sc390378 |
| Mouse anti-alpha-tubulin | Proteintech | 66031 |
| Rabbit anti-Grp75 | Cell Signaling | 2816 |
| Mouse anti-Hsp60 | Santa Cruz | sc-59567 |
| Mouse anti-C-IV s.1 | Abcam | ab14705 |
| Rat anti-HA | Roche | 3F10 |
| Mouse anti-actin | Sigma-Aldrich | A2228 |
| Rabbit anti-mitofilin | Abcam | ab48139 |
| Rabbit anti-CHCHD3 | Abcam | ab98975 |
| Mouse anti-ApooL | Santa Cruz Biotech | sc-390958 |
| Mouse anti-LETM1 | Abcam | ab55434 |
| Mouse anti-Myc | Santa Cruz Biotech | 9E10 |
| Rabbit anti-Minos1 | Abcam | ab84969 |
| Rabbit anti-fly-Opa1 | Sigma-Aldrich | M6319 |
| Rat anti-poly (GR) | Millipore | MABN778 |
| Rabbit anti-poly (GR) | Millipore | ABN1361 |
| Rabbit anti-poly(GA) | Proteintech | 24492–1-AP |
| Rabbit anti-poly(PR) | Proteintech | 23979–1-AP |
| Rabbit anti-ATP6 | Abcam | AB102573 |
| Goat anti-Mouse IgG-HRP | Santa Cruz | sc-2005 |
| Goat anti-Rabbit IgG HRP | Santa Cruz | sc-2004 |
| Goat anti-Chicken IgY (H+L) Secondary Antibody, Alexa Fluor 488 | Invitrogen | A11039 |
| Goat anti-Rabbit IgG (H+L) Highly Cross-Adsorbed Secondary Antibody, Alexa Fluor 488 | Invitrogen | A11034 |
| Goat anti-Rabbit IgG (H+L) Highly Cross-Adsorbed Secondary Antibody, Alexa Fluor 568 | Invitrogen | A11036 |
| Goat anti-Mouse IgG (H+L) Cross-Adsorbed Secondary Antibody, Alexa Fluor 568 | Invitrogen | A11004 |
| Goat anti-Mouse IgG (H+L) Cross-Adsorbed Secondary Antibody, Alexa Fluor 633 | Invitrogen | A21050 |
| DAPI | Sigma-Aldrich | D9542 |
| Chemicals, Peptides, and Recombinant Proteins | ||
| Nigericin | Cayman Chemical | 11437 |
| Monensin sodium salt | Sigma-Aldrich | M5273 |
| EDC (1-ethyl-3-(3-dimethylaminopropyl) carbodiimide hydrochloride) | Thermo Scientific | 22980 |
| Lipofectamine 3000 | Invitrogen | L3000015 |
| Lipofectamine RNAi-MAX | Invitrogen | 13778150 |
| Tris base | Sigma-Aldrich | 11814273001 |
| Glycine | Sigma-Aldrich | G8898 |
| SDS | Sigma-Aldrich | L3771 |
| Anti-FLAG M2 affinity gel | Sigma-Aldrich | A2220 |
| Normal goat serum | Jackson ImmunoResearch | 005-000-121 |
| Pierce 16% Formaldehyde (w/v), Methanol-free | Thermo Fisher | 28908 |
| Triton™ X-100 | Sigma Aldrich | T9284 |
| DMEM, high glucose, GlutaMAX Supplement | GIBCO | 10566016 |
| Schneider’s Medium | GIBCO | 21720–024 |
| Percoll | GE Healthcare | 17089101 |
| EDTA | Sigma-Aldrich | E9884 |
| EGTA | Sigma-Aldrich | E3889 |
| Dimethyl sulfoxide | Sigma-Aldrich | D8418 |
| 2XLaemmli sample buffer | Biorad | 161–0737 |
| Protease inhibitor cocktail | Bimake | B14012 |
| Critical Commercial Assays | ||
| ATP Bioluminescence Assay Kit HS II | Roche | 11699709001 |
| Complex I Enzyme Activity Microplate Assay Kit | Abcam | ab109721 |
| Protease K digestion kit | Thermo Fisher | AM2548 |
| RNeasy Mini kit | QIAGEN | 74104 |
| iScript cDNA synthesis ki | Biorad | 1708890 |
| PowerUp SYBR Green Master Mix | Applied Biosystems | A25741 |
| Western Lightning Plus-ECL | PerkinElmer Inc. | NEL105001EA |
| HyBlot CL Autoradiography Film | Denville Scientific Inc. | 1159M38 |
| Tetramethylrhodamine (TMRM) | Invitogen | T668 |
| MitoSox | Invitogen | M36008 |
| Rhod-2, AM | Invitogen | R1244 |
| MitoPOP | Dr. Karin Nowikovsky | N/A |
| JC-1 | Invitogen | T3168 |
| Q5 Site-Directed Mutagenesis Kit | New England Biolabs | E0554S |
| NuPAGE® MOPS SDS running buffer | Invitrogen | NP0001 |
| NuPAGE 4–12% Bis-Tris Protein Gels | Invitrogen | NP0321 |
| Oligonucleotides | ||
| qRT-PCR primer: actin42A Forward: TCTTACTGAGCGCGGTTACAG | This paper | N/A |
| qRT-PCR primer: actin42A Reverse: ATGTCGCGCACAATTTCAC | This paper | N/A |
| qRT-PCR primer: mic10 Forward: TCACCCTGCTCTTCTTCCG | This paper | N/A |
| qRT-PCR primer: mic10 Reverse: ACGATATGCCACGCCCAC | This paper | N/A |
| qRT-PCR primer: ApooL Forward: AATCATGGCGGCGGTTGC | This paper | N/A |
| qRT-PCR primer: ApooL Reverse: TGTGCCTTAGCGGTTTCC | This paper | N/A |
| Stealth RNAi siRNA Negative Control Hi GC | Invitrogen | 12935–400 |
| Stealth RNAi™ siRNA of Opa1 | Invitrogen | HSS107432 |
| Stealth RNAi™ siRNA of Letm1 | Invitrogen | HSS106021 |
| Stealth RNAi™ siRNA of Tom40 | Invitrogen | HSS145636 |
| Stealth RNAi™ siRNA of Mitofilin-IMMT | Invitrogen | HSS116992 |
| Stealth RNAi™ siRNA of CHCHD3 | Invitrogen | HSS147816 |
| Stealth RNAi™ siRNA of ApooL | Invitrogen | HSS175195 |
| Stealth RNAi™ siRNA of Minos1 | Invitrogen | AS029RSI |
| Recombinant DNA | ||
| pcDNA3.1-Flag-GR80 | Dr Fen-Biao Gao | N/A |
| pCMV6-C1Orf151 (Minos1)-DDK-Myc | Origene | RC212930 |
| Software and Algorithms | ||
| SPSS | IBM | https://www.ibm.com/analytics/spss-statistics-software |
| Excel | Microsoft | https://www.microsoft.com/en-us/microsoft-365/excel |
| Fiji ImageJ | National Institute of Health | https://imagej.nih.gov/ij/ |
| Deposited Data | ||
| Mendeley Dataset | This Paper | https://data.mendeley.com/datasets/sd3rtdy7sn/1 |
| Experimental Models: Cell Lines | ||
| HEK293 cell line | ATCC | CRC-1573 |
| HeLa cell line | Gift from Dr. Richard Youle | N/A |
| Normal fibroblast cell line #1 | Coriell Institute | ND29510 |
| Normal fibroblast cell line #2 | Coriell Institute | ND29971 |
| C9ALS fibroblast cell line #4 | Gift from Dr. Aaron Gitler | Kramer et al., 2016 |
| C9ALS fibroblast cell line #6 | Gift from Dr. Aaron Gitler | Kramer et al., 2016 |
| C9ALS fibroblast cell line #7 | Gift from Dr. Aaron Gitler | Kramer et al., 2016 |
| Experimental Models: Organisms/Strains | ||
| UAS-Flag-GR80 | Gift from Dr. Fen-Biao Gao | Yang et al., 2015 |
| UAS-Flag-GA80 | Gift from Dr. Fen-Biao Gao | Yang et al., 2015 |
| UAS-Flag-PR80 | Gift from Dr. Fen-Biao Gao | Yang et al., 2015 |
| UAS-mito-GFP | Gift from Dr. William Saxton | N/A |
| UAS-mito-GCaMP | Gift from Dr. Fumiko Kawasaki | N/A |
| UAS-Myc-Mitofilin | Gift from Dr. Xinnan Wang | N/A |
| UAS-dOpa1-Flag, from Dr. Leo Pallanck | Gift from Dr. Leo Pallanck | N/A |
| UAS-dOpa1-RNAi | Gift from Dr. Leo Pallanck | N/A |
| UAS-GR100 | Bloomington Drosophila Stock Center (BDSC) | #58696 |
| UAS-PA100 | BDSC | #58699 |
| UAS-G4C2–36 | BDSC | #58688 |
| UAS-PR100 | BDSC | #58698 |
| UAS-G4C2–36-RNA Only | BDSC | #58689 |
| UAS-PA36 | BDSC | #58695 |
| UAS-PR36 | BDSC | #58694 |
| UAS-GA100 | BDSC | #58697 |
| UAS-GA36 | BDSC | #58693 |
| UAS-GR36 | BDSC | #58692 |
| UAS-Drp1 | BDSC | #51647 |
| UAS-Marf-RNAi | BDSC | #55189 |
| Chchd3 RNAi | BDSC | #51157 |
| Chchd3 RNAi | BDSC | #38984 |
| Chchd3 EP | BDSC | #11599 |
| Mitofilin RNAi | BDSC | #63994 |
| Letm1 RNAi | BDSC | #37502 |
| Tom40 RNAi | BDSC | #26005 |
| Mic10 RNAi | BDSC | #63669 |
| ApooL RNAi | BDSC | #66933 |
| Minos1-HA | FlyORF | F002914 |
| Letm1-HA | FlyORF | F001238 |
| Tim17b RNAi | VDRC | v103529 |
Cell Lines
HeLa cell was a gift from Dr. Richard Youle (NINDS/NIH). HEK293T cells were purchased from ATCC. Control fibroblast line #1 and control fibroblast line #2 were obtained from the Coriell Institue. Control fibroblast line #1 was from a 55-year old female subject (Coriell ID ND29510). Control fibroblast line #2 was from a 61-year female subject (Coriell ID ND29971). The three C9orf72 expansion ALS patient fibroblast lines were generously shared by Dr. Aaron Gitler and were described before (Kramer et al., 2016). C9ALS fibroblast line #4 was from a 55-year old male patient, C9ALS fibroblast line #6 was from a 61-year old male patient, and C9ALS fibroblast line #7 was from a 62-year old male patient. Unless otherwise indicated, C9ALS fibroblast line#6 was used for most experiments. HEK293T cells, control fibroblasts and C9ALS patient fibroblasts were cultured under standard tissue culture conditions (1x DMEM medium - GIBCO, 10% FBS, 5% CO2, 37°C).
METHOD DETAILS
Drosophila behavioral tests and ATP measurement
For all wing posture assays, male flies at 1 day, 7-day and 14~15-day old were scored and all the experimental groups were aged at 25°C. 25~30 male flies were collected/raised in one vial and 3~4 independent vials were counted per genotype.
ATP measurements in fly thoracic indirect flight muscle were performed according to published protocols, using a luciferase-based bioluminescence assay (ATP Bioluminescence Assay Kit HS II, Roche Applied Science). For each test, three thoraces were carefully dissected by removing heads, wings, legs and abdomen from whole flies, and the remaining part quickly homogenized in 100 μl lysis buffer (provided by kit). The tissue lysates were then boiled for 5 min at 100°C and briefly cleared by centrifugation at 20,000 g for 2 mins. The supernatant was transferred to a new tube and kept on ice. 2.5 μl of cleared tissue lysate was mixed with 187.5 μl dilution buffer and 10 μl luciferase reagent. The luminescence signal was briefly mixed and immediately measured by a Lumat LB 9507 tube luminometer (Berthold Technologies). For each genotype or drug treatment group, at least 3~4 independent tests were assayed.
Immunoblots and Immunostaining
Antibodies used for western blot and immunostaining were mouse anti-Flag (1:1,000, Sigma-Aldrich, F1804), rabbit anti-Flag (1:1,000, Sigma-Aldrich, F7425), mouse anti-TOM20 (1:1,000, Santa Cruz, sc17764), mouse anti-Tom40 (1:1000, Santa Cruz, sc365467), mouse anti-Tom70 (1:1000, Santa Cruz, sc390545), mouse anti-VDAC1 (1:1000, Santa Cruz, sc390996), rabbit anti-cytochrome C (1:1000, Abcam, ab90529), rabbit anti-C-I30 (1:1000, Abcam, ab14711), mouse anti-Core2 (1:1000, Santa Cruz, sc390378), mouse anti-OPA1 (1:1000, BD Biosciences 612806), rat anti-HA (1:1000, Roche, 3F10), mouse anti-actin (1:5000, Sigma, A2228), rabbit anti-mitofilin (1:1000, Abcam, ab48139), rabbit anti-CHCHD3 (1:1000, Abcam, ab98975), mouse anti-ApooL (1:1000, Santa Cruz, sc-390958), mouse anti-LETM1 (1:1000, Abcam, ab55434), mouse anti-Myc (1:1000, Santa Cruz, 9E10), rabbit anti-Minos1 (1:1000, Abcam, ab84969), rabbit anti-fly-Opa1(1:1000, Sigma, M6319). Antibodies for dot blot: rat anti-poly (GR) (1:500, Millipore, MABN778), rabbit anti-poly(GA) (1:500, Proteintech, 24492–1-AP), rabbit anti-ATP6 (1:1000, abcam, AB102573), mouse anti-Flag (1:1000, Sigma, F1804), mouse anti-actin (1:3000, Sigma, A2228).
Nigericin treatment of Drosophila
Newly hatched flies were collected and placed into vials with instant fly food (Carolina Biological Supply Company, USA) mixed with different doses (0, 2, 10 and 50 μM) of Nigericin (Cayman Chemical, 11437) from the stock solution (50 mM dissolved in DMSO). The flies were fed for 7 days and changed with fresh vial every 24 hours. After treatments, fly thoracic samples were harvested and used for sample preparation.
Fly muscle staining
For immunohistochemical analysis of mitochondrial morphology of adult fly indirect flight muscles, 5-day old male flies from 29°C were assayed. In muscle staining, at least 5 individuals were examined for each genotype and the representative images were presented. Dissected tissue samples were briefly washed with 1x PBS and fixed with 4% formaldehyde in 1x PBS containing 0.3% Triton X-100 for 45 minutes at room temperature. Fixatives were subsequently blocked with 1x PBS containing 5% normal goat serum and incubated for 60 minutes at room temperature followed by incubation with primary antibodies at 4°C overnight. The primary antibodies used were: chicken anti-GFP (1:5,000, Abcam) and mouse anti-FLAG (1:1,000; Sigma). After three washing steps with 1x PBS/0.25 % Triton X-100 each for 15 minutes at room temperature, the samples were incubated with Alexa Fluor® 594-conjugated and Alexa Fluor® 488-conjugated (1:500, Molecular Probes) for 3 hours at room temperature and subsequently mounted in Slow-Fade Gold (Invitrogen).
MitoSox, TMRM, Rhod2, JC-1, and mitoPOP staining and mito-GCaMP imaging
Fly thoraxes were isolated by removing heads, wings, legs and abdomen from whole flies and dissected in the Schneider’s Medium (cat#: 21720–024, GIBCO™). Samples were briefly washed once with fresh medium and stained in Schneider’s medium at room temperature for 30 minutes in the dark box. The dilutions of the dyes are: MitoSox 5 μM, TMRM 200 nM, JC-1 5 μM, Rhod-2 5 μM and mitoPOP 5 μM. After staining, the samples were washed 3 times with Schneider’s Medium and directly applied to observation with Leica SP8 confocal microscope. MitoSox, TMRM, Rhod2, and JC-1 were purchased from Molecular Probes. Mito-POP was described before (Austin et al., 2017). For mito-GCaMP live imaging, flies thoraxes were isolated as indicated before. The thoracic muscles were dissected in the Schneider’s Medium. Samples were briefly washed once with fresh medium and then quickly observed under confocal microscope (Leica SP8). For data quantification, signal intensity was measured and calculated using NIH ImageJ.
Mitochondrial respiratory complexes activity assay
The individual activity of the mitochondrial respiratory complexes in Figure 1D was measured at the service of Metabiolab Inc., (France). Mitochondrial complex- I activities shown in Figures 4A and S4G were measured by using a Complex I Enzyme Activity Microplate Assay Kit (Colorimetric) (ab109721, abcam), with the A450 nm signal measured using a plate-reader (Cytation3, BioTek Inc).
Dot-blot assay
Samples (fly thoraxes and human fibroblasts) were lysed in cell lysis buffer [50 mM Tris-HCl, pH7.4, 150 mM NaCl, 5 mM EDTA, 10% glycerol, 1% Triton X-100, 0.1mg/ml cycloheximide, 1x RNase inhibitor, and Complete protease inhibitor cocktail (cat#: B14012, Bimake)]. The extracts were briefly pre-cleared by centrifugation and measured concentration by the BCA method (BioRad). The sample concentrations were adjusted to 2 μg/μl and mixed with 2x SDS sample buffer (BioRad). The samples were blotted on Hybond™-C super NC membrane, air-dried, blocked in 5% dry milk (in TBST) and incubated with primary antibody for overnight at 4°C. The secondary antibody incubation and developing were performed following similar procedures as for western blots. For data quantification, signal intensity was measured and calculated using NIH ImageJ.
Transmission EM, immune-gold EM, and analysis of mitochondrial morphology
For TEM, dissected fly adult thoraces from 2–3 week old flies, or control and C9orf72 patient fibroblasts were fixed 1 hour in modified Trump’s fixative (0.1 M sodium cacodylate buffer, 1% glutaraldehyde, and 4% formaldehyde) at room temperature and kept at 4°C overnight. All samples were processed, trimmed and stained by standard methods. For immunogold labeling, samples were fixed in Karnovsky’s fixative: 2% Glutaraldehyde (EMS Cat# 16000) and 4% paraformaldehyde (EMS Cat# 15700) in 0.1M Sodium Cacodylate (EMS Cat# 12300) pH 7.4 for 1 hr. The fix was replaced with cold/aqueous 1% Osmium tetroxide (EMS Cat# 19100) and were then allowed to warm to Room Temperature (RT) for 2 hr rotating in a hood, washed 3X with ultrafiltered water, then en bloc stained in 1% Uranyl Acetate at RT 2hrs while rotating. Samples were then dehydrated in a series of ethanol washes for 30 minutes each @ RT beginning at 50%, 70% EtOH then moved to 4°C overnight. They were place in cold 95% EtOH and allowed to warm to RT, changed to 100% 2X, then Propylene Oxide (PO) for 15 min. Samples are infiltrated with EMbed-812 resin (EMS Cat#14120) mixed 1:2, 1:1, and 2:1 with PO for 2 hr each with leaving samples in 2:1 resin to PO overnight rotating at RT in the hood. The samples are then placed into EMbed-812 for 2 to 4 hours then placed into molds w/labels and fresh resin, orientated and placed into 65°C oven overnight. Sections were taken around 80nm, picked up on formvar/Carbon coated slot Cu grids, stained for 40seconds in 3.5% Uranyl Acetate in 50% Acetone followed by staining in Sato’s Lead Citrate for 2 minutes. For immunolabelling, sections were subjected to micro etching with 10% periodic acid in water for 15 minutes on parafilm, followed by 3x wash with ddH2O/5 min each. This was followed by elution of osmium with 10% sodium metaperiodate in H2O for 15 minutes on parafilm. After 3x washes with ddH2O/5 min each, samples were blocked in Standard Block (0.5% BSA, 0.5% Ovalbumin in PBST) for 30 min, quenched with 0.5M glycine in PBS for 10 min, washed with PBS 2x/2 min each, and blocked again with Standard Block for 20 min. Primary antibodies were added at 1:1000 for mouse anti-Flag and 1:50 for rabbit anti-Opa1 and incubated at 4°C O/N. Samples were washed 2x in Standard Block/10 min each, 2x in PBS/10 min each, and then incubated with secondary antibodies (EM GAR15 and EM GMHL5) at 1:20 for 1 hour and 20 min at RT. Samples were washed 2x with PBST/5 min each, 2x with ultrapure H2O (drop then stream), and contrast stained with 3.5% Uranyl Acetate in 50% Acetone (35 s then rinse in stream) and 0.2% Lead Citrate (35 s then rinse in stream). Samples were observed in the JEOL JEM-1400 120kV. Images were taken using a Gatan Orius 832 4k × 2.6k digital camera with 9um pixel.
For mitochondrial morphology analyses, in Figures 1C and 2H, the cristae number of mitochondria in indirect flight muscle were counted in the TEM images with the magnification of 6,000 ×. A 2 μm × 6 μm rectangle area was selected in the TEM mitochondrial images and all the mitochondrial cristae in this area were counted. 5 individual samples were counted per genotype. In Figure 2C, the number of gold particles in indirect flight muscle samples were counted in the TEM images with the magnification of 6,000 ×. A 2 μm × 4 μm rectangle area was selected in the TEM images and the gold particles in this area were counted and categorized as inside mitochondria or outside mitochondria. 4 individual samples were counted per genotype. In Figure S2G, the gold particle numbers in indirect flight muscle samples were counted in the TEM images with the magnification of 8,000 ~ 12,000 ×. A 2 μm × 4 μm rectangle area was selected in the TEM images and the gold particles in this area which were close to the mitochondrial inner membrane (less than 40 nm) were counted. 4 individual samples were counted per genotype. In Figure S2J, the gold particle numbers of GR80 and OPA1 in fly indirect flight muscle samples were counted in TEM images with the magnification of 8,000 ~ 12,000 ×. A 2 μm × 4 μm rectangle mitochondria area was selected and the gold particles in this area that were close to the mitochondrial inner membrane (less than 40 nm) were counted. 4 individual samples were counted per genotype. In Figures S2L and S2M, the cristae junction diameters in fly indirect flight muscle samples were measured by ImageJ in the TEM images with the magnification of 8,000 ~ 12,000 ×, n = 22 ~25 cristae junctions from mitochondria of 4 different samples were measured per genotype. Methods similar to mitochondrial morphology quantification in fly muscle samples were used for patient fibroblast analysis in Figures 4B, 4D, and S4D. The total cristae number as well as attached and detached cristae number of mitochondria in the normal and C9ALS patient fibroblast were counted at magnification of 5,000 ×, A 2 μm × 6 μm rectangle area was selected from the TEM images for analysis. All the mitochondrial cristae in the area were counted. 6 individual samples were counted per genetic background.
Cell lines, plasmids, cell culture and cell transfection conditions
RegularHeLacellsand HEK293Tcells (ATCC)were culturedunderstandardconditions(1x DMEMmedium,5%FBS, 5%CO2, 37°C). HeLa and HEK293T Cell transfections were performed by using Lipofectamine 3000 (cat#: L3000015, Invitrogen), and si-RNA knockdown experiments were performed using Lipofectamine RNAiMAX reagent (cat#: 13778150, Invitrogen), according to manufacturer’s instructions.
The pcDNA3-Flag-GR80 plasmid was reported before (Yang et al., 2015). The Minos1-Myc plasmid was modified from the pCMV6-C1Orf151 (minos1)-DDK-Myc (Origene-RC212930) plasmid by deleting the DDK sequence using the Q5 Site-Directed Mutagenesis Kit (E0554S, NEB).
RNAi in mammalian cells and patient fibroblasts
All siRNAs used for the RNAi experiments were purchased from Thermo Fisher. Briefly, HeLa cells and patient fibroblast cells were transfected with lipofectamine RNAiMAX reagent (Invitrogen, 13778) according to standard protocol. After 72 hours transfection, cells were washed with warm PBS, followed by lysis and western blot analysis. siRNA sequences used for individual are as follows: siOPA1(HSS107432), siLetm1(HSS106021), siTom40(HSS145636), siMitofilin-IMMT(HSS116992), siCHCHD3(HSS147816), siA-pooL(HSS175195), siMinos1(AS029RSI). C9-ALS patient fibroblasts and matched control fibroblasts were described before (Kramer et al., 2016) and kindly provided by Dr. Aaron Gitler.
RT-PCR
For qRT-PCR analysis of RNAi efficiency, total RNAs were extracted from fly thoraxes by using the RNeasy® Minikit (QIAGEN), and cDNAs were obtained by reverse transcription using the iScript cDNA synthesis kit (Bio-Rad). cDNA templates were then subjected to reaction with PowerUp SYBR Green Master Mix (Applied Biosystems) and analyzed by StepOnePlus real-time PCR system following manufacture’s standard PCR thermal cycling procedure. Calculated data were obtained by using StepOne software V2.3. Relative mRNA levels normalized to actin for statistical quantification in Excel. PCR primers used are as follows:
Actin42A sense: 5′TCTTACTGAGCGCGGTTACAG3′
Actin42A anti-sense: 5′ATGTCGCGCACAATTTCAC3′
Mic10 sense: 5′ TCACCCTGCTCTTCTTCCG3′
Mic10 anti-sense: 5′ ACGATATGCCACGCCCAC3′
ApooL sense: 5′AATCATGGCGGCGGTTGC3′
ApooL anti-sense: 5′TGTGCCTTAGCGGTTTCC3′
Mitochondrial assays
Tetramethylrhodamine (TMRM) (T668) was purchase from Invitrogen. For cell staining, normal and C9orf72 patient fibroblast were cultured in standard condition. One day later, cell growth medium was removed and 100 nM TMRM solution was added into cell to incubate for 30min. Live cell imagine was taken under 574 nm emission filter by using Leica SP8.
For muscle staining, fly muscles with various genetic manipulations were dissected in cold 1xPBS. Muscles were subsequently incubated with 100 nM TMRM solution in PBS 30min at room temperature, followed by taking images using Leica SP8 confocal microscope. Red mitochondrial superoxide indicator-mitoSOX (M36008) was obtained from Molecular Probes. Briefly, normal and C9orf72 patient fibroblast were cultured in 24 well plates with 12 mm coverslip. Cells were incubated with 1μM mitoSOX for 10min at 37°C. Later on, cells were washed with warm PBS for 3 times. Live cell images were taken using the 580 nm emission filter of Leica SP8 confocal microscope. For data quantification, signal intensity was measured and calculated using NIH ImageJ.
Mitochondria isolation and cross-linking
Intact mitochondria from in vitro human cells and fly tissues were purified and quality controlled for the absence of contamination by other organelles according to established procedures. For analysis of fly samples, male flies at appropriate ages were used for thoracic muscle dissection. Samples were homogenized using a Dounce homogenizer. After two steps of centrifugation (1,500 g for 5 minutes and 13,000 g for 17 minutes), the mitochondria pellet was resuspended and washed twice with HBS buffer (5 mM HEPES, 70 mM sucrose, 210 mM mannitol, 1 mM EGTA, 1x protease inhibitor cocktail), then resuspended and loaded onto Percoll gradients. After centrifugation (16700 rpm, 15 minutes, Beckman SW-40Ti rotor), the fraction between the 22% and 50% Percoll gradients containing intact mitochondria was carefully transferred into a new reaction tube, mixed with 2 volumes of HBS buffer, and pelleted by centrifuging at 20,000 g for 20 minutes at 4°C to collect the mitochondrial samples for further analyses.
After purification, mitochondrial samples were resuspended and incubated with different cross-linking reagents − 1% Formaldehyde in pre-chilled HBS, 10 mM EDC (#22980, Thermo Fisher) in HBS buffer. The samples were incubated under 25°C and stopped at different time point by adding SDS-sample buffer and boiling. The reaction products were subjected to different analyses by following established procedures.
For the mitoplast preparation and proteinase K sensitivity assays, HEK293T cells were transfected with Flag-GR80 plasmid. After 48h transfection, mitochondria fraction was isolated. Purified mitochondria were re-suspended in a hypotonic buffer containing 20 mM HEPES-KOH pH 7.2 and incubated on ice 30 minutes to allow for mitochondrial swelling. The mitoplasts were isolated by centrifugation at 64,000 g for 30 minutes. Crude mitochondria or mitoplasts were treated with 1ug/ml proteinase K and incubated on ice for 30 min. The reactions were terminated by adding 2x SDS loading buffer (Biorad), followed by SDS-PAGE and western blot analyses.
Immunohistochemical analysis of cultured cells
For immunohistochemical analysis of human cells, HeLa cells, HEK293 cells, or human fibroblasts were cultured on the ethanol-cleaned cover glass. Cells were washed with 1x PBS 3 times and fixed with 4% formaldehyde in 1x PBS for 30 minutes at room temperature, later washed and permeabilized with 1x PBS containing 0.25% Triton X-100 for 15 minutes. The fixed samples were subsequently blocked with 1x PBS containing 5% normal goat serum and incubated for 1 hour at room temperature followed by incubation with primary antibodies at 4°C overnight. The primary antibodies used were mouse anti-Flag (1:1,000, Sigma-Aldrich), rabbit anti-Flag (1:1,000, Sigma-Aldrich), rabbit anti-TOM20 (1:1,000, Santa Cruz), rabbit anti-GR (ABN1361, Sigma-Aldrich, 1:300). The secondary antibodies used were Alexa Fluor® 488, 594 and 633-conjugated antibodies (1:500, Molecular Probes).
Co-immunoprecipitation (co-IP), SDS-PAGE, and western blot analyses
For Flag-GR80 co-IP, HEK293T cells were transiently transfected with pcDNA3.1-Flag-GR80 plasmid. 72 hours post-transfection, cells were either processed directly for lysis (non-crosslinking condition), or subjected to cross-linking by applying UV cross-linking and 0.5% formaldehyde in 1x PBS to the attached cells on the Petri dish (crosslinking condition). We homogenized the cells in the lysis buffer [50 mM Tris-HCl, pH7.4, 150 mM NaCl, 5 mM EDTA, 10% glycerol, 1% Triton X-100, 0.1mg/ml cycloheximide, 1x RNase inhibitor, and Complete protease inhibitor cocktail (cat#: B14012, Bimake)], additional Phosphatase Inhibitor Cocktail (cat#: B15001, Bimake) will be applied if phosphorylation signal is to be detected. After centrifugation at 10,000 g for 5 min, the supernatant was subjected to immunoprecipitation using M2 affinity agarose (Anti-FLAG M2 affinity gel, cat#: A2220, Sigma-Aldrich) at 4°C overnight with gentle shaking. Subsequently, the beads were washed three times (10 minutes each) at 4°C in lysis buffer, mixed with 2x SDS Sample buffer, and loaded onto SDS-PAGE gels.
For denaturing-IP, after cross-linking with 1% FA, samples were denatured by adding 2x SDS-sample buffer and boiling, then diluted 6 times with pre-chilled cell lysis buffer. IP experiment was performed by providing 35 μl M2-FLAG beads (Sigma) and incubated at 4°C overnight.
NuPAGE 4%–12% Bis-Tris Protein Gels (cat#: NP0321BOX, Invitrogen) and NuPAGE® MOPS SDS running buffer (cat#: NP0001, Invitrogen) were used for SDS-PAGE and immunoblot analyses according to standard procedures. For data quantification of western blots, signal intensity was measured and calculated using NIH ImageJ.
QUANTIFICATION AND STATISTICAL ANALYSIS
All analyses were performed with SPSS (IBM, USA). Error bars represent standard deviation (SD). For pairwise comparisons, we used two-tailed Student’s t test. For comparing multiple groups, we used one-way ANOVA test followed by Student–Newman–Keuls test (SNK test) plus Bonferroni correction (multiple hypotheses correction). Data in Figure S2M was analyzed and presented by the Box-and-Whisker Plot. In statistical comparisons, *, # and & indicating p < 0.05 and **, ## and && indicating p < 0.01 were considered as significant differences.
Supplementary Material
Highlights.
C9-ALS/FTD-associated poly(GR) causes muscle toxicity in a Drosophila model
Poly(GR) enters mitochondria and binds to MICOS proteins, altering MICOS dynamics
Poly(GR) alters mitochondrial cristae morphology, ion homeostasis, and metabolism
Manipulation of MICOS or restoration of ion homeostasis rescues disease phenotypes
ACKNOWLEDGMENTS
We are grateful to Drs. William Saxton, Leo Pallanck, Fumiko Kawasaki, and Xinnan Wang, the Vienna Drosophila RNAi Center, FlyORF, and the Bloomington Drosophila Stock Center for fly stocks; Dr. Aaron Gitler for C9-ALS patient fibroblasts and matched control fibroblasts; and Dr. Karin Nowikovsky for advice on mito-K+ measurement. Special thanks go to J. Gaunce for maintaining flies and providing technical support and members of the Lu lab for discussions. This work was supported by the National Institutes of Health (NIH) (R01NS084412 and R01AR0748750, to B.L.). EM analysis was supported, in part, by American Recovery and Reinvestment Act (ARRA) award no. 1S10RR026780-01 from the National Center for Research Resources (NCRR). Its contents are solely the responsibility of the authors and do not necessarily represent the official views of the NCRR or the NIH.
Footnotes
SUPPLEMENTAL INFORMATION
Supplemental Information can be found online at https://doi.org/10.1016/j.celrep.2020.107989.
REFERENCES
- Austin S, Tavakoli M, Pfeiffer C, Seifert J, Mattarei A, De Stefani D, Zoratti M, and Nowikovsky K (2017). LETM1-Mediated K+ and Na+ Homeostasis Regulates Mitochondrial Ca2+ Efflux. Front. Physiol 8, 839. [DOI] [PMC free article] [PubMed] [Google Scholar]
- Banerjee S, and Chinthapalli B (2014). A proteomic screen with Drosophila Opa1-like identifies Hsc70–5/Mortalin as a regulator of mitochondrial morphology and cellular homeostasis. Int. J. Biochem. Cell Biol 54, 36–48. [DOI] [PubMed] [Google Scholar]
- Barbot M, Jans DC, Schulz C, Denkert N, Kroppen B, Hoppert M, Jakobs S, and Meinecke M (2015). Mic10 oligomerizes to bend mitochondrial inner membranes at cristae junctions. Cell Metab. 21, 756–763. [DOI] [PubMed] [Google Scholar]
- Berson A, Goodman LD, Sartoris AN, Otte CG, Aykit JA, Lee VM, Trojanowski JQ, and Bonini NM (2019). Drosophila Ref1/ALYREF regulates transcription and toxicity associated with ALS/FTD disease etiologies. Acta Neuropathol. Commun 7, 65. [DOI] [PMC free article] [PubMed] [Google Scholar]
- Brown RH, and Al-Chalabi A (2017). Amyotrophic Lateral Sclerosis. N. Engl. J. Med 377, 162–172. [DOI] [PubMed] [Google Scholar]
- Choi SY, Lopez-Gonzalez R, Krishnan G, Phillips HL, Li AN, Seeley WW, Yao WD, Almeida S, and Gao FB (2019). C9ORF72-ALS/FTD-associated poly(GR) binds Atp5a1 and compromises mitochondrial function in vivo. Nat. Neurosci 22, 851–862. [DOI] [PMC free article] [PubMed] [Google Scholar]
- Chou SM, and Norris FH (1993). Amyotrophic lateral sclerosis: lower motor neuron disease spreading to upper motor neurons. Muscle Nerve 16, 864–869. [DOI] [PubMed] [Google Scholar]
- DeJesus-Hernandez M, Mackenzie IR, Boeve BF, Boxer AL, Baker M, Rutherford NJ, Nicholson AM, Finch NA, Flynn H, Adamson J, et al. (2011). Expanded GGGGCC hexanucleotide repeat in noncoding region of C9ORF72 causes chromosome 9p-linked FTD and ALS. Neuron 72, 245–256. [DOI] [PMC free article] [PubMed] [Google Scholar]
- Dimmer KS, Navoni F, Casarin A, Trevisson E, Endele S, Winterpacht A, Salviati L, and Scorrano L (2008). LETM1, deleted in Wolf-Hirschhorn syndrome is required for normal mitochondrial morphology and cellular viability. Hum. Mol. Genet 17, 201–214. [DOI] [PubMed] [Google Scholar]
- Dobrowolny G, Aucello M, Rizzuto E, Beccafico S, Mammucari C, Bon-compagni S, Belia S, Wannenes F, Nicoletti C, Del Prete Z, et al. (2008). Skeletal muscle is a primary target of SOD1G93A-mediated toxicity. Cell Metab. 8, 425–436. [DOI] [PubMed] [Google Scholar]
- Freibaum BD, Lu Y, Lopez-Gonzalez R, Kim NC, Almeida S, Lee KH, Badders N, Valentine M, Miller BL, Wong PC, et al. (2015). GGGGCC repeat expansion in C9orf72 compromises nucleocytoplasmic transport. Nature 525, 129–133. [DOI] [PMC free article] [PubMed] [Google Scholar]
- Frezza C, Cipolat S, Martins de Brito O, Micaroni M, Beznoussenko GV, Rudka T, Bartoli D, Polishuck RS, Danial NN, De Strooper B, and Scorrano L (2006). OPA1 controls apoptotic cristae remodeling independently from mitochondrial fusion. Cell 126, 177–189. [DOI] [PubMed] [Google Scholar]
- Gendron TF, and Petrucelli L (2018). Disease Mechanisms of C9ORF72 Repeat Expansions. Cold Spring Harb. Perspect. Med 8, a024224. [DOI] [PMC free article] [PubMed] [Google Scholar]
- Guarani V, McNeill EM, Paulo JA, Huttlin EL, Fröhlich F, Gygi SP, Van Vactor D, and Harper JW (2015). QIL1 is a novel mitochondrial protein required for MICOS complex stability and cristae morphology. eLife 4, e06265. [DOI] [PMC free article] [PubMed] [Google Scholar]
- He H, Huang W, Wang R, Lin Y, Guo Y, Deng J, Deng H, Zhu Y, Allen EG, Jin P, and Duan R (2019). Amyotrophic Lateral Sclerosis-associated GGGGCC repeat expansion promotes Tau phosphorylation and toxicity. Neurobiol. Dis 130, 104493. [DOI] [PubMed] [Google Scholar]
- Hegazy AM, Yamada D, Kobayashi M, Kohno S, Ueno M, Ali MA, Ohta K, Tadokoro Y, Ino Y, Todo T, et al. (2016). Therapeutic Strategy for Targeting Aggressive Malignant Gliomas by Disrupting Their Energy Balance. J. Biol. Chem 291, 21496–21509. [DOI] [PMC free article] [PubMed] [Google Scholar]
- Jaiswal M, Sandoval H, Zhang K, Bayat V, and Bellen HJ (2012). Probing mechanisms that underlie human neurodegenerative diseases in Drosophila. Annu. Rev. Genet 46, 371–396. [DOI] [PMC free article] [PubMed] [Google Scholar]
- Jiang D, Zhao L, and Clapham DE (2009). Genome-wide RNAi screen identifies Letm1 as a mitochondrial Ca2+/H+ antiporter. Science 326, 144–147. [DOI] [PMC free article] [PubMed] [Google Scholar]
- John GB, Shang Y, Li L, Renken C, Mannella CA, Selker JM, Rangell L, Bennett MJ, and Zha J (2005). The mitochondrial inner membrane protein mitofilin controls cristae morphology. Mol. Biol. Cell 16, 1543–1554. [DOI] [PMC free article] [PubMed] [Google Scholar]
- Jokela M, Huovinen S, Raheem O, Lindfors M, Palmio J, Penttilä S, and Udd B (2016). Distinct Muscle Biopsy Findings in Genetically Defined Adult-Onset Motor Neuron Disorders. PLOS ONE 11, e0151376. [DOI] [PMC free article] [PubMed] [Google Scholar]
- Konrad C, Kawamata H, Bredvik KG, Arreguin AJ, Cajamarca SA, Hupf JC, Ravits JM, Miller TM, Maragakis NJ, Hales CM, et al. (2017). Fibroblast bioenergetics to classify amyotrophic lateral sclerosis patients. Mol. Neurodegener 12, 76. [DOI] [PMC free article] [PubMed] [Google Scholar]
- Koob S, and Reichert AS (2014). Novel intracellular functions of apolipoproteins: the ApoO protein family as constituents of the Mitofilin/MINOS complex determines cristae morphology in mitochondria. Biol. Chem 395, 285–296. [DOI] [PubMed] [Google Scholar]
- Kramer NJ, Carlomagno Y, Zhang YJ, Almeida S, Cook CN, Gendron TF, Prudencio M, Van Blitterswijk M, Belzil V, Couthouis J, et al. (2016). Spt4 selectively regulates the expression of C9orf72 sense and antisense mutant transcripts. Science 353, 708–712. [DOI] [PMC free article] [PubMed] [Google Scholar]
- Lee KH, Zhang P, Kim HJ, Mitrea DM, Sarkar M, Freibaum BD, Cika J, Coughlin M, Messing J, Molliex A, et al. (2016). C9orf72 Dipeptide Repeats Impair the Assembly, Dynamics, and Function of Membrane-Less Organelles. Cell 167, 774–788.e17. [DOI] [PMC free article] [PubMed] [Google Scholar]
- Liu Y, Pattamatta A, Zu T, Reid T, Bardhi O, Borchelt DR, Yachnis AT, and Ranum LP (2016). C9orf72 BAC Mouse Model with Motor Deficits and Neurodegenerative Features of ALS/FTD. Neuron 90, 521–534. [DOI] [PubMed] [Google Scholar]
- Loeffler JP, Picchiarelli G, Dupuis L, and Gonzalez De Aguilar JL (2016). The Role of Skeletal Muscle in Amyotrophic Lateral Sclerosis. Brain Pathol. 26, 227–236. [DOI] [PMC free article] [PubMed] [Google Scholar]
- Lopez-Gonzalez R, Yang D, Pribadi M, Kim TS, Krishnan G, Choi SY, Lee S, Coppola G, and Gao FB (2019). Partial inhibition of the overactivated Ku80-dependent DNA repair pathway rescues neurodegeneration in C9ORF72-ALS/FTD. Proc. Natl. Acad. Sci. USA 116, 9628–9633. [DOI] [PMC free article] [PubMed] [Google Scholar]
- Lynch E, Semrad T, Belsito VS, FitzGibbons C, Reilly M, Hayakawa K, and Suzuki M (2019). C9ORF72-related cellular pathology in skeletal myocytes derived from ALS-patient induced pluripotent stem cells. Dis. Model. Mech 12, dmm039552. [DOI] [PMC free article] [PubMed] [Google Scholar]
- McCauley ME, and Baloh RH (2019). Inflammation in ALS/FTD pathogenesis. Acta Neuropathol. 137, 715–730. [DOI] [PMC free article] [PubMed] [Google Scholar]
- Mizielinska S, Grönke S, Niccoli T, Ridler CE, Clayton EL, Devoy A, Moens T, Norona FE, Woollacott IOC, Pietrzyk J, et al. (2014). C9orf72 repeat expansions cause neurodegeneration in Drosophila through arginine-rich proteins. Science 345, 1192–1194. [DOI] [PMC free article] [PubMed] [Google Scholar]
- Moens TG, Niccoli T, Wilson KM, Atilano ML, Birsa N, Gittings LM, Holbling BV, Dyson MC, Thoeng A, Neeves J, et al. (2019). C9orf72 argi-nine-rich dipeptide proteins interact with ribosomal proteins in vivo to induce a toxic translational arrest that is rescued by eIF1A. Acta Neuropathol. 137, 487–500. [DOI] [PMC free article] [PubMed] [Google Scholar]
- Moloney EB, de Winter F, and Verhaagen J (2014). ALS as a distal axon-opathy: molecular mechanisms affecting neuromuscular junction stability in the presymptomatic stages of the disease. Front. Neurosci 8, 252. [DOI] [PMC free article] [PubMed] [Google Scholar]
- Nowikovsky K, Froschauer EM, Zsurka G, Samaj J, Reipert S, Kolisek M, Wiesenberger G, and Schweyen RJ (2004). The LETM1/YOL027 gene family encodes a factor of the mitochondrial K+ homeostasis with a potential role in the Wolf-Hirschhorn syndrome. J. Biol. Chem 279, 30307–30315. [DOI] [PubMed] [Google Scholar]
- Nowikovsky K, Reipert S, Devenish RJ, and Schweyen RJ (2007). Mdm38 protein depletion causes loss of mitochondrial K+/H+ exchange activity, osmotic swelling and mitophagy. Cell Death Differ. 14, 1647–1656. [DOI] [PubMed] [Google Scholar]
- Palomo GM, and Manfredi G (2015). Exploring new pathways of neurodegeneration in ALS: the role of mitochondria quality control. Brain Res. 1607, 36–46. [DOI] [PMC free article] [PubMed] [Google Scholar]
- Pansarasa O, Rossi D, Berardinelli A, and Cereda C (2014). Amyotrophic lateral sclerosis and skeletal muscle: an update. Mol. Neurobiol 49, 984–990. [DOI] [PubMed] [Google Scholar]
- Renton AE, Majounie E, Waite A, Simón-Sánchez J, Rollinson S, Gibbs JR, Schymick JC, Laaksovirta H, van Swieten JC, Myllykangas L, et al. ; ITALSGEN Consortium (2011). A hexanucleotide repeat expansion in C9ORF72 is the cause of chromosome 9p21-linked ALS-FTD. Neuron 72, 257–268. [DOI] [PMC free article] [PubMed] [Google Scholar]
- Schorr S, and van der Laan M (2018). Integrative functions of the mitochondrial contact site and cristae organizing system. Semin. Cell Dev. Biol 76, 191–200. [DOI] [PubMed] [Google Scholar]
- Simone R, Balendra R, Moens TG, Preza E, Wilson KM, Heslegrave A, Woodling NS, Niccoli T, Gilbert-Jaramillo J, Abdelkarim S, et al. (2018). G-quadruplex-binding small molecules ameliorate C9orf72 FTD/ALS pathology in vitro and in vivo. EMBO Mol. Med 10, 22–31. [DOI] [PMC free article] [PubMed] [Google Scholar]
- Takahashi A, Philpott DE, and Miquel J (1970). Electron microscope studies on aging Drosophila melanogaster. 3. Flight muscle. J. Gerontol 25, 222–228. [DOI] [PubMed] [Google Scholar]
- Taylor JP, Brown RH Jr., and Cleveland DW (2016). Decoding ALS: from genes to mechanism. Nature 539, 197–206. [DOI] [PMC free article] [PubMed] [Google Scholar]
- Wollweber F, von der Malsburg K, and van der Laan M (2017). Mitochondrial contact site and cristae organizing system: a central player in membrane shaping and crosstalk. Biochim. Biophys. Acta Mol. Cell Res. 1864, 1481–1489. [DOI] [PubMed] [Google Scholar]
- Wong M, and Martin LJ (2010). Skeletal muscle-restricted expression of human SOD1 causes motor neuron degeneration in transgenic mice. Hum. Mol. Genet 19, 2284–2302. [DOI] [PMC free article] [PubMed] [Google Scholar]
- Xu W, and Xu J (2018). C9orf72 Dipeptide Repeats Cause Selective Neuro-degeneration and Cell-Autonomous Excitotoxicity in Drosophila Glutamatergic Neurons. J. Neurosci 38, 7741–7752. [DOI] [PMC free article] [PubMed] [Google Scholar]
- Xu Z, Poidevin M, Li X, Li Y, Shu L, Nelson DL, Li H, Hales CM, Gearing M, Wingo TS, and Jin P (2013). Expanded GGGGCC repeat RNA associated with amyotrophic lateral sclerosis and frontotemporal dementia causes neurodegeneration. Proc. Natl. Acad. Sci. USA 110, 7778–7783. [DOI] [PMC free article] [PubMed] [Google Scholar]
- Yang D, Abdallah A, Li Z, Lu Y, Almeida S, and Gao FB (2015). FTD/ALS-associated poly(GR) protein impairs the Notch pathway and is recruited by poly(GA) into cytoplasmic inclusions. Acta Neuropathol. 130, 525–535. [DOI] [PMC free article] [PubMed] [Google Scholar]
- Yuva-Aydemir Y, Almeida S, and Gao FB (2018). Insights into C9ORF72-Related ALS/FTD from Drosophila and iPSC Models. Trends Neurosci. 41, 457–469. [DOI] [PMC free article] [PubMed] [Google Scholar]
- Zhang K, Donnelly CJ, Haeusler AR, Grima JC, Machamer JB, Steinwald P, Daley EL, Miller SJ, Cunningham KM, Vidensky S, et al. (2015). The C9orf72 repeat expansion disrupts nucleocytoplasmic transport. Nature 525, 56–61. [DOI] [PMC free article] [PubMed] [Google Scholar]
Associated Data
This section collects any data citations, data availability statements, or supplementary materials included in this article.
Supplementary Materials
Data Availability Statement
Original/source data for all figures in the paper is available at Mendeley Data: https://data.mendeley.com/datasets/sd3rtdy7sn/1