

SUMMARY
Interactions between the genome and the nuclear pore complex (NPC) have been implicated in multiple gene regulatory processes, but the underlying logic of these interactions remains poorly defined. Here, we report high-resolution chromatin binding maps of two core components of the NPC, Nup107 and Nup93, in Drosophila cells. Our investigation uncovered differential binding of these NPC subunits, where Nup107 preferentially targets active genes while Nup93 associates primarily with Polycomb-silenced regions. Comparison to Lamin-associated domains (LADs) revealed that NPC binding sites can be found within LADs, demonstrating a linear binding of the genome along the nuclear envelope. Importantly, we identified a functional role of Nup93 in silencing of Polycomb target genes and in spatial folding of Polycomb domains. Our findings lend to a model where different nuclear pores bind different types of chromatin via interactions with specific NPC sub-complexes, and a subset of Polycomb domains is stabilized by interactions with Nup93.
eTOC BLURB
In this study, Gozalo and Duke et al. analyze chromatin-binding profiles of nuclear pore components Nup107 and Nup93, and discover that while Nup107 targets active genes, Nup93 targets Polycomb domains and promotes long-tange contacts of Polycomb sites. These findings provide insight into how nuclear pore-genome interactions shape spatial genome architecture.
Graphical Abstract
INTRODUCTION
Spatial architecture in the nucleus is set up by interactions between the genome and protein components of nuclear macro-complexes and scaffolds. The most prominent nuclear scaffold is the Nuclear Envelope (NE), which consists of a double membrane interspersed by a variety of trans-membrane and closely associated proteins (Schirmer and Gerace, 2005). Chromatin re-organization and gene re-positioning during cellular differentiation involves losing or gaining interactions between the genome and the NE, and such rearrangements can influence gene expression programs (Wong et al., 2014). For instance, the nuclear lamina, which is a filamentous protein network underlying the NE, has been extensively implicated in setting up tissue-specific genome organization by sequestering genes destined for silencing (Amendola and van Steensel, 2014; Poleshko et al., 2017). Genome-wide mapping of Lamin-associated domains (LADs), as well as related functional studies, have led to the current view of the nuclear lamina as a compartment for stable gene repression (reviewed in (van Steensel and Belmont, 2017)). Another major component of the NE is the Nuclear Pore Complex (NPC), which consists of multiple copies of approximately 30 different proteins termed Nucleoporins (Nups) and is responsible for selective nucleo-cytoplasmic transport (Wente and Rout, 2010). In addition to transport-related functions, NPCs and individual Nups are also involved in genome organization and gene regulation through physical interactions with the genome (Buchwalter et al., 2019; Raices and D’Angelo, 2017; Sood and Brickner, 2014). Yet unlike the nuclear lamina, the functional relationship between NPCs and genome regulation appears to be considerably more varied and remains less understood.
Given the close proximity of nuclear pores to the underlying chromatin, it is not surprising that multiple studies have now identified binding of Nups to subsets of genes and regulatory elements in a number of species (Ptak and Wozniak, 2016; Talamas and Capelson, 2015). Many of these studies have reported preferential association of particular Nups with actively transcribing genes (Capelson et al., 2010; Casolari et al., 2005; Casolari et al., 2004; Ibarra et al., 2016; Kalverda et al., 2010; Liang et al., 2013; Light et al., 2013; Pascual-Garcia et al., 2017; Vaquerizas et al., 2010), or re-localization of genes to the NPCs during activation (Ahmed et al., 2010; Luthra et al., 2007; Rohner et al., 2013; Schmid et al., 2006). These findings have led to the predominant view of the NPC as a nuclear compartment for active processes, functionally opposed to those of the nuclear lamina. However, at least in metazoan systems, this view is confounded by the reported intranuclear presence of Nups that have been classified as dynamic (Capelson et al., 2010; Kalverda et al., 2010; Vaquerizas et al., 2010). The ~30 conserved Nups that comprise the NPC can be either dynamic, meaning they are able to come on and off the NPC during interphase, or stable, meaning they are core components of the NE-embedded NPC for the majority of the cell cycle (Rabut et al., 2004b). Currently, many of the reported contacts between active genes and Nups have been described for dynamic Nups, such as Nup98, Nup153, and Nup62, and can frequently occur in the nucleoplasm (Franks et al., 2016; Kalverda et al., 2010; Liang and Hetzer, 2011; Light et al., 2013). Consequently, it is unclear whether genomic binding to actual NPCs is functionally distinct from intranuclear Nup binding.
Genomic binding to actual NPCs can be determined by mapping chromatin-binding patterns of stable Nups, which are components of the outer-ring Nup107-Nup160 and the inner-ring Nup93-Nup205 sub-complexes (D’Angelo and Hetzer, 2008; Kelley et al., 2015; von Appen et al., 2015). Interestingly, previous studies that profiled chromatin binding of stable Nups did not identify enrichment for transcribing loci and reported prevalence of repressive chromatin (Brown et al., 2008; Casolari et al., 2004; Van de Vosse et al., 2013). Similarly, DamID profiling of Nup98, artificially tethered to the NPC and thus used as a marker for actual NPC binding, showed no enrichment for active genes and instead, exhibited high incidence of motifs for the architectural protein Su(Hw) in Drosophila cells (Kalverda and Fornerod, 2010; Kalverda et al., 2010). These studies conflict with the simplified view of the NPC as a scaffold for gene activation, and highlight the complexity of NPC-genome interactions. It should be noted that the majority of the NPC genome-binding datasets, mentioned above, were produced using either the DamID technique, which tends to generate wide binding peaks, or the lower-resolution ChIP-chip approach, and thus may have given an incomplete picture of the locations and functions of NPC-genome contacts.
One hypothesis, which can explain this dichotomy of both active and silent regions at the NPC, is that individual stable Nups bind distinct regions of the genome and regulate distinct chromatin-associated processes. We set out to explore this hypothesis by generating precise binding maps of stable Nups, using an optimized ChIP-seq approach. Our ChIP-seq maps revealed that Nup107, a core component of the outer ring sub-complex, and Nup93, a core component of the inner ring sub-complex, bind highly non-overlapping regions of the genome. Specifically, while Nup107 preferentially targets active promoters, as has been reported for other Nups, Nup93 associates primarily with silenced regions bound by Polycomb Group (PcG) proteins. PcG proteins are conserved regulators of epigenetically maintained gene repression, which often bind the genome in long Polycomb (Pc) domains (Cheutin and Cavalli, 2014). In agreement with its binding pattern, we found that Nup93 plays a functional role in the silencing and long-range interactions of Pc targets. Together, our results emphasize the concept that different sub-complexes of the nuclear pore interact with and influence distinct chromatin states, revealing a complex landscape of NE-genome interactions.
Results
1. Stable NPC components Nup107 and Nup93 bind distinct chromatin regions.
To determine genome-wide distribution of stable NPC subunits, we carried out ChIP-seq analysis on Drosophila embryonic S2 culture cells, using antibodies to Nup93 and Nup107, as well as to the Nup Elys. Nup93 and Nup107 are core components of the NPC inner and outer ring sub-complexes, respectively (Figure 1A). Both of these Nups have been found to exhibit long residence times at the NPC, as judged from previous protein turnover studies in vivo (Rabut et al., 2004a). Thus identified binding sites of these Nups would likely be enriched for genomic binding of actual nuclear pores, as opposed to nucleoplasmic binding of dynamic Nups. Although the residence time of Elys at the NPC has not been measured, homologues of Elys in C.elegans and X. Laevis have been shown to recruit the Nup107 sub-complex to chromatin during post-mitotic NPC formation (Aze et al., 2017; Franz et al., 2007; Rasala et al., 2006).
Figure 1. Stable nuclear pore components bind distinct chromatin regions.

(A) Nuclear pore diagram. NPC components selected for this study from the inner ring (blue) and the outer ring (red) sub-complexes are highlighted in white. (B) Representative ~200 Kb genome browser (GB) snapshot of two biological replicates of Elys, Nup93 and Nup107 ChIP-seq experiments in S2 cells. (C) Enrichment heatmaps of ChIP-seq identified peaks of Elys, Nup93 and Nup107, sorted by peak intensity (rpm/bp) of the indicated Nup and aligned by their distance from the peak center along the genome (Kb). (D) Venn diagrams of ChIP-seq peaks that exhibit shared occupancy between different Nups. Odds ratios and p values calculated using Fisher’s exact test. See also Figure S1.
We optimized the ChIP-seq approach to obtain highly reproducible chromatin binding profiles of Nup93, Nup107, and Elys (Figures 1B, S1A). Most of the obtained binding peaks were shared between biological replicates for a given Nup, and principal component analysis (PCA) revealed high level of clustering between individual ChIP-seq replicates (Figure S1A). The antibodies to Drosophila Nup93 and Elys were previously generated and characterized for ChIP-seq application (Pascual-Garcia et al., 2017). For this study, we also generated an antibody to Drosophila Nup107, and have validated this antibody using RNAi and western blotting, immunofluorescent co-staining with a well-characterized NPC marker antibody mAb414 (Davis and Blobel, 1987; Doucet et al., 2010), and ChIP-qPCR (Figure S1B–D). Given that Nup107 is required for NPC biogenesis, we were only able to deplete Nup107 partially (Figure S1B), due to severe effects of further depletion on cell viability. Consistently, we obtained a partial reduction in the amount of Nup107 ChIP-qPCR signal in Nup107 RNAi conditions (Figure S1D). Together, these results support our use of the generated Nup107 antibody.
The obtained binding profiles of Nup107 and Nup93 showed little overlap, suggesting that these two core NPC components bind unique sites in the genome (Figure 1B–D). The majority of Nup93 binding peaks (70%) did not overlap with mapped Nup107 peaks, and 93% of Nup107 binding peaks showed no overlap with Nup93 peaks (Figure 1C–D). This is in contrast to overlap of either Nup to Elys: Elys was found to co-localize with the majority of Nup107 peaks (84%) and with the majority, though to a lesser extent, of Nup93 peaks (63%) (Figure 1D). The overlap between all 3 pairs of Nups was found to be significant over randomly shuffled control dataset (Figure 1D, Fisher’s exact test), but the derived odds ratios were expectedly higher for Elys/Nup107 and Elys/Nup93 overlaps than for Nup93/Nup107 overlap. In agreement with the low level of overlap between Nup93 and Nup107, the majority of Nup93-containing sites of Elys were found to be distinct from Nup107-containing Elys sites (Figures 1C, first column, and S1E). ChIP-seq dataset of Elys also contained a large fraction of binding sites that did not co-localize with either core Nup (Figure 1C), likely representing intranuclear binding of Elys to chromatin.
Consistently, ChIP-seq profiles of Nup107 and Nup93 exhibited apparent differences in overall distribution of genomic elements (Figure S1F). All 3 analyzed Nups were found to bind both heterochromatic and euchromatic regions, with 50–75% of called peaks mapping to euchromatic chromosomal arms (Figure S1F). The most frequently observed category in Nup107 and combined Nup107/Elys datasets were promoter/TSS elements, which is in line with previously reported binding of Nups such as Nup98 (Liang et al., 2013; Pascual-Garcia et al., 2014). On the other hand, the most frequently observed category among Nup93 binding peaks was intronic sequences (Figure S1F), suggesting that this Nup binds unique genomic elements.
2. Nup93 binding sites display a unique correspondence to Polycomb-bound regions.
To determine what defines the difference in binding between the two stable NPC subunits, we compared the binding of analyzed Nups to previously defined chromatin states (Filion et al., 2010; Kharchenko et al., 2011). Prior computational classification of genome-wide distributions of chromatin proteins and transcriptional activity yielded either 5 or 9 distinct chromatin types or “colors” in the fly genome (Filion et al., 2010; Kharchenko et al., 2011). The 5 chromatin color model, derived from analysis of DamID and ChIP profiles in Kc167 cells, divides the genome into the active Red or Yellow states, and into the repressed Blue (enriched for PcG proteins), Green (enriched for HP1), and Black (enriched for Lamin and histone H1) states (Filion et al., 2010). The 9 chromatin color model, obtained by a combinatorial analysis of ChIP and GRO-seq profiles in S2 cells, yields similar chromatin types, but with 4 different states of active chromatin, including active promoters/TSS sites (state 1, Red), transcriptional elongation (state 2, Purple), and regulatory/enhancer elements (state 3, Brown) (Kharchenko et al., 2010). The repressive chromatin states in this model similarly include the PcG-enriched chromatin (state 6, Grey), HP1-enriched chromatin (states 7 and 8, Blue) and a state, not strongly enriched for any mark (state 9, White).
The ChIP-seq profiles of Nup107 and Nup93 were found to contain strikingly different distributions of chromatin colors defined by either model (Figures 2A, S2A). Nup107 or common Nup107-Elys peaks showed strong preference for the Yellow and the state 1/Red active states, which is consistent with previously identified roles of Nups in active transcription (Menon et al., 2005; Sood and Brickner, 2014). These states were significantly enriched among Nup107 and Nup107/Elys peaks, relative to randomly shuffled regions (Figure S2A, p-values < 0.01). In contrast, Nup93 or common Nup93-Elys peaks displayed a high and significant enrichment for the Polycomb state (Blue or state 6/Grey, Figures 2A and S2A), revealing that this core Nup commonly binds to repressed targets of PcG proteins. Interestingly, the second most abundant state observed for Nup93 and Nup93-Elys peaks was state 3, which is characterized by enhancer marks H3K4Me1 and H3K27acetyl (Figure 2A). This is in line with previous work that identified presence of Nup93 at super-enhancers in human cells (Ibarra et al., 2016).
Figure 2. Nup93 is selectively targeted to Polycomb domains.

(A) Stacked bar graphs of ChIP-Seq binding sites for the indicated Nups to different types of chromatin colors, representing distinct chromatin states according to previous classifications of 5 or 9 states (described in text) as well as the distribution of these colors in the whole genome. (B) Representative GB snapshots of the vestigial locus (100 Kb, left) and the Wingless locus (100Kb, right) with Nup93, Elys, Nup107, Pc, and H3K27me3 ChIP-seq, Pc BioTAP tracks, and Chromatin colors (5 state model). Note the close overlap of Nup93 with Pc binding sites. (C) Enrichment heatmaps of ChIP-seq peaks, sorted by peak intensity (rpm/bp) of Nup93 (left) and Nup107 (right) compared with ChIP-seq and BioTAP identified binding sites of Pc and aligned by their distance from the peak center along the genome (Kb). See also Figure S2.
In agreement with its chromatin color enrichment, we observed a prominent co-localization of Nup93 with genome-wide chromatin binding maps of Pc and H3K27Me3 ((Jung et al., 2015) and mapped by modENCODE) (Figure 2B–C, S2B), while Nup107 appeared to have an anti-correlation (Figures 2C, S2B). Many of the co-localizing Nup93-Pc sites corresponded to genes of key developmental regulators, such as Wingless (Wg) and vestigial (vg), and were generally enriched for GO terms of tissue-specific development (Figures 2B, S2C). Furthermore, we detected binding of Nup93 at several locations, which correspond to previously characterized Polycomb response elements (PREs), such as the well-studied PREs of the engrailed and inv genes (Kassis and Brown, 2013) (Figure S2D). In Drosophila, PREs are DNA elements that are required for PcG-mediated silencing and believed to be responsible for the recruitment of the PRC1 complex (Americo et al., 2002; DeVido et al., 2008; Kassis, 1994). Together, we conclude that stable NPC component Nup93 can target binding sites of PcG proteins, suggesting that Nup93 may play a role in PcG-mediated repression.
3. A fraction of previously defined LADs contain NPC binding sites.
The NE contains both nuclear lamina and NPCs, and cytological images show the close physical proximity of the two protein structures along the NE (Talamas and Capelson, 2015), yet the relationship between genomic binding of NPCs and genomic binding of the nuclear lamina has not been clearly described. In fact, it has been proposed that NPC binding sites are not in close proximity to LADs along the genome, and that LADs do not generally contain binding sites of NPCs (van Steensel and Belmont, 2017). Thus, to further investigate the relationship between LADs and NPCs, we compared our generated binding maps of Nup93 and Nup107 to previously published LAD datasets, obtained in a related Kc167 (Kc) cell type (Filion et al., 2010; Pickersgill et al., 2006; van Bemmel et al., 2010). Additionally, previously reported long residence times of Nup93 and Nup107 at the NPCs (D’Angelo et al., 2009; Rabut et al., 2004a) do not exclude the possibility that non-exchanging intranuclear pools of these proteins exist. Thus by comparing to LAD datasets we aimed to obtain additional evidence for the NPC/nuclear periphery localization of the detected chromatin binding of these Nups.
Comparison of our Nup ChIP-seq datasets to LADs revealed a high incidence of Nup binding sites within previously mapped LADs. We found that 17–22% of Nup binding peaks map within LADs, and additional 6–10% are found within 5 kb LAD boundaries (Figure 3A). Furthermore, as many as 79% of LADs appear to include binding sites of either Nup107 or Nup93, and additional 8% of 2 kb LAD boundaries contain Nup binding sites (Figure 3B). The partial overlap of LADs and Nups further supports the notion that at least a fraction of the Nup binding sites we obtained corresponds to NPC binding sites at the nuclear periphery. It also indicates that currently identified LADs can contain NPC binding sites. In further support of this idea, we noticed cases, where dips in the Lamin DamID signal overlap with Nup binding peaks, when comparing to raw signal of published Lamin DamID datasets (van Bemmel et al., 2010) (Figures 3C). Genome-wide, we similarly observed a partial correlation of Nup93 binding sites to lower Lamin signal within LADs, particularly for the most robust Nup93 peaks (Figure S3C). Interestingly, such dips or interruptions in Lamin DamID signal within mapped LADs have been previously reported in mammalian cells, where they have been proposed to represent distinct chromatin environments (Luperchio et al., 2018). It appears possible that some such interruptions can correspond to NPC-bound chromatin, and thus represent functionally distinct compartments of chromatin at the nuclear periphery. It should be noted however, that since the correlation we observe between Nups and dips in Lamin signal is only partial, the notion that such dips are biologically meaningful requires additional future examination.
Figure 3. Binding sites of stable Nups can occur within previously identified LADs.

(A) Percent Nup93 and Nup107/Elys Chip-seq peaks within LAD interiors, LAD boundaries (+/− 5 Kb from LAD ends), and non-LAD regions, using previously defined LAD datasets (described in text). (B) Percent of previously defined LADs and LAD boundaries (+/− 2 Kb from LAD ends) which include ChIP-seq peaks of Nup93, Nup107, both, or neither. (C) Representative GB snapshots of LADs (described in text) and chromatin colors, which contain Nup93 binding (Soxn locus – 270 Kb, top) or Nup107/Elys binding (Stumps locus – 130 Kb/put locus, bottom). (D) Distribution of chromatin colors (5 colors – left, 9 colors - right) that correspond to Nup binding sites found within LADs (in LAD interiors only). See also Figure S3.
Binding sites of Nup93 and Nup107, both within LADs and LAD boundaries, still showed preferential abundance of PcG chromatin or active chromatin, respectively (Figures 3D, S3A–B). This correspondence can also been seen at individual targets of Nup93 and Nup107, such as the SoxN and the Put loci (Figure 3C). At the Put locus, for example, a Nup107/Elys binding site overlaps with a small pocket of Red/Yellow state chromatin within a larger block of Black state chromatin (Figure 3C).
Although S2 and Kc cells are known to have quite similar expression and chromatin profiles, differences between them also exist (Roy et al., 2010), and our Nup ChIP-seq experiments were performed in S2 cells, as opposed to Kc cells. To corroborate our comparison between Nup and LADs, we analyzed chromatin distribution of Lamin in S2 and Kc cells by ChIP-seq, using antibody L7 to B-type Lamin Dm0 (Osouda et al., 2005). The obtained Lamin ChIP-seq profiles displayed similar levels of enrichment of reads over existing DamID-derived LADs between Kc and S2 cells (Figure S3D), supporting the validity of our ChIP-seq approach and the general similarity in Lamin distribution between Kc and S2 cells. Furthermore, we observed a high level of correlation between S2 and Kc Lamin ChIP-seq datasets, with correlation values of 0.88–0.92, as compared to the correlation values of 0.95–0.98 between replicates in a given cell type (Figure S3E). At a number of loci, such as the SoxN locus, we observed high correspondence in sequencing reads of Lamin ChIP-seq between Kc and S2 cells (Figure S3F). The observed similarity in Lamin ChIP-seq between S2 and Kc cells supports our general conclusions on the relationship between LADs and Nup chromatin binding, but further work will be required to confirm this relationship in a case-by-case manner.
Our comparison between LADs and Nup binding supports the notion that a considerable fraction (at least 17%–22%) of the obtained Nup binding sites are localized at the nuclear periphery, likely as part of the actual NPCs. To further validate this point, we carried out immunofluorescence analysis of nuclear distribution of these Nups, as recognized by our antibodies and as compared to the staining of the mAb414 antibody (Figure S3G). Visually, we detected the overwhelming majority of the signal for either antibody to localize to the nuclear periphery and co-localize with mAb414 antibody (Figure S3G–H). Signal correlation analysis between Nup107 or Nup93 with mAb414 (vs. DAPI and randomized pixels as controls) yielded high Pearson correlation coefficients between each stable Nup and mAb414, as opposed to controls (Figure S3K), indicative of much higher co-localization of Nup107 or Nup93 with peripheral signal (mAb414) vs. intranuclear signal (DAPI). Additionally, we assessed the fraction of each Nup antibody signal that overlaps with mAb414 signal, using Mander’s overlap coefficient (described in STAR Methods), and found the mean coefficients from analyzed images to be 0.94–0.98 (Figure S3J), indicative of 94–98% of Nup107 and Nup93 signal co-localizing with mAb414 signal. This co-localization was also consistent with quantification of the fraction of internal signal from obtained line scans through nuclei in our images, which yielded internal signal fractions of 2.7–6.0% (Figures S3H, S3K). Although at present, we cannot completely rule out that a small or a currently undetectable intranuclear pool of these Nups interacts with chromatin, we can infer from the analysis presented above that a sizable fraction of the detected binding peaks of Nup93 and Nup107 represents genomic binding of NPCs.
4. Nup93 associates with high-occupancy Polycomb domains and with PRC1/2 components.
The robust co-localization of Nup93 with Pc peaks (Figure 2) suggests that a subset of PcG domains is targeted by Nup93. Our findings are consistent with earlier studies, which demonstrated an enrichment of repressive histone marks in the Nup93 ChIP-chip from HeLa cells (Brown et al., 2008) and which revealed binding of Nup93 to PcG-repressed HoxA genes in colorectal cancer cells (Labade et al., 2016). LADs have similarly been found to exhibit a partial overlap with PcG domains (Peric-Hupkes et al., 2010), and the H3K27Me3 mark has been shown to be involved in targeting of LAD regions to the nuclear periphery (Harr et al., 2015). Nonetheless, it remains unclear whether targeting to the nuclear lamina is a component of PcG-mediated repression.
To investigate these relationships, we partitioned classified PcG domains into those that overlap with Nup93, LADs, or neither (Figure 4A). According to this analysis, approximately one third of PcG domains contain Nup93, either with or without nearby LADs. Interestingly, we found that the Nup93-containing PcG domains contain much higher levels of Pc ChIP-seq signal on average, relative to LAD-overlapping PcG domains or those that overlap with neither (Figure 4A). Visual inspection similarly revealed a high level of correlation between Nup93 binding peaks and the most pronounced Pc peaks (Figure 4B). Some of the well-known targets of PcG silencing, such as Hox genes Abd-B and Antp, were found within the Pc/Nup93 peak category (Figure S4A). Furthermore, within LADs that also contain Nup93, we still observed considerably higher amount of Pc signal overlapping with Nup93 peaks than with the non-Nup93 portion of the LADs (Figure S4A). These distributions suggest that Nup93 is a key component of the NE that interacts with Polycomb chromatin. In support of this notion, we found that LADs that do not contain Nup93 within or at borders show lower abundance of Polycomb chromatin state (Blue or Gray colors) (Figure S4B).
Figure 4. Nup93 interacts with high-occupancy Polycomb domains and select PRC components.

(A) Percent Pc binding domains (defined by published Pc ChIP-seq and chromatin color models), which either contain Nup93 ChIP-seq peaks (blue), or LADs but no Nup93 ChIP-seq peaks (grey), or contain neither (purple) (left). Averaged Pc ChIP-seq signal intensities among these three groups are plotted on the right. P-values were calculated using two-tailed nonparametric t test. (B) Representative GB snapshot (360 Kb) with Nup93, Elys, Nup107, Pc, and H3K27me3 ChIP-seq and chromatin colors at Nup93-containing Pc domains (right) or Pc without Nup93 domains (left). (C) Enrichment heat maps of ChIP-seq peaks of Pc, relative to Nup93 and H3K4Me2, classified into two main clusters - Nup93-containing (top) and non-Nup93-containing (bottom), sorted by Pc peak intensity (rpm/bp) and aligned by their distance from the peak along the genome (Kb). Note the relative absence of H3K4Me2 signal in Nup93-containing Pc cluster. (D) Western blot analysis of Nup93 Co-IPs from protein extracts of S2 cells against components of PRC1 and PRC2. (E) Western blot analysis of Nup93 and Nup107 Co-IPs on S2 cell protein extracts against Nups, components of PRC1, PRC2 and H3 histones. See also Figure S4.
Previously, a subset of PcG domains have been shown to overlap with a mark of poised or active chromatin, H3K4 di-methylation (Kharchenko et al., 2010), which is also a histone modification associated with Nup binding (D’Urso and Brickner, 2017; Light et al., 2013). Yet comparison between Nup93, Pc and H3K4 di-methylation profiles revealed that Nup93-PcG domains are devoid of H3K4 di-methylation and contain the highest levels of Pc (Figure 4C). This suggests that Nup93-containing PcG domains may be the most repressed sub-category of PcG domains.
The above analysis prompted us to test whether we can detect a physical interaction between Nup93 and components of Polycomb Repressive Complexes 1 and 2 (PRC1 and PRC2) (Di Croce and Helin, 2013). To this end, we performed a co-immunoprecipitation (co-IP) analysis of Nup93 and select PcG proteins. We found that pulling down with anti-Nup93 antibody from S2 cell extracts can successfully co-IP Pc, but not Polyhomeotic (Ph), of the PRC1 complex (Figure 4D). Furthermore, Ring1-and-YY1-binding protein (RYPB), which has been shown to interact with the PRC1 complex in Drosophila and in mammals (Bejarano et al., 2005; Zhan et al., 2018), robustly co-IPs with Nup93. Interestingly, Nup93 was also identified as an interacting partner of Drosophila RYBP in a genome-wide yeast two-hybrid screen (Giot et al., 2003). Additionally, we detected an interaction with Enhancer of Zeste (E(z)), the catalytic subunit of the PRC2 complex responsible for H3K27 tri-methylation (Figure 4D).
To determine whether interaction with PcG components is specific to Nup93, we utilized more stringent biochemical conditions to disassociate Nup93 and Nup107 from each other, and IP them independently (Figure 4E). In these conditions, where Nup93 and Nup107 do not cross IP, Nup93 can still co-IP PcG proteins Pc and E(z), while Nup107 does not (Figures 4, S4C). Together, these findings indicate that Nup93 can physically associate with canonical PcG machinery and reinforce the observed differential chromatin binding of Nup93 versus Nup107.
5. Nup93-bound Polycomb domains preferentially associate with the nuclear periphery.
The findings described above suggest that a subset of PcG domains is targeted to NPCs at the nuclear periphery. To confirm this, we analyzed sub-nuclear localization of several PcG regions, using Oligopaints DNA Fluorescent In situ Hybridization (FISH) probes (Beliveau et al., 2012; Rosin et al., 2018), which are designed to specific regions of the genome and allow for an improved signal to noise ratio (Joyce, 2017). We designed Oligopaints probes to 4 regions along chromosome 3R, including the ss and lbl genes, and two sites in the Bithorax Hox gene cluster - the Fab-7 regulatory element and the Ubx gene (Figure 5A). All of these locations exhibit high Pc binding, high Nup93 binding, and correspond to PcG repressed chromatin (Bantignies et al., 2011).
Figure 5. Nup93-bound Polycomb domains are enriched at the nuclear periphery.

(A) Genome browser snapshot of Oligopaint FISH probes designed to span the ss, Ubx, Fab-7 and lbl loci, local distribution of Nup93, Pc, and H3K27Me3 ChIP-seq, and chromatin colors. (B) Distributions of probe to nuclear periphery distances of Pc/Nup93 targets (DAPI staining used to define periphery). Distributions are plotted as fractions of the cell population within assigned bins. 4 biological replicates, > 200 cells per condition. (C) Representative image of Fab-7 (red) and ss (cyan) Oligopaint FISH probes in Kc cells with DNA stain (DAPI, blue). Scale bar 5um. (D) Distributions of probe to nuclear periphery distances of Non-Nup93 targets (DAPI staining used to define periphery). Distributions are plotted as fractions of the cell population within assigned bins. 4 biological replicates, > 200 cells per condition. (E) Representative image of active1 (red) and null5 (cyan) Oligopaint FISH probes in Kc cells with DNA stain (DAPI, blue). Scale bar 5um. (F) and (G) Distributions of probe to periphery distances of cells treated with control (dsW) and Pc/Ph (dsPcPh) RNAi (F), or Nup93 (dsNup93) RNAi (G). Nuclear periphery is defined by Lamin immunostaining. Distributions are plotted as fractions of the cell population within assigned bins. Bars represent mean + SEM. 3–4 biological replicates, > 200 cells per condition. P values are from two-tailed unpaired non-parametric t test. See also Figure S5.
All four loci were found to display a preferential association with the nuclear periphery (Figure 5B–C), supporting the notion that these PcG domains are targeted to NPCs in a large fraction of cells. To determine the distribution of these loci in nuclear space, we measured the shortest distance between the probe signal and the nuclear periphery, defined by either by DAPI (Figures 5B–E) or by immunofluorescence staining against Lamin (Figures 5F–G, S5A–B), and classified the distance into 400 nm or 200 nm bins from the nuclear periphery, for each cell. On average, the Nup93/PcG probes were present within 0.4 um of the nuclear periphery in approximately 50% of cells, and farther than 0.8 um from the nuclear periphery in less than 20% of cells (Figure 5B–C). In contrast, the control probes, which contain no Nup93 peaks, displayed much less bias towards the periphery and a more uniform distribution in nuclear space (Figure 5D–E). Interestingly, none of the Nup93/PcG regions were found to contain a previously mapped LAD, suggesting Lamin-independent mechanisms of peripheral localization.
To determine whether the PcG machinery or Nup93 are required for the observed localization bias towards the nuclear periphery, we depleted these factors by RNAi (all primers described in Tables S1 and S2, Figure S5C) and measured probe-periphery distances as described above. We found that partial co-depletion of PRC1 components Ph and Pc resulted in a significant shift of the 4 loci away from the nuclear periphery (Figures 5F, S5D). On the other hand, depletion of Nup93 did not result in significant nuclear re-positioning of any of the probes from the nuclear periphery (Figures 5G, S5D). Drosophila contains 2 homologues of mammalian Nup93, termed Nup93-1 and Nup93-2, which are highly similar to each other in sequence. To deplete Nup93, we targeted both versions, which led to a partial depletion of both proteins (Figure S5C), beyond which we experienced problems with cell viability. Although we did not detect a significant change in nuclear positioning of PcG sites in this level of knock down, these conditions did produce significant changes in gene expression and in spatial interactions between Pc target genes, as discussed further below. Additionally, no changes were observed in the localization of control probes in these conditions of Nup93 depletion (Figure S5E). We concluded that targeting of PcG domains to the nuclear periphery requires PRC1 components and likely involves interactions with multiple NPC or NE components, beyond just Nup93.
6. Nup93 contributes to long-range interactions between Polycomb loci.
Polycomb binding sites and PcG domains are known to engage in long-range interactions in nuclear space, and such interactions has been associated with efficient silencing of Pc targets (Bantignies et al., 2011; Entrevan et al., 2016). Previous chromosome conformation captures techniques have demonstrated interactions between nearby PRC1 binding sites, particularly at PREs, and between more distally located PcG domains (Bantignies et al., 2011; Lanzuolo et al., 2007). In particular, the Fab-7 element of the Bithorax locus has been shown to interact with nearby Pc binding sites at the Abd-B gene and with distant Pc sites, such as at the ss gene.
Genomic binding to the NPC has been previously implicated in long-range interactions between and within active genes in yeast and Drosophila (Brickner et al., 2012; Pascual-Garcia et al., 2017; Tan-Wong et al., 2009). Thus, we aimed to test whether long-range interactions between Nup93-bound PcG sites may similarly depend on Nup93. Initially, we analyzed existing interactions between Nup93-containing and non-Nup93-containing PcG regions, using previously published Hi-C maps of S2 cells (Ramirez et al., 2015) (Figure 6A, S6A). Strikingly, Nup93-containing PcG regions were found to exhibit considerably higher interactions with other Nup93-containing PcG domains, than with PcG domains that do not contain Nup93 (Figures 6A, S6A). Similarly, non-Nup93 containing PcG regions were found to interact primarily with each other, and much less with Nup93-containing PcG regions (Figure 6A). These comparisons indicated that Nup93-containing PcG domains preferentially cluster with each other, further suggesting that they represent a unique sub-class of PcG chromatin domains and that nuclear targeting to Nup93 may facilitate long-range interactions of this subclass. We did not detect significant levels of inter-chromosomal Hi-C interactions for Nup93-containing PcG domains (Figure S6B), suggesting that clustering between Nup93-containing PcG domains is restricted mainly to sites on the same chromosome.
Figure 6. Nup93 contributes to long-range interactions between distant Polycomb sites.

(A) Average genome-wide Hi-C interactions between Pc domains that contain Nup93 ChIP-seq peaks (Nup93+), Pc domains that do not (Nup93-) and regions that do not contain Pc (Neither). Average Hi-C interactions between the whole genome and these categories are plotted for comparison (right). Hi-C signal obtained from existing Hi-C datasets (described in text). Note preferential interactions of Nup93+/Pc regions with each other. P-values calculated using two-tailed nonparametric t test. (B) Violin plot of distributions of measured distances between centers of Fab-7 and ss probes in Kc cells, treated with RNAi as indicated. Horizontal lines depict median (dashed) and quartiles. > 200 cells per condition, 2–4 biological replicates. P values are from a two-tailed unpaired non-parametric t test. (C) Fraction of cell population with Fab-7-ss probe interaction distance greater than 1um, in cells treated as described in (B). (D) Representative images of cells treated as described in (B). Cells are co-labeled with Oligopaint FISH probes for Fab-7 (red) and ss (cyan), IF against Lamin (green), and stained DNA (DAPI, blue). Scale bar 5um. (E) 3C crosslinking frequencies between Fab7 and genomic regions along the Abd-B locus in S2 cells, treated as described. The relative interaction frequencies are plotted against genomic coordinates and aligned with chromatin binding maps of Nup93 and Pc. Black tick marks indicate Hind III restriction sites, vertical dotted lines correspond to the fragments investigated, hollow triangles indicate the primers tested. The primer of the anchor point is represented by a black triangle and the grey bar marks the position of the fixed Hind III fragment. Bars represent mean + SEM from 6 independent experiments. P values are from a two-sided t test. See also Figure S6.
To test whether Nup93 contributes to nuclear clustering of PcG regions, we undertook two parallel approaches. First, we analyzed the previously described high-frequency contact between the Fab-7 and ss regions (Bantignies et al., 2011), both of which are bound by Nup93 (Figures 5A, S6C), via imaging. Using Oligopaints probes described above (Figure 5A), we measured the center-to-center distance between ss and Fab-7 probes in three-dimensional scans of nuclei. As our positive control, we again utilized RNAi depletion of PRC1 components, the integrity of which is required for long-range interactions of Pc targets (Bantignies et al., 2011). In control conditions, we found the ss-Fab-7 distance to be in the 0.2–1.0 um range in the majority (~80%) of the cell population, while only ~20% of cells exhibited distances larger than 1 um (Figure 6B–D), which is consistent with previous reports of the interaction between these two loci. Expectedly, co-depletion of Pc and Ph resulted in a significant increase in the fraction of cells with separated Fab-7 and ss loci (Figure 6B, evidenced by the thicker “tail” in the violin plot, and 6C). Notably, we found that depletion of Nup93 also resulted in a significant increase in the fraction of cells with separated Fab-7 and ss (Figure 6B–D). We observed no significant difference in ss-Fab-7 distance or in loss of peripheral targeting of these probes in Lamin depleted conditions (Figures 6B–D, S6D). Additionally, no significant differences in these measurements were identified in cells depleted for Nup107 (Figure S6E), suggesting again that regulation of PcG domains is restricted to Nup93.
As a second approach, we carried out a local chromosome conformation capture (3C) assay. We measured interaction frequencies between Fab-7 and the nearby Pc binding peaks along the Abd-B gene, similarly to what has been previously described (Lanzuolo et al., 2007), in control vs. Nup93-depleted conditions (Figure 6E). In control conditions, we could detect high interaction frequencies between Fab-7 and 3 upstream Pc binding sites, as previously reported (Lanzuolo et al., 2007) (Figure 6E). In Nup93-depleted cells, we observed a modest but highly reproducible decrease in interaction frequencies (30–40%) at Fab-7-Pc interacting sites (Figure 6E). Together, these findings implicate Nup93 in mediating or stabilizing long-range interactions of PcG loci.
7. Depletion of Nup93 results in partial de-repression of Polycomb target genes.
The robust binding of Nup93 to high-occupancy PcG domains and the detected dependency of Pc long-range interactions on Nup93 suggested that Nup93 is functionally involved in regulation of PcG targets. To determine whether Nup93 is functionally required for the repression of PcG silenced genes, we measured expression of multiple Pc targets, including ss, Abd-B, Abd-A, and Antp, which are endogenous targets of PcG silencing in development (Beuchle et al., 2001), by RT-qPCR. RNAi against Ph in S2 cells led to considerable up-regulation of these 4 genes, as expected (Figures 7A). Markedly, RNAi depletion of Nup93 (Figure S7A) similarly resulted in significant up-regulation of all 4 of the targets (Figure 7A), providing evidence for the functional role of Nup93 binding. Importantly, genes not bound by Nup93 did not show any de-repression in Nup93-depleted conditions (figure 7B). We were also able to confirm the RT-qPCR results with the single molecule RNA FISH approach. Using an RNA FISH probe against the Abd-B transcript, we observed an increase in the RNA FISH signal in Ph/Pc and Nup93 depleted conditions, compared to low levels in the control (Figure S7B–C). Furthermore, we did not observe any obvious change in levels or nuclear localization of Ph or Pc in Nup93-depleted cells (Figure S7D), suggesting that the effect of Nup93 depletion on PcG gene silencing does not stem from defects in nuclear import of Ph or Pc.
Figure 7. Nup93 contributes to repression of Polycomb targets.

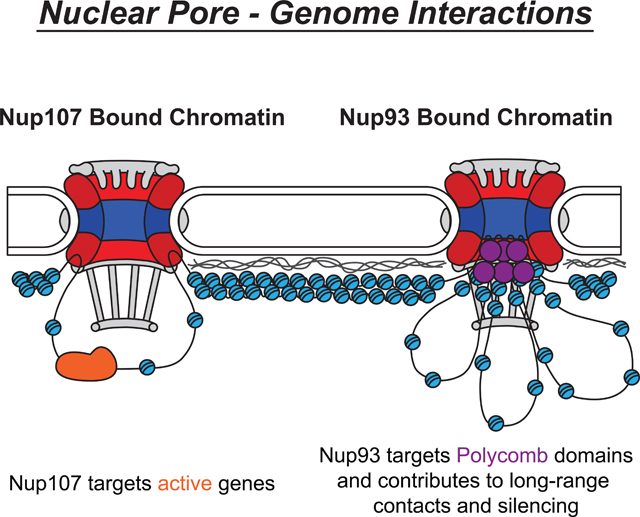
(A-B) Normalized RT-qPCR expression analysis of S2 cells treated with RNAi as indicated. qPCR is shown against Nup93 bound Pc targets (A) and Pc-bound genes not bound by Nup93 (B). GB snapshots of each analyzed gene, with Pc and Nup93 ChIP-seq tracks, are shown to the right. For (A) and (B), Bars represent mean + SEM. 5 biological replicates. P values are from an unpaired one-sided t test. (C) RT-qPCR analysis of Abd-B expression in wing imaginal discs of wandering 3rd instar larvae either expressing control genotype (Nub-gal4) or UAS-RNAi against Nup93 or Nup107, driven by Nub-Gal4. Bars represent mean + SEM (3 biological replicates, 25+ animals each). P values are from a two-tailed t test. (D) Proposed model of interactions between the fly genome and stable sub-complexes of the NPC, where Nup107 recruits active regions, and Nup93 recruits Pc domains and contributes to their 3D interactions and stable silencing. See also Figure S7.
To determine whether we can similarly detect this de-repressive effect in the developing organism, we analyzed the expression of Abd-B in larval wing discs, where it is normally silenced by PcG complexes (Beuchle et al., 2001). We depleted Nup93 or Nup107 in a large part of the wing disc, using the Nub-GAL4 driver (Pascual-Garcia et al., 2014) and UAS-driven RNAi lines. We found that Abd-B is significantly de-repressed in Nup93-depleted wing discs, but not in Nup107-depleted wing discs, as measured by RT-qPCR (Figures 7C and S7E). These findings further support our conclusion that the effect of Nup93 on PcG repression is specific to Nup93, and not shared by Nup107.
Based on our combined results, we propose a model for the distribution of chromatin along the NE compartment (Figure 7D). According to our findings, NPC binding via Nup107 targets a subset of active regions, which can be adjacent to the neighboring LADs. On the other hand, NPC binding via Nup93 targets Polycomb domains, particularly those that are most stably bound by Pc. The binding by Nup93 appears to contribute to PcG silencing and to long-range clustering of PcG sites. Given that we were able to unambiguously resolve binding sites of the two stable Nups, which are normally part of the core NPC structure, we hypothesize that this Nup-specific binding occurs at different NPCs. Our data suggests that this differential binding underlies the ability of NPC sub-complexes to carry out different functions in genome regulation.
DISCUSSION
Our presented results provide high-resolution chromatin binding maps of stable NPC components and offer a resource for future comparisons to a variety of genomic features. Our maps and analysis contribute several insights into the nuclear organization field. First, we found that representative members of the two core sub-complexes of the NPC, Nup107 and Nup93, bind to active and silenced regions, respectively. We believe this differential binding helps explain the variability in previous conclusions on NPC-genome contacts, and extends our understanding of how NPC-genome contacts shape three-dimensional genome architecture. Our ChIP-seq maps of Nup107 are consistent with the predominant view of the NPC as a place for targeting active genes, and suggest that this function is carried out primarily through associations of the genome with the outer-ring NPC sub-complex. Although currently, we cannot definitively prove that all identified binding peaks of Nup107 and Nup93 represent NPC binding, our comparison to LADs and immunofluorescence localization analysis (Figures 3 and S3), as well DNA FISH analysis of select loci (Figure 5), suggest that a large proportion of these binding peaks represent regions present at the nuclear periphery, at actual NPCs.
Second, our findings describe a functional connection between Nup93, a conserved subunit of the inner-ring NPC sub-complex, and Polycomb complexes, which are key regulators of developmental gene silencing. Our ChIP-seq map of Nup93 demonstrates preferential targeting of Nup93 to a large subset of PcG domains, particularly those that exhibit the highest level of Pc binding. Importantly, we found that lowering levels of Nup93 leads to de-repression of Pc targets in both cultured cells and fly tissues. These findings suggest that a) a core NPC subunit is involved in the epigenetic maintenance of silencing via its chromatin binding role; and b) a subclass of particularly stable PcG chromatin domains are targeted to the nuclear periphery, where they require Nup93 for optimal silencing. The function of the Nup93 sub-complex in gene repression appears to be highly conserved, as strikingly, the S. pombe homologue of Nup93 was found by Moazed and colleagues to be required for silencing and nuclear clustering of heterochromatin (Iglesias et al, in press). Nup93 has also been previously shown to be required for the repression of the HoxA gene cluster in mammalian cells (Labade et al., 2016). This is in line with previous findings that another subunit of this sub-complex, Nup155, associates with histone deacetylases in mammalian cells and targets repressed heterochromatin in yeast (Kehat et al., 2011; Van de Vosse et al., 2013). The role of Nup93 in PcG silencing is also potentially related to the previously reported link of Nup153 to PcG-mediated repression in mouse ES cells (Jacinto et al., 2015). In further support of this notion, several Nups have been previously identified in a genome-wide imaging screen for factors that affect nuclear distribution of PcG proteins (Gonzalez et al., 2014).
Thus, our proposed model (Figure 7D) envisions that certain nuclear pores may interact with active chromatin via the Nup107 sub-complex, while other nuclear pores may associate with silent chromatin via the Nup93 sub-complex. This model is based on our ability to ChIP-seq distinct regions of the genome with different structural NPC components, and it is further supported by biochemical interaction data (Figure 4E) and the specificity of the functional effect of Nup93 (Figures 5, 6 and 7C). Our proposed model is consistent with previous findings in yeast, which reported the binding of a component of the Nup93 sub-complex to silent chromatin and the possible existence of this sub-complex as a type of an independent nuclear pore-related complex, present at the nuclear periphery (Lapetina et al., 2017; Van de Vosse et al., 2013). In this context, it remains to be determined whether some of the Nup93-PcG interactions similarly occur as an independent complex or if they are normally part of actual NPCs, and whether the observed functional effect of Nup93 on PcG silencing always takes place at the NPC.
Interestingly, we found that the Nup93-targeted PcG domains tend to preferentially interact with each other in nuclear space. It is intriguing that other Nups, such as Nup98 and Mlp1/2, have been previously shown to facilitate long-range contacts of transcribing genes, such as enhancer-promoter and 5’–3’ loops (Pascual-Garcia et al., 2017; Tan-Wong et al., 2009). It appears that stabilization of long-range contacts, either at active or silent genes, may be generally promoted by NPC binding, but the nature of contacts depends on the particular Nup involved. Based on our combined results, we hypothesize that Nup93 binding may promote stabilization of PcG domains that are destined to be highly repressed. This stabilization may involve promoting long-range interactions between Pc sites, as well as possibly helping sequester PcG domains into specific nuclear compartments, away from gene activity. Our findings also suggest that in the case of PcG silencing, long-range interactions are more functionally involved in gene repression than localization to the nuclear periphery, since de-repression of PcG targets is consistently associated with loss of long-range interactions.
Furthermore, our results suggest that some of the previously defined LADs are in fact interrupted or flanked with NPC-associated chromatin. In this manner, it appears that at least a fraction of mapped LADs may be complex, containing Nup-targeted sub-environments. These conclusions are also supported by the recent refined analysis of mammalian LADs, which revealed LAD interruptions that contain marks of active chromatin, termed “Disruption in Peripheral signal” (DiPs) (Luperchio et al., 2018). If such DiPs are biologically meaningful, our data would suggest that some such DiPs may be NPC-bound areas of the genome, characterized by functions distinct from the surrounding LADs. An intriguing conjecture is that positioning genes at NPCs within LADs may facilitate ready switching of transcriptional states, such that genes can shift between adjacent active and silent states, depending on incoming signals.
Finally, our analysis demonstrated wide spread genomic binding by a non-stable Nup Elys, which is currently the only Nup with a known direct chromatin binding activity (Zierhut et al., 2014). Interestingly, Nup107 is almost exclusively found at Elys binding sites. It is tempting to speculate that Elys serves as a chromatin tethering Nup for the Nup107 sub-complex components in the interphase genome, much like it has been demonstrated to do postmitotically, during NPC assembly (Franz et al., 2007; Gillespie et al., 2007; Rasala et al., 2006). The reproducibility of Elys-Nup107 binding patterns further invokes the possibility that postmitotic targeting of the Elys/Nup107 sub-complex to chromatin occurs at specific sites in the genome and as such, may participate in the correct re-establishment of chromatin states and nuclear architecture after mitosis. On the other hand, Nup93 similarly shares a large fraction of its binding sites with Elys, suggesting that Elys may carry a similar function in targeting the inner ring sub-complex to chromatin. Presently it remains unclear how this specificity of Nup93 vs. Nup107 genome targeting may be established. But together, our findings support the model where different subunits of the NPC have evolved unique functions in chromatin regulation. Individual Nups appear to be able to facilitate either activating or repressive processes, and to assist nuclear organization of chromatin domains and key proteins complexes.
STAR METHODS
CONTACT FOR REAGENT AND RESOURCE SHARING
Further information and requests for resources and reagents should be directed to and will be fulfilled by the Lead Contact, Dr. Maya Capelson (capelson@pennmedicine.upenn.edu). All generated materials will be shared without restrictions.
EXPERIMENTAL MODEL AND SUBJECT DETAILS
Cell lines
Drosophila S2 cells (DGRC 6) sex: male, and Kc-167 cells (DGRC 1) sex: female, were obtained from the Drosophila Genome Resource Center. Cells were cultured at 25 °C in Schneider’s Media (DGRC) with 10% heat inactivated fetal bovine serum (GIBCO) and antibiotics.
Fly Lines
Drosophila genetic stocks used in this study include Bloomington stocks 33908 (Nup93-1 RNAi), 25754 (Gal4-Nubbin) and Vienna Drosophila Resource Center stock 110759 (Nup107 RNAi).
METHOD DETAILS
Antibody Generation
To generate antibodies to Drosophila Nup107 (CG6743), general procedure was as described in Pascual-Garcia et al 2017. Briefly, dNup107 amino acids 518– 725 were cloned into a petG-41A vector, expressed in BL21 cells, induced with 0.1 mM IPTG at an OD of 0.6 and purified with a HIS tag using Ni-NTA agarose beads. The first three elutions were pooled and dialyzed in PBS. The purified recombinant protein was sent to the Pocono Rabbit Farm & Laboratory for production of Nup107 rabbit antisera. Bleed 3 and Ex-Sang were validated by western blotting/Immunofluorescence and RNAi against Nup107 in S2 cells (Figure S1C/D), and used for experimental procedures.
Additional antibodies against PcG proteins Ph, Pc and E(z), and Rybp were a generous gift from Drs. Yuri Schwartz and Vincent Pirrotta, Richard Jones, and Ana Busturia, respectively. Antibodies to Drosophila lamin, L7, ADL84.12 and ADL195, were gifted by Dr. Paul Fisher, or obtained from Developmental Studies Hybridoma Bank. Antibody to H3 was purchased from Abcam (ab1791). Antibodies to dNup93 and dElys were described in Pascual-Garcia et al 2017.
dsRNA generation and RNAi conditions
To generate dsRNA, T7 reactions were performed with ChoiceTaq DNA polymerase (Invitrogen) using primers listed in Table S1. dsRNA were generated with Megascript T7 kit (Applied Biosystems). RNAi knockdown was accomplished by plating1.5×106 cells in 1 mL of serum free media per well of 6-well plate and 6.35×10⁶ cells in 5 mL of serum free media per 10 cm dish. Cells were treated with 20ug/125ug (6 well and 10 cm plate respectively) of the appropriate dsRNA incubated for 2–4 hours before rescuing with media containing 20% heat inactivated fetal bovine serum. Treatments were repeated either one or two additional times for all RNAi treatments (a total of 4 days/96 hours or 6 days/144 hours). Control cells were treated with dsRNA for gene white.
Co-Immunoprecipitations
S2 cells were harvested and washed twice in PBS. 4×10⁷ cells were resuspended in 1100 ul of high-salt buffer (10 mM Tris-HCL, pH 7.4, 400 mM NaCl, 1% Triton X-100, 2mM EGTA, 1 mM MgCl2, 1 mM DTT and C0mplete EDTA-free Tablet (1 per 10 mL)) (11836170001) and Pierce Universal Nuclease (1:500)(ThermoFisher 88700) for 45 min at 4°C. The sample was then sonicated 3 × 15 seconds on setting 2 of Fisher Sonic Dismembrator Model 100 resting 10 seconds on ice between sonications. The sample was spun down at 10,000 rcf, 10 min at 4 C and supernatant was removed. 300ul of lysate and 850 ul of no-salt buffer (10 mM Tris-HCl, pH 7.4, 2 mM EDTA, 1 mM DTT) was added along with 8 ul of anti-Nup93 antibody or 2 ug of anti-Guinea Pig IgG antibody was added to the lysate mixture and incubated on a rotator at 4 C overnight. 35 ul of Dynabeads (Life Technologies) were washed in blocking buffer (0.3% BSA PBS) three times and blocked for 1 hour on a rotator at 4 C. Beads were washed in no salt buffer twice and added to the antibody/lysate mixture and incubated on a rotator at 4 C for 3 hours. After incubating, beads were washed 5 times in wash buffer (1:3 High Salt:No Salt) and eluted in SDS-loading buffer. 5% inputs boiled in final concentration 1X SDS-loading buffer and IP samples were loaded on 6 or 8% SDS-PAGE gels and transferred electrophoretically to nitrocellulose membranes using a Bio-RAD Trans-Blot Turbo using the following program: (0.1 amps/25 V/90 minutes). Membranes were blocked in 5% Milk PBST (1X PBS and 0.1% Tween) for 1 hour at RT before being incubated in primary antibodies diluted in 5% BSA PBST overnight at 4°C. The primary antibodies and dilutions used a re: guinea pig anti-Nup93 (1:1000), rabbit anti-Ph (1:1000), rabbit anti-Pc (1:1000), rabbit anti-RYBP (1:1000), and rabbit anti-E(z) (1:1000). Membranes were washed 3 X 10 minutes in PBST and then incubated with HRP secondary antibodies for 1 hr at room temperature. Membranes were washed in PBST 3 X 10 minutes and imaged using ECL-Plus Western blotting reagent (Amersham Biosciences). IPs done with more stringent conditions used the same procedures with the following changes. The lysis buffer was replaced with buffer A (20 mM Tris, 100 mM NaCl, 1 mM EDTA, 0.5 mM EGTA, 0.5% Sarkosyl, 0.1% Na-Deoxycholate). IPs were set up with 400 ul of lysate, 400 ul of dilution buffer (20 mM Tris, 100 mM NaCl, 1 mM EDTA, 0.5 mM EGTA, 0.1 % IGEPAL) and washes were done using the dilution buffer. 5% inputs boiled in final concentration 1X SDS-loading buffer and IP samples were run on either 8% SDS-PAGE or 4–20% SDS-PAGE precast gels (BioRAD 4561095). Samples blotted for Nup93, Nup107, Pc and Ez were transferred onto 0.45 um nitrocellulose membranes while samples blotted for H3 were transferred onto 0.2 um nitrocellulose membranes. Membranes were blocked, incubated with primary/secondary antibodies, washed and imaged as described previously. The primary antibodies and dilutions are as follows (guinea pig anti-Nup93 (1:1000),rabbit anti-Nup107 (1:1000), rabbit anti-Pc (1:1000), rabbit anti-E(z) (1:1000), and mouse anti-H3 (1:1000)).
Whole Cell Lysate Westerns
Knockdowns were performed as described in “Cell Culture and RNAi” and cells were harvested and washed twice in PBS. Cell pellets were incubated with 120 ul of RIPA buffer (10 mM Tris-HCl, pH 8.0, 1 mM EDTA, 0.5 mM EGTA, 1% Triton X-100, 0.1% Sodium Deoxycholate, 0.1% SDS, 1% IGEPAL, 140 mM NaCl and C0mplete EDTA-free Tablets(1 per 10 ml)) per 6-well of cells and incubated on ice for 45 minutes. Samples were then spun down at 10,000 rcf, 10 min 4°C and the supernatant was removed and quantified using the Pierce BCA Protein Assay Kit (ThermoFisher 23225). 15 ug of protein of each sample was boiled in final conc. 1 X SDS-loading buffer, resolved on 8% SDS-PAGE gels and transferred electrophoretically to nitrocellulose membranes using a Bio-RAD Trans-Blot Turbo. Membranes were blocked, incubated with primary/secondary antibodies, washed and imaged as described in Co-Immunoprecipitations. The primary antibodies and dilutions are as follows (rabbit anti-Nup107 (1:1000) and mouse anti-Tubulin (1:1000)).
ChIP-seq
10 cm dishes of S2 cells at 85–95% confluency were crosslinked with 1% methanol-free formaldehyde and quenched with 0.125 M final concentration Glycine. Cells were then harvested and washed with PBS + 0.2mM PMSF. Cells were then treated with 1 mL of ChIP Buffer I (50 mM HEPES pH 7.6, 140 mM NaCl, 1 mM EDTA, 0.5 mM EGTA, 10% glycerol, 0.5% IGEPAL, 0.25% Triton X-100, and C0mplete protease inhibitors (11836170001), incubated on a rotator at 4 C for 10 minutes, and spun down at 400 rcf, 5 min 4°C. Pellets were resuspended in 1 mL of ChIP Buffer II (20 mM Tris pH 8.0, 200 mM NaCl, 1mM EDTA, pH 8.0, 0.5 mM EGTA, pH 8.0, and C0mplete protease inhibitors), incubated on a rotator at 4°C for 10 minutes, and spun down at 400 rcf, 5 min 4°C. Pellets were resus pended in 1 mL ChIP Buffer III (20 mM Tris, 100 mM NaCl, 1 mM EDTA, 0.5 mM EGTA, 0.5% Sarkosyl, 0.1% Na-Deoxycholate (NaDOC) and C0mplete protease inhibitors) and sonicated in a S220 Covaris (15 minutes peak power 140, Duty Ratio 5, Cycles 200). Samples were transferred into 1.5 mL Lo-bind tubes, 1% Triton X-100 final volume was added and samples were spun down at max speed 10 min at 4°C. Supernatants were were then quantified using a Bradford assay (BioRAD 5000006). IPs were set up with 500ug of protein, 15ul of Nup antibodies/3ug of IgGs and Dilution Buffer (20 mM Tris, 100 mM NaCl, 1 mM EDTA, 0.5 mM EGTA) in a 1:2 ratio of lysate:dilution buffer. IPs were incubated on a rotator O/N at 4°C and 10% Input and verification samples were stored at −80°C. 40ul of Dynabeads per IP were washed and then blocked in 0.3% BSA in PBS on a rotator O/N at 4°C. Beads were then washed twice in Dilution Bu ffer and added to the IPs and incubated on a rotator at 4°C for 3 hours. After incubation, bea ds were washed in 1 mL of the following buffers: Low Salt Buffer (20 mM Tris-HCl pH 8, 150 mM NaCl, 2 mM EDTA, 0.1% SDS, 1% TritonX-100), High Salt Buffer (20 mM Tris-HCl, pH 8, 500 mM NaCl, 2 mM EDTA, 0.1% SDS, 1% TritonX- 100), LiCl Buffer (10 mM Tris-HCl pH 8, 250 mM LiCl, 1% IGEPAL, 1% NaDOC, 1 mM EDTA), and TE50 (10 mM Tris-HCl pH 8.0, 50 mM NaCl, 1 mM EDTA). The TE50 wash was repeated twice to ensure that all residual LiCl Buffer was removed. Beads were resuspended in 300ul of Elution Buffer (100 mM NaHCO3, 1% SDS) and eluted in a thermomixer at 65°C 600 rpm for 30 minutes. Samples (IPs and Inputs) were de-crosslinked at 65°C. After de-crosslinking, equal volume TE (10 mM Tris-HCl pH 8.0, 1 mM EDTA) was added to samples and 0.2 mg/ml final concentration RNAse A (Roche 10109169001) was added and incubated at 37°C followed by the addition of 0.2 m g/ml final concentration Proteinase K (Fisher Scientific BP1700-100) and incubation at 55°C. 1 X sample volume of Phenol/Chloroform/isoamyl alcohol was added, samples were incubated at RT and then spun down at max speed. 1 X sample volume of chloroform/isoamyl alcohol was added to the aqueous layer and samples were incubated at RT and then spun down at max speed. 0.1X sample volume of sodium acetate (pH 5.2, final concentration of 0.3 M), 1.5μl glycogen (stock 20 mg/ ml, Roche) and 2.5 X sample volume of cold 100% ethanol was added to the aqueous layer and samples were mixed and incubated at −20°C. Samples were then spun down at max speed, 20 minutes 4°C, the DNA pellet was washed wi th 70% cold ethanol, and spun down at max speed, 10 minutes 4°C. Pellets were then quick- spun and residual ethanol was pipetted off. Pellets were then air-dried until all ethanol was removed. DNA pellets were then re-suspended in TE buffer. Samples were then either processed for qPCR or sequencing.
Library Preparation and Sequencing
Libraries were prepared using NEBNext Ultra II DNA Library Prep Kit for Illumina (E7645L) and NEBNext Multiplex Oligos for Illumina (E7335L and E7500L). Fragment sizes were verified with an Agilent Bioanalyzer High Sensitivity Kit (5067–4627). Libraries were quantified using NEBNext Library Quant Kit for Illumina (E7630L) and sequenced using an Illumina NextSeq 500 platform (75bp, single-end)( Illumina FC-404-2005).
RNA Extraction and qPCR
For Drosophila larvae wing disc experiments, female Nup93 RNAi line (33908) or Nup107 RNAi line (KK108047) were crossed to male Gal4-Nubbin (25754), with Gal4-Nubbin cross as the control. Wing discs of progeny 3rd instar larvae were dissected in 4°C PBS and collected in tubes on dry ice (discs from 25 animals per replicate). Tissues were homogenized in TRIzol (15596026) and RNA was harvested with PureLink RNA extraction kit (ThermoFisher Scientific 12183025). For cultured cells, cells were harvested with 4°C PBS. Cells were treated with TRIzol and RNA was harvested with PureLink RNA extraction kit (ThermoFisher Scientific 12183025). In cell and tissue experiments cDNA was made using the QuantiTect Reverse Transcription Kit (205310). Transcripts were quantified using POWER SYBR Green Master Mix (4367659) and a QuantStudio 7 Flex Real-Time PCR Instrument (4485701). Expression of all targets was normalized using primers to rp49. All primers are listed in Table S1.
Immunofluorescence in S2 cells
Cells were settled on coverslips then washed in PBST (1X PBS with 0.1% Triton X-100) for 2 minutes on ice followed by fixation in methanol cooled to −20°C for 10 minutes at RT. Coverslips were washed with PBS three times for five minutes at RT, then blocked in 1% BSA in PBST for 30 minutes. Blocking solution containing diluted primary antibodies was applied to coverslips, and incubated in a humidified chamber overnight at 4°C. Coverslips were washed in PBST followed by incubation with secondary antibodies diluted in blocking solution for 1 hour at room temperature in a dark humid chamber, followed by 3 five minute washes in PBS. Slides were washed in Hoescht DNA stain (1:10,000 in PBS) for 5 min, before mounting in Prolong Gold (Invitrogen P36930). Primary antibody dilutions were as follows: rabbit anti-Nup107 (1:200), guinea pig anti- Nup93 (1:200), mouse anti-414 (1:300), rabbit anti-Pc and anti-Ph (1:100). Secondary antibodies were goat anti-mouse 488 (1:800), goat anti-guinea pig 568 (1:800) and goat anti-rabbit 568 (1:800).
Immunofluorescence and DNA FISH
Methods were based on published protocol (Nguyen and Joyce, 2019). For DNA FISH, Oligopaint probe libraries were designed using the Oligoarray 2.1 software and the DM3 genome build, purchased from CustomArray. Oligopaint FISH probes were designed to have 42 bases of homology and a density of 5–10 probes/kb. Coordinates for all paints can be found in Table S2.
For oligopaint probe generation, The oligo pool was PCR amplified in a 50 μL reaction (1.25 μL of 20 μM forward primer, 1.25 μL of 20 μM reverse primer, 1 μL of 100 pg/μL oligo pool, 21.5 μL of ddH2O, and 25 μL of 2× Phusion Master Mix) (NEB) with the cycle having an initial denaturation of 98 °C for 3 min, 30 cycles of 98 °C for 5 s and 72 °C for 15 s, then a final elongation step of 72 °C for 2 min. PCR samples wer e purified with Nucleospin Gel and PCR clean-up kit (Clontech). Products were diluted to 20 ng/μL, then another PCR reaction was run according to the manufacturer’s recommended cycle, with 200 μL reaction (0.4 μL of 200 μM forward primer containing secondary binding sequence, 0.4 μL 200 of μM reverse primer containing T7 sequence, 4 μL of 10 mM dNTP mix, 1 μL of 20 ng/μL oligo pool PCR product, PCR buffer, Taq polymerase, and ddH2O) using the Choice Taq Polymerase (Denville). Products were pooled, purified as previously described, and eluted in 50 μL ddH2O. RNA was synthesized in a 20 μL reaction (7 μL of the PCR product, 2 μL of each ribonucleotide, 2 μL of 10× T7 buffer, and 2 μL of T7 polymerase, 1 μL of RNAseOUT) using the HiScribe T7 kit (NEB) and incubated at 37 °C overnight. The T7 reaction w as brought to room temperature and a reverse transcription reaction was assembled (20 μL of T7 sample, 7.5 μL of 200 μM forward primer containing the secondary sequence, 9.6 μL of a 100 mM dNTP mix, 30 μL 1× RT buffer, 2 μL of Maxima H Minus enzyme, 1.5 μL RNaseOUT, and 79.4 μL of ddH2O ) using the Maxima RT-H Kit (Thermo Scientific) and incubated at 50 °C for 2 h. RNA was degraded by adding 4ul RNAase A 10ug/ul and incubated in a thermocycler (2h 37C, 30min 60C, 15 min 92C). The probe was then purified by adding 308ul μL of oligo binding buffer and 616uL of 100% ethanol, vortexing briefly, and purified with the Oligo Clean and Concentration kit (Zymo Research). The probe was then eluted into 150 μL of ddH2O. The concentration of the probe was measured on a spectrophotometer, and the concentration converted to pmol/μL by using the formula: [concentration of probe in pmol/μL] = [concentration of probe in ng/μL] * 3.03 * (1/number of nucleotides).
For IF combined with DNA FISH, all washes and fixations in protocol were performed in coplin jars. Cells at a concentration of 2×10^6 cells/mL were settled on poly-L-lysine coated slides for 30 min at room temperature in a covered container, then rinsed quickly with 1XPBS followed by fixation with 4% formaldehyde in PBST (1X PBS with 0.1% triton X-100) for 10 min. Slides were washed in PBST 3 X 5 min and then blocked in 1% BSA in PBST for 30 min. 60μl of blocking solution containing diluted primary antibodies was applied on the area of the slide containing fixed cells, covered with a 22×22 mm coverslip, and incubated in a humidified chamber overnight at 4°C. Slides were then washed in PBST 3 X 5 min at room temperature followed by incubation with 60 μl of secondary antibodies diluted in blocking solution for 1 hour at room temperature in a dark humid chamber. In the case of IF/FISH, slides were subjected to IF, followed by post-fixation with 4% formaldehyde in PBST for 10 min before proceeding with FISH as described below. Primary antibody dilutions were as follows: mouse anti-lamin ADL84-12 (1:100), mouse anti-lamin ADL195 (1:100), rabbit anti-Pc (1:100), rabbit anti-Ph (1:100) and mouse mAb414 (1:300). Secondary antibodies used were Alexa 488 goat anti-mouse (1:200) and Alexa 568 goat anti-rabbit (1:200).
Immunofluorescence protocol was followed by 3 X 5 min washes in PBST at RT, then in 2×SSCT (0.3 m NaCl, 0.03 m sodium citrate, 0.1% Tween-20) at RT for 5 min, and in 2×SSCT/50% formamide at RT for 5 min. Slides were pre-denatured in 2×SSCT/50% formamide at 92° in coplin jars for 2.5 min followe d by incubation in 2×SSCT/50% formamide at 60° in coplin jars for 20 min. Slides were moved to an empty jar to dry for approximately 10 min. Primary Oligopaint probes in hybridization buffer (10% dextran sulfate/2xSSCT/50% formamide/4% polyvinylsulfonic acid (PVSA)) were then added to the slides, covered with a coverslip, and sealed with rubber cement. Once rubber cement completely dried, slides were denatured on a heat block in a water bath set to 92°for 2.5 min, after which slides were transferred to a humidified chamber and incubated overnight at 37°. Approximately 16–18 hours later, coverslips were removed with a razor blade, and slides were washed in 2×SSCT at 60°for 15 min, 2×SSCT at RT for 10 min, then 0.2×SSC at RT for 5 min. All slides were washed with Hoescht DNA stain (1:10,000 in PBS), followed by washes 3 X 5 min washes in PBS before mounting in Slowfade (Invitrogen).
Chromosome conformation capture (3C)
3C experiments were performed as detailed in (Pascual-Garcia et al., 2017), with some variations. Briefly, 10 ×106 S2 cells were cross-linked using 2% formaldehyde for 10 min at room temperature and the reaction was quenched with 0.125 M of glycine. Cells were lysed for 10 min on ice with Lysis buffer (10 mM Tris-HCl pH 8.0, 1 mM MgCl2, 10 mM NaCl, 0.2% Igepal). Nuclei were re-suspended in 1.2X restriction enzyme buffer and incubated at 37°C for 90 min with 5 μl of 20% SDS. We then added 50 μl of 12% Triton X-100/1X T4 Ligase buffer and incubated for 90 more min in the same conditions. Digestion was done in two steps, first using 300U of Hind III for 3h at 37C and then adding 500U and incubating overnight. The reaction was then stopped by adding 40 μl of 20% SDS and ligation of the fragmented DNA was done with 2000U of T4 ligase and incubating overnight at 16°C. Cross-linking was reversed incubating samples overnight at 65°C with 400 μg of freshly prepared Proteinase K and DNA was purified after RNAse A treatment with phenol:chloroform extraction and ethanol precipitation. The DNA pellet was dissolved in 150 μl of 10 mM Tris-HCl pH 7.5.
Concentrations of ligation products were adjusted to 25 ng/μl by comparing to a reference sample of genomic DNA of known concentration. To measure interaction frequencies of 3C products, six independent experiments were amplified by real time-qPCR. For each reaction 2 μl of the 3C template was used and measured relative to control template generated from BAC DNA clone RP98-20I8 (AbdB). All interactions were normalized to internal primers, not spanning any HindIII sites, at the rp49 locus (BAC#RP98-15I7). Primers used are as listed in (Lanzuolo et al., 2007).
RNA FISH
S2 cells were fixed on coverslips using 4% Paraformaldehyde for 10 min and washed with PBS 3 X 5 min at RT. Coverslips were incubated with 30uL hybridization buffer (2XSSC;10% Formamide, 10% Dextran sulfate; salmon sperm DNA) and 0.3uL stock probe solution at 37°for 18h, followed by three washes in wash buffer ( 2XSSC;10% dionized Formamide) for 30 minutes per wash at 37°. Coverslips were then stain ed with Hoesht DNA stain (1:10,000 in PBS) for 5 minutes and washed 3 X 5 min in PBS, followed by mounting in Prolong Gold (Invitrogen).
QUANTIFICATION AND STATISTICAL ANALYSIS
ChIP-seq Comparison Between Datasets
Track and coordinate files of public datasets were acquired for Pc ChIP-seq (GSE20804), Pc BioTAP (GSE66183), H3K27me3 ChIP-seq (GSE20781), chromatin landscape described in 5-color states (GSE22069) and in 9-color states (PMC3109908). Pc domains were defined by expanding Pc ChIP-seq peaks towards both ends until the 9-color chromatin state changes. Heatmap of ChIP-seq signal +/−5 kb centered around peaks were plotted using Deeptools (“computeMatrix reference-point”). Similarly, heatmap of ChIP-seq signal stretching over plus +/−5kb around Pc domains were plotted using Deeptools (“computeMatrix scale-regions”), with unsupervised k-means clustering (k=2) that separated the Pc domains by whether it has Nup93 or not. Track for Lamin DamID and coordinate file of LAD boundaries were acquired (GSE20311). Nup ChIP-seq peaks were assigned as in LADs, in LAD boundaries (outside of LADs but within 5kb of LAD boundaries) or outside LADs. Heatmap of ChIP-seq signal +/−5 kb and +/− 20 kb centered around Nup93 peaks and sorted by Lamin ChIP-seq and Nup93 peak size (respectively) using Deeptools (“computeMatrix reference-point --center”). Heatmap of Lamin DamID signal +/−100 kb centered around peaks were plotted using Deeptools (“computeMatrix reference-regions --scale”). Nup peaks in each category were assigned with chromatin colors based on the majority color of the peak region. Nup chromatin color enrichment significance was calculated by comparing to 100 random shuffles of the corresponding Nup peaks (Figure S2A). Statistical parameters are reported in the figure legends.
ChIP-seq Data Preprocessing
Sequencing reads were aligned to genome assembly dm3 using Bowtie2 (version 2.2.9) with default parameters and “--local” to allow soft clipping of ends. Alignments were further processed by SAMtools (version 0.1.19) to remove low quality alignments (“-q 10”), PCR duplicates (“rmdup -s”) and mitochondrial reads. Reads that passed filter were used to call peaks with MACS2 (v2.1.0, “--qvalue 0.05 --mfold 2 50 --broad”). Peaks that overlapped between biological replicates were retained for each antibody. Final peak coordinates of each Nup are shown in Tables S3–S5. For visualization, each individual library was normalized to 10 million reads per library and then the track for each library was generated by subtracting its corresponding IgG control (Nup93, Nup107, Elys ChIPs) or input control (L7 Lamin ChIPs) using BEDtools (“genomecov”) and Deeptools (“bigwigCompare –ratio=subtract --binSize=10”). An average track for each antibody was also generated from biological replicates using UCSC command line tools (“bigWigMerge”). Peaks were annotated with genomic regions and nearby genes using HOMER (“annotatePeaks”). Overlap between different Nups were defined as peaks that overlap by at least 1bp. Heatmap of ChIP-seq signal +/− 1.5kb centered around peaks were plotted using Deeptools (“computeMatrix reference-point”). Statistical parameters are reported in the figure legends.
HI-C Analysis
Hi-C preprocessed data (GSE58821) was acquired in 25kb-bin resolution as provided in the original study. We labeled each bin based on whether it contains Nup93+ or Nup93- Pc domains, and the Hi-C interaction signal within or between different types of bins were summarized as boxplots. Statistical parameters are reported in the figure legends.
S2 Cell Immunofluorescence Analysis
Colocalization analysis of immunofluorescence images was conducted using the Mander’s overlap coefficient and Pearson’s correlation coefficient methods (Dunn et al., 2011). Cells from Immunofluorescence images included three channels, DAPI for DNA stain, 414, and Nup107 or Nup93. To select pixels from these images for calculations, cells were manually isolated through masking of 414 signal to ensure that background from the surrounding image was excluded. Values reported were generated using the ImageJ plugin JACoP (Bolte and Cordelieres, 2006), which automatically calculated threshold and intensity values for pixels in each channel followed by pixel to pixel comparison of the indicated channels. Line graphs of fluorescence intensities for 414 and Nup107 or Nup93 were generated in two channel images of single cells using ImageJ “Plot Profile” function across the diameter through the center of each cell. Fraction of total intensity values were then calculated by dividing each data point along the line graph by the total fluorescence intensity. The lowest point of 414 Intensity curves on either side of the nucleus were used to define internal signal. Total signal of Nup107 or Nup93 within this region was summed to calculate internal signal values. These values were divided by total signal to determine the percent internal signal for each cell. Statistical parameters are reported in the figure legends.
FISH quantification and data analysis
For DNA and RNA FISH, Images were acquired using a Leica wide-field fluorescence microscope, with 1.4 NA 60x objective. Images were processed using Leica software LAS-X 3.3 for deconvolution and exported as TIF files. FOR DNA FISH, Analysis conducted using plugin TANGO (Tools for Analysis of Nuclear Genome Organization) in ImageJ (Ollion et al., 2013). Nuclei were identified using “simple segmenter” algorithm and probes were segmented using ”hysteresis segmenter” algorithm. Nuclear edge was defined using either Lamin immunofluorescent staining or DAPI staining.
Quantification and Statistical Analysis
R packages Diffbind and stats (version 3.6.1) were used for statistical analysis of differential peak and genomic dataset overlap. All other statistical tests were performed using GraphPad Prism software with tests described in figure legends. Sample sizes, replicates and statistical dispersion are described in figure legends. For FISH quantification, significance was calculated with a two-sided nonparametric t test (Mann Whitney test) performed on the distributions of distances within each replicate relative to control replicates. In the case of periphery distance comparison, the null hypothesis was that the cell population will not move away from the periphery. Statistical parameters are reported in the figure legends. For RNA FISH, RNA “dots” were counted blind and analyzed in GraphPad Prism. 3C and wing disc gene expression significance was calculated via two-sided parametric t tests. S2 cell expression significance was calculated via a one-sided parametric t test with the hypothesis being that knockdown would lead to an increase in gene expression.
DATA AND CODE AVAILABILITY
The GEO accession for all sequencing data is GSE136117, which is a superset that contains two subsets - GSE135610 subset for ChIP-seq of Nups and GSE136115 subset for ChIP-seq of Lamin.
Supplementary Material
Primers, related to STAR Methods and Figures 1,5,6,7.
FISH probes, related to STAR Methods and Figures 5,6.
Elys intersect peaks, related to Figure 1.
Nup93 intersect peaks, related to Figure 1.
Nup107 intersect peaks, related to Figure 1.
HIGHLIGHTS.
– Nup107 and Nup93 target active genes and Polycomb domains, respectively
– A fraction of LADs contain genomic binding sites of the nuclear pore
– Nup93 contributes to long-range interactions between Polycomb sites
– Nup93 binds and contributes to silencing of high-occupancy Polycomb domains
ACKNOWLEDGEMENTS
We are indebted to the labs of Drs. Ana Busturia, Richard Jones, Paul Fisher, Vincent Pirrotta and Yuri Schwartz for generously sharing their antibodies. We are grateful to members of Dr. Roberto Bonasio’s lab, particularly Dr. Kristin Ingvarsdottir, for their help with optimization of ChIP-seq, and to Drs. Shawn Little and Joe Zinski for their help with RNA FISH. We thank Dr. Karen Reddy for helpful discussions. We thank Developmental Studies Hybridoma Bank, Drosophila Genomics Resource Center, Vienna Drosophila Resource Center, and Bloomington Drosophila Stock Center for reagents. M.C. is supported by the Research Scholar Grant RSG-15-159-01-CSM from the American Cancer Society, and by the NIH R01GM124143 grant.
Footnotes
DECLARATION OF INTERESTS
No competing interests.
Publisher's Disclaimer: This is a PDF file of an unedited manuscript that has been accepted for publication. As a service to our customers we are providing this early version of the manuscript. The manuscript will undergo copyediting, typesetting, and review of the resulting proof before it is published in its final form. Please note that during the production process errors may be discovered which could affect the content, and all legal disclaimers that apply to the journal pertain.
REFERENCES
- Ahmed S, Brickner DG, Light WH, Cajigas I, McDonough M, Froyshteter AB, Volpe T, and Brickner JH (2010). DNA zip codes control an ancient mechanism for gene targeting to the nuclear periphery. Nat Cell Biol 12, 111–118. [DOI] [PMC free article] [PubMed] [Google Scholar]
- Amendola M, and van Steensel B (2014). Mechanisms and dynamics of nuclear lamina-genome interactions. Curr Opin Cell Biol 28, 61–68. [DOI] [PubMed] [Google Scholar]
- Americo J, Whiteley M, Brown JL, Fujioka M, Jaynes JB, and Kassis JA (2002). A complex array of DNA-binding proteins required for pairing-sensitive silencing by a polycomb group response element from the Drosophila engrailed gene. Genetics 160, 1561–1571. [DOI] [PMC free article] [PubMed] [Google Scholar]
- Aze A, Fragkos M, Bocquet S, Cau J, and Mechali M (2017). RNAs coordinate nuclear envelope assembly and DNA replication through ELYS recruitment to chromatin. Nat Commun 8, 2130. [DOI] [PMC free article] [PubMed] [Google Scholar]
- Bantignies F, Roure V, Comet I, Leblanc B, Schuettengruber B, Bonnet J, Tixier V, Mas A, and Cavalli G (2011). Polycomb-dependent regulatory contacts between distant Hox loci in Drosophila. Cell 144, 214–226. [DOI] [PubMed] [Google Scholar]
- Bejarano F, Gonzalez I, Vidal M, and Busturia A (2005). The Drosophila RYBP gene functions as a Polycomb-dependent transcriptional repressor. Mech Dev 122, 1118–1129. [DOI] [PubMed] [Google Scholar]
- Beliveau BJ, Joyce EF, Apostolopoulos N, Yilmaz F, Fonseka CY, McCole RB, Chang Y, Li JB, Senaratne TN, Williams BR, et al. (2012). Versatile design and synthesis platform for visualizing genomes with Oligopaint FISH probes. Proc Natl Acad Sci U S A 109, 21301–21306. [DOI] [PMC free article] [PubMed] [Google Scholar]
- Beuchle D, Struhl G, and Muller J (2001). Polycomb group proteins and heritable silencing of Drosophila Hox genes. Development 128, 993–1004. [DOI] [PubMed] [Google Scholar]
- Bolte S, and Cordelieres FP (2006). A guided tour into subcellular colocalization analysis in light microscopy. J Microsc 224, 213–232. [DOI] [PubMed] [Google Scholar]
- Brickner DG, Ahmed S, Meldi L, Thompson A, Light W, Young M, Hickman TL, Chu F, Fabre E, and Brickner JH (2012). Transcription factor binding to a DNA zip code controls interchromosomal clustering at the nuclear periphery. Dev Cell 22, 1234–1246. [DOI] [PMC free article] [PubMed] [Google Scholar]
- Brown CR, Kennedy CJ, Delmar VA, Forbes DJ, and Silver PA (2008). Global histone acetylation induces functional genomic reorganization at mammalian nuclear pore complexes. Genes Dev 22, 627–639. [DOI] [PMC free article] [PubMed] [Google Scholar]
- Buchwalter A, Kaneshiro JM, and Hetzer MW (2019). Coaching from the sidelines: the nuclear periphery in genome regulation. Nat Rev Genet 20, 39–50. [DOI] [PMC free article] [PubMed] [Google Scholar]
- Capelson M, Liang Y, Schulte R, Mair W, Wagner U, and Hetzer MW (2010). Chromatin-bound nuclear pore components regulate gene expression in higher eukaryotes. Cell 140, 372–383. [DOI] [PMC free article] [PubMed] [Google Scholar]
- Casolari JM, Brown CR, Drubin DA, Rando OJ, and Silver PA (2005). Developmentally induced changes in transcriptional program alter spatial organization across chromosomes. Genes Dev 19, 1188–1198. [DOI] [PMC free article] [PubMed] [Google Scholar]
- Casolari JM, Brown CR, Komili S, West J, Hieronymus H, and Silver PA (2004). Genome-wide localization of the nuclear transport machinery couples transcriptional status and nuclear organization. Cell 117, 427–439. [DOI] [PubMed] [Google Scholar]
- Cheutin T, and Cavalli G (2014). Polycomb silencing: from linear chromatin domains to 3D chromosome folding. Curr Opin Genet Dev 25, 30–37. [DOI] [PubMed] [Google Scholar]
- D’Angelo MA, and Hetzer MW (2008). Structure, dynamics and function of nuclear pore complexes. Trends Cell Biol 18, 456–466. [DOI] [PMC free article] [PubMed] [Google Scholar]
- D’Angelo MA, Raices M, Panowski SH, and Hetzer MW (2009). Age-dependent deterioration of nuclear pore complexes causes a loss of nuclear integrity in postmitotic cells. Cell 136, 284–295. [DOI] [PMC free article] [PubMed] [Google Scholar]
- D’Urso A, and Brickner JH (2017). Epigenetic transcriptional memory. Curr Genet 63, 435–439. [DOI] [PMC free article] [PubMed] [Google Scholar]
- Davis LI, and Blobel G (1987). Nuclear pore complex contains a family of glycoproteins that includes p62: glycosylation through a previously unidentified cellular pathway. Proc Natl Acad Sci U S A 84, 7552–7556. [DOI] [PMC free article] [PubMed] [Google Scholar]
- DeVido SK, Kwon D, Brown JL, and Kassis JA (2008). The role of Polycomb-group response elements in regulation of engrailed transcription in Drosophila. Development 135, 669–676. [DOI] [PubMed] [Google Scholar]
- Di Croce L, and Helin K (2013). Transcriptional regulation by Polycomb group proteins. Nat Struct Mol Biol 20, 1147–1155. [DOI] [PubMed] [Google Scholar]
- Doucet CM, Talamas JA, and Hetzer MW (2010). Cell cycle-dependent differences in nuclear pore complex assembly in metazoa. Cell 141, 1030–1041. [DOI] [PMC free article] [PubMed] [Google Scholar]
- Dunn KW, Kamocka MM, and McDonald JH (2011). A practical guide to evaluating colocalization in biological microscopy. Am J Physiol Cell Physiol 300, C723–742. [DOI] [PMC free article] [PubMed] [Google Scholar]
- Entrevan M, Schuettengruber B, and Cavalli G (2016). Regulation of Genome Architecture and Function by Polycomb Proteins. Trends Cell Biol 26, 511–525. [DOI] [PubMed] [Google Scholar]
- Filion GJ, van Bemmel JG, Braunschweig U, Talhout W, Kind J, Ward LD, Brugman W, de Castro IJ, Kerkhoven RM, Bussemaker HJ, et al. (2010). Systematic protein location mapping reveals five principal chromatin types in Drosophila cells. Cell 143, 212–224. [DOI] [PMC free article] [PubMed] [Google Scholar]
- Franks TM, Benner C, Narvaiza I, Marchetto MC, Young JM, Malik HS, Gage FH, and Hetzer MW (2016). Evolution of a transcriptional regulator from a transmembrane nucleoporin. Genes Dev 30, 1155–1171. [DOI] [PMC free article] [PubMed] [Google Scholar]
- Franz C, Walczak R, Yavuz S, Santarella R, Gentzel M, Askjaer P, Galy V, Hetzer M, Mattaj IW, and Antonin W (2007). MEL-28/ELYS is required for the recruitment of nucleoporins to chromatin and postmitotic nuclear pore complex assembly. EMBO Rep 8, 165–172. [DOI] [PMC free article] [PubMed] [Google Scholar]
- Gillespie PJ, Khoudoli GA, Stewart G, Swedlow JR, and Blow JJ (2007). ELYS/MEL-28 chromatin association coordinates nuclear pore complex assembly and replication licensing. Curr Biol 17, 1657–1662. [DOI] [PMC free article] [PubMed] [Google Scholar]
- Giot L, Bader JS, Brouwer C, Chaudhuri A, Kuang B, Li Y, Hao YL, Ooi CE, Godwin B, Vitols E, et al. (2003). A protein interaction map of Drosophila melanogaster. Science 302, 1727–1736. [DOI] [PubMed] [Google Scholar]
- Gonzalez I, Mateos-Langerak J, Thomas A, Cheutin T, and Cavalli G (2014). Identification of regulators of the three-dimensional polycomb organization by a microscopy-based genome-wide RNAi screen. Mol Cell 54, 485–499. [DOI] [PubMed] [Google Scholar]
- Harr JC, Luperchio TR, Wong X, Cohen E, Wheelan SJ, and Reddy KL (2015). Directed targeting of chromatin to the nuclear lamina is mediated by chromatin state and A-type lamins. J Cell Biol 208, 33–52. [DOI] [PMC free article] [PubMed] [Google Scholar]
- Ibarra A, Benner C, Tyagi S, Cool J, and Hetzer MW (2016). Nucleoporin-mediated regulation of cell identity genes. Genes Dev 30, 2253–2258. [DOI] [PMC free article] [PubMed] [Google Scholar]
- Jacinto FV, Benner C, and Hetzer MW (2015). The nucleoporin Nup153 regulates embryonic stem cell pluripotency through gene silencing. Genes Dev 29, 1224–1238. [DOI] [PMC free article] [PubMed] [Google Scholar]
- Joyce EF (2017). Toward High-Throughput and Multiplexed Imaging of Genome Organization. Assay Drug Dev Technol 15, 11–14. [DOI] [PubMed] [Google Scholar]
- Jung YL, Kang H, Park PJ, and Kuroda MI (2015). Correspondence of Drosophila polycomb group proteins with broad H3K27me3 silent domains. Fly (Austin) 9, 178–182. [DOI] [PMC free article] [PubMed] [Google Scholar]
- Kalverda B, and Fornerod M (2010). Characterization of genome-nucleoporin interactions in Drosophila links chromatin insulators to the nuclear pore complex. Cell Cycle 9, 4812–4817. [DOI] [PubMed] [Google Scholar]
- Kalverda B, Pickersgill H, Shloma VV, and Fornerod M (2010). Nucleoporins directly stimulate expression of developmental and cell-cycle genes inside the nucleoplasm. Cell 140, 360–371. [DOI] [PubMed] [Google Scholar]
- Kassis JA (1994). Unusual properties of regulatory DNA from the Drosophila engrailed gene: three “pairing-sensitive” sites within a 1.6-kb region. Genetics 136, 1025–1038. [DOI] [PMC free article] [PubMed] [Google Scholar]
- Kassis JA, and Brown JL (2013). Polycomb group response elements in Drosophila and vertebrates. Adv Genet 81, 83–118. [DOI] [PMC free article] [PubMed] [Google Scholar]
- Kehat I, Accornero F, Aronow BJ, and Molkentin JD (2011). Modulation of chromatin position and gene expression by HDAC4 interaction with nucleoporins. J Cell Biol 193, 21–29. [DOI] [PMC free article] [PubMed] [Google Scholar]
- Kelley K, Knockenhauer KE, Kabachinski G, and Schwartz TU (2015). Atomic structure of the Y complex of the nuclear pore. Nat Struct Mol Biol 22, 425–431. [DOI] [PMC free article] [PubMed] [Google Scholar]
- Kharchenko PV, Alekseyenko AA, Schwartz YB, Minoda A, Riddle NC, Ernst J, Sabo PJ, Larschan E, Gorchakov AA, Gu T, et al. (2010). Comprehensive analysis of the chromatin landscape in Drosophila melanogaster. Nature 471, 480–485. [DOI] [PMC free article] [PubMed] [Google Scholar]
- Kharchenko PV, Alekseyenko AA, Schwartz YB, Minoda A, Riddle NC, Ernst J, Sabo PJ, Larschan E, Gorchakov AA, Gu T, et al. (2011). Comprehensive analysis of the chromatin landscape in Drosophila melanogaster. Nature 471, 480–485. [DOI] [PMC free article] [PubMed] [Google Scholar]
- Labade AS, Karmodiya K, and Sengupta K (2016). HOXA repression is mediated by nucleoporin Nup93 assisted by its interactors Nup188 and Nup205. Epigenetics & chromatin 9, 54. [DOI] [PMC free article] [PubMed] [Google Scholar]
- Lanzuolo C, Roure V, Dekker J, Bantignies F, and Orlando V (2007). Polycomb response elements mediate the formation of chromosome higher-order structures in the bithorax complex. Nat Cell Biol 9, 1167–1174. [DOI] [PubMed] [Google Scholar]
- Lapetina DL, Ptak C, Roesner UK, and Wozniak RW (2017). Yeast silencing factor Sir4 and a subset of nucleoporins form a complex distinct from nuclear pore complexes. J Cell Biol 216, 3145–3159. [DOI] [PMC free article] [PubMed] [Google Scholar]
- Liang Y, Franks TM, Marchetto MC, Gage FH, and Hetzer MW (2013). Dynamic association of NUP98 with the human genome. PLoS Genet 9, e1003308. [DOI] [PMC free article] [PubMed] [Google Scholar]
- Liang Y, and Hetzer MW (2011). Functional interactions between nucleoporins and chromatin. Curr Opin Cell Biol 23, 65–70. [DOI] [PMC free article] [PubMed] [Google Scholar]
- Light WH, Freaney J, Sood V, Thompson A, D’Urso A, Horvath CM, and Brickner JH (2013). A conserved role for human Nup98 in altering chromatin structure and promoting epigenetic transcriptional memory. PLoS Biol 11, e1001524. [DOI] [PMC free article] [PubMed] [Google Scholar]
- Luperchio TR, Sauria MEG, Wong X, Gaillard MC, Tsang P, Pekrun K, Ach RA, Yamada NA, Taylor J, and Reddy JL (2018). Chromosome Conformation Paints Reveal The Role Of Lamina Association In Genome Organization And Regulation. BioRxiv. [Google Scholar]
- Luthra R, Kerr SC, Harreman MT, Apponi LH, Fasken MB, Ramineni S, Chaurasia S, Valentini SR, and Corbett AH (2007). Actively transcribed GAL genes can be physically linked to the nuclear pore by the SAGA chromatin modifying complex. J Biol Chem 282, 3042–3049. [DOI] [PubMed] [Google Scholar]
- Menon BB, Sarma NJ, Pasula S, Deminoff SJ, Willis KA, Barbara KE, Andrews B, and Santangelo GM (2005). Reverse recruitment: the Nup84 nuclear pore subcomplex mediates Rap1/Gcr1/Gcr2 transcriptional activation. Proc Natl Acad Sci U S A 102, 5749–5754. [DOI] [PMC free article] [PubMed] [Google Scholar]
- Nguyen SC, and Joyce EF (2019). Programmable Chromosome Painting with Oligopaints. Methods in molecular biology 2038, 167–180. [DOI] [PMC free article] [PubMed] [Google Scholar]
- Ollion J, Cochennec J, Loll F, Escude C, and Boudier T (2013). TANGO: a generic tool for high-throughput 3D image analysis for studying nuclear organization. Bioinformatics 29, 1840–1841. [DOI] [PMC free article] [PubMed] [Google Scholar]
- Osouda S, Nakamura Y, de Saint Phalle B, McConnell M, Horigome T, Sugiyama S, Fisher PA, and Furukawa K (2005). Null mutants of Drosophila B-type lamin Dm(0) show aberrant tissue differentiation rather than obvious nuclear shape distortion or specific defects during cell proliferation. Dev Biol 284, 219–232. [DOI] [PubMed] [Google Scholar]
- Pascual-Garcia P, Debo B, Aleman JR, Talamas JA, Lan Y, Nguyen NH, Won KJ, and Capelson M (2017). Metazoan Nuclear Pores Provide a Scaffold for Poised Genes and Mediate Induced Enhancer-Promoter Contacts. Mol Cell 66, 63–76 e66. [DOI] [PMC free article] [PubMed] [Google Scholar]
- Pascual-Garcia P, Jeong J, and Capelson M (2014). Nucleoporin Nup98 associates with Trx/MLL and NSL histone-modifying complexes and regulates Hox gene expression. Cell reports 9, 433–442. [DOI] [PubMed] [Google Scholar]
- Peric-Hupkes D, Meuleman W, Pagie L, Bruggeman SW, Solovei I, Brugman W, Graf S, Flicek P, Kerkhoven RM, van Lohuizen M, et al. (2010). Molecular maps of the reorganization of genome-nuclear lamina interactions during differentiation. Mol Cell 38, 603–613. [DOI] [PMC free article] [PubMed] [Google Scholar]
- Pickersgill H, Kalverda B, de Wit E, Talhout W, Fornerod M, and van Steensel B (2006). Characterization of the Drosophila melanogaster genome at the nuclear lamina. Nat Genet 38, 1005–1014. [DOI] [PubMed] [Google Scholar]
- Poleshko A, Shah PP, Gupta M, Babu A, Morley MP, Manderfield LJ, Ifkovits JL, Calderon D, Aghajanian H, Sierra-Pagan JE, et al. (2017). Genome-Nuclear Lamina Interactions Regulate Cardiac Stem Cell Lineage Restriction. Cell 171, 573–587 e514. [DOI] [PMC free article] [PubMed] [Google Scholar]
- Ptak C, and Wozniak RW (2016). Nucleoporins and chromatin metabolism. Curr Opin Cell Biol 40, 153–160. [DOI] [PubMed] [Google Scholar]
- Rabut G, Doye V, and Ellenberg J (2004a). Mapping the dynamic organization of the nuclear pore complex inside single living cells. Nat Cell Biol 6, 1114–1121. [DOI] [PubMed] [Google Scholar]
- Rabut G, Lenart P, and Ellenberg J (2004b). Dynamics of nuclear pore complex organization through the cell cycle. Curr Opin Cell Biol 16, 314–321. [DOI] [PubMed] [Google Scholar]
- Raices M, and D’Angelo MA (2017). Nuclear pore complexes and regulation of gene expression. Curr Opin Cell Biol 46, 26–32. [DOI] [PMC free article] [PubMed] [Google Scholar]
- Ramirez F, Lingg T, Toscano S, Lam KC, Georgiev P, Chung HR, Lajoie BR, de Wit E, Zhan Y, de Laat W, et al. (2015). High-Affinity Sites Form an Interaction Network to Facilitate Spreading of the MSL Complex across the X Chromosome in Drosophila. Mol Cell 60, 146–162. [DOI] [PMC free article] [PubMed] [Google Scholar]
- Rasala BA, Orjalo AV, Shen Z, Briggs S, and Forbes DJ (2006). ELYS is a dual nucleoporin/kinetochore protein required for nuclear pore assembly and proper cell division. Proc Natl Acad Sci U S A 103, 17801–17806. [DOI] [PMC free article] [PubMed] [Google Scholar]
- Rohner S, Kalck V, Wang X, Ikegami K, Lieb JD, Gasser SM, and Meister P (2013). Promoter- and RNA polymerase II-dependent hsp-16 gene association with nuclear pores in Caenorhabditis elegans. J Cell Biol 200, 589–604. [DOI] [PMC free article] [PubMed] [Google Scholar]
- Rosin LF, Nguyen SC, and Joyce EF (2018). Condensin II drives large-scale folding and spatial partitioning of interphase chromosomes in Drosophila nuclei. PLoS Genet 14, e1007393. [DOI] [PMC free article] [PubMed] [Google Scholar]
- Roy S, Ernst J, Kharchenko PV, Kheradpour P, Negre N, Eaton ML, Landolin JM, Bristow CA, Ma L, Lin MF, et al. (2010). Identification of functional elements and regulatory circuits by Drosophila modENCODE. Science 330, 1787–1797. [DOI] [PMC free article] [PubMed] [Google Scholar]
- Schirmer EC, and Gerace L (2005). The nuclear membrane proteome: extending the envelope. Trends Biochem Sci 30, 551–558. [DOI] [PubMed] [Google Scholar]
- Schmid M, Arib G, Laemmli C, Nishikawa J, Durussel T, and Laemmli UK (2006). Nup-PI: the nucleopore-promoter interaction of genes in yeast. Mol Cell 21, 379–391. [DOI] [PubMed] [Google Scholar]
- Sood V, and Brickner JH (2014). Nuclear pore interactions with the genome. Curr Opin Genet Dev 25, 43–49. [DOI] [PMC free article] [PubMed] [Google Scholar]
- Talamas JA, and Capelson M (2015). Nuclear envelope and genome interactions in cell fate. Front Genet 6, 95. [DOI] [PMC free article] [PubMed] [Google Scholar]
- Tan-Wong SM, Wijayatilake HD, and Proudfoot NJ (2009). Gene loops function to maintain transcriptional memory through interaction with the nuclear pore complex. Genes Dev 23, 2610–2624. [DOI] [PMC free article] [PubMed] [Google Scholar]
- van Bemmel JG, Pagie L, Braunschweig U, Brugman W, Meuleman W, Kerkhoven RM, and van Steensel B (2010). The insulator protein SU(HW) fine-tunes nuclear lamina interactions of the Drosophila genome. PLoS One 5, e15013. [DOI] [PMC free article] [PubMed] [Google Scholar]
- Van de Vosse DW, Wan Y, Lapetina DL, Chen WM, Chiang JH, Aitchison JD, and Wozniak RW (2013). A role for the nucleoporin Nup170p in chromatin structure and gene silencing. Cell 152, 969–983. [DOI] [PMC free article] [PubMed] [Google Scholar]
- van Steensel B, and Belmont AS (2017). Lamina-Associated Domains: Links with Chromosome Architecture, Heterochromatin, and Gene Repression. Cell 169, 780–791. [DOI] [PMC free article] [PubMed] [Google Scholar]
- Vaquerizas JM, Suyama R, Kind J, Miura K, Luscombe NM, and Akhtar A (2010). Nuclear pore proteins nup153 and megator define transcriptionally active regions in the Drosophila genome. PLoS Genet 6, e1000846. [DOI] [PMC free article] [PubMed] [Google Scholar]
- von Appen A, Kosinski J, Sparks L, Ori A, DiGuilio AL, Vollmer B, Mackmull MT, Banterle N, Parca L, Kastritis P, et al. (2015). In situ structural analysis of the human nuclear pore complex. Nature 526, 140–143. [DOI] [PMC free article] [PubMed] [Google Scholar]
- Wente SR, and Rout MP (2010). The nuclear pore complex and nuclear transport. Cold Spring Harb Perspect Biol 2, a000562. [DOI] [PMC free article] [PubMed] [Google Scholar]
- Wong X, Luperchio TR, and Reddy KL (2014). NET gains and losses: the role of changing nuclear envelope proteomes in genome regulation. Curr Opin Cell Biol 28, 105–120. [DOI] [PubMed] [Google Scholar]
- Zhan S, Wang T, Ge W, and Li J (2018). Multiple roles of Ring 1 and YY1 binding protein in physiology and disease. Journal of cellular and molecular medicine 22, 2046–2054. [DOI] [PMC free article] [PubMed] [Google Scholar]
- Zierhut C, Jenness C, Kimura H, and Funabiki H (2014). Nucleosomal regulation of chromatin composition and nuclear assembly revealed by histone depletion. Nat Struct Mol Biol 21, 617–625. [DOI] [PMC free article] [PubMed] [Google Scholar]
Associated Data
This section collects any data citations, data availability statements, or supplementary materials included in this article.
Supplementary Materials
Primers, related to STAR Methods and Figures 1,5,6,7.
FISH probes, related to STAR Methods and Figures 5,6.
Elys intersect peaks, related to Figure 1.
Nup93 intersect peaks, related to Figure 1.
Nup107 intersect peaks, related to Figure 1.
Data Availability Statement
The GEO accession for all sequencing data is GSE136117, which is a superset that contains two subsets - GSE135610 subset for ChIP-seq of Nups and GSE136115 subset for ChIP-seq of Lamin.