Abstract
We aimed to develop radioligands for PET imaging of brain phosphodiesterase subtype 4D (PDE4D), a potential target for developing cognition enhancing or anti-depressive drugs. Exploration of several chemical series gave four leads with high PDE4D inhibitory potency and selectivity, optimal lipophilicity, and good brain uptake. These leads featured alkoxypyridinyl cores. They were successfully labeled with carbon-11 (t1/2 = 20.4 min) for evaluation with PET in monkey. Whereas two of these radioligands did not provide PDE4D-specific signal in monkey brain, two others, [11C]T1660 and [11C]T1650, provided sizeable specific signal, as judged by pharmacological challenge using rolipram or a selective PDE4D inhibitor (BPN14770) and subsequent biomathematical analysis. Specific binding was highest in prefrontal cortex, temporal cortex, and hippocampus, regions that are important for cognitive function. [11C]T1650 was progressed to evaluation in humans with PET, but the output measure of brain enzyme density (VT) increased with scan duration. This instability over time suggests that radiometabolite(s) were accumulating in the brain. BPN14770 blocked PDE4D uptake in human brain after a single dose, but the percentage occupancy was difficult to estimate because of the unreliability of measuring VT. Overall, these results show that imaging of PDE4D in primate brain is feasible, but that further radioligand refinement is needed, most likely to avoid problematic radiometabolites.
Keywords: Phosphodiesterase-4D (PDE4D), Inhibitor, Radioligand, PET, Carbon-11
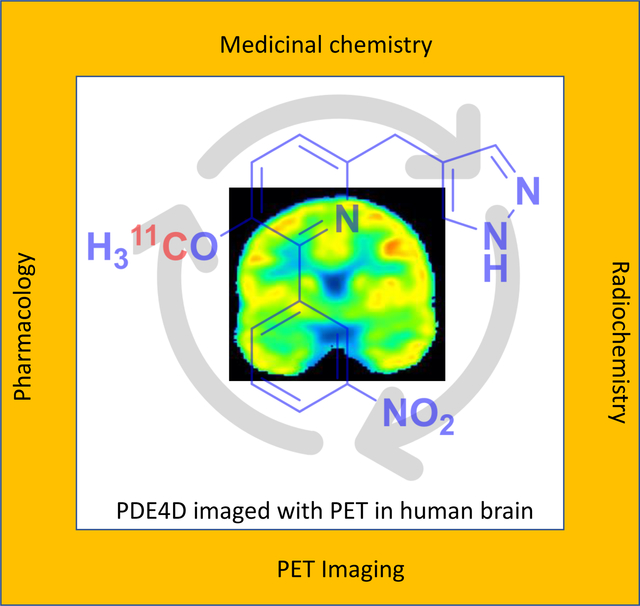
GRAPHICAL ABSTRACT
INTRODUCTION
Nearly all psychiatric medications influence the action of the biogenic amines, dopamine or serotonin. These medications include reuptake inhibitors, inhibitors of biogenic amine metabolism, and subtype-selective receptor agonists, antagonists, and inverse agonists. Biogenic amines signal through their G-protein coupled receptors which may in turn activate or inhibit various forms of adenylate cyclase to increase or decrease levels of the intracellular second messenger, cAMP. The spatial and temporal patterning of cAMP signaling is principally regulated by a family of hydrolytic enzymes known as phosphodiesterase-4 (PDE4),1–4 a member of a broad superfamily of eleven types of phosphodiesterases.5 Signaling through cAMP activates downstream effectors such as cAMP-dependent protein kinase A (PKA) which in turn phosphorylates a key intracellular regulator, known as cAMP response element binding protein (CREB).6 CREB phosphorylation is needed for short- and long-term forms of memory and in turn regulates transcription of the gene encoding brain-derived neurotrophic factor (BDNF).7,8 The PDE4 gene family consists of four subtypes, PDE4A, PDE4B, PDE4C, and PDE4D, which through alternative promoter usage and mRNA splicing encode multiple protein isoforms that differ in their cellular localization, transcriptional or post-transcriptional regulation, and activity as dimers or monomers.9–11 The 4A, 4B, and 4D subtypes exist in brain, but not 4C.
Much evidence indicates that PDE4 inhibition may have therapeutic benefit in neuropsychiatric disorders5 BDNF levels are decreased in major depression and can be increased by serotonin-reuptake inhibitors such as fluoxetine and citalopram through their ability to increase brain levels of cAMP.12,13 PDE4 levels are decreased in major depression14 and this decrease is reversed by treatment with a serotonin-reuptake inhibitor (citalopram).15 These studies have provided mechanistic insight into major depression and have suggested novel avenues for therapeutic intervention, such as through the inhibition of PDE4. One of the earliest inhibitors of PDE4 subtypes, rolipram, was developed for major depression but was abandoned due to limited efficacy coupled with nausea and emesis as major dose-limiting side-effects.16 Rolipram binds to all three PDE4 subtypes in brain. Studies now imply that selective inhibition of the PDE4D subtype may conserve antidepressant effect and decrease side-effect liability.17 Genetic variation in PDE4B and PDE4D associates with biological variation in human cognitive function across multiple, large genome-wide association studies,18 whereas genetic linkage studies potentially associate PDE4B gene variants with schizophrenia.19–22 Therefore, selective PDE4 subtype inhibitors, rather than pan-PDE4 subtype inhibitors, are now keenly sought as potential therapeutics.23–25
At a few research institutes, PDE4 has been imaged in human subjects with positron emission tomography (PET) using the pan-subtype selective radioligand, [11C](R)-rolipram.14,26,27 To expand on these initial findings, we have sought to develop PDE4 subtype-selective PET radioligands for brain imaging in human subjects with potential value for drug discovery and the investigation of neuropsychiatric disorders. We now report the discovery of novel PET radioligands selective for PDE4D that for the first time enable imaging of the distribution of this enzyme in the living primate brain.
RESULTS AND DISCUSSION
Ligand Design.
We embarked on an extensive program of chemical optimization for the development of a PDE4D-selective PET radioligand. Previously, we have reported potent and selective PDE4D allosteric inhibitors in a methoxyphenyl series in which the core is decorated with aromatic arms that we designated as Ar1 and Ar2, as here exemplified in the inhibitors 1 and 2 (Figure 1).23 The PDE4D allosteric binding site is created by the closure of a portion of a regulatory helix, known as the upstream conserved region 2 (UCR2 ~ 78 amino acids), over the active site. An inhibitor completes a hydrophobic surface which permits docking by the largely hydrophobic face of UCR2.23 The key UCR2 residue for PDE4D allosteric inhibitor selectivity is phenylalanine276. In PDE4A-C the corresponding residue is a tyrosine. Phenylalanine276 fits into a hydrophobic cleft in the active site made by isoleucine617, methionine514, and leucine560, whereas residues valine268, isoleucine272, and leucine277 form one face of the UCR2 helix that can interact with residues glycine612, tyrosine616, isoleucine617, and methionine518 across the hydrophobic surface of the catalytic domain. Largely hydrophilic residues are exposed to solvent on the opposite surface of the regulatory helix. The major challenge in our lead optimization for PET radioligand development was therefore to balance hydrophobicity (needed for ligand docking) against hydrophilicity (to reduce non-specific brain uptake). Moderate lipophilicity represented by a logD value of around 2.2 is often considered desirable in a PET radioligand for imaging a protein target within brain.28 We also utilized the concept of multi-parameter optimization (MPO) as applied to PET radioligands in the selection of compounds for synthesis.24
Figure 1:
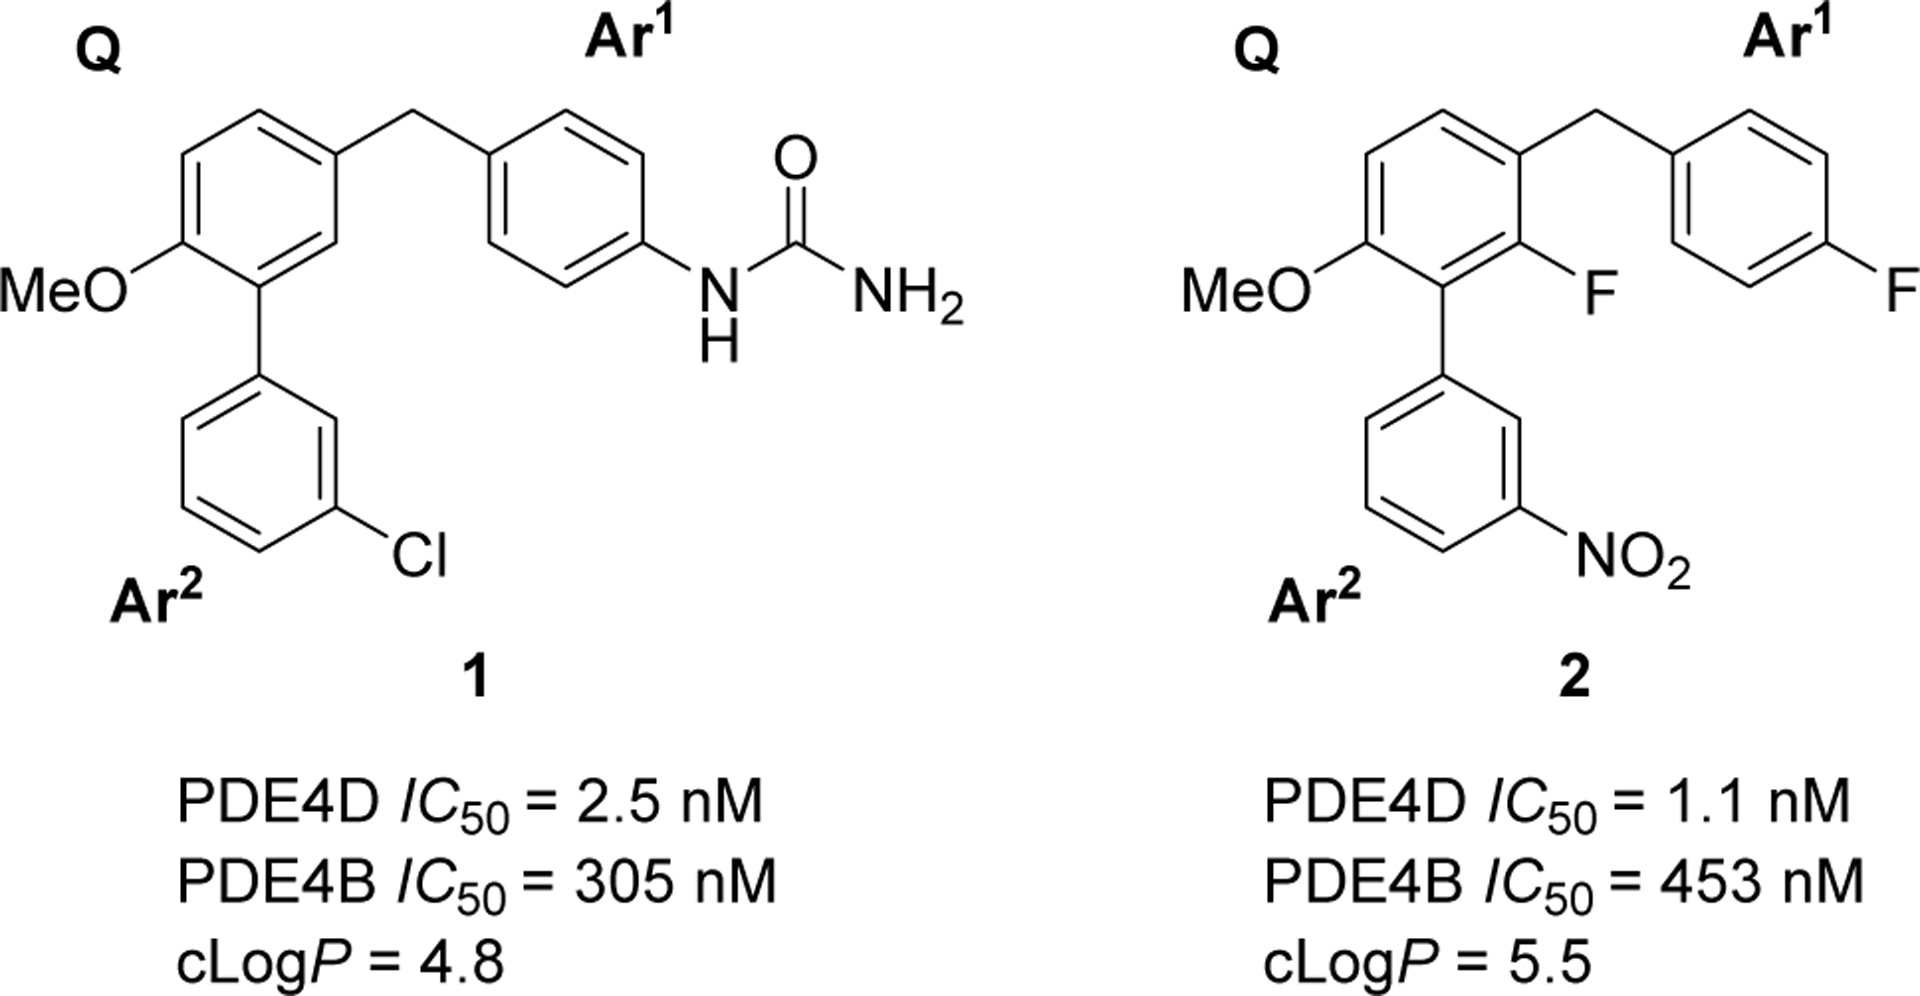
Potent and selective PDE4D inhibitors D159687(1) and D158681 (2) reported in Burgin et al.23 A pair of aromatic substituents Ar1 and Ar2 project from a methoxyphenyl core (Q).
Early chemical series of PDE4D inhibitors that we considered for PET radioligand development were primarily neutral compounds based on analogs of 1 and 2 and were developed sequentially with dihydrobenzofuranyl, phenyl, pyridinyl, pyrimidinyl, and reverse pyrimidinyl cores (SI, Figure S1). Chemical optimization focused on lowering clogP from the high values of 1 and 2 (Figure 1) by introducing a basic nitrogen into the core and/or into Ar1 and this helped improve the PET MPO scores to greater than 3.0 (Table 1).
Table 1.
Chemical properties and PDE4 inhibitory potencies of four compounds (3–6) selected for radiolabeling from the indicated desmethyl precursors (7–10).
| Inhibitor | Structure | cLogPa | cLogD7.4a | PET MPO | IC50 (nM)b | Selectivity for PDE4D* over PDE4B | SUVc | Labeling precursor | |
|---|---|---|---|---|---|---|---|---|---|
| PDE4D7* | PDE4B | ||||||||
| 3 (T1953) | 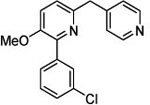 |
2.67 | 2.66 (3.45) | 3.1 | 5.12 | 720 | 141 | 0.94 | 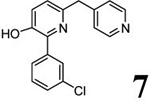 |
| 4 (T2525) | 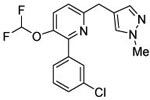 |
3.58 | 3.58 (3.07) | 2.6 | 0.5 | 858 | 1672 | 1.44 |  |
| 5 (T1660) | 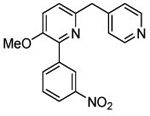 |
3.94 | 3.93 (3.38) | 3.5 | 2.8 | 280 | 101 | 1.76 |  |
| 6 (T1650) | 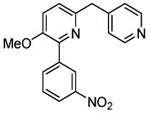 |
3.48 | 3.48 (2.89) | 3.9 | 3.5 | 1120 | 320 | 1.76 |  |
LogP and logD7.4 values were calculated with Pallas software; values in parentheses were measured with the radiolabeled compound (see SI for details).
Human PDE4D7* contained a mutation of S129D to mimic activation by cAMP-dependent protein kinase A (PKA), whereas PDE4B1 contained the mutation S133D.
Brain uptake in mice after intravenous dosing (SUV = standardized uptake value calculated as ([brain Cmax (ng/mL)/dose (mg/kg)/1000]).
Chemistry
Scheme 1 outlines the methods used to synthesize the four PDE4D inhibitors, 3–6, that were selected for labeling. Compounds 3, 5, and 6 were synthesized in a straightforward manner from the known compounds 11 and 12.29 A Suzuki reaction with the appropriate Ar1 boronic acid or boronic ester generated compounds 3, 5, and 6. Synthesis of 4 started with commercially available 13 to prepare the difluoromethoxy compound 14 which was converted into the benzyl bromide 15. A Suzuki reaction was then used to generate 4. Syntheses of the O-desmethyl labeling precursors 7, 9, and 10 and the N-desmethyl precursor, 8, are described in SI.
Scheme 1.
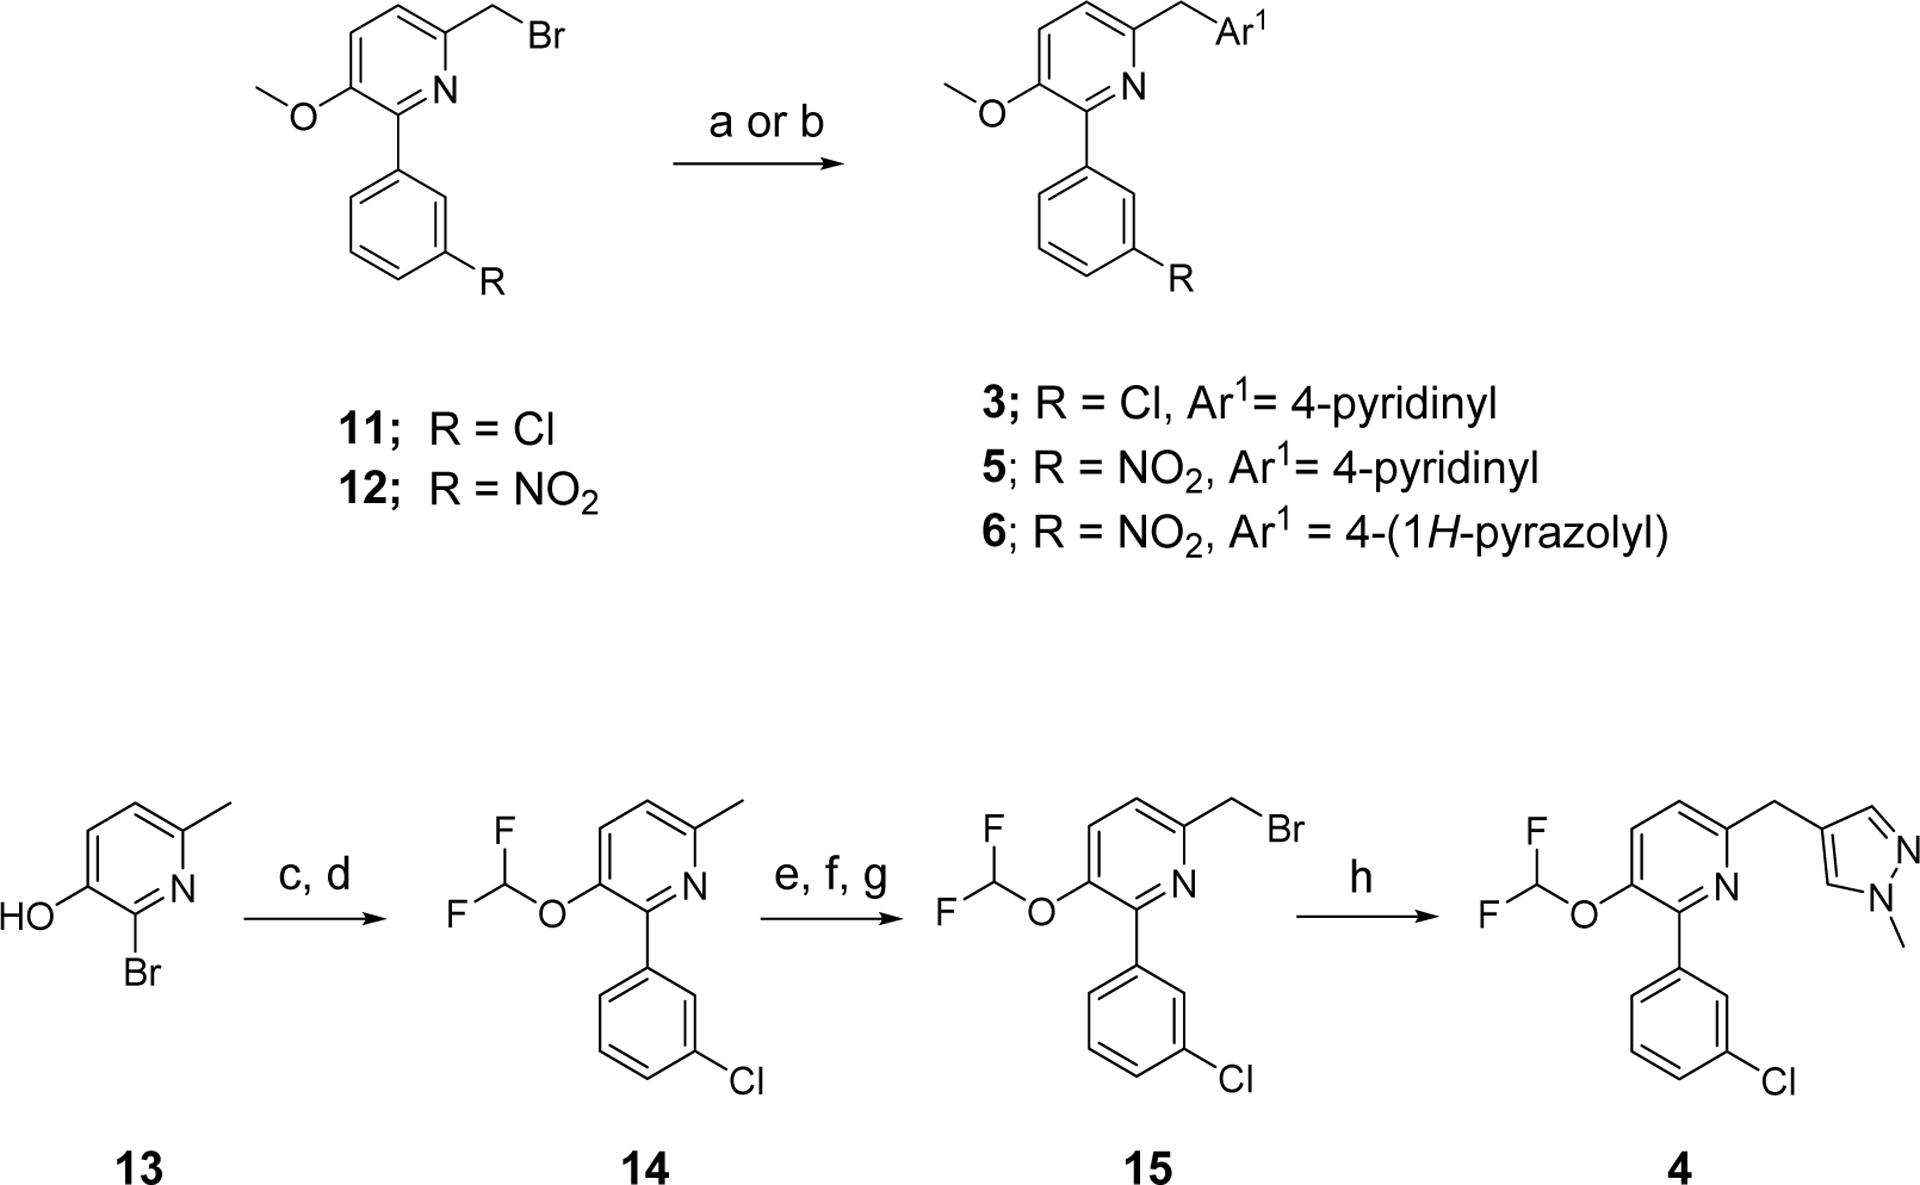
Syntheses of ligands selected for radiolabelinga.
aReagents and Conditions: a) for 3 and 5: pyridine-4-boronic acid, Pd(dppf)Cl2, K3PO4, dioxane-water, 90 °C, 2 h; b) for 6: 1-Boc-4-(4,4,5,5-tetramethyl-1,3,2-dioxaborolan-2-yl)-1H-pyrazole, Pd(dppf)Cl2, K3PO4, dioxane-water, 90 °C, 15 h; c) sodium chlorodifluoroacetate, Cs2CO3, DMF, 65 °C, 48 h; d) (3-chlorophenyl)boronic acid, K3PO4, SiliaCat® DPP-Pd, dioxane, 85 °C, 4.5 h; e) mCPBA, DCM, RT, 18 h; f) i. TFA, DCM, reflux, 2 h; ii. LiOH·H2O, MeOH, RT, 3 h; g) PBr3, DCM RT, overnight; h) (1-methyl-1H-pyrazol-4-yl)boronic acid, Pd(dppf)Cl2, K3PO4., dioxane-water, 90 °C, 12 h.
Structure-activity Relationships and Selection of Compounds for Radiolabeling.
A high proportion, (~ 35%) of the more than 160 compounds synthesized were highly potent against PDE4D (IC50 ≤ 10 nM), showing excellent control over structure-activity relationship for PDE4D allosteric inhibition (SI, Figure S1). PDE4D inhibitory potency decreased to some extent across the structural classes in the order of their investigation as the lipophilicity (logP) was generally lowered, but selectivity for PDE4D was maintained. Potent and selective compounds were advanced to mouse iv cassette pharmacokinetics, based on PET MPO calculations, in order to generate an SUV.
Of the compounds meeting the criteria for inhibitory potency for PDE4D* of IC50 ≤ 10 nM and selectivity over PDE4B of >100-fold, four pyridinyl core compounds, 3–6, were selected for radiolabeling and evaluation as PET ligands. In addition to potency and selectivity, the compounds possessed moderate computed lipophilicities, favorable PET MPO scores and acceptable peak uptake (> 1 SUV) in mouse brain (Table 1). Compounds 5 (T1660) and 6 (T1650) showed brain uptake well above 1 SUV (Table 1). Profiling of 6 against a panel of GPCRs and other binding sites did not reveal significant off-target binding activity (NIMH Psychoactive Drug Screening Panel). The single hit with IC50 < 10 μM was the serotonin 5-HT2B receptor (IC50 = 766 nM).
Radiochemistry.
Each selected inhibitor was labeled with carbon-11 by O-methylation or N-methylation of the respective desmethyl precursor (Table 1, compounds 7–10) with no-carrier-added [11C]iodomethane, itself produced from cyclotron-produced [11C]carbon dioxide (Scheme 2). Each radioligand was then purified by reversed phase HPLC (SI, Figures S2A–S6A) and formulated for intravenous injection in adequate activity for PET imaging in monkey or human (SI, Table S3). Each radioligand was obtained in greater than 13% radiochemical yield from [11C]carbon dioxide with high molar activity (> 228 GBq/μmol; SI, Table S3), with high radiochemical purity (> 99%), and in the absence of contaminating chemical impurities (SI, Figures S2B–S6B). Each radioligand was radiochemically stable in formulation media for up to one hour at room temperature.
Scheme 2.
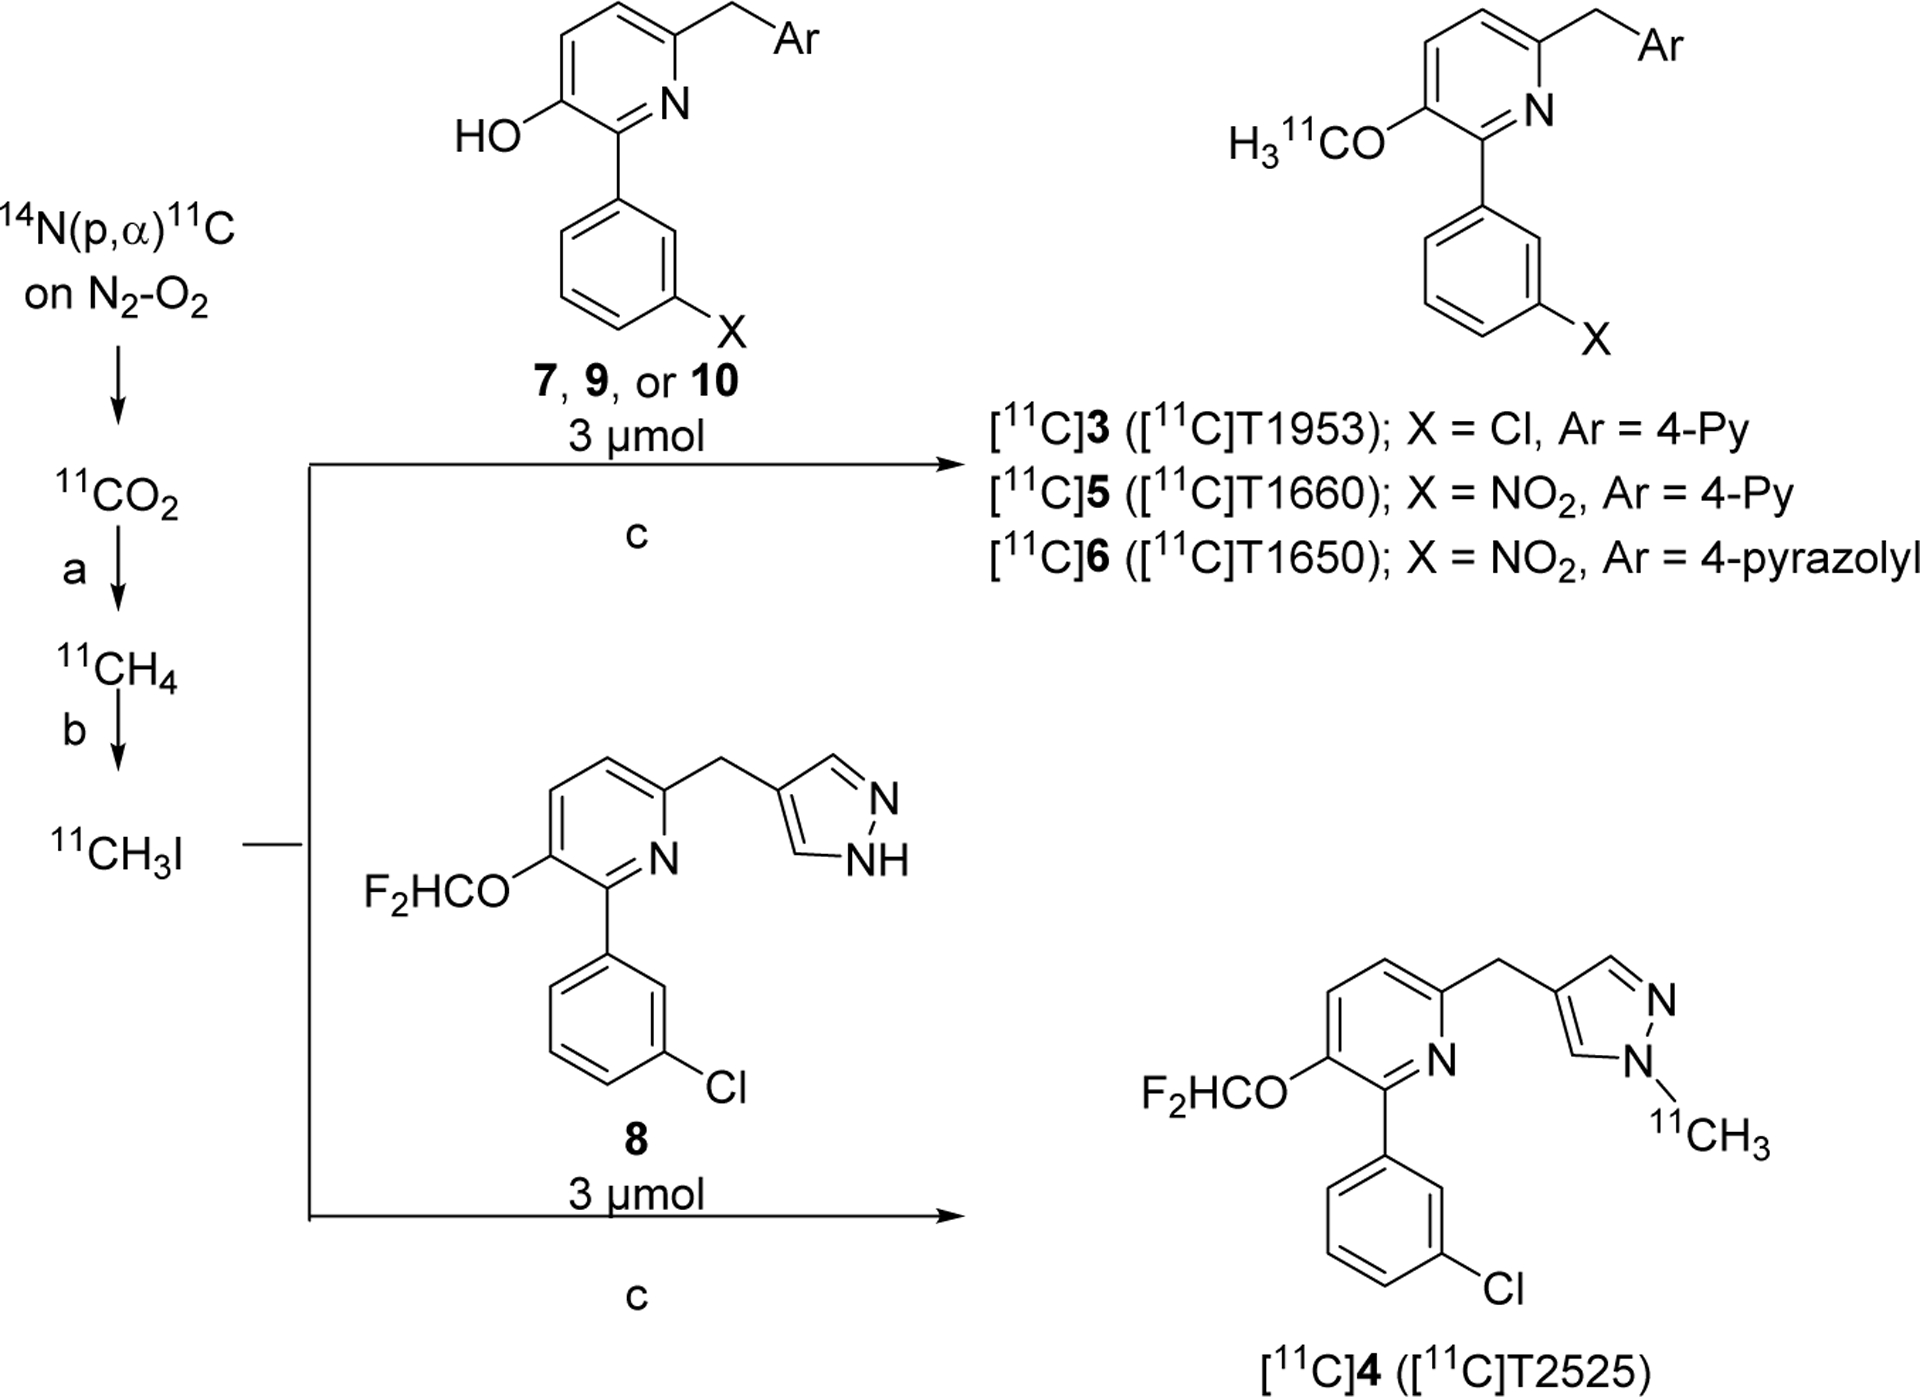
Labeling of candidate PDE4D PET radioligands with carbon-11a.
aReagents and Conditions: a) H2, Ni, 360 °C; b) I2, 720 °C; c), either 1 M TBAH (for 3) or 1 M t-BuOK (15 μL, 3.15 μmol)(for 4–6) in DMF (80 μL), RT, 5 min.
PET Imaging in Monkey.
After intravenous administration of [11C]T2525 ([11C]4) to monkey at baseline, radioactivity rapidly peaked at a high level in whole brain (5.09 SUV at 4 min), and then declined to a low level (0.79 SUV) by the end of the scan at 120 minutes (SI, Figure S7A). To assess any existence of PDE4 specific uptake, we selected the PDE4 inhibitor rolipram as a preblocking agent that differs in chemotype to the radioligand. In the subsequent scanning session where rolipram (0.1 mg/kg) was administered intravenously to the same monkey at 5 minutes before [11C]T2525, a similar whole brain time-activity curve was obtained (SI, Figure S7A). Moreover, the radiometabolite-corrected arterial input functions for these two PET experiments were very similar (SI, Figure S7B), as were the measured plasma free fractions (fP) of 1.4% at baseline and 1.75% under preblock (SI, Table S2). Compartmental modeling corrects for the difference in blood flow and exposure of the brain under baseline and blocked conditions by calculating the total volume of distribution (VT). Brain data could be fitted with two-tissue compartmental modeling. However, VT was not appreciably changed after blockade with rolipram showing that there was no appreciable specific binding to PDE4D or other subtypes.
After intravenous administration of [11C]T1953 ([11C]3) to monkey at baseline, radioactivity rapidly peaked at high levels (4.32 SUV at 4.5 min) in brain regions, such as frontal cortex, hippocampus, and cerebellum, and then declined to a low level (1.07 SUV) by the end of the scan at 90 minutes (SI, Figure S8A). In a subsequent scanning session, where rolipram (0.5 mg/kg) was administered intravenously to the same monkey at 5 minutes before [11C]T1953, similar brain region time-activity curves were obtained but with somewhat faster washout of radioactivity (SI, Figure S8A). Moreover, the radiometabolite-corrected arterial input functions for these two PET experiments differed appreciably, with unchanged radioligand disappearing less rapidly from plasma in the baseline experiment (SI, Figure S8B), whereas the measured plasma free fractions were very similar (1.60 and 1.64%, respectively; Table S4). VT values and VT/fP values were well derived by two-tissue compartmental modeling. The fitting revealed increases, not decreases, across brain regions following rolipram pretreatment (data not shown). Therefore, no specific binding to PDE4D or other subtypes was detected.
After intravenous administration of [11C]T1660 ([11C]5) to a monkey at baseline, radioactivity peaked early in brain at a high level (3.52 SUV at 5.5 min) and then declined to a moderately low level (1.58 SUV) at 90 min (SI, Figure S9A). In a subsequent scanning session, in which rolipram (1.0 mg/kg) was administered intravenously to the same monkey at 10 minutes before [11C]T1660, radioactivity in brain peaked earlier and higher (4.15 SUV at 2.25 min) than in the baseline scan, but then rapidly declined to 0.65 SUV at 85 minutes (SI, Figure S9A). Radioactivity and parent radioligand cleared rapidly from arterial plasma during both scans (SI, Figure S9B). There was little change in fP between the baseline and blocked scans (7.8% and 8.5%, respectively; Table S4). VT values and VT/fP values were well derived by two-tissue compartmental modeling. Rolipram pretreatment decreased VT values and VT/fP values by 37% and 45%, respectively across whole brain. The highest levels of specific binding (VS), calculated as differences between VT at baseline and after rolipram pretreatment, were in frontal cortex, temporal cortex, and hippocampus. Cerebellum had only a very low level of specific binding (SI, Figure S9C). PDE4D target occupancy by rolipram in monkey brain was assessed for [11C]T1660 with a Lassen plot (Figure 2A).30 The assumptions in a Lassen plot are: i) that there is a range of brain regions with differing target density (Bmax), ii) nonspecific binding (VND) is homogeneous across brain, and iii) target occupancy is the same in all regions. In the Lassen plot, target occupancy is given by the slope of the specific binding [VT(Baseline)−VT(Blocked)] versus VT(Baseline). Occupancy by rolipram in this [11C]T1660 study was estimated to be 79%
Figure 2.
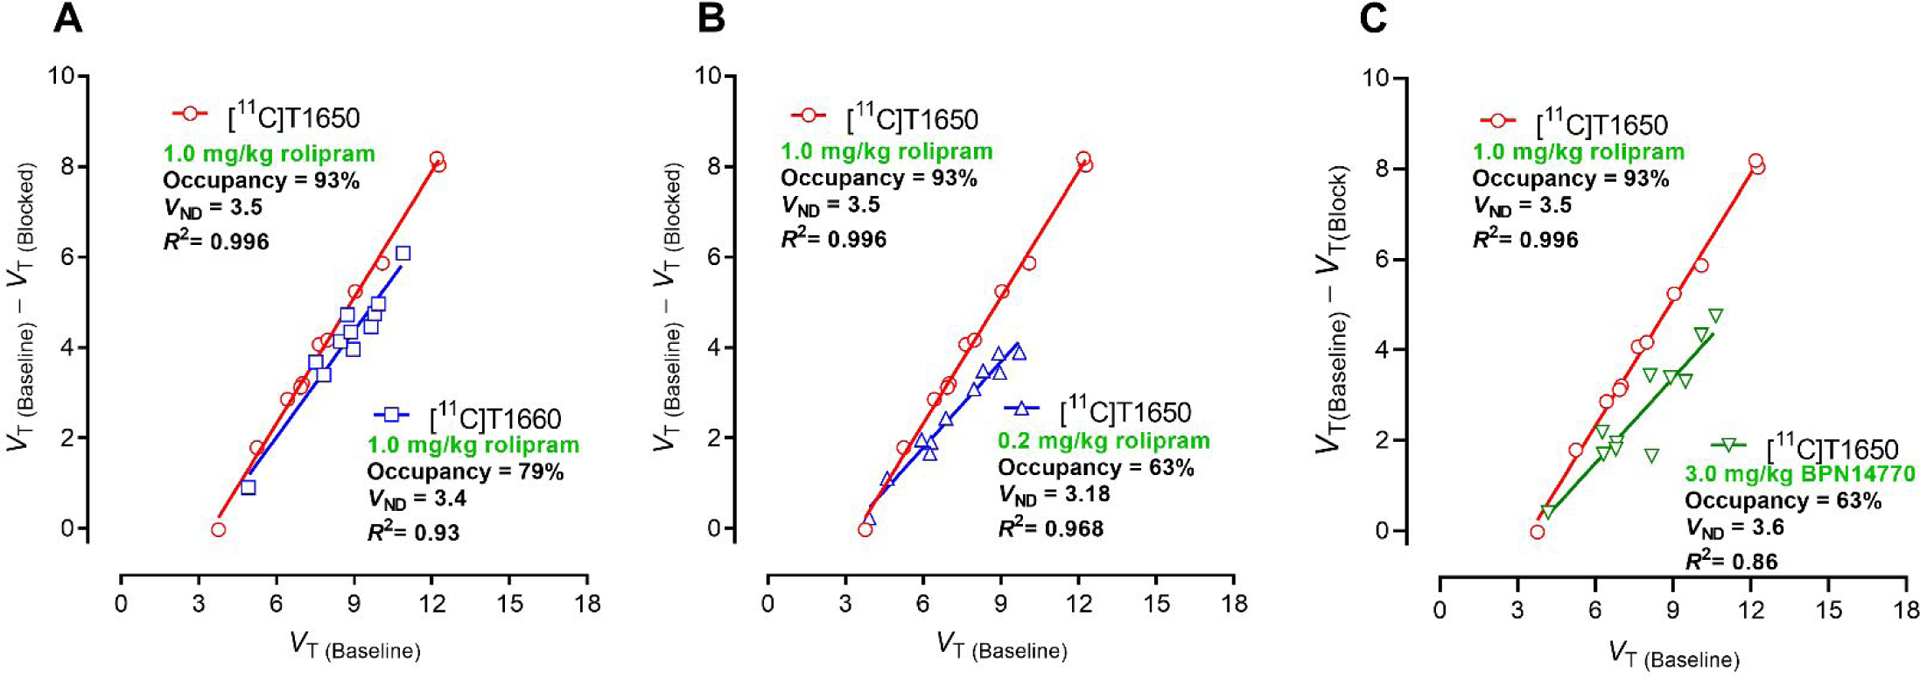
Lassen plots for [11C]T1660 and [11C]T1650 in monkey based on total distribution volume (VT) measured by two-tissue compartment modeling in monkey brain. Target occupancy is given by the slope, while the non-displaceable tracer volume (VND) is given by the X-axis intercept. A: Comparison of Lassen plots for [11C]T16550 and [11C]T1660 in which rolipram was used as a preblocker at 1.0 mg/kg, i.v. B: Effect of reducing rolipram intravenous preblock dose from 1.0 mg/kg to 0.2 mg/kg on Lassen plot, showing decreased slope (occupancy). C. Comparison of Lassen plots for use of rolipram at 1.0 mg/kg (i.v.) or BPN14770 at 3.0 mg.kg (i.v.) as preblocking agent for [11C]T1650. Note all Lassen plots gave similar VND values for [11C]T1650. For the use of BPN as preblocker, binding potential (BPND) for whole brain was estimated to be 1.2.
When dosed in rhesus monkey at baseline, the PET time-activity curves for [11C]T1650 ([11C]6) showed early and high radioactivity uptake in whole brain (3.28 SUV at 5 min) followed by extended washout to a moderately low level (1.39 SUV at 90 min and 1.20 SUV at 120 min (Figure 3A). In a subsequent scanning session, where the selective PDE4D inhibitor BPN14770 (3 mg/kg) was administered intravenously to the same monkey at 5 minutes before [11C]T1650, radioactivity in brain peaked early and higher (3.9 SUV at 4 min) than in the baseline scan, but then rapidly declined to 0.93 SUV at 90 minutes (Figure 3A). In the same experiments, radioligand concentration decreased rapidly in plasma over the duration of each scan, and in a similar manner (Figure 3B). There was no change in the input function (arterial plasma) or fP between the baseline (6.0%) and blocked scans (6.7%) (SI, Table S4). VT values and VT/fP values were derived well by two-tissue compartmental modeling. VT decreased by 37%, revealing appreciable specific binding (VS) of the radioligand (Figure 3C). A separate pair of PET experiments with [11C]T1650, using rolipram (1 mg/kg, i.v) as preblocking agent, instead of BPN14770, gave highly comparable brain time-activity curves (SI, Figure S10A) and time-activity curves of parent radioligand in plasma (SI, Figure 10B). There was little change in fP between the baseline and blocked scans (7.0% and 6.2%, respectively), and VT and VT/fP values decreased by 48% and 41%, respectively, across whole brain (SI, Figure S10C).
Figure 3.
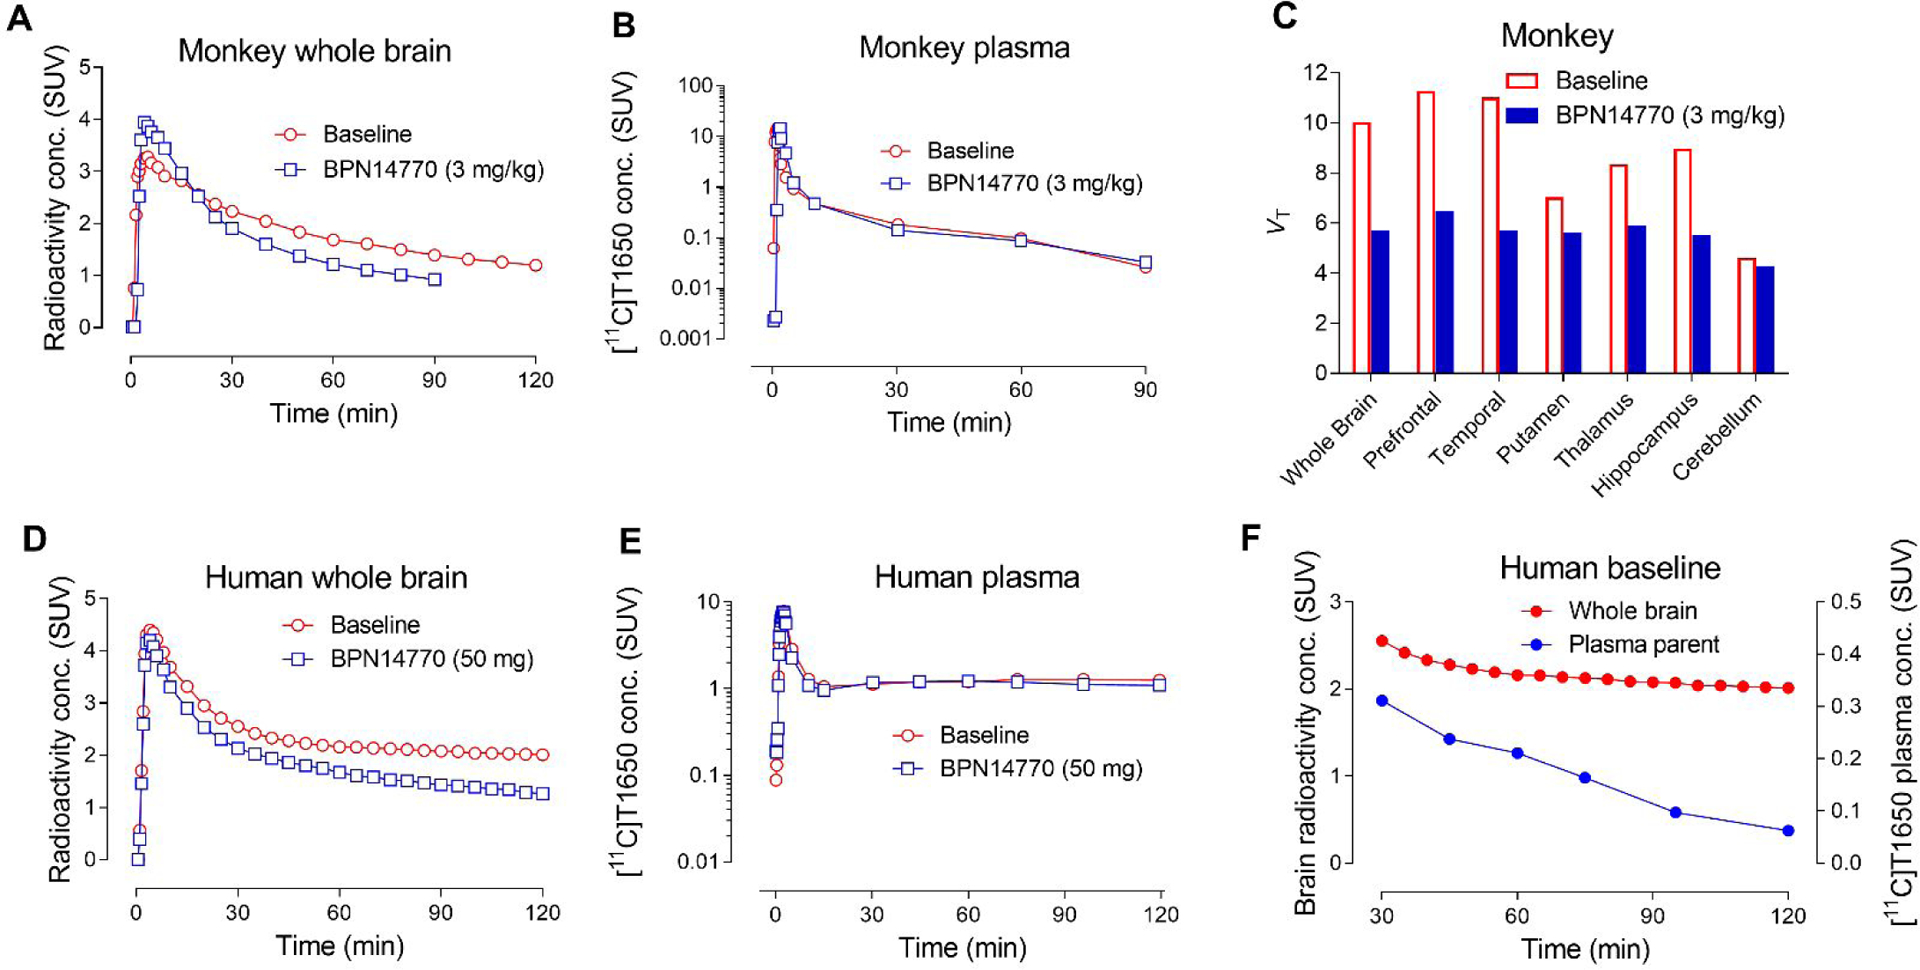
PET imaging of [11C]T1650 in monkey and human. Time-activity curves for monkey brain at baseline, and two hours after BPN14770 (3 mg/kg, i.v.) administration in the same monkey (A). Time-activity curves of parent radioligand in plasma in the same paired monkey experiments (B). Derived measures of VT across monkey brain regions at baseline and after the preblock with BPN14770 (C). Time-activity curves of human brain at baseline and at two hours later after taking the first dose (50 mg) of BPN14770 (blocked scan) (D). Corresponding time-activity curves of parent radioligand in plasma at baseline and at two hours after taking the first dose of BPN14770 in human (E). Comparison of time-activity curves for parent radioligand in plasma and radioactivity in brain at baseline (30–120 min). Plasma parent SUV decreased throughout the scan while brain SUV remained mostly stable (F).
Time-activity curves in monkey whole brain and brain regions, such as PDE4D-rich frontal cortex and PDE4D-poor cerebellum, were readily fitted to a two-tissue compartmental model (Figure 4A). VT values in these regions increased as the length of scanning period after radioligand injection used in their estimations was increased. VT values from the initial 60 minutes of scan data reached 90% of the values from the full 120 minutes of scan data (Figure 4B).
Figure 4.
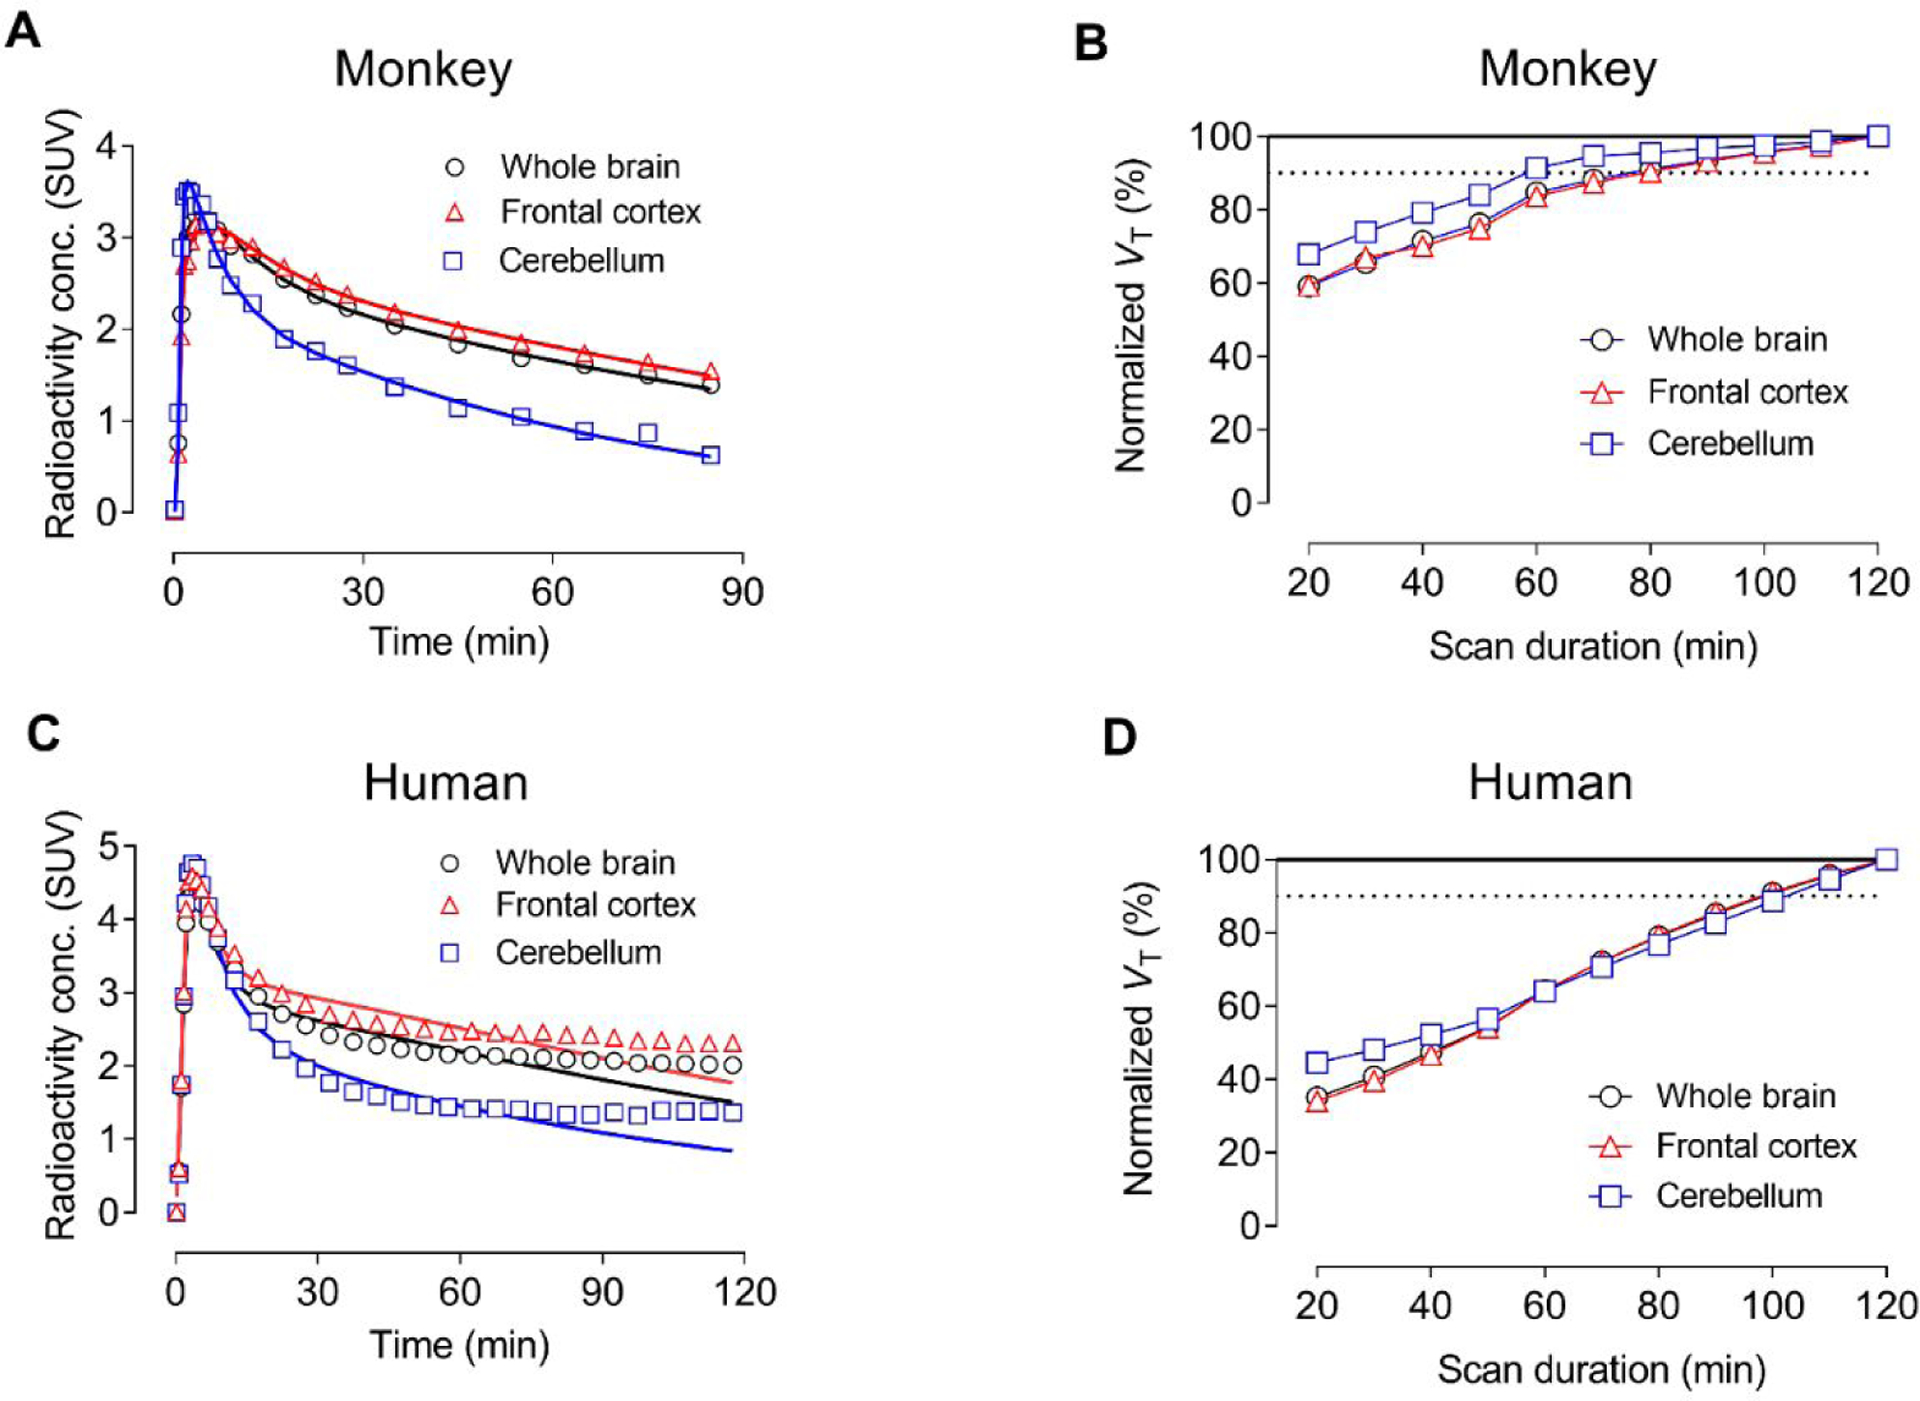
Analysis of PET imaging of whole brain, frontal cortex, and cerebellum with [11C]T1650. (A) Time-activity data fitted using two-tissue compartmental modeling in monkey brain (fits are solid lines). (B) Apparent total distribution volume (VT) time-stability curves for monkey brain. (C) Time-activity data fitted using two-tissue compartmental modeling in human brain (fits are solid lines). Note: Accurate quantification of VT was complicated by the accumulation of radiometabolites in human brain. (D) Apparent total distribution volume (VT) time-stability curves for human brain. The steady increase in VT over the course of the scan is likely due to the accumulation of radiometabolite(s) both entering and forming in human brain.
Coronal parametric PET scans (VT) of monkey brain, obtained with [11C]T1650, showed contrasting heterogeneous and relatively homogeneous distributions under baseline (Figure 5A) and pre-blocked (Figure 5B) conditions.
Figure 5.
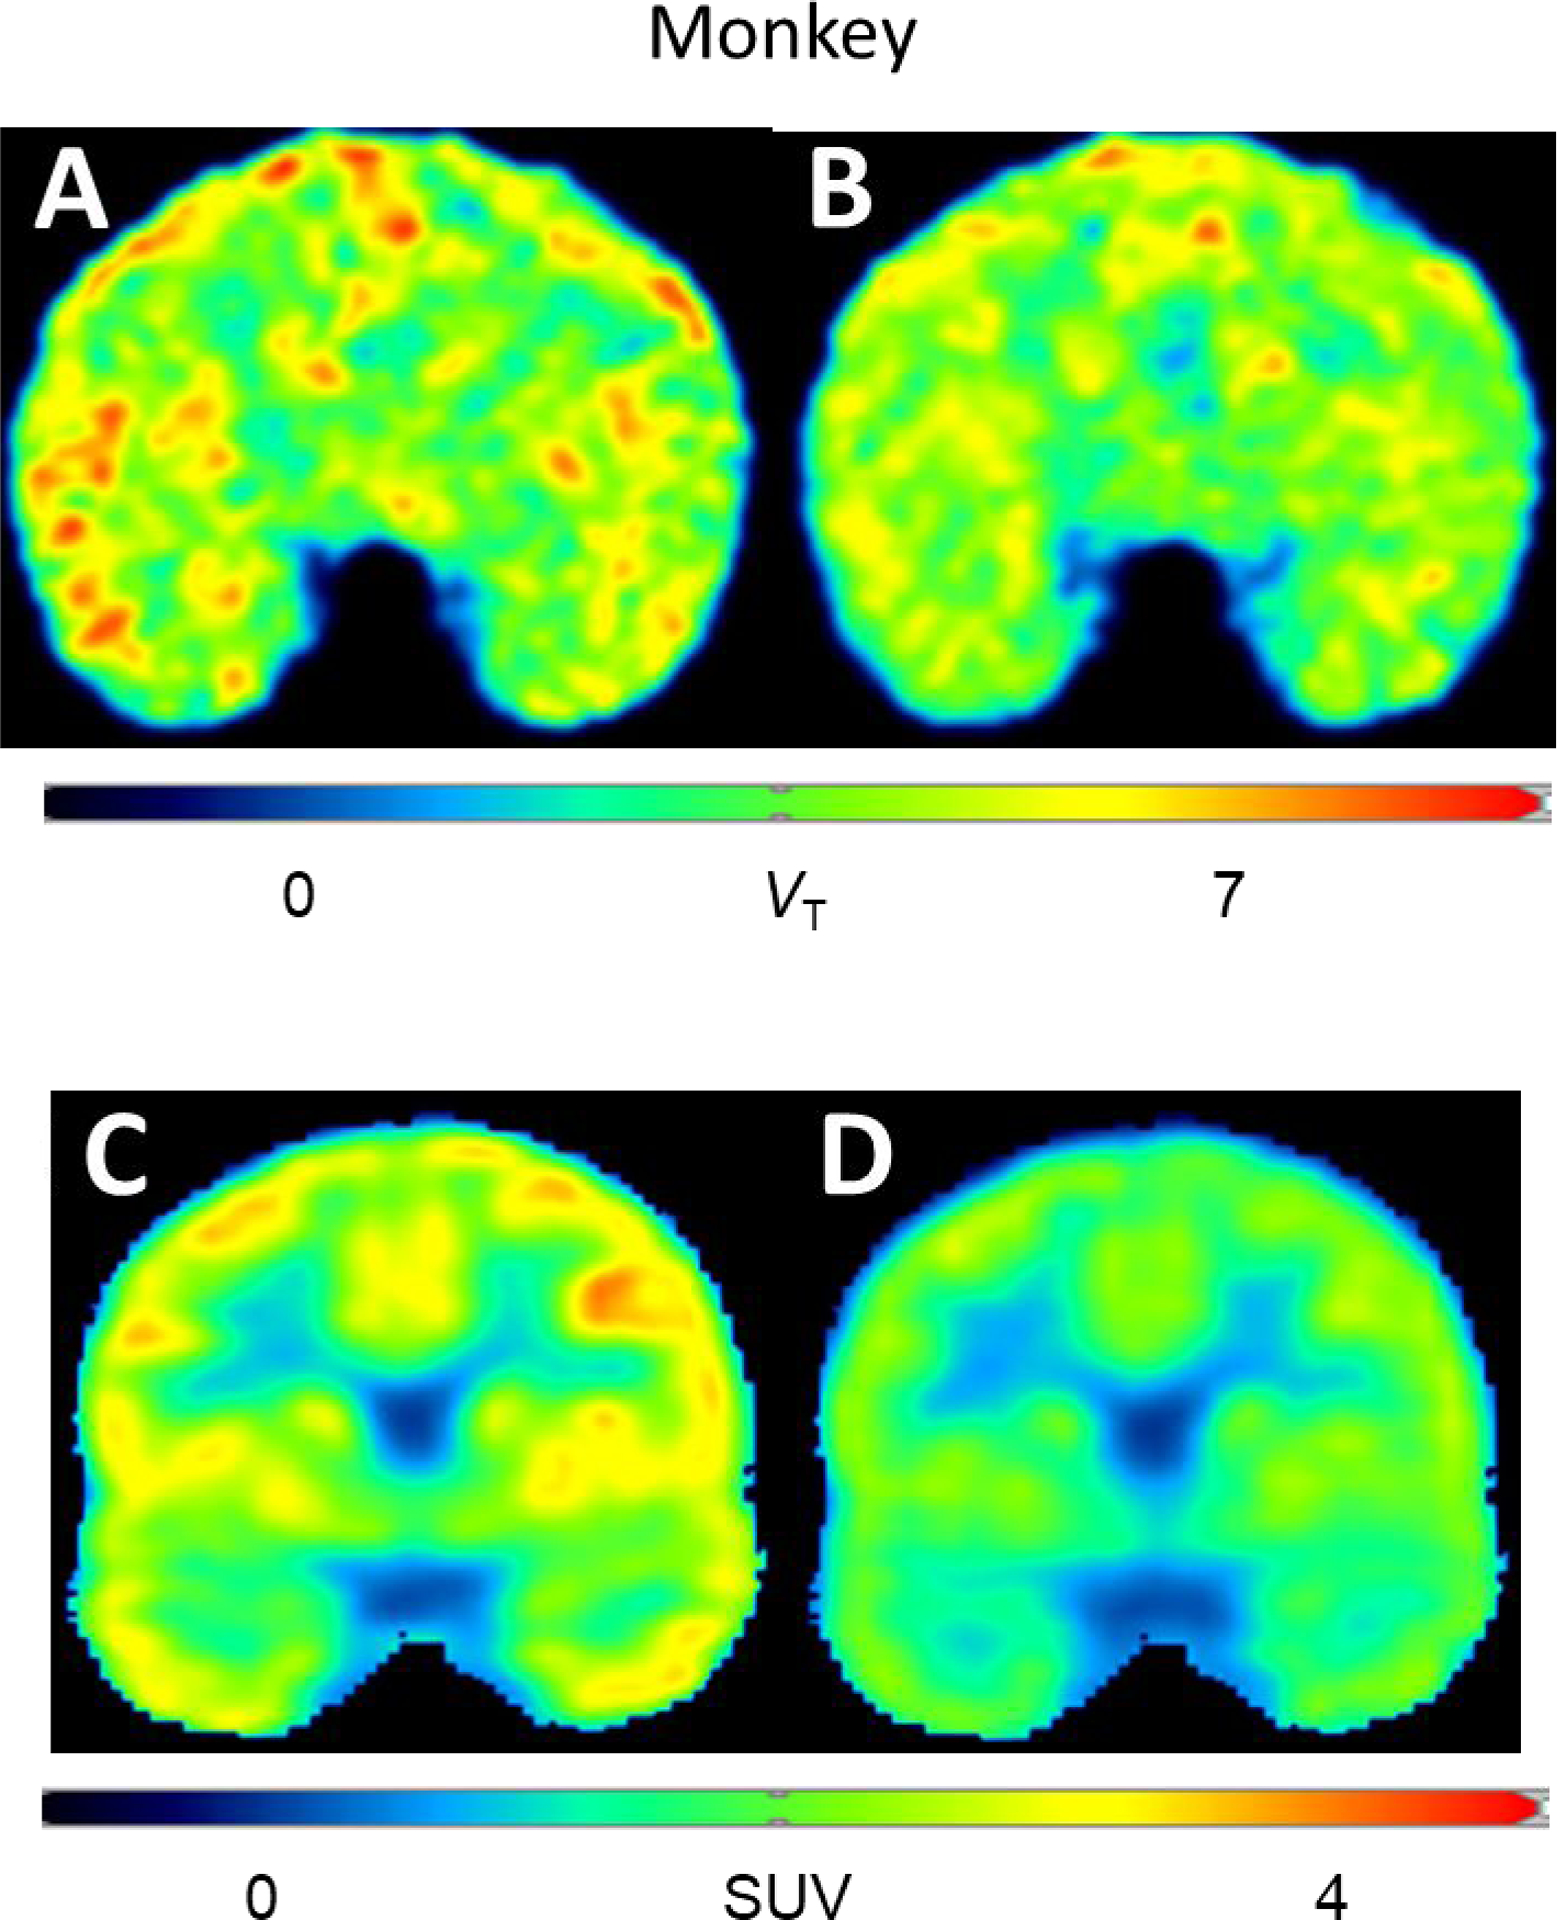
Coronal brain parametric PET images obtained with [11C]T1650. VT in monkey baseline scan (A) and in scan obtained at two hours after intravenous administration of BPN14770 (3 mg/kg,i.v.) (B). SUV in human brain at baseline (C), and at two hours after BPN14770 (single 50 mg oral dose) (D). BPN14770 showed a blocking effect in both monkey and human.
PDE4D target occupancies by rolipram and BPN14770 in monkey brain were assessed with [11C]T1650 using Lassen plots (Figure 2). Preblocking with 1.0 mg/ kg (i.v.) gave 93% occupancy, which decreased to 63% when using a blocking dose of 0.2 mg/kg (i.v.) (Figure 2B). Use of BPN14770 at dose of 3 mg/kg (i.v.) resulted in 63% occupancy (Figure 2C). Notably, non-displaceable binding (BPND) estimates from these Lassen plots were very similar, irrespective of blocking agent or dose, in accord with selective binding of the radioligand to PDE4D only.
Overall, [11C]T1660 and [11C]T1650 showed quite comparable PDE4D PET imaging performance in monkey. Plasma free fractions (fP) were similar and readily measurable with precision. Each radioligand showed high and comparable brain entry from plasma. The two radioligands also showed similar specific-to-nondisplaceable ratios (BPND) based on both VT and VT/fP. Despite many favorable features, both radioligands were limited in showing non-asymptotically increasing VT with increasing duration of PET data, a severe impediment to robust quantification of PDE4D. Nonetheless, these studies, for the first time, showed that the distribution of PDE4D in primate brain could be imaged with PET and that PDE4D is enriched in brain regions important for cognition, such as prefrontal cortex, temporal cortex, and hippocampus.
PET Imaging in Human.
Our PET studies in monkeys suggested that one of two radioligands, either [11C]T1650 or [11C]T1660, warranted investigation in human subjects in the hope that apparent VT would be more stable in humans than in monkeys and would permit robust quantification. We could not readily distinguish the performances of [11C]T1650 and [11C]T1660 in monkeys and we somewhat arbitrarily chose [11C]T1650 for study in human, expecting its results would be similar to those of [11C]T1660.
Time Course of Radioactivity in Human Brain and Radioligand in Human Plasma.
After intravenous injection of [11C]T1650, radioactivity readily entered brain, peaked high (4.39 SUV) after about four minutes, slowly declined, and then changed little from about 2 SUV from 30 to 120 minutes (Figure 3D). To determine whether the peak solely reflected uptake of radioactivity in brain, vascular subtraction of the brain time-activity curve was performed, on the assumption that blood comprises 5% of total brain volume31. The early peak was minimally affected by subtracting radioactivity from whole blood, showing that the measured radioactivity was primarily in brain and not blood.
Following an initial peak of 7.8 SUV at three minutes, the concentration of unchanged [11C]T1650 in plasma declined rapidly for several minutes, and then minimally declined from 10 to 120 minutes (Figure 3E). Several radiometabolites accumulated in plasma and were separated with HPLC (SI, Figure S11C). Both [11C]A”, which clearly consists of several unresolved radiometabolites, and [11C]B” were less lipophilic than [11C]T1650, whereas [11C]C” was more lipophilic. [11C]A” increased in concentration throughout the scan, surpassing 70% of the plasma concentration at 50 minutes after injection, whereas [11C]B” remained at about 5% (SI, Figure S12A). [11C]C” was only ever present in negligible amounts. Unchanged radioligand in plasma was only 30 ± 8% (n = 2 participants) of all radioactivity at 30 minutes after injection and about 5% at 120 minutes (SI, Figure S12A).
The radioactivity in brain washed out much more slowly than the parent radioligand cleared from plasma. Thus, from 60 to 120 minutes, radioactivity in brain declined by only 7%, whereas the concentration of [11C]T1650 in plasma declined by 71% (Figure 3F). These data suggest that radioactive species other than the parent radioligand were likely responsible for the higher radioactivity in brain.
Pharmacokinetic Modeling of VT in Human Brain.
We used a two-tissue compartment model which provided fitting close to the actual time-activity curve for [11C]T1650 (Figure 4C). However, this model overestimated the actual uptake of radioactivity from 30 to 60 minutes and underestimated the radioactivity thereafter. The underestimation of the model at later intervals may have reflected the accumulation of radiometabolites in the brain. Taking the limitations of the modeling into account, VT values for both participants were highest in temporal cortex (9.63 ± 1.53), occipital cortex (9.52 ± 1.10), and frontal cortex (9.38 ± 0.76) and lowest in cerebellum.
To determine whether the parent radioligand reached equilibrium with binding in the brain, VT was calculated for increasingly truncated portions of the scan, from 0–20 to 0–120 minutes. The apparent value of VT increased linearly from 20 to 120 minutes, with a 30% increase over the last 50 minutes (Figure 4D). The radioligand therefore performed much worse in humans than in monkeys with regards to quantification of PDE4D.
Although unstable VT values can have many causes, the two most common are exceptionally high affinity of the radioligand causing slow equilibration, and accumulation of radiometabolites in the brain.32 T1650 is a potent PDE4D inhibitor, which presumably reflects a nanomolar binding affinity. Such high affinity is common for neuroreceptor radioligands33 and does not usually cause slow equilibration. The slow washout of radioactivity from human brain, the inadequacy of standard two-tissue compartment modeling for estimating time-activity curves, and the time instability of VT were all consistent with the accumulation of radiometabolites in the brain.34
In Vitro and Ex Vivo Formation of Radiometabolites.
For many PET radioligands, labeling at an O-methyl group, as in [11C]T1650, is unproblematic because demethylation ultimately leads to [11C]carbon dioxide which does not cross into brain.35 Nonetheless, if demethylation is slow relative to other metabolic processes, this can become problematic as brain-penetrant radiometabolites may form.36
To evaluate the possibility of radiometabolites of [11C]T1650 accumulating in brain, the stability of [11C]T1650 was first examined in blood and plasma from both rats and humans in vitro. After 30 minutes of incubation at room temperature, [11C]T1650 was found to be stable in vitro in human whole blood (94.6 ± 0.5%, n = 3 participants), human plasma (96.0 ± 0.4%, n = 3 participants), rat whole blood (97.4%, n = 1 rat), and rat plasma (97.2%, n = 1 rat). In PET experiments, the analytical radiochromatographic profile for sampled rat plasma (SI, Figure S11A) and monkey plasma (SI, Figure S11B) resembled that for plasma sampled from human (SI, Figure S11C), in terms of radioactive components but not their proportions. Thus, human and rat possibly have a similar metabolic pathway for [11C]T1650. However, it should be cautioned that similar retention times on chromatograms obtained under the same conditions do not necessarily assure chemical identity. For ex vivo investigation, three rats were injected with [11C]T1650 and sacrificed after 30 minutes. Radioactivity extracted from rat brain showed a group of unresolved radiometabolites (SI, Figure S11D; peaks [11C]A and [11C]B) that were less lipophilic than the parent radioligand, and a low proportion of a radiometabolite that was more lipophilic (SI, Figure S11C; peak [11C]C). Brain radioactivity consisted of 63.3% ± 3.0% (n = 3) parent radioligand at 30 minutes after intravenous injection. To determine whether any of these radiometabolites were generated within the brain, the radioligand was incubated with rat brain homogenates. The radiometabolite group [11C]A, but not radiometabolite [11C]B, was generated in the brain (SI, Figure S11E). The presence of radiometabolites in the ex vivo rat brain seems due not only to the biotransformation of [11C]T1650 inside the brain itself to [11C]A, but also due to radiometabolites ([11C]B) entering brain from periphery. Therefore, the accumulation of radiometabolites in human brain is a highly plausible explanation for VT instability.
Human Enzyme Occupancy by BPN14770.
To determine the specificity of [11C]T1650 binding in the human brain, the blocking effect of the PDE4D-selective therapeutic candidate BPN14770 was measured. BPN14770 had a clear blocking effect, whether measured by concentration of radioactivity in brain or by VT; SUV60–120 decreased by 30% and VT decreased by 33% (SI, Figure S13). BPN14770 had virtually no effect on the time-course of the emergence of radiometabolites in plasma (SI, compare Figures S12A and 12B). The decrease of SUV60–120 and VT varied among brain regions, with the greatest decrease observed in the hippocampus and amygdala and with a minimal decrease observed in the basal ganglia, thalamus, and cerebellum.
Because quantification in the brain was not robust, possibly due to the accumulation of radiometabolites, [11C]T1650 could not reliably measure differences in PDE4D density between participants. We are uncertain how to correct values such as VT that measure enzyme density in a single participant for metabolism and cannot easily determine whether this metabolism differs between participants or disease states. It is hypothetically possible that [11C]T1650 could be used for repeat studies in a single individual - for example, to measure enzyme occupancy by a therapeutic candidate. A single 50 mg oral dose of BPN14770 clearly decreased radioactivity in the brain (measured as SUV60–120). This result is consistent with selective binding of the radioligand to PDE4D, because BPN14770 is highly selective for the D subtype of PDE4.38 However, based on our blocking experiments with BPN14770, we conclude that [11C]T1650 is unsuitable for measuring enzyme occupancy due to the difficulty of obtaining reliable quantification. We do not plan to test [11C]T1660 in humans because similar performances in monkey plus close structural similarities suggest that both radioligands would very likely have similar problems in human.
CONCLUSIONS
PET imaging with [11C]T1660 and [11C]1650 selectively revealed the distribution of PDE4D in monkey brain. This distribution displayed high specific binding in regions associated with cognition and a relatively low uptake in cerebellum.
Quantitation of PDE4D in human brain using [11C]T1650 was significantly flawed. Brain uptake could not be explained using only the parent radioligand in plasma as input for biomathematical modeling. In retrospect, we now recognize that this problem was foreshadowed by the time-instability of VT in monkey, which became even worse in humans. Radiometabolite(s) were likely the cause of this time instability. The suspected accumulation of radiometabolites in human brain was supported by the finding of [11C]T1650 radiometabolites in rat brain ex vivo. Nevertheless, a considerable but indeterminate portion of [11C]T1650 uptake in human brain was specifically bound to PDE4D because it was blocked by the PDE4D-selective agent BPN14770. Taking the limitations of estimating VT for this radioligand into account, a single 50 mg oral dose of the PDE4D-selective compound BPN14770 occupied about 40% of the target enzyme.
Improved quantitation of PDE4D may well be achieved with an analog of [11C]T1650 that does not generate radiometabolites that accumulate in brain. Overall, this study reveals that brain PDE4D is a viable target for PET imaging in monkey and human brain but requires an improved radioligand.
METHODS
General.
In this article, PDE4D residue numbering is based on the reference PDE4D7 isoform, GenBank accession No. NP_001159371.1.
MPO scores were derived according to Zhang et al.23
cLogD and clogP values were computed with Pallas for Windows software version 3.8 in default option (CompuDrug International; Bal Harbor, FL).
All radioactivity measurements were corrected for the physical decay of carbon-11 (t1/2 = 20.4 min).
Results of all statistical analyses are presented as mean ± SDs, unless otherwise stated as SE (standard error).
Chemistry.
Unless otherwise noted, all purchased reagents were used as received. 1H NMR spectra were recorded on a Bruker Avance III 400 MHz and obtained in CDCl3 at room temperature unless otherwise noted. Chemical shifts were reported in parts per million (ppm) downfield from the internal standard of residual tetramethylsilane (0 ppm). Mass spectra were obtained on a Micromass LCT. Compound HPLC retention times were obtained using the following methods: Method A: Agilent 1100 series, Kinetex® EVO C18 column (2.6 μm, 100 Å, 50 × 4.6 mm; Phenomenex), 5–100% ACN/water (0.07% H3PO4) (3.5 min), 100% ACN (0.07% H3PO4) (0.25 min), 100%–0% ACN/water (0.07% H3PO4) (0.01 min), 0–5% ACN/water (0.07% H3PO4) (0.29 min), and 5% ACN/water (0.07% H3PO4); flow rate: 1.0 mL/min. Method B: Agilent 1100 series, XBridge® BEH C18 column (3.5 μm, 130 Å, 50 mm × 4.6 mm), 1%–95% ACN/water (0.1% formic acid) (2.0 min), 95% ACN/water (0.1% formic acid) (2.0 min), 95%–1% ACN/water (1% formic acid) (0.1 min), 1% ACN/water (1% formic acid) (3.4 min); flow rate: 1.0 mL/min. Unless otherwise stated, compounds were ≥ 95% pure by HPLC.
Preparation of 2-(3-chlorophenyl)-3-methoxy-6-[(pyridin-4-yl)methyl]pyridine (3; T1953).
In a 1 dram vial, 6-(bromomethyl)-2-(3-chlorophenyl)-3-methoxypyridine (11; 34 mg, 0.11 mmol) was dissolved in 1,4-dioxane:water (2:1, 1 mL) and then treated with pyridine-4-boronic acid (30 mg, 0.24 mmol), K3PO4 (50 mg, 0.23 mmol), and Pd(dppf)Cl2 (10 mg, 0.014 mmol). Argon was bubbled through the solution for 5 min, then the flask was sealed under argon and heated to 90 °C for 2 h. The reaction mixture was concentrated under reduced pressure and the residue partitioned between ethyl acetate and water. The layers were separated, and the organic phase dried with Na2SO4 and concentrated. The crude product was purified by silica gel chromatography using 40% ethyl acetate/hexanes to give 3 as a white solid: 6 mg (0.020 mmol, 18%); 1H NMR (DMSO-d6, 400 MHz) δ 8.83 (d, J = 6.6 Hz, 2H), 8.00 (d, J = 6.6 Hz, 2H), 7.87 (s, 1H), 7.84 (m, 1H), 7.64 (d, J = 8.6 Hz, 2H), 7.48 (m, 3H), 4.45 (s, 2H), 3.88 (s, 3H); TOF MS ES+ m/z 311.0 [M+H]+; HRMS Calc’d for C18H15ClN2O [M+1]+ 311.0951, Found 311.0954; HPLC Method A, tR = 2.57 min.
Preparation of 2-(3-chlorophenyl)-3-(difluoromethoxy)-6-[(1-methyl-1H-pyrazol-4-yl)methyl]pyridine (4; T2525).
2-Bromo-3-(difluoromethoxy)-6-methyl pyridine.
In a 50-mL round bottom flask, 2-bromo-3-hydroxy-6-methyl pyridine (13; 4.00 g, 21.3 mmol) was dissolved in DMF (15 mL). To the solution was added sodium chlorodifluoroacetate (5.2 g, 34 mmol) and Cs2CO3 (14 g, 43 mmol) and the mixture was stirred at 65 °C for 48 h. The reaction mixture was diluted with water and extracted twice with ethyl acetate. The combined organic layers were washed twice with brine, dried with Na2SO4 and concentrated to yield the product: 3.2 g.
2-(3-Chlorophenyl)-3-(difluoromethoxy)-6-methyl pyridine (14).
In a 100-mL round bottom flask, crude 2-bromo-3-(difluoromethoxy)-6-methyl pyridine (3.00 g, 12.6 mmol) was dissolved in 1,4-dioxane (40 mL) and then treated with (3-chlorophenyl)boronic acid (2.36 g, 15.1 mmol), K3PO4 (5.40 g, 25.2 mmol), and SiliaCat® DPP-Pd (0.30 mmol/g, 2.0 g, 0.6 mmol, Silicycle ® P/N R390–100). The reaction vessel was purged with argon for 5 min, then sealed and heated to 85 C° for 4.5 h. The reaction mixture was cooled to RT, diluted with ethyl acetate, filtered through Celite®, and concentrated. The residue was purified by silica gel chromatography (3% EtOAc/hexane) to yield 14: 3.47 g (12.7 mmol, 63% over 2 steps).
2-(3-Chlorophenyl)-3-(difluoromethoxy)-6-methyl pyridine-N-oxide:
Compound 14 (3.47 g, 12.7 mmol) was dissolved in DCM (40 mL) and treated with mCPBA (3.18 g, 14.2 mmol) and stirred at RT for 18 h. Saturated Na2SO3 (2 mL) was added and the reaction mixture stirred for 30 min. The phases were separated, and the organic phase washed with twice with satd. NaHCO3, then dried with Na2SO4, and concentrated. The unpurified product was used directly in the next step.
[6-(3-Chlorophenyl)-5-difluoromethoxy-2-pyridyl]methanol:
The crude 2-(3-chlorophenyl)-3-(difluoromethoxy)-6-methyl pyridine-N-oxide was dissolved in DCM (30 mL), treated with TFA (5.6 mL) and stirred at reflux for 2 h. The mixture was then concentrated to dryness. The residue was taken up in MeOH (25 mL), treated with water (1 mL) and LiOH·H2O (600 mg, 14.2 mmol), and then stirred at RT for 3 h. The volatiles were removed. The residue was diluted with water and extracted twice with ethyl acetate. The combined organic layers were dried with Na2SO4 and concentrated to provide an oil that was used in next step.
6-(Bromomethyl)-2-(3-chlorophenyl)-3-difluoromethoxypyridine (15):
The crude [6-(3-chlorophenyl)-5-difluoromethoxy-2-pyridyl]methanol was dissolved in DCM (20 mL) and cooled to 0 °C. PBr3 (2 mL, 221 mmol) was slowly added and the reaction mixture was allowed to warm to RT overnight. The reaction mixture was then cooled to 0 °C and treated with saturated NaHCO3 (200 mL). The mixture was extracted 3 times with ethyl acetate, dried with Na2SO4, and concentrated to give 15: 2.8 g (8.0 mmol, 63% over 4 steps).
2-(3-Chlorophenyl)-3-(difluoromethoxy)-6-[(1-methyl-1H-pyrazol-4-yl)methyl]pyridine (4; T-2525):
In a 25 mL round bottom flask, compound 15 (870 mg, 2.5 mmol) was dissolved in 1,4-dioxane:water (4:1, 7.5 mL) and then treated with (1-methyl-1H-pyrazol-4-yl)boronic acid (630 mg, 5.0 mmol), K3PO4 (1.06 g, 5.0 mmol), and Pd(dppf)Cl2 (630 mg, 0.86 mmol). Argon was bubbled through the solution for 5 min then flask was sealed under argon and heated to 90 °C for 12 h. The reaction mixture was concentrated under reduced pressure and the residue partitioned between ethyl acetate and water. The layers were separated, and the organic phase was dried with Na2SO4 and concentrated. The crude product was purified by silica gel chromatography (100% DCM) to give 4 as an oil: 180 mg (0.51 mmol, 21%); 1H NMR (CDCl3, 400 MHz) δ 7.89 (m, 1H), 7.78 (m, 1H), 7.52 (d, J = 8.4 Hz, 1H), 7.42 (m, 3H), 7.29 (m, 2H), 6.21 (t, J = 73.2 Hz, 1H), 4.01 (s, 2H), 3.90 (s, 3H); TOF MS ES+ m/z 350.2 [M+H]+; HRMS (ES+): Calc’d for C17H14ClF2N3O [M+1]+ 350.0872, Found 350.0873; HPLC Method A, tR = 3.63 min.
Preparation of 3-methoxy-2-(3-nitrophenyl)-6-[(pyridin-4-yl)methyl]pyridine (5; T1660).
In a 25-mL round bottom flask, 6-(bromomethyl)-2-(3-nitrophenyl)-3-methoxypyridine (12; 164 mg, 0.51 mmol) was dissolved in 1,4-dioxane-water (2.5:1, 7 mL) and then treated with pyridine-4-boronic acid (112 mg, 0.91 mmol), K3PO4 (220 mg, 1.04 mmol) and Pd(dppf)Cl2 (45 mg, 0.062 mmol). Argon was bubbled through the solution for 5 min then the flask was sealed under argon and heated to 90 °C for 5 h. The reaction mixture was concentrated under reduced pressure and the residue partitioned between ethyl acetate and water. The layers were separated, and the organic phase was dried with Na2SO4 and concentrated. The crude product was purified by silica gel chromatography using 6% ACN/DCM to give 5 as a white solid: 40 mg (0.13 mmol, 24%); m.pt., 108.8–109.7 °C; 1H NMR (CDCl3, 400 MHz) δ 8.92 (t, J = 2.0 Hz, 1H), 8.56 (m, 2H), 8.35 (dt, J = 7.8 Hz, 1.3 Hz, 1H), 8.25 (ddd, 8.2 Hz, 2.2 Hz, 1.0 Hz, 1 H), 7.62 (t, J = 8.0 Hz, 1H), 7.31 (d, J = 8.6 Hz, 2H), 7.25 (d, J = 6.0 Hz, 2H), 7.15 (d, J = 8.6 Hz, 1 H), 4.19 (s, 2H), 3.92 (s, 3H); TOF MS ES+ m/z 321.9 [M+H]+; HRMS (ES+): Calc’d for C18H15N3O3 [M+1]+ 322.1192, Found 322.1195; HPLC Method, tR = 2.47 min.
Preparation of 2-(3-nitrophenyl)-3-methoxy-6-[(1H-pyrazol-4-yl)methyl]pyridin-3-ol (6; T1650).
In a 50-mL round bottom flask, 6-(bromomethyl)-2-(3-nitrophenyl)-3-methoxypyridine (12; 520 mg, 1.66 mmol) was dissolved in 1,4-dioxane:water (4:1, 20 mL) and then treated with 1-Boc-4-(4,4,5,5-tetramethyl-1,3,2-dioxaborolan-2-yl)-1H-pyrazole (750 mg, 2.55 mmol), K3PO4 (680 mg, 3.2 mmol), and Pd(dppf)Cl2 (130 mg, 0.17 mmol). Argon was bubbled through the solution for 5 min and then the flask was sealed under argon and heated to 90 °C for 15 h. The reaction mixture was concentrated under reduced pressure and the residue partitioned between ethyl acetate and water. The layers were separated, and the organic phase was dried with Na2SO4 and concentrated. The crude product was purified by silica gel chromatography using 50% ethyl acetate/hexanes to give 6 as a white solid: 230 mg (0.74 mmol, 45%); m. pt., 115.7–117.5 °C; 1H NMR (DMSO-d6, 400 MHz) δ 8.77 (t, J = 1.9 Hz, 1H), 8.42 (d, J = 7.9, 1.3 Hz, 1H), 8.25 (m, 1 H), 7.76 (t, J = 8.0 Hz, 1H), 7.59 (d, J = 8.6 Hz, 2H), 7.41 (brd s, 1H), 7.29 (d, J = 8.6 Hz, 1H), 3.96 (s, 2H), 3.88 (s, 3H); TOF MS ES+ m/z 311.1 [M+H]+, 352.1 [M+ACN+H]+; HRMS (ES+): Calc’d for C16H15N4O3 [M+1]+ 311.1144, Found 322.1149; HPLC Method A, tR = 2.96 min.
PDE4 Enzyme Inhibition Assay.
Methods used to generate synthetic genes for human PDE4 subtypes were as described previously.23 Compounds were tested for PDE4D inhibition and counter-screened for selectivity against PDE4B, whose allosteric binding site is identical with those of PDE4A-C. Synthetic genes were engineered with carboxyl- or amino-terminal hexahistidine tags for Baculovirus-infected insect cell expression and purification. Human PDE4D7 contained a mutation of S129D to mimic activation by cAMP-dependent PKA, while PDE4B1 contained the mutation S133D.37 Both PDE4 proteins contained the mutations S579A and S581A to remove the potential for ERK-dependent phosphorylation.
Kinetic assay of cAMP hydrolysis by purified PDE4 was measured by coupling the formation of the PDE4 reaction product, 5′-adenosine monophosphate, to the oxidation of NADH by the use of three coupling enzymes (yeast myokinase, pyruvate kinase, and lactate dehydrogenase), which allowed fluorescent determination of reaction rates.23 Final concentrations of assay components were as follows: 50 mM Tris, pH 8; 10 mM MgCl2; 50 mM KCl; 2% DMSO; 5 mM tris(2-carboxyethyl)phosphine; 0.4 mM phosphenolpyruvate; 0.01 mM NADH; 0.04 mM ATP; 0.004 mM cAMP, 7.5 units myokinase from yeast; 1.6 units pyruvate kinase; 2 units lactate dehydrogenase; and ~ 0.5 nM PDE4D or PDE4B enzymes to yield an initial rate of about −0.7 RFU/s. All data were normalized relative to control wells lacking cAMP and are presented as percent inhibition. An inhibitory concentration 50% (IC50) value was calculated by fitting a sigmoidal dose response curve. Z′ quality factors were routinely > 0.6 for the assay.
Mouse Pharmacokinetic Protocol.
Mouse pharmacokinetic experiments were carried out by AmpliaPharmaTek, Montreal, Quebec, Canada. Adult male CD1 mice were dosed intravenously with the test compound dissolved in 5% DMSO, 5% Solutol, and 90% saline. Up to 3 compounds were dosed as a cassette at 0.1 mg/kg. Plasma and brain samples were collected (0.083, 0.25, 0.5, 1, 2, 4, 8, and 24 h) and analyzed by LC-MS/MS. Pharmacokinetic parameters were determined using WinNonlin. Use of animals was in accordance with the “NIH Guide for the Care and Use of Laboratory Animals” (revised 2011) and was approved by the Institutional Animal Care and Use Committee of the contracting research organization (AmpliaPharmaTek, Montreal, Quebec, Canada). The mouse brain SUV was calculated as ([brain Cmax (ng/mL)/dose (mg/kg)/1000]).
Radiochemistry.
Radiochemistry was performed in lead-shielded hot-cells with automated radiosynthesis apparatus for personnel protection from radiation. γ-Radioactivity from carbon-11 was measured with a calibrated dose calibrator (Atomlab 300, Biodex Medical Systems, Shirley, NY) or an automatic γ-counter (Wizard 3”, 1480 instrument; PerkinElmer; Waltham, MA).
Production of [11C]Carbon Dioxide.
[11C]Carbon dioxide (up to ~ 85 GBq) was produced with a PETtrace cyclotron (GE Medical Systems; Milwaukee, WI) according to the 14N(p,α)11C reaction by irradiation of nitrogen gas38 (initial pressure, 160 psi; volume, 75 mL) containing oxygen (1%) with a proton beam (16.5 MeV, 45 μA) for 20 or 40 minutes for radioligand production for monkey and human PET, respectively.
Production of [11C]Iodomethane.
[11C]Iodomethane was produced from [11C]carbon dioxide in a PETtrace MeI Process Module or a TracerLab FXC module (GE Medical Systems: Severna Park, MD) to produce radioligands for monkey and human PET, respectively. Thus, at the end of proton irradiation, [11C]carbon dioxide was delivered to the apparatus through stainless tubing (OD 1/8 in, ID 1/16 in) over 3 minutes, trapped on molecular sieves (13X), released for reduction to [11C]methane with hydrogen over nickel at 360 °C, and recirculated over iodine at 720 °C.39 The generated [11C]iodomethane was trapped on Porapak Q held in the recirculation path.
Syntheses of Radioligands.
Desmethyl-precursor (3 μmol) was dissolved in DMF (80 μL). Either tert-butylammonium hydroxide in MeOH (1 M; 3.15 μL; 1.05 μmol) or potassium tert-butoxide in THF (1 M; 3.15 μL; 1.05 μmol) was added to this solution and then injected into the loop of an AutoLoop apparatus (Bioscan; Washington, DC). [11C]Iodomethane was released into the loop of the apparatus, which was then kept at room temperature for 5 minutes. The radioligand was isolated with reversed phase HPLC (see SI Table S1 and Figures S2A–S6A for chromatographic conditions, retention times and radiochromatograms). After removal of mobile phase, the radioligand was formulated for intravenous injection in sterile ethanol-saline (1:10 v/v), and sterile-filtered (Millex-LG 0.22 μm, 25 mm; Merck Millipore; Burlington, MA). The identity and purity of each radioligand was confirmed with reversed phase HPLC analysis (SI, Table S2, Figures S2B–S6B) and by LC-MS (ESI) of associated carrier. Molar activity data are compiled in SI (Table S3).
Radioligand Lipophilicity (LogD) Determinations.
The logDs of radioligands were measured by partition between n-octanol and sodium phosphate buffer (pH 7.4), as described previously (SI, Table S4) The amounts of radioactivity in the n-octanol and buffer phases were determined with a γ-counter.
Stabilities of Radioligands in Monkey Whole Blood and Plasma in Vitro.
Samples of formulated [11C]3−[11C]6 (~ 370 kBq; 7 μL) were incubated with monkey whole blood and plasma (200 μL) in vitro at room temperature for at least 30 minutes. Radioactive whole blood samples were then mixed with distilled water (300 μL) for 30 s to lyse blood cells. Samples (450 μL) of the lysed cells and the incubated radioactive plasma samples were each added to ACN (720 μL) for deproteinization and then centrifuged (10,000 g). The resultant clear supernatant liquids were analyzed with reversed phase radio-HPLC on an X-Terra® C18 column (10 μm, 7.8 mm × 300 mm, Waters Corp., Milford, MA), eluted with methanol:water:Et3N (70:30:0.1; by volume) at of 4 mL/min). The precipitates were measured for radioactivity in a γ-counter to allow calculation of the extraction efficiency. The extraction efficiencies of all samples were 97 ± 3% (n = 65). The percentage of unchanged radioligand in the analyte, as determined by radio-HPLC, was divided by the radiochemical purity of the radioligand to give the stabilities of the radioligands in whole blood and plasma.
Plasma Free Fraction Determinations.
Plasma free fractions (fP) were determined for radioligands in monkey venous plasma and in pooled arterial human plasma using ultrafiltration through membrane filters (Centrifree; Millipore; Burlington, MA), as previously described.40
PET Experiments in Monkey.
PET Scanning.
PET experiments were performed in four rhesus monkeys (Macaca mulatta,7.3–14.4 kg) in accordance with the Guide for Care and Use of Laboratory Animals41 and were approved by the Animal Care and Use Committee of the National Institute of Mental Health. Typically, the monkey subject was anesthetized with ketamine (10 mg/kg, i.m.) and then maintained in anesthesia with 1.6% isoflurane and 98.4% O2. The position of the head was fixed using a stereotaxic frame. Electrocardiogram, body temperature, heart, and respiration rates were monitored throughout scanning sessions. A microPET Focus 220 scanner (Siemens Medical Solution; Knoxville, TN) was used to acquire PET images of the brain for up to 120 minutes after intravenous administration of radioligand (0.17–0.37 GBq) with molar activities in the range of 42–514 GBq/μmol at time of injection. Two PET scanning sessions were performed in the same monkey on the same day separated by at least 3 h, the first a baseline experiment using radioligand alone and then a second usually at 10 minutes following administration of a dose of PDE4D blocking agent, either (R,S)-rolipram (1.0, 0.2 or 0.1 mg/kg, i.v.) or BPN14770, a selective PDE4D inhibitor (3 mg/kg, i.v.). Although the different doses of blocking agents and their timings were expected to change relative target occupancy, we addressed this variance with Lassen plots to estimate target occupancy and non-displaceable binding (BPND). The doses of rolipram were decreased during the course of this study to minimize the side effect of emesis.
Monkey PET Image Analysis.
PET Images were reconstructed using Fourier rebinning plus two-dimensional filtered back-projection. Images were co-registered to a standardized monkey MRI template using SPM8 (The Wellcome Trust Centre for Neuroimaging, UCL, London, UK). For details on our use of this template see Shrestha et al.42 A set of 33 predefined brain regions of interest from the template were then applied to the co-registered PET image to obtain regional decay-corrected time-activity curves. Reported whole brain data are from gray matter. All PET images were corrected for attenuation and scatter. Radioactivity concentrations were expressed as SUV, which normalizes for weight and injected activity.
Analysis of Radiometabolites in Monkey Plasma.
To determine each radiometabolite-corrected arterial input function for brain PET scans, blood samples (0.5–1 mL each) were drawn from the femoral artery at 15-s intervals until 120 s, followed by 0.5- to 4-mL samples at 3, 5, 10, 30, 60, 90, and 120 min. The concentration of parent radioligand was measured with reversed phase HPLC on an X-Terra column (7.8 × 300 mm,10 μm; Waters Corp.) eluted at 5.0 mL/min with methanol-water-triethylamine (85:15:0.1, by vol.), after separating plasma from whole blood, as previously described.43
Monkey PET Data Analysis.
Total distribution volume (VT), a sum of a specific binding component known as the specific volume of distribution (VS) and a non-displaceable volume of distribution (VND), may serve as an index of enzyme density. VT equals the ratio at equilibrium of the concentration of radioligand in tissue to that in plasma.44 VT values, uncorrected for radioactivity in blood, were estimated for different brain regions with two-tissue compartmental modeling using the PET brain time-activity curves and the measured radiometabolite-corrected arterial input functions. The temporal stabilities of VT in whole brain in baseline experiments (n = 3) were assessed by estimating VT from progressively time-truncated data sets. Additionally, regional brain VT data were used to generate a Lassen plot30 to estimate PDE4D occupancy in the pre-dose condition and to estimate VND. The PET image analysis, including kinetic modeling, was performed with PMOD 3.704 (PMOD Technologies; Zurich, Switzerland). VT parametric images were created using a Logan plot.
Human PET Imaging.
Participants.
This study was approved by the Combined Neurosciences Institutional Review Board of the National Institute of Mental Health (Protocol 19-M-0064; NCT03861000) and the Radiation Safety Committee of the National Institutes of Health (authorization 2668), and all participants signed an informed consent form. The study was performed in compliance with the Health Insurance Portability and Accountability Act. Two male healthy volunteers (51 ± 3 years of age) participated in the brain PET scans. All participants were free of current medical or psychiatric illnesses as determined by medical history, physical examination, electrocardiogram, urinalysis, and laboratory blood tests (complete blood count, serum chemistries, and thyroid function test).
Human PET Study Design.
Two healthy participants had two PET scans each with [11C]T1650. Each subject had their two scans in the same day: a baseline scan in the morning at 10 a.m. and a blocking scan at 2 p.m. at two hours after BPN14770 administration (50 mg PO at 12 p.m).
PET Image Acquisition with [11C]T1650 and Administration of BPN14770.
All scans were performed on a Biograph mCT scanner (Siemens Healthineers; Erlangen, Germany) in three dimensions. CT scans for attenuation correction were acquired in two dimensions before radioligand injection. Following a one-minute intravenous bolus injection of [11C]T1650, brain dynamic emission scans were obtained for 120 minutes in 33 frames. PET images were reconstructed with order subset expectation maximization (OSEM). The activities of [11C]T1650 administered for the brain scans were 701 ± 90 MBq (range, 570–775 MBq; n = 4). The administered masses of T1650 were 59 ± 25 ng/kg (range, 36–92 ng/kg; n = 4). There were no adverse or clinically detectable pharmacologic effects in any of the two subjects. No significant changes in vital signs or the results of laboratory studies or electrocardiograms were observed.
Measurement of Unchanged [11C]T1650 in Human Plasma.
To determine arterial input function for the two brain PET scans, blood samples were drawn continuously from the radial artery for the first five minutes of the scan using an automatic blood sampling system (PBS-101, COMECER, Joure, Netherlands) followed by discrete samples drawn manually for the rest of the scan. The concentration of parent radioligand was measured with radio-HPLC, as previously described.43 During each participant’s brain scans, 3-mL arterial blood samples were drawn at 3, 5, 10, 15, 30, and 45 minutes, 6-mL arterial samples were drawn at 60 and 75 minutes, and 9-mL samples were drawn at 95 and 120 minutes.
Human PET Image Processing.
Three-dimensional T1-weighted magnetic resonance images (MRIs) were obtained from both brain scan participants. For region-of-interest (ROI)-based analysis, PET images were co-registered to the MRIs. A set of 83 predefined regions from the Hammers N30R83 Maximum Probability Atlas45 derived from the individual’s MRI scan was applied to the dynamic PET images to obtain regional time-activity curves. For better representation and noise reduction, the 83 ROIs were subsequently combined into nine regions via weighted averaging.
Measurement of Radioactivity Uptake in Human Brain.
SUV and area under the curve (AUC) were calculated between 60 and 120 minutes (SUV60–120). Total distribution volume (VT) for each region was calculated using two-tissue compartment modeling. The relative performance of kinetic models was assessed based on the Akaike Information Criterion (AIC) and/or F-test.46 The stability of VT values over time was evaluated by incrementally decreasing the period of brain data from 120 to 20 minutes and calculating the relative VT of the truncated scan to VT of the full scan.
In Vitro and Ex Vivo Stability of [11C]T1650 in Rat.
For in vitro studies, rat brain was harvested, immediately homogenized, and diluted two-fold in saline. Brain homogenates were incubated with [11C]T1650 (32 nM) for 120 minutes at 37 °C to simulate imaging conditions. For ex vivo studies, rats were injected intravenously with [11C]T1650 in 10% ethanol with respect to 0.9% NaCl solution and sacrificed via thoracotomy 30 minutes after injection. Anticoagulated blood was drawn from the myocardium followed by decapitation and harvesting of the brain. Brain tissues were then homogenized in acetonitrile (1.0 mL) and then in water (1 mL). Radio-HPLC was performed for both studies on an X-terra® C18 (10 μm, 7.8 mm × 300 mm, Waters Corp.) with a mobile phase of methanol:water:Et3N (70:30:0.1; by vol.) and a flow rate of 3.75 mL/min.
Supplementary Material
ACKNOWLEDGEMENTS
We thank the NIH Clinical PET Center (Director: Dr. Peter Herscovitch) for radioisotope production, NIDDK for HRMS measurements (Dr. John Lloyd) and the NIMH Psychoactive Drug Screening Program (Director: Professor Bryan L. Roth) for in vitro ligand screening.
Funding
This work was supported by a research grant from the National Institutes of Mental Health (grant numbers: MH107077) to M.E.G. and independently by Tetra Discovery Partners, Inc., and by the Intramural Research Program of NIH (NIMH project numbers ZIAMH002852 and ZIAMH002793).
ABBREVIATIONS
- ACN
acetonitrile
- ACRDYS2
acrodysostosis type2
- AIBN
azobisisobutyronitrile
- BBB
blood brain barrier
- BDNF
brain-derived neurotrophic factor
- CREB
cAMP response element binding protein
- DCM
dichloromethane
- cLogD
calculated log to base 10 of the distribution coefficient of a compound between 1-octanol and phosphate buffer at pH 7.4.
- cLogP
calculated log to base 10 of the partition coefficient of a compound between 1-octanol and water
- GPCR
G-protein-coupled receptors
- mCPBA
meta-chloroperoxybenzoic acid
- MPO
multi-parameter optimization
- PDE4
phosphodiesterase-4
- Pd(dppf)Cl2
[1,1’-Bis(diphenylphosphino)ferrocene]dichloropalladium (II)
- PKA
protein kinase A
- SUV
standardized uptake value
- TFA
trifluoroacetic acid
Footnotes
Publisher's Disclaimer: This document is confidential and is proprietary to the American Chemical Society and its authors. Do not copy or disclose without written permission. If you have received this item in error, notify the sender and delete all copies.
Supporting Information
The Supporting Information is available free of charge on the ACS publication website at: Chemical syntheses; PET imaging data, HPLC separation and analytical methods; radiochromatograms, NMR data.
Competing Interest Statement
B.E.M., E.D’A., J.A.S., M.E.G, R.A.N., and X.M. are employees of Tetra Discovery Partners, Inc.
The authors have no conflict of interest to disclose, financial or otherwise.
REFERENCES
- 1.Blackman BE; Horner K; Heidmann J; Wang D; Richter W; Rich TC; Conti M, PDE4D and PDE4B function in distinct subcellular compartments in mouse embryonic fibroblasts. J Biol Chem 2011, 286 (14), 12590–601. [DOI] [PMC free article] [PubMed] [Google Scholar]
- 2.Castro LR; Gervasi N; Guiot E; Cavellini L; Nikolaev VO; Paupardin-Tritsch D; Vincent P, Type 4 phosphodiesterase plays different integrating roles in different cellular domains in pyramidal cortical neurons. J Neurosci 2010, 30 (17), 6143–51. [DOI] [PMC free article] [PubMed] [Google Scholar]
- 3.Gervasi N; Tchenio P; Preat T, PKA dynamics in a Drosophila learning center: coincidence detection by rutabaga adenylyl cyclase and spatial regulation by dunce phosphodiesterase. Neuron 2010, 65 (4), 516–29. [DOI] [PubMed] [Google Scholar]
- 4.Matthiesen K; Nielsen J, Cyclic AMP control measured in two compartments in HEK293 cells: phosphodiesterase K(M) is more important than phosphodiesterase localization. PLoS One 2011, 6 (9), e24392. [DOI] [PMC free article] [PubMed] [Google Scholar]
- 5.Menniti FS; Faraci WS; Schmidt CJ Phosphodiesterase in the CNS: targets for drug development. Nat Rev Drug Discov 2006, 5, 660–670. [DOI] [PubMed] [Google Scholar]
- 6.Tully T; Bourtchouladze R; Scott R; Tallman J, Targeting the CREB pathway for memory enhancers. Nat Rev Drug Discov 2003, 2 (4), 267–77. [DOI] [PubMed] [Google Scholar]
- 7.Bailey CH; Bartsch D; Kandel ER, Toward a molecular definition of long-term memory storage. Proc Natl Acad Sci U S A 1996, 93 (24), 13445–13452. [DOI] [PMC free article] [PubMed] [Google Scholar]
- 8.Fujimaki K; Morinobu S; Duman RS, Administration of a cAMP phosphodiesterase 4 inhibitor enhances antidepressant-induction of BDNF mRNA in rat hippocampus. Neuropsychopharmacology 2000, 22 (1), 42–51. [DOI] [PubMed] [Google Scholar]
- 9.Bender AT; Beavo JA, Cyclic nucleotide phosphodiesterases: molecular regulation to clinical use. Pharmacol Rev 2006, 58 (3), 488–520. [DOI] [PubMed] [Google Scholar]
- 10.Houslay MD; Schafer P; Zhang KY, Keynote review: phosphodiesterase-4 as a therapeutic target. Drug Discov Today 2005, 10 (22), 1503–19. [DOI] [PubMed] [Google Scholar]
- 11.Francis SH; Blount MA; Corbin JD, Mammalian cyclic nucleotide phosphodiesterases: molecular mechanisms and physiological functions. Physiol Rev 2011, 91 (2), 651–90. [DOI] [PubMed] [Google Scholar]
- 12.Bjorkholm C; Monteggia LM, BDNF - a key transducer of antidepressant effects. Neuropharmacology 2016, 102, 72–9. [DOI] [PMC free article] [PubMed] [Google Scholar]
- 13.Castren E; Rantamaki T, Role of brain-derived neurotrophic factor in the aetiology of depression: implications for pharmacological treatment. CNS Drugs 2010, 24 (1), 1–7. [DOI] [PubMed] [Google Scholar]
- 14.Fujita M; Hines CS; Zoghbi SS; Mallinger AG; Dickstein LP; Liow JS; Zhang Y; Pike VW; Drevets WC; Innis RB; Zarate CA Jr., Downregulation of Brain Phosphodiesterase Type IV Measured with 11C-(R)-Rolipram Positron Emission Tomography in Major Depressive Disorder. Biological Psychiatry 2012, 72(7), 546–554. [DOI] [PMC free article] [PubMed] [Google Scholar]
- 15.Fujita M; Richards EM; Niciu MJ; Ionescu DF; Zoghbi SS; Hong J; Telu S; Hines CS; Pike VW; Zarate CA; Innis RB, cAMP signaling in brain is decreased in unmedicated depressed patients and increased by treatment with a selective serotonin reuptake inhibitor. Mol Psychiatry 2017, 22(15), 754–759. [DOI] [PMC free article] [PubMed] [Google Scholar]
- 16.Norman TR; Judd FK; Burrows GD, New pharmacological approaches to the management of depression: from theory to clinical practice. Aust N Z J Psychiatry 1992, 26 (1), 73–81. [DOI] [PubMed] [Google Scholar]
- 17.O’Donnell JM; Zhang HT Antidepressant effects of inhibitors of cAMP phosphodiesterase (PDE4) Trends Pharmacol. Sci. 2004, 25, 158–163. [DOI] [PubMed] [Google Scholar]
- 18.Gurney ME, Genetic Association of Phosphodiesterases With Human Cognitive Performance. Front Mol Neurosci 2019, 12, 22. [DOI] [PMC free article] [PubMed] [Google Scholar]
- 19.Lam M; Trampush JW; Yu J; Knowles E; Davies G; Liewald DC; Starr JM; Djurovic S; Melle I; Sundet K; Christoforou A; Reinvang I; DeRosse P; Lundervold AJ; Steen VM; Espeseth T; Raikkonen K; Widen E; Palotie A; Eriksson JG; Giegling I; Konte B; Roussos P; Giakoumaki S; Burdick KE; Payton A; Ollier W; Chiba-Falek O; Attix DK; Need AC; Cirulli ET; Voineskos AN; Stefanis NC; Avramopoulos D; Hatzimanolis A; Arking DE; Smyrnis N; Bilder RM; Freimer NA; Cannon TD; London E; Poldrack RA; Sabb FW; Congdon E; Conley ED; Scult MA; Dickinson D; Straub RE; Donohoe G; Morris D; Corvin A; Gill M; Hariri AR; Weinberger DR; Pendleton N; Bitsios P; Rujescu D; Lahti J; Le Hellard S; Keller MC; Andreassen OA; Deary IJ; Glahn DC; Malhotra AK; Lencz T, Large-Scale Cognitive GWAS Meta-Analysis Reveals Tissue-Specific Neural Expression and Potential Nootropic Drug Targets. Cell Rep 2017, 21 (9), 2597–2613. [DOI] [PMC free article] [PubMed] [Google Scholar]
- 20.Savage JE; Jansen PR; Stringer S; Watanabe K; Bryois J; de Leeuw CA; Nagel M; Awasthi S; Barr PB; Coleman JRI; Grasby KL; Hammerschlag AR; Kaminski JA; Karlsson R; Krapohl E; Lam M; Nygaard M; Reynolds CA; Trampush JW; Young H; Zabaneh D; Hagg S; Hansell NK; Karlsson IK; Linnarsson S; Montgomery GW; Munoz-Manchado AB; Quinlan EB; Schumann G; Skene NG; Webb BT; White T; Arking DE; Avramopoulos D; Bilder RM; Bitsios P; Burdick KE; Cannon TD; Chiba-Falek O; Christoforou A; Cirulli ET; Congdon E; Corvin A; Davies G; Deary IJ; DeRosse P; Dickinson D; Djurovic S; Donohoe G; Conley ED; Eriksson JG; Espeseth T; Freimer NA; Giakoumaki S; Giegling I; Gill M; Glahn DC; Hariri AR; Hatzimanolis A; Keller MC; Knowles E; Koltai D; Konte B; Lahti J; Le Hellard S; Lencz T; Liewald DC; London E; Lundervold AJ; Malhotra AK; Melle I; Morris D; Need AC; Ollier W; Palotie A; Payton A; Pendleton N; Poldrack RA; Raikkonen K; Reinvang I; Roussos P; Rujescu D; Sabb FW; Scult MA; Smeland OB; Smyrnis N; Starr JM; Steen VM; Stefanis NC; Straub RE; Sundet K; Tiemeier H; Voineskos AN; Weinberger DR; Widen E; Yu J; Abecasis G; Andreassen OA; Breen G; Christiansen L; Debrabant B; Dick DM; Heinz A; Hjerling-Leffler J; Ikram MA; Kendler KS; Martin NG; Medland SE; Pedersen NL; Plomin R; Polderman TJC; Ripke S; van der Sluis S; Sullivan PF; Vrieze SI; Wright MJ; Posthuma D, Genome-wide association meta-analysis in 269,867 individuals identifies new genetic and functional links to intelligence. Nat Genet 2018, 50 (7), 912–919. [DOI] [PMC free article] [PubMed] [Google Scholar]
- 21.Fatemi SH; King DP; Reutiman TJ; Folsom TD; Laurence JA; Lee S; Fan YT; Paciga SA; Conti M; Menniti FS, PDE4B polymorphisms and decreased PDE4B expression are associated with schizophrenia. Schizophr Res 2008, 101 (1–3), 36–49. [DOI] [PubMed] [Google Scholar]
- 22.Guan F; Zhang C; Wei S; Zhang H; Gong X; Feng J; Gao C; Su R; Yang H; Li S, Association of PDE4B polymorphisms and schizophrenia in Northwestern Han Chinese. Hum Genet 2012, 131 (7), 1047–56. [DOI] [PubMed] [Google Scholar]
- 23.Burgin AB; Magnusson OT; Singh J; Bjornsson JM; Thorsteinsdottir M; Hrafnsdottir S; Hagen T; Witte P; Staker BL; Kiselyov AS; Stewart LJ; Gurney ME, Design of Phosphodiesterase Type 4D (PDE4D) Allosteric Modulators for Cognition with Improved Safety. Nature Biotechnology 2010, 28 (1), 63–70. [DOI] [PubMed] [Google Scholar]
- 24.Zhang L; Villalobos A; Beck EM; Bocan T; Chappie TA; Chen L; Grimwood S; Heck SD; Helal CJ; Hou X; Humphrey JM; Lu J; Skaddan MB; McCarthy TJ; Verhoest PR; Wager TT; Zasadny K, Design and selection parameters to accelerate the discovery of novel central nervous system positron emission tomography (PET) ligands and their application in the development of a novel phosphodiesterase 2A PET ligand. J Med Chem 2013, 56 (11), 4568–79. [DOI] [PubMed] [Google Scholar]
- 25.Naganuma K,; Omura A; Maekawara N; Saitoh M; Ohkawa N; Kubota T; Nagumo H; Kodama T; Takemura M; Ohtsuka Y; Nakamura J; Tsujita R; Kawasaki K; Yokoi H; Kawanishi M Discovery of selective PDE4B inhibitors. Bioorg Med Chem Lett 2009, 19, 3174–3176. [DOI] [PubMed] [Google Scholar]
- 26.DaSilva JN; Lourenco CM; Meyer JH; Hussey D; Potter WZ; Houle S, Imaging cAMP-specific phosphodiesterase-4 in human brain with R-[11C]rolipram and positron emission tomography. Eur J Nucl Med Mol Imaging 2002, 29 (12), 1680–3. [DOI] [PubMed] [Google Scholar]
- 27.Niccolini F; Wilson H; Pagano G; Coello C; Mehta MA; Searle GE; Gunn RN; Rabiner EA; Foltynie T; Politis M, Loss of phosphodiesterase 4 in Parkinson disease: Relevance to cognitive deficits. Neurology 2017, 89 (6), 586–593. [DOI] [PubMed] [Google Scholar]
- 28.Pike VW, Considerations in the Development of Reversibly Binding PET Radioligands for Brain Imaging. Curr Med Chem 2016, 23 (18), 1818–69. [DOI] [PMC free article] [PubMed] [Google Scholar]
- 29.Singh J; Gurney ME; Burgin AB; Sandanayaka V; Kiselyov A; Motta A; Schiltz G; Hategan G; Hagen T, Biaryl PDE4 Inhibitors For Treating Inflammatory, Cardiovascular, and CNS Disorders. USPTO 2009, US2009324569. [Google Scholar]
- 30.Lassen NA; Bartenstein PA; Lammertsma AA; Prevett MC; Turton DR; Luthra SK; Osman S; Bloomfield PM; Jones T; Patsalos PN; O’Connell MT; Duncan JS; Vanggaard Andersen J , Benzodiazepine receptor quantification in vivo in humans using [11C]flumazenil and PET: application of the steady-state principle. J Cereb Blood Flow Metab 1995, 15 (1), 152–65. [DOI] [PubMed] [Google Scholar]
- 31.Sakai F; Nakazawa K; Tazaki Y;, Ishii, K., Hino, H.; Igarashi. H.; Kanda, T. Regional cerebral blood volume and hematocrit measured in normal human volunteers by single-photon emission computed tomography. J Cereb Blood Flow Metab 1985, 5 (2), 207–213 [DOI] [PubMed] [Google Scholar]
- 32.Terry G; Liow JS; Chernet E; Zoghbi SS; Phebus L; Felder CC; Tauscher J; Schaus JM; Pike VW; Halldin C; Innis RB, Positron emission tomography imaging using an inverse agonist radioligand to assess cannabinoid CB1 receptors in rodents. NeuroImage 2008, 41 (3), 690–8. [DOI] [PMC free article] [PubMed] [Google Scholar]
- 33.Wong DF; Gjedde A; Wagner HN Jr.; Dannals RF; Douglass KH; Links JM; Kuhar MJ, Quantification of neuroreceptors in the living human brain. II. Inhibition studies of receptor density and affinity. J Cereb Blood Flow Metab 1986, 6 (2), 147–53. [DOI] [PubMed] [Google Scholar]
- 34.Zhang XY; Yasuno F; Zoghbi SS; Liow JS; Hong J; McCarron JA; Pike VW; Innis RB, Quantification of serotonin 5-HT1A receptors in humans with [11C](R)-(−)-RWAY: radiometabolite(s) likely confound brain measurements. Synapse 2007, 61 (7), 469–77. [DOI] [PubMed] [Google Scholar]
- 35.Pike VW, PET radiotracers: crossing the blood-brain barrier and surviving metabolism. Trends Pharmacol Sci 2009, 30 (8), 431–40. [DOI] [PMC free article] [PubMed] [Google Scholar]
- 36.Garcia G; Abet V; Alajarin R; Alvarez-Builla J; Delgado M; Garcia-Garcia L; Bascunana-Almarcha P; Pena-Salcedo C; Kelly J; Pozo MA, N-(4-18F]-fluoropyridin-2-yl)-N-{2-[4-(2-methoxyphenyl)piperazin-1-yl]ethyl}ca rboxamides as analogs of WAY100635. New PET tracers of serotonin 5-HT1A receptors. Eur J Med Chem 2014, 85, 795–806. [DOI] [PubMed] [Google Scholar]
- 37.Gurney ME; Nugent RA; Mo X; Sindac JA; Hagen TJ; Fox D 3rd; O’Donnell JM; Zhang C; Xu Y; Zhang HT; Groppi VE; Bailie M; White RE; Romero DL; Vellekoop AS; Walker JR; Surman MD; Zhu L; Campbell RF, Design and Synthesis of Selective Phosphodiesterase 4D (PDE4D) Allosteric Inhibitors for the Treatment of Fragile X Syndrome and Other Brain Disorders. J Med Chem 2019, 62(10), 4884–4901. [DOI] [PMC free article] [PubMed] [Google Scholar]
- 38.Christman DR; Finn RD; Karlstrom KI; Wolf AP, The production of ultra high activity 11C-labeled hydrogen cyanide, carbon dioxide, carbon monoxide and methane via the 14N(p,α)11C reaction (XV). Int J Appl Radiat Isotopes 1975. 26, 435–442. [Google Scholar]
- 39.Larsen P; Ulin J; Dahlstrøm K; Jensen M, Synthesis of [11C]iodomethane by iodination of [11C]methane. Appl Radiat Isotopes 1997, 48, 153–157. [Google Scholar]
- 40.Gandelman MS; Baldwin RM; Zoghbi SS; Zea-Ponce Y; Innis RB, Evaluation of ultrafiltration for the free-fraction determination of single photon emission computed tomography (SPECT) radiotracers: beta-CIT, IBF, and iomazenil. J Pharm Sci 1994, 83 (7), 1014–9. [DOI] [PubMed] [Google Scholar]
- 41.National Research Council, Guide for the Care and Use of Laboratory Animals, Eighth Edition Washington, DC: The National Academies Press; 2011, 10.17226/5140. [DOI] [Google Scholar]
- 42.Shrestha SS; Nelson EE; Liow JS; Gladding R; Lyoo CH; Noble PL; Morse C; Henter ID; Kruger J; Zhang B; Suomi SJ; Svenningsson P; Pike VW; Winslow JT; Leibenluft E; Pine DS; Innis RB, Fluoxetine administered to juvenile monkeys: effects on the serotonin transporter and behavior. Am J Psychiatry 2014, 171 (3), 323–31. [DOI] [PMC free article] [PubMed] [Google Scholar]
- 43.Zoghbi SS; Shetty HU; Ichise M; Fujita M; Imaizumi M; Liow JS; Shah J; Musachio JL; Pike VW; Innis RB, PET imaging of the dopamine transporter with 18F-FECNT: a polar radiometabolite confounds brain radioligand measurements. J Nucl Med 2006, 47 (3), 520–7. [PubMed] [Google Scholar]
- 44.Innis RB; Cunningham VJ; Delforge J; Fujita M; Gjedde A; Gunn RN; Holden J; Houle S; Huang SC; Ichise M; Iida H; Ito H; Kimura Y; Koeppe RA; Knudsen GM; Knuuti J; Lammertsma AA; Laruelle M; Logan J; Maguire RP; Mintun MA; Morris ED; Parsey R; Price JC; Slifstein M; Sossi V; Suhara T; Votaw JR; Wong DF; Carson RE, Consensus nomenclature for in vivo imaging of reversibly binding radioligands. J Cereb Blood Flow Metab 2007, 27 (9), 1533–9. [DOI] [PubMed] [Google Scholar]
- 45.Hammers A; Allom R; Koepp MJ; Free SL; Myers R; Lemieux L; Mitchell TN; Brooks DJ; Duncan JS, Three-dimensional maximum probability atlas of the human brain, with particular reference to the temporal lobe. Hum Brain Mapp 2003, 19 (4), 224–47. [DOI] [PMC free article] [PubMed] [Google Scholar]
- 46.Glatting G; Kletting P; Reske SN; Hohl K; Ring C, Choosing the optimal fit function: comparison of the Akaike information criterion and the F-test. Med Phys 2007, 34 (11), 4285–92. [DOI] [PubMed] [Google Scholar]
Associated Data
This section collects any data citations, data availability statements, or supplementary materials included in this article.


