Abstract
Objective
Leveraging large-scale genetic data, we aimed to identify shared pathogenic mechanisms and causal relationships between impaired kidney function and cerebrovascular disease phenotypes.
Methods
We used summary statistics from genome-wide association studies (GWAS) of kidney function traits (chronic kidney disease diagnosis, estimated glomerular filtration rate [eGFR], and urinary albumin-to-creatinine ratio [UACR]) and cerebrovascular disease phenotypes (ischemic stroke and its subtypes, intracerebral hemorrhage [ICH], and white matter hyperintensities [WMH] on brain MRI). We (1) tested the genetic overlap between them with polygenic risk scores (PRS), (2) searched for common pleiotropic loci with pairwise GWAS analyses, and (3) explored causal associations by employing 2-sample Mendelian randomization.
Results
A PRS for lower eGFR was associated with higher large artery stroke (LAS) risk (p = 1 × 10⁻⁴). Multiple pleiotropic loci were identified between kidney function traits and cerebrovascular disease phenotypes, with 12q24 associated with eGFR and both LAS and small vessel stroke (SVS), and 2q33 associated with UACR and both SVS and WMH. Mendelian randomization revealed associations of both lower eGFR (odds ratio [OR] per 1-log decrement, 2.10; 95% confidence interval [CI], 1.38–3.21) and higher UACR (OR per 1-log increment, 2.35; 95% CI, 1.12–4.94) with a higher risk of LAS, as well as between higher UACR and higher risk of ICH.
Conclusions
Impaired kidney function, as assessed by decreased eGFR and increased UACR, may be causally involved in the pathogenesis of LAS. Increased UACR, previously proposed as a marker of systemic small vessel disease, is involved in ICH risk and shares a genetic risk factor at 2q33 with manifestations of cerebral small vessel disease.
Stroke represents the second leading cause of death worldwide.1 It is classified into intracerebral hemorrhage (ICH) and ischemic stroke (IS), the latter being further subclassified into large artery atherosclerotic stroke (LAS), cardioembolic stroke (CES), and stroke caused by small vessel disease (small vessel stroke [SVS]).2
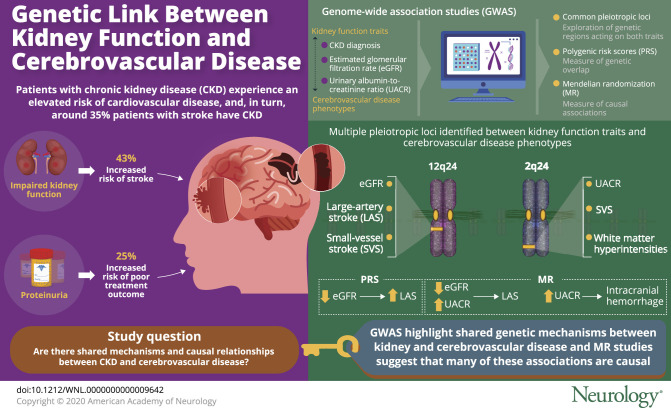
Patients with impaired kidney function experience a well-established elevated risk of cardiovascular disease.3 Uncertainty remains regarding the link and potential directionality of the relationship between impaired kidney function and stroke. Studies have shown prevalence of chronic kidney disease (CKD) as high as 35% among stroke patients,4 with 43% increased risk for incident stroke in patients with severely impaired kidney function,5 and 25% greater risk of poor outcome at discharge among patients with stroke with proteinuria.6 These observational studies do not inform on shared pathogenesis or causal relationships between the 2 traits. Moreover, the etiologic subtypes of stroke have not been considered in prior studies, making assessments of shared pathogenic pathways more challenging.
Genetics has proven useful in clarifying whether associations of co-occurring traits reflect a causal relationship or simple correlation. Using Mendelian randomization (MR), a genetic test of instrumental association, studies distinguished plasma lipid levels causally related to coronary artery disease from others simply covarying with them.7 Prior reports have suggested a genetic overlap between kidney function and risk of IS,8 although none of the polygenic associations passed study-wide significance thresholds. We hypothesized that new better-powered genome-wide association studies (GWAS) of kidney- and stroke-related phenotypes would allow us to demonstrate shared and potentially causal genetic mechanisms between CKD and cerebrovascular disease.
Methods
Leveraging data from international consortia,9–11 we aimed to (1) explore the polygenic overlap between kidney disease and cerebrovascular disease, including IS, LAS, CES, SVS, white matter hyperintensities (WMHs), and ICH; (2) identify loci that pleiotropically affect both the risk of kidney disease and cerebrovascular disease phenotypes; and (3) use MR to examine directionality of possible causal effects of kidney disease on cerebrovascular disease phenotypes. Finally, as a secondary analysis, we explored whether genetic risk factors shared between kidney and cerebrovascular disease were also pleiotropic for higher blood pressure.
Traits and GWAS
To explore kidney function and impairment, we used CKD diagnosis as well as both estimated glomerular filtration rate (eGFR) and urinary albumin-to-creatinine ratio (UACR), since they reflect different aspects of kidney pathophysiology.12 eGFR is considered a measure of the renal clearance function and can be impaired by different insults in different areas of the nephron, while UACR is a subclinical marker of pathologic damage that specifically affects glomeruli. The NICE recommendations (National Institute for Health and Care Excellence) suggest measuring both for a proper kidney function evaluation.13 The cystatin C–based method for calculating eGFR was selected over the creatinine-based method given the higher accuracy and the improved prognostic utility in determining risks of death and end-stage renal disease of the former.14–16
CKD diagnosis and eGFR GWAS summary meta-analysis statistics were obtained from the latest 1000 Genomes–based CKDGen consortium effort (ckdgen.imbi.uni-freiburg.de/). The CKDGen consortium, with the correspondent genotypic and phenotypic assessment procedures that led to the GWAS results, are described elsewhere.17,18 Briefly, the study includes meta-analysis results from 33 individual studies of European ancestry (n = 110,527). eGFR was estimated from serum cystatin C levels using the established equation15 (n = 24,063). GWAS results for the UACR trait were derived from the latest study that leveraged the UK Biobank data11 (publicly available from the Broad Cardiovascular Disease Knowledge Portal: broadcvdi.org/informational/data). Compared to the data from the CKDGen consortium, the study based on UK Biobank made use of a larger sample size (n = 382,500 vs 111,666 individuals of the CKDGen consortium) and reported 32 novel genome-wide significant loci for the trait, in addition to the single one previously detected by the CKDGen analysis.19
Genetic data for stroke phenotypes were derived from the MEGASTROKE consortium9 and the International Stroke Genetic Consortium (ISGC) GWAS for ICH.20 Detailed descriptions of study populations and stroke subtyping ascertainment are available (cerebrovascularportal.org/). Briefly, we utilized the GWAS summary statistics of the European ancestry analysis of the study (40,585 cases; 406,111 controls). The phenotypes used were (1) IS regardless of subtype; the 3 available etiologic ischemic subtypes (2) LAS, (3) SVS, and (4) CES; and (5) ICH. Definitions of IS and ICH were based on clinical and imaging criteria, whereas IS subtypes were based on the Trial of Org 10172 in Acute Stroke Treatment (TOAST) classification system.2
We also analyzed WMH volume, a known MRI biomarker of cerebral small vessel disease,21 using summary statistics of GWAS analysis for total volume of WMH derived by the UK Biobank study, as described previously22 (see e-Methods; doi.org/10.5061/dryad.kd51c5b2b). Essentially, we used volumetric measurements based on T1 and T2 fluid-attenuated inversion recovery of 10,597 participants of European ancestry. The linear regression model of the GWAS was adjusted for age, sex, and principal components.
Systolic blood pressure (SBP) summary meta-analysis statistics were obtained from the latest publicly available GWAS, which combines data from UK Biobank and the International Consortium of Blood Pressure (grasp.nhlbi.nih.gov/FullResults.aspx). The study analyzed 757,601 individuals of European descent.23 Briefly, SBP values were the average of 2 values and adjusted for pressure-lowering medication.
Genotyping and bioinformatic genetic analysis of each of the GWAS cited followed standardized procedures that are harmonized and comparable across the studies. Details are available in the studies referred.9,11,17,18,20 In brief, all the results are obtained from inverse-variance meta-analysis restricted to participants of European ancestry after adjusting for age, sex, and principal components reflecting ancestry. eGFR, UACR, and WMH volume were log-transformed.
Genetic analyses
Linkage disequilibrium (LD) score regression
To estimate the genetic correlation between kidney traits and cerebrovascular phenotypes, we used the LD score regression method.24 This method involves regressing summary results statistics from variants across the genome on a measure of each variant's ability to tag other variants locally. As such, LD score infers the posterior mean effect size of each marker by conditioning on a genetic architecture prior and LD information of European ancestry from the 1000 Genomes Project.25 We used the GWAS summary-level results data described above to estimate genetic correlations among pairs of kidney traits and cerebrovascular disease phenotypes.
Polygenic risk scoring (PRS)
For each of the kidney traits, we used 3 sets of pruned (r2 < 0.1 based on the European 1000 Genomes v3 panel) single nucleotide polymorphisms (SNPs) passing 3 p value thresholds (p = 0.001, 0.05, and 0.5). The pruning retained the SNP with the lowest p value for each clump. Following established methodology,8 polygenic scores for cerebrovascular disease phenotypes were computed as the sum of reference alleles for each SNP weighted by the summary regression coefficient for the kidney trait. Polygenic scores were used for calculating the regression of the response variable onto the risk score.26 Given the 6 cerebrovascular disease phenotypes studied for each of the 3 kidney traits, the Bonferroni-adjusted significance threshold was set at 0.003.
Pairwise analysis of GWAS
To identify genetic variants that influence pairs of traits, we used gwas-pw.27 This method uses a Bayesian statistical model to estimate the probability that a given independent genomic region contains a genetic variant that influences both traits of interest (posterior probabilities of association [PPA]). The input to the model is the set of summary GWAS statistics for both of the 2 phenotypes under study aligned to the same effect allele. We applied the analysis to pairs of kidney traits and cerebrovascular disease phenotypes. In the sensitivity analysis, we studied SBP and kidney trait pairs. Genomic regions with PPA ≥0.95 were considered highly pleiotropic for the pair of traits tested, whereas regions with PPA ≥0.8 were considered to support pleiotropy between traits, in accordance with previous approaches.28,29
Mendelian randomization
For MR, we used as instruments genetic variants pruned at r2 < 0.1 based on the European 1000 Genomes panel that were associated with CKD, eGFR, or UACR at genome-wide significance level (p < 5 × 10⁻⁸). The instruments are presented in table e-1 (doi.org/10.5061/dryad.kd51c5b2b). The genetic association estimates between the instruments and the odds of the described outcomes were extracted from the MEGASTROKE and ISGC GWAS summary statistics. Following extraction of the association estimates and harmonization of the direction of the estimates across studies based on the effect allele, we calculated individual MR estimates for each instrument using the Wald estimator; standard errors were calculated using the delta method.30 We then pooled the individual MR estimates using fixed-effects inverse variance weighted (IVW) analyses.30 We assessed heterogeneity across estimates with the I2 and the Cochran Q test (I2 > 50% and p < 0.05 were considered statistically significant) as measures of pleiotropy in the fixed-effects IVW analysis.30 To control for potential directional pleiotropy, we used MR-PRESSO31 (and then repeated the fixed-effects IVW analysis after excluding the pleiotropic outlier instruments) and the MR-Egger regression.30 We further used the weighted median estimator, which allows the use of invalid instruments under the assumption that at least half of the instruments used in the MR analysis are valid.30 All MR analyses were performed in R (v3.5.0; The R Foundation for Statistical Computing) using the MendelianRandomization and MR-PRESSO packages (see e-Methods; doi.org/10.5061/dryad.kd51c5b2b). Finally, in cases of shared heritability between traits and significant MR results, we tested also for the inverse association using kidney traits as outcomes and cerebrovascular disease phenotypes as exposures (bidirectional MR).32 Given the 6 cerebrovascular disease phenotypes studied for each of the 3 kidney traits, we set the statistical significance threshold for our analyses at a Bonferroni-adjusted threshold at a p < 0.003. However, given the lack of power of the MR analyses, we also considered the associations reaching a p < 0.05 as of nominal significance.
Standard protocol approvals, registrations, and patient consents
This study used publicly available deidentified data from participating studies that had already received approval from an ethical standards committee on human experimentation.
Data availability
Genetic variants used are available in the supplemental information (doi.org/10.5061/dryad.kd51c5b2b) and the code used for all analyses is available on request.
Results
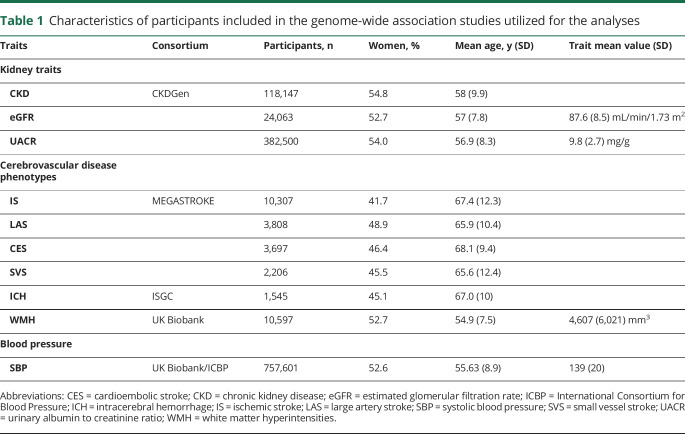
Descriptive characteristics of the participants included in the GWAS for each kidney trait and each cerebrovascular disease phenotype are summarized in table 1.
Table 1.
Characteristics of participants included in the genome-wide association studies utilized for the analyses
Heritability and genetic correlation
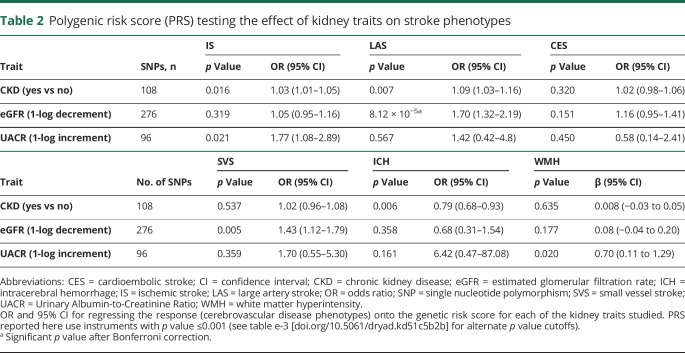
Whereas LD score regression analysis showed no statistically significant genetic correlations (table e-2, doi.org/10.5061/dryad.kd51c5b2b), PRS analysis showed an overall genetic overlap between the kidney traits and cerebrovascular disease phenotypes, with impairment in kidney function increasing risk of cerebrovascular events (table 2 and table e-3 [doi.org/10.5061/dryad.kd51c5b2b]). The correlation between lower eGFR and higher risk of LAS (odds ratio [OR] per 1-log eGFR increment, 0.59; 95% confidence interval [CI], 0.46–0.76 for SNPs associated with eGFR at p < 0.001) was the only one that exceeded the Bonferroni correction threshold. Overall the variance explained was low, as is commonly seen in complex traits (table e-3, doi.org/10.5061/dryad.kd51c5b2b). No UACR-based or CKD-based PRS showed significant associations with IS or IS subtypes.
Table 2.
Polygenic risk score (PRS) testing the effect of kidney traits on stroke phenotypes
Pairwise analysis of GWAS
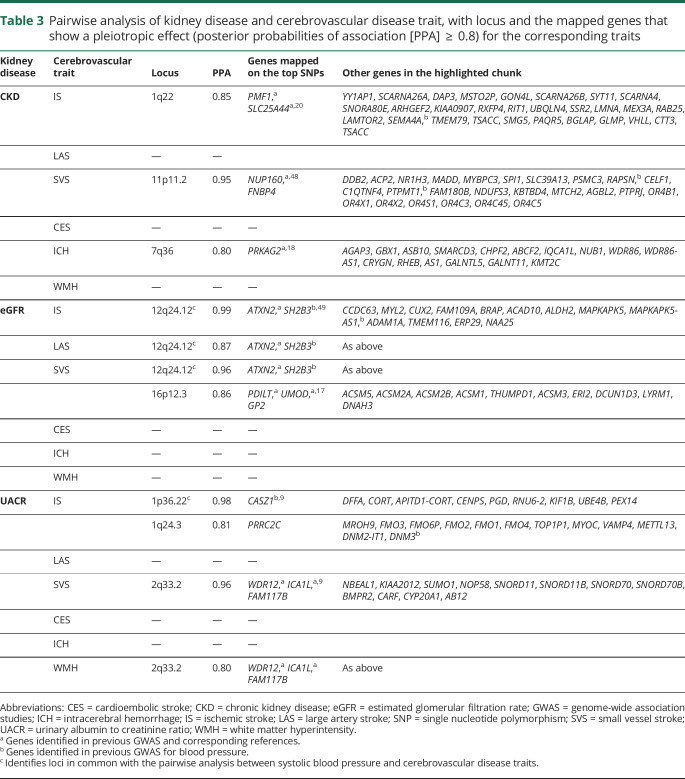
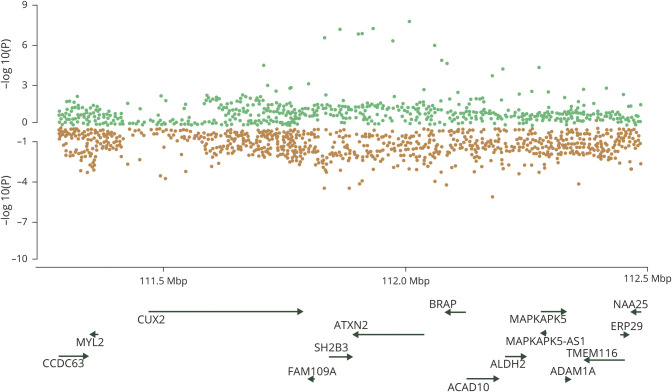
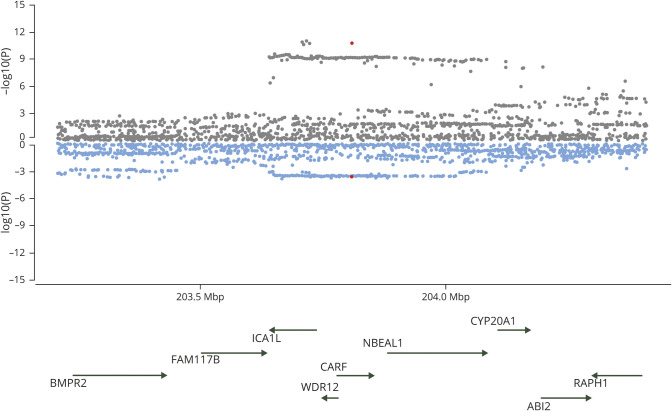
Pairwise testing of kidney disease and cerebrovascular disease phenotypes is summarized in table 3. A locus at 12q24 was found to be highly pleiotropic, driving associations between eGFR and IS, LAS (figure 1), and SVS. For SVS and eGFR, a second pleiotropic locus at 16p12 was identified.
Table 3.
Pairwise analysis of kidney disease and cerebrovascular disease trait, with locus and the mapped genes that show a pleiotropic effect (posterior probabilities of association [PPA]  0.8) for the corresponding traits
Figure 1. Miami plots of the 12q24.12 region highlighted by gwas-pw analysis.
Publicly available single nucleotide polymorphism association p values for each trait of the pair are plotted. Genes that mapped under the locus at 12q24.12 highlighted in the analysis between estimated glomerular filtration rate (green) and large artery stroke (orange).
A locus at 2q33 showed pairwise associations between UACR and both SVS (figure 2) and WMH. Testing UACR and IS revealed 2 loci: 1p36 and 1q24. No common pleiotropic loci were found between UACR and LAS.
Figure 2. Miami plots of the 2q33 region highlighted by gwas-pw analysis.
Publicly available single nucleotide polymorphism association p values for each trait of the pair are plotted. Genes that mapped under the locus at 2q33 highlighted in the analysis between urinary albumin to creatinine ratio (gray) and white matter hyperintensity (blue).
Finally, for CKD, 1q22 was identified as pleiotropic with IS and 11p11 with SVS.
Pairwise analyses of ICH and kidney disease phenotypes revealed pleiotropic associations with CKD at 7q36. No pleiotropic associations were identified between ICH and eGFR or UACR.
No pleiotropic loci were detected for CES. Figure e-1 summarizes all results of pairwise analyses (doi.org/10.5061/dryad.kd51c5b2b).
The sensitivity analysis focused on the cerebrovascular disease phenotypes that were found to share pleiotropic regions with kidney traits (IS, LAS, and SVS). gwas-pw analysis did not identify any locus with pleiotropic effects on SVS and SBP (figure e-2, doi.org/10.5061/dryad.kd51c5b2b) but highlighted 1 shared pleiotropic locus (7p21.1) between LAS and SBP (figure e-3, doi.org/10.5061/dryad.kd51c5b2b) and several pleiotropic loci for all-cause IS and SBP. Among these, only 2 (1p36.22 and 12q24.12) were shared with loci identified in our gwas-pw analysis of kidney and cerebrovascular disease phenotypes (figure e-4, doi.org/10.5061/dryad.kd51c5b2b and table 3).
Mendelian randomization
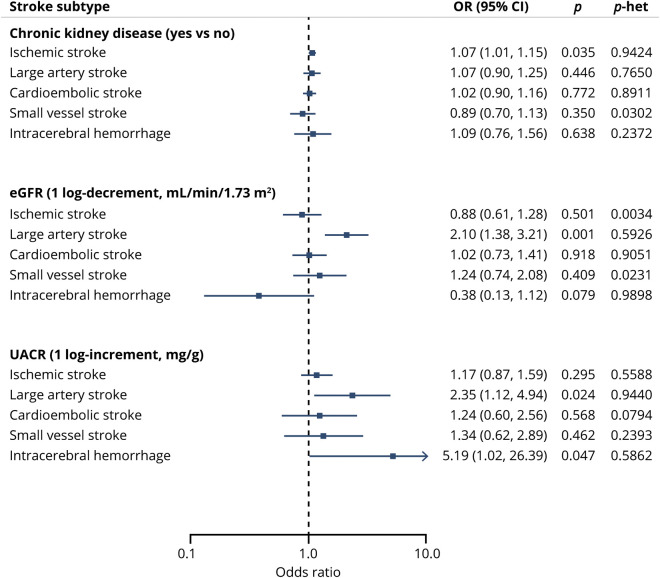
Using fixed-effects IVW MR analyses, we found genetically determined lower eGFR to be significantly associated with a higher risk for LAS (OR per 1-log decrement in eGFR, 2.10; 95% CI, 1.38–3.21; p = 0.001). Furthermore, we found an association of nominal significance between genetically elevated UACR and risk of LAS (OR per 1-log increment in UACR, 2.35; 95% CI, 1.12–4.94; p = 0.024). Genetically determined eGFR and UACR were not associated in MR analyses with the other IS subtypes or the overall IS phenotype (figure 3). There were further associations of nominal significance between genetic predisposition to CKD and IS risk (OR, 1.07; 95% CI, 1.01–1.15; p = 0.035), as well as between genetically elevated UACR and risk for ICH (OR, 5.09; 95% CI, 1.02–26.41; p = 0.047). MR analyses did not show any effects of genetically determined kidney traits on WMH volume (table e-5, doi.org/10.5061/dryad.kd51c5b2b). There was no significant heterogeneity as defined by the Cochran Q test (all p > 0.50), no outlier instruments were detected using MR-PRESSO, and the intercepts from the MR-Egger regression were not statistically significant (all p > 0.40) for each of these MR analyses, supporting a lack of significant pleiotropy in the analysis. Furthermore, the weighted median and the MR-Egger regression analyses provided association estimates that were directionally consistent and of similar magnitude as the ones derived from the IVW analyses, although with wider CIs, as expected given the lower statistical power of these approaches (table e-5, doi.org/10.5061/dryad.kd51c5b2b).
Figure 3. Mendelian randomization associations between genetically determined kidney disease traits and cerebrovascular disease phenotypes.
Shown are the results derived from fixed-effects inverse variance weighted Mendelian randomization analysis. CI = confidence interval; eGFR = estimated glomerular filtration rate; OR = odds ratio; UACR = urinary albumin-to-creatinine ratio.
Given the presence of shared genetic susceptibility between LAS and both eGFR and UACR, to exclude potential reverse associations, we performed MR exploring the effects of LAS on eGFR and LAS. We found no significant associations between LAS and eGFR (IVW β, 0.007; 95% CI, −0.008 to 0.022; p = 0.388) or UACR (IVW β, −0.007; 95% CI, −0.020 to 0.006; p = 0.262) (table e-6, doi.org/10.5061/dryad.kd51c5b2b).
Discussion
Our analyses demonstrate genetic associations between kidney and cerebrovascular disease both across the genome and at specific pleiotropic loci. Beyond confirming prior epidemiologic observations, these results advocate for a cerebrorenal paradigm and suggest that this relationship is driven by shared genetic factors and pathways. Taken together, our pairwise and MR analyses demonstrate that LAS and SVS are both influenced by disease mechanisms that simultaneously affect kidney function. Impairment in hemofiltration assessed by eGFR and glomerular function assessed by UACR appear to play a causal role in stroke related to atherosclerosis of large vessels. Furthermore, our results provide supportive evidence that 2q33 may play a role across small vessel pathologies in both the kidney and brain through microalbuminuria, SVS, and WMH. Finally, we have reidentified the 1q22 locus, previously detected through GWAS of ICH and all-cause IS,9,20 now found to demonstrate evidence of pleiotropy with CKD diagnosis.
Prior epidemiologic studies have shown associations between kidney disease and stroke,33,34 but such studies are inevitably limited by the presence of residual confounding variables and possible reverse causation, even after a thorough adjustment for traditional risk factors.5 This is a challenge particularly in stroke given the high levels of vascular comorbidity that patients with stroke often exhibit. While not without their own flaws and methodologic challenges, genetic approaches such as those employed in this study can help to limit confounding present in traditional observational studies. In fact, genetic variants, which are predisposed and randomly assigned at birth, are often less confounded indicators of particular traits compared to the correspondent conventionally measured exposures. In addition, the use of genetic variants as instrumental variables precludes reverse causation, in which the outcome affects the investigated risk factors, because genotypes confer phenotypes and not vice versa.35 As such, MR permits clarification of the direction of demonstrated associations.36
Our work extends previous findings that used PRS to associate kidney dysfunction and risk of IS through shared heritability.8 Deploying the most recent and far larger MEGASTROKE dataset, we have confirmed the suggested association between risk of LAS and impairment in eGFR first identified by Holliday et al.,8 this time applying both PRS and MR approaches. The primary mechanism that underlies both phenotypes would appear to be atherosclerosis. LAS results from atherosclerosis of large vessels, and prior studies have reported inverse associations between eGFR and carotid intima media thickness.37
The hypothesis of eGFR being implicated in LAS risk is further supported by our pleiotropy analysis, which found an association between the 2 traits through the 12q24.12 locus. Defining the key gene at this locus will require further work, but the top SNP lies within the ATXN2 gene, mutations within which have been demonstrated to cause cystic dilation of the renal tubules.38,39 The SH2B3 gene at the same locus was found to be associated with high blood pressure23 in previous GWAS. Therefore, high blood pressure, a well-established risk factor for both stroke and kidney disease, might explain part of the shared genetic predisposition between the 2 diseases. However, as the pairwise analyses for stroke and SBP did not identify any other pleiotropic signal common with the ones for kidney disease, our results suggest other pathways independent of blood pressure underlie this shared genetic predisposition.
Our MR analysis also showed an association of nominal significance between genetic predisposition to higher UACR and a higher LAS risk, while further excluding the possibility of reverse causation. The mechanistic basis for this observation is less clear, as UACR is considered a biomarker of endothelial dysfunction at the glomerular level. However, the finding is consistent with known epidemiologic associations between UACR and carotid intima media thickness.40 Furthermore, the prior PRS-based study by Holliday et al.8 also identified a link between LAS and UACR, although it should be noted that the dataset used to identify that association is also a component of MEGASTROKE.9 Finally, a recent separate MR analysis not only associated genetic predisposition to UACR with risk of cardiometabolic diseases such as coronary artery disease and stroke (the most common manifestations of atherosclerosis), but also demonstrated a bidirectional relationship between albuminuria and blood pressure.11 We can therefore hypothesize that increasing albuminuria could worsen hypertension and consequentially atherosclerosis, ultimately culminating in LAS.
Our results suggest pleiotropic genetic effects across small vessel disease phenotypes of WMH, SVS, and UACR, at 2q33. This locus encodes the ICA1L, WDR12, and NBEAL1 genes and is known to be pleiotropic in cerebrovascular disease, having been linked previously to both SVS risk and WMH burden.9,41 Our results extend these previous findings to include UACR, supporting the concept of a shared common pathway among cerebral and renal manifestations of small vessel disease. Although we could not establish pleiotropy for 2q33 in ICH, potentially due to statistical power in the smaller sample size of ICH, our MR analysis showed a possible causal association between UACR and ICH risk, suggesting that the overall genetic predisposition to endothelial disease of the kidney has an influence on ICH as well.
Our analysis of all-cause IS and CKD diagnosis reidentified the 1q22 locus, which was first discovered in association with ICH and more recently found to influence both IS risk as well as the burden of WMH in population cohorts.9,20,42 Whereas it is perhaps unsurprising that it appears again in this analysis, the fact that pleiotropy was identified only for CKD diagnosis and not eGFR or UACR warrants further investigation to determine whether a single mechanism or collection of mechanisms culminating in CKD is responsible for the observed association.
The only evidence we observed for genetic overlap between renal function and CES was when we used a PRS with more instruments. Prior epidemiologic studies have suggested associations between CKD and atrial fibrillation, the most important CES risk factor. We cannot rule out the possibility of a genetic association of low magnitude between kidney disease and CES below our statistical power threshold.
Our study has several limitations. Our initial LD score regression analysis did not achieve significant results, although the directions of effect of the genetic overlap between traits was congruous with our significant PRS analyses. Recent studies have shown that the genome-wide LD score regression approach has less power to detect heritability that is spread more evenly across the genome and is not concentrated in specific genomic regions.43,44 We cannot exclude the possibility of confounding by cryptic pleiotropy, which is an established limitation of MR analyses.45 However, our multimodal approach including methods for quantifying pleiotropy and multiple MR approaches with different modeling assumptions regarding the use of pleiotropic variants in the analyses provides some reassurance for the validity of our MR models. Although our MR analysis supports a causal relationship between kidney impairment and stroke risk, the results of our pleiotropy analysis do not fully obviate the possibility of a shared pathologic genetic pathway that predisposes to both.
Our analyses were restricted to individuals of European ancestry, which limits the generalizability of our results to other ancestral populations. This is particularly unfortunate given the known disparities in kidney disease and stroke risk and outcomes in traditionally underserved populations such as black and Hispanic populations.46,47 Future studies building on our approach in these and other populations are needed to replicate and extend our findings.
Despite these limitations, our study benefits from the use of the largest and newest GWAS datasets available, includes phenotypic characterization of stroke into its etiopathologic subtypes, and deploys multiple orthogonal methods to confirm and validate the findings. Altogether, these results highlight important genetic pleiotropy between kidney and cerebrovascular disease and suggest that at least some of these genetic liabilities are causal. Further exploration of shared disease mechanisms may highlight novel opportunities for treatment of these prevalent and debilitating conditions.
Glossary
- CES
cardioembolic stroke
- CI
confidence interval
- CKD
chronic kidney disease
- eGFR
estimated glomerular filtration rate
- GWAS
genome-wide association studies
- ICH
intracerebral hemorrhage
- IS
ischemic stroke
- ISGC
International Stroke Genetic Consortium
- IVW
inverse variance weighted
- LAS
large artery atherosclerotic stroke
- LD
linkage disequilibrium
- MR
Mendelian randomization
- OR
odds ratio
- PPA
posterior probabilities of association
- PRS
polygenic risk scoring
- SBP
systolic blood pressure
- SNP
single nucleotide polymorphism
- SVS
small vessel stroke
- UACR
urinary albumin-to-creatinine ratio
- WMH
white matter hyperintensity
Appendix. Authors

Footnotes
Editorial, page 1060
Study funding
This study was supported by the following awards from the NIH: K23NS086873, R01NS103924, and R01NS093870. S. Marini is supported by an American Heart Association/American Stroke Association fellowship (18POST34080063). M.K. Georgakis is supported by scholarships from the Onassis Foundation and the German Academic Exchange Service (DAAD).
Disclosure
S. Marini is supported by an American Heart Association/American Stroke Association fellowship (18POST34080063). M.K. Georgakis is supported by scholarships from the Onassis Foundation and the German Academic Exchange Service (DAAD). J. Chung, J.Q.A. Henry, and M. Dichgans report no relevant disclosures. J. Rosand is supported by grants from the NIH and has consulted for Boehringer Ingelheim, Pfizer, and New Beta Innovation. R. Malik reports no relevant disclosures. C.D. Anderson receives sponsored research support from the NIH, the American Heart Association, Massachusetts General Hospital, and Bayer AG, and has consulted for ApoPharma, Inc. Go to Neurology.org/N for full disclosures.
References
- 1.Feigin VL, Nguyen G, Cercy K, et al. Global, regional, and country-specific lifetime risk of stroke, 1990–2016. N Engl J Med 2018;379:2429–2437. [DOI] [PMC free article] [PubMed] [Google Scholar]
- 2.Adams HP, Bendixen BH, Kappelle LJ, et al. Classification of subtype of acute ischemic stroke: definitions for use in a multicenter clinical trial: TOAST: Trial of Org 10172 in Acute Stroke Treatment. Stroke 1993;24:35–41. [DOI] [PubMed] [Google Scholar]
- 3.Go AS, Chertow GM, Fan D, McCulloch CE, Hsu C. Chronic kidney disease and the risks of death, cardiovascular events, and hospitalization. N Engl J Med 2004;351:1296–1305. [DOI] [PubMed] [Google Scholar]
- 4.Toyoda K, Ninomiya T. Stroke and cerebrovascular diseases in patients with chronic kidney disease. Lancet Neurol 2014;13:823–833. [DOI] [PubMed] [Google Scholar]
- 5.Lee M, Saver JL, Chang KH, Liao HW, Chang SC, Ovbiagele B. Low glomerular filtration rate and risk of stroke: meta-analysis. BMJ 2010;341:c4249. [DOI] [PMC free article] [PubMed] [Google Scholar]
- 6.Kumai Y, Kamouchi M, Hata J, et al. Proteinuria and clinical outcomes after ischemic stroke. Neurology 2012;78:1909–1915. [DOI] [PubMed] [Google Scholar]
- 7.Voight BF, Peloso GM, Orho-Melander M, et al. Plasma HDL cholesterol and risk of myocardial infarction: a mendelian randomisation study. Lancet Lond Engl 2012;380:572–580. [DOI] [PMC free article] [PubMed] [Google Scholar]
- 8.Holliday EG, Traylor M, Malik R, et al. Polygenic overlap between kidney function and large artery atherosclerotic stroke. Stroke 2014;45:3508–3513. [DOI] [PMC free article] [PubMed] [Google Scholar]
- 9.Malik R, Chauhan G, Traylor M, et al. Multiancestry genome-wide association study of 520,000 subjects identifies 32 loci associated with stroke and stroke subtypes. Nat Genet 2018;50:524–537. [DOI] [PMC free article] [PubMed] [Google Scholar]
- 10.Li M, Li Y, Weeks O, et al. SOS2 and ACP1 loci identified through large-scale exome chip analysis regulate kidney development and function. J Am Soc Nephrol 2017;28:981–994. [DOI] [PMC free article] [PubMed] [Google Scholar]
- 11.Haas ME, Aragam KG, Emdin CA, et al. Genetic association of albuminuria with cardiometabolic disease and blood pressure. Am J Hum Genet 2018;103:461–473. [DOI] [PMC free article] [PubMed] [Google Scholar]
- 12.Narva AS, Bilous RW. Laboratory assessment of diabetic kidney disease. Diabetes Spectr 2015;28:162–166. [DOI] [PMC free article] [PubMed] [Google Scholar]
- 13.National Institute for Health and Care Excellence. Chronic Kidney Disease in Adults: Assessment and Management. Clincal Guideline [online]. Available at: nice.org.uk/guidance/cg182. Accessed January 5, 2019. [PubMed] [Google Scholar]
- 14.Inker LA, Schmid CH, Tighiouart H, et al. Estimating glomerular filtration rate from serum creatinine and cystatin C. N Engl J Med 2012;367:20–29. [DOI] [PMC free article] [PubMed] [Google Scholar]
- 15.Stevens LA, Coresh J, Schmid CH, et al. Estimating GFR using serum cystatin C alone and in combination with serum creatinine: a pooled analysis of 3,418 individuals with CKD. Am J Kidney Dis 2008;51:395–406. [DOI] [PMC free article] [PubMed] [Google Scholar]
- 16.Shlipak MG, Matsushita K, Ärnlöv J, et al. Cystatin C versus creatinine in determining risk based on kidney function. N Engl J Med 2013;369:932–943. [DOI] [PMC free article] [PubMed] [Google Scholar]
- 17.Gorski M, van der Most PJ, Teumer A, et al. 1000 Genomes-based meta-analysis identifies 10 novel loci for kidney function. Sci Rep 2017;7:45040. [DOI] [PMC free article] [PubMed] [Google Scholar]
- 18.Pattaro C, Teumer A, Gorski M, et al. Genetic associations at 53 loci highlight cell types and biological pathways relevant for kidney function. Nat Commun 2016;7:10023. [DOI] [PMC free article] [PubMed] [Google Scholar]
- 19.Teumer A, Tin A, Sorice R, et al. Genome-wide association studies identify genetic loci associated with albuminuria in diabetes. Diabetes 2016;65:803–817. [DOI] [PMC free article] [PubMed] [Google Scholar]
- 20.Woo D, Falcone GJ, Devan WJ, et al. Meta-analysis of genome-wide association studies identifies 1q22 as a susceptibility locus for intracerebral hemorrhage. Am J Hum Genet 2014;94:511–521. [DOI] [PMC free article] [PubMed] [Google Scholar]
- 21.Pantoni L. Cerebral small vessel disease: from pathogenesis and clinical characteristics to therapeutic challenges. Lancet Neurol 2010;9:689–701. [DOI] [PubMed] [Google Scholar]
- 22.Rutten-Jacobs LCA, Tozer DJ, Duering M, et al. Genetic study of white matter integrity in UK biobank (n=8448) and the overlap with stroke, depression, and dementia. Stroke 2018;49:1340–1347. [DOI] [PMC free article] [PubMed] [Google Scholar]
- 23.Evangelou E, Warren HR, Mosen-Ansorena D, et al. Genetic analysis of over 1 million people identifies 535 new loci associated with blood pressure traits. Nat Genet 2018;50:1412. [DOI] [PMC free article] [PubMed] [Google Scholar]
- 24.Bulik-Sullivan B, Finucane HK, Anttila V, et al. An atlas of genetic correlations across human diseases and traits. Nat Genet 2015;47:1236–1241. [DOI] [PMC free article] [PubMed] [Google Scholar]
- 25.1000 Genomes Project Consortium, Abecasis GR, Auton A, et al. An integrated map of genetic variation from 1,092 human genomes. Nature 2012;491:56–65. [DOI] [PMC free article] [PubMed] [Google Scholar]
- 26.Dastani Z, Hivert MF, Timpson N, et al. Novel loci for adiponectin levels and their influence on type 2 diabetes and metabolic traits: a multi-ethnic meta-analysis of 45,891 individuals. PLoS Genet 2012;8:e1002607. [DOI] [PMC free article] [PubMed] [Google Scholar]
- 27.Pickrell JK, Berisa T, Liu JZ, Ségurel L, Tung JY, Hinds DA. Detection and interpretation of shared genetic influences on 42 human traits. Nat Genet 2016;48:709–717. [DOI] [PMC free article] [PubMed] [Google Scholar]
- 28.Duffy DL, Zhu G, Li X, et al. Novel pleiotropic risk loci for melanoma and nevus density implicate multiple biological pathways. Nat Commun 2018;9:4774. [DOI] [PMC free article] [PubMed] [Google Scholar]
- 29.Grace C, Clarke R, Goel A, Farrall M, Watkins H, Hopewell JC. Lack of genetic support for shared aetiology of coronary artery disease and late-onset Alzheimer's disease. Sci Rep 2018;8:7102. [DOI] [PMC free article] [PubMed] [Google Scholar]
- 30.Teumer A. Common methods for performing mendelian randomization. Front Cardiovasc Med 2018;5:51. [DOI] [PMC free article] [PubMed] [Google Scholar]
- 31.Verbanck M, Chen CY, Neale B, Do R. Detection of widespread horizontal pleiotropy in causal relationships inferred from Mendelian randomization between complex traits and diseases. Nat Genet 2018;50:693. [DOI] [PMC free article] [PubMed] [Google Scholar]
- 32.Zheng J, Baird D, Borges MC, et al. Recent developments in mendelian randomization studies. Curr Epidemiol Rep 2017;4:330–345. [DOI] [PMC free article] [PubMed] [Google Scholar]
- 33.Weiner DE, Tighiouart H, Amin MG, et al. Chronic kidney disease as a risk factor for cardiovascular disease and all-cause mortality: a pooled analysis of community-based studies. J Am Soc Nephrol 2004;15:1307–1315. [DOI] [PubMed] [Google Scholar]
- 34.Georgakis MK, Chatzopoulou D, Tsivgoulis G, Petridou ET. Albuminuria and cerebral small vessel disease: a systematic review and meta-analysis. J Am Geriatr Soc 2018;66:509–517. [DOI] [PubMed] [Google Scholar]
- 35.Smith GD, Ebrahim S. “Mendelian randomization”: can genetic epidemiology contribute to understanding environmental determinants of disease? Int J Epidemiol 2003;32:1–22. [DOI] [PubMed] [Google Scholar]
- 36.Davies N, Holmes M, Davey Smith G. Reading Mendelian randomisation studies: a guide, glossary, and checklist for clinicians. BMJ 2018;362:k601. [DOI] [PMC free article] [PubMed] [Google Scholar]
- 37.Pulst SM, Nechiporuk A, Nechiporuk T, et al. Moderate expansion of a normally biallelic trinucleotide repeat in spinocerebellar ataxia type 2. Nat Genet 1996;14:269–276. [DOI] [PubMed] [Google Scholar]
- 38.Rudnik-Schöneborn S, Sztriha L, Aithala GR, et al. Extended phenotype of pontocerebellar hypoplasia with infantile spinal muscular atrophy. Am J Med Genet A 2003;117A:10–17. [DOI] [PubMed] [Google Scholar]
- 39.Iso A, Ozawa H, Kurokawa T, Kubota M, Mori K, Takashima S. Olivopontocerebellar atrophy of neonatal onset with muscle hypertonia in two siblings. Neuropathology 1997;17:225–229. [Google Scholar]
- 40.Chronic Kidney Disease Prognosis Consortium, Matsushita K, van der Velde M, et al. Association of estimated glomerular filtration rate and albuminuria with all-cause and cardiovascular mortality in general population cohorts: a collaborative meta-analysis. Lancet 2010;375:2073–2081. [DOI] [PMC free article] [PubMed] [Google Scholar]
- 41.Traylor M, Zhang CR, Adib-Samii P, et al. Genome-wide meta-analysis of cerebral white matter hyperintensities in patients with stroke. Neurology 2016;86:146–153. [DOI] [PMC free article] [PubMed] [Google Scholar]
- 42.Verhaaren BFJ, Debette S, Bis JC, et al. Multiethnic genome-wide association study of cerebral white matter hyperintensities on MRI. Circ Cardiovasc Genet 2015;8:398–409. [DOI] [PMC free article] [PubMed] [Google Scholar]
- 43.Ni G, Moser G, Schizophrenia Working Group of the Psychiatric Genomics Consortium, Wray NR, Lee SH. Estimation of genetic correlation via linkage disequilibrium score regression and genomic restricted maximum likelihood. Am J Hum Genet 2018;102:1185–1194. [DOI] [PMC free article] [PubMed] [Google Scholar]
- 44.Speed D, Balding DJ. SumHer better estimates the SNP heritability of complex traits from summary statistics. Nat Genet 2019;51:277–284. [DOI] [PMC free article] [PubMed] [Google Scholar]
- 45.Bennett DA, Holmes MV. Mendelian randomisation in cardiovascular research: an introduction for clinicians. Heart 2017;103:1400–1407. [DOI] [PMC free article] [PubMed] [Google Scholar]
- 46.Glymour MM, Kosheleva A, Boden-Albala B. Birth and adult residence in the Stroke Belt independently predict stroke mortality. Neurology 2009;73:1858–1865. [DOI] [PMC free article] [PubMed] [Google Scholar]
- 47.Crews DC, Liu Y, Boulware LE. Disparities in the burden, outcomes and care of chronic kidney disease. Curr Opin Nephrol Hypertens 2014;23:298–305. [DOI] [PMC free article] [PubMed] [Google Scholar]
- 48.Giri A, Hellwege JN, Keaton JM, et al. Trans-ethnic association study of blood pressure determinants in over 750,000 individuals. Nat Genet 2019;51:51. [DOI] [PMC free article] [PubMed] [Google Scholar]
- 49.Nelson CP, Goel A, Butterworth AS, et al. Association analyses based on false discovery rate implicate new loci for coronary artery disease. Nat Genet 2017;49:1385–1391. [DOI] [PubMed] [Google Scholar]
Associated Data
This section collects any data citations, data availability statements, or supplementary materials included in this article.
Data Availability Statement
Genetic variants used are available in the supplemental information (doi.org/10.5061/dryad.kd51c5b2b) and the code used for all analyses is available on request.


