Abstract
The conserved yeast E3 ligase Bre1 and its partner E2 Rad6 monoubiquitinate histone H2B across gene bodies during the transcription cycle1. While processive ubiquitination might in principle arise from Bre1/Rad6 traveling with RNA polymerase II, we provide a different explanation. Here we implicate liquid-liquid phase separation2 as the underlying mechanism. Biochemical reconstitution shows that Bre1 binds the scaffold protein Lge1, whose intrinsically disordered region phase separates via multivalent interactions. The resulting condensates comprise a core of Lge1 encapsulated by an outer catalytic shell of Bre1. This layered liquid recruits Rad6 and the nucleosomal substrate, accelerating H2B ubiquitination. In vivo, the condensateforming region of Lge1 is required to ubiquitinate H2B in gene bodies beyond the +1 nucleosome. Our data suggest that layered condensates of histone modifying enzymes generate chromatin-associated reaction chambers with augmented catalytic activity along gene bodies. Equivalent processes may occur in human cells, causing neurological disease when impaired.
Eukaryotic cells require precisely timed activation of genes, which coincides with chromatin alterations. The fundamental unit of chromatin is the nucleosome core particle (NCP), assembled from histones and DNA, and iterated to resemble ‘beads on a string’. Histone post-translational modifications impact chromatin structure and thus, gene activity. How histone-modifying enzymes are concentrated in discrete parts of the genome to install histone marks locally is a key question. Histone H2B is monoubiquitinated at lysine 123 (H2BK123ub) in yeast and lysine 120 in mammals1. This mark is found across promoter, genic and termination regions of most genes in S. cerevisiae3. H2BK123ub influences DNA transcription, repair, replication and RNA processing1. H2BK123ub exerts its transcriptional effects by regulating NCP assembly, stability3 and specific histone methylations1. Aberrant H2Bub levels are found in various diseases including cancer1. It is therefore important to understand how H2BK123ub is established in specific regions of the genome.
Ubiquitination is a three-step enzymatic cascade, which requires a ubiquitin-activating (E1), ubiquitin-conjugating (E2), and ubiquitin-ligating (E3) enzyme. H2BK123ub is generated by the E3 Bre1, an ortholog of human RNF20/40, together with the E2 Rad6, and the E1 Uba14-8. A common view is that H2BK123ub is deposited in a co-transcriptional manner1. However, H2B ubiquitination does not strictly depend on Bre1-Rad6 binding to RNA Polymerase (Pol) II9. Thus, the mechanism of H2B ubiquitination across genic NCPs is unclear.
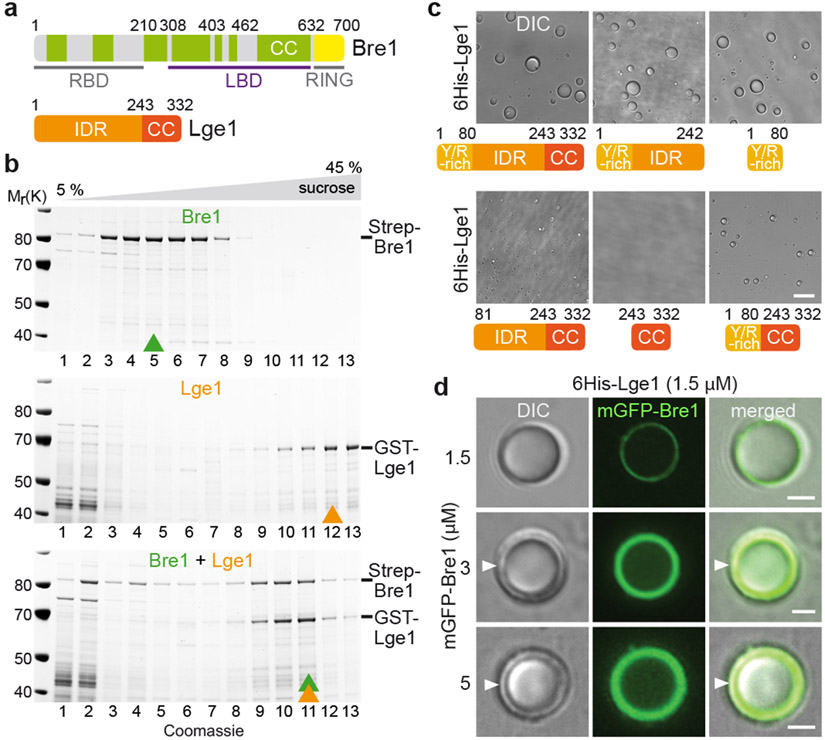
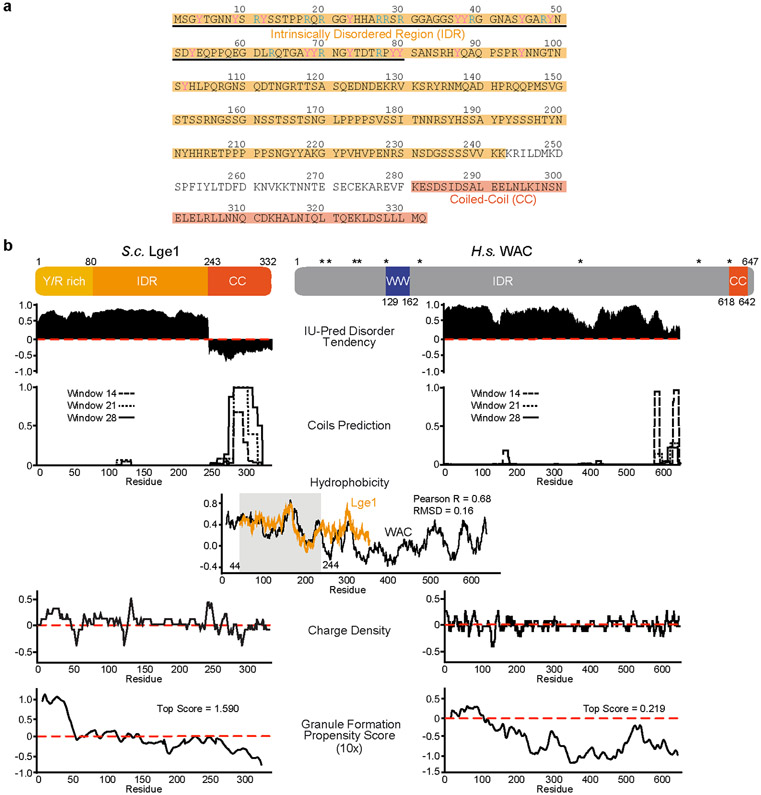
To understand how the ubiquitination machinery is enriched at the correct genomic positions, we considered Lge1 (Large1), a protein with an as yet unknown biochemical role that co-purifies with Bre1, and is essential for H2B monoubiquitination in yeast6. Except for a short C-terminal coiled coil (CC), Lge1 is predicted to consist entirely of an intrinsically disordered region (IDR, Fig. 1a, Extended Data Fig. 2a, b). The human Bre1 orthologs RNF20/40 interact with WAC, a protein with a similar IDR/coiled-coil structure (Extended Data Fig. 2b)10. Some IDR-containing proteins participate in multivalent interactions, which can lead to liquid-liquid phase separation (LLPS) and the formation of biomolecular condensates2,11,12. LLPS has been implicated in chromatin organization13, heterochromatin compaction14, as well as promoter and enhancer function15-18.
Figure 1. Lge1 forms core-shell condensates with Bre1.
a. Bre1 and Lge1 organization. CC, Coiled-Coil domain (green), non-CC regions (grey); RBD, Rad6 Binding Domain; LBD, Lge1 Binding Domain; RING, Really Interesting New Gene domain; IDR, Intrinsically Disordered Region, b. Sucrose gradient analysis of Strep-Bre1 and GST-Lge1. Arrowheads label peak fractions. See SF1 for uncropped gels. c. LLPS assay with 6His-Lge1 constructs (1.5 μM) (cartoons). Scale bar, 10 μm. See also Video S1. d. Reconstitution of core-shell condensates with increasing amounts of mGFP-Bre1 added to preformed 6His-Lge1 condensates. Arrowheads label shell in DIC images. Scale bar, 2 μm.
Here, we define a direct role of LLPS in stimulating histone ubiquitination specifically across gene bodies. Lge1 together with Bre1-Rad6 and nucleosomes form spatially organized ‘reaction chambers’ that stimulate H2B ubiquitination.
Lge1 promotes Bre1 oligomerization
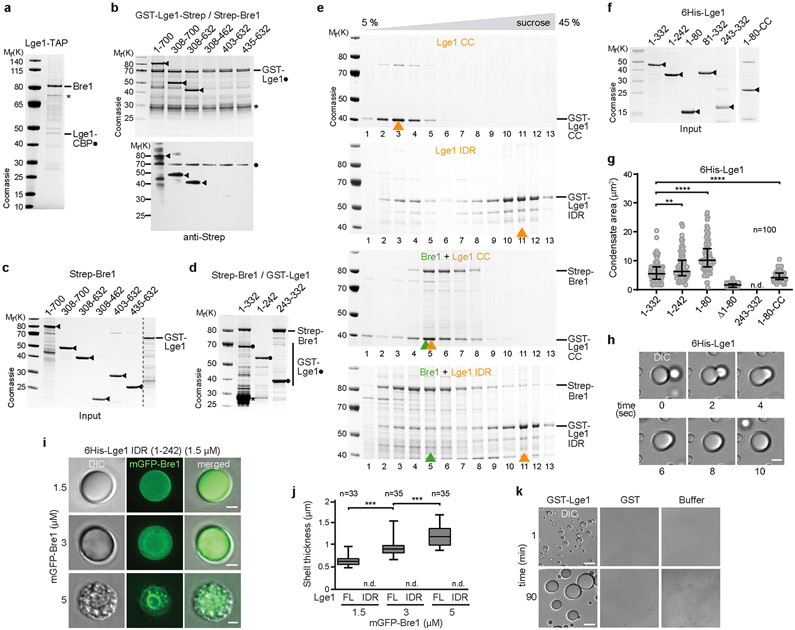
We first explored Lge1-Bre1 interactions and their capacity to phase separate. Bre1 consists of a series of coiled-coils, flanked by an N-terminal Rad6-Binding Domain (RBD) and a C-terminal RING domain19 (Fig. 1a). Bre1 associates with Lge1 when purified from yeast (Extended Data Fig. 1a). GST-tagged Lge1, purified from E.coli, bound the ‘middle’ part of recombinant Bre1 (termed Lge1 Binding Domain, LBD; residues 308-632) (Extended Data Fig. 1b, c; Supplementary Fig. 2; Supplementary Table). On the Lge1 side, its CC was necessary and sufficient for Bre1 binding (Extended Data Fig. 1d). Thus, coiled-coil contacts mediate a direct interaction of Lge1 with Bre1.
Next, we analyzed the oligomerization state of Bre1 and how it might be influenced by the Lge1 IDR. Whereas Bre1 showed a broad peak in the low-molecular weight (LMW) region of a sucrose gradient, Lge1 sedimented in a distinct high-molecular weight (HMW) region. When mixed, Lge1 shifted a significant portion of Bre1 into the HMW region (Fig. 1b; Supplementary Fig. 1). The Lge1 CC sedimented in the LMW region, whereas the Lge1 IDR alone sedimented in the HMW region (Extended Data Fig. 1e). The Lge1 IDR, which does not bind Bre1, left Bre1 in the LMW region. Thus, Lge1 is a scaffold protein, promoting Bre1 oligomerization via its IDR.
Lge1 phase separates in vitro
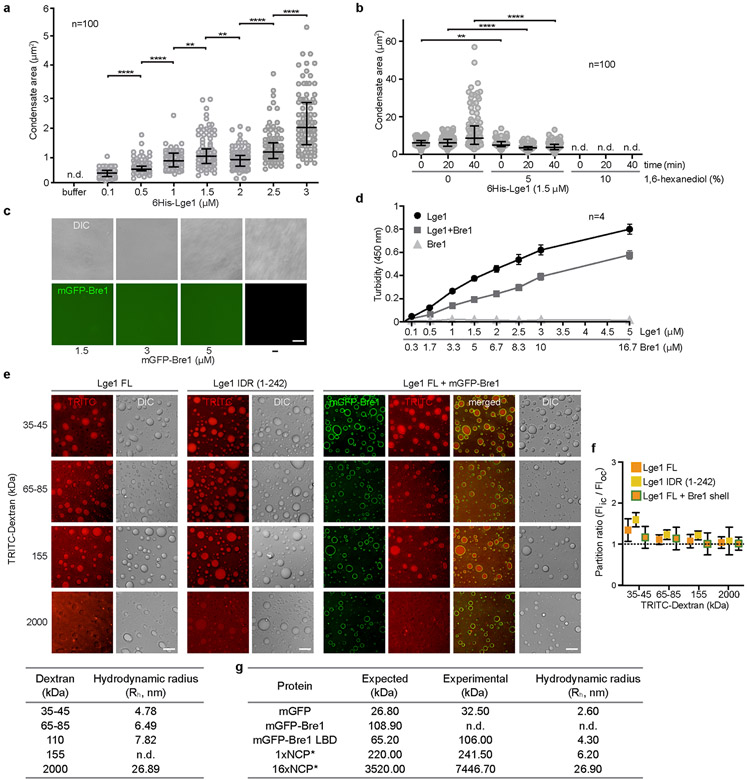
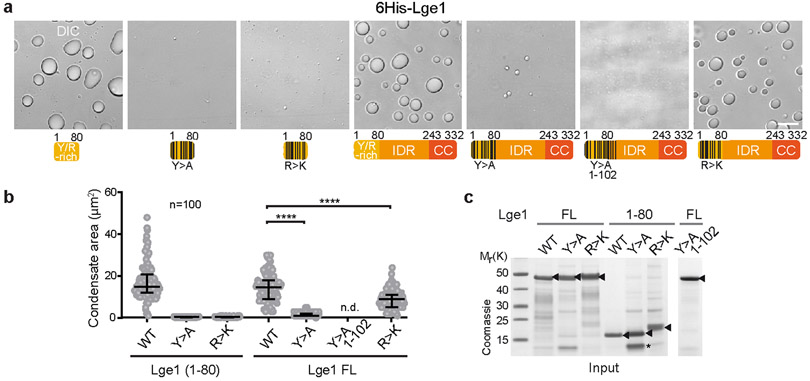
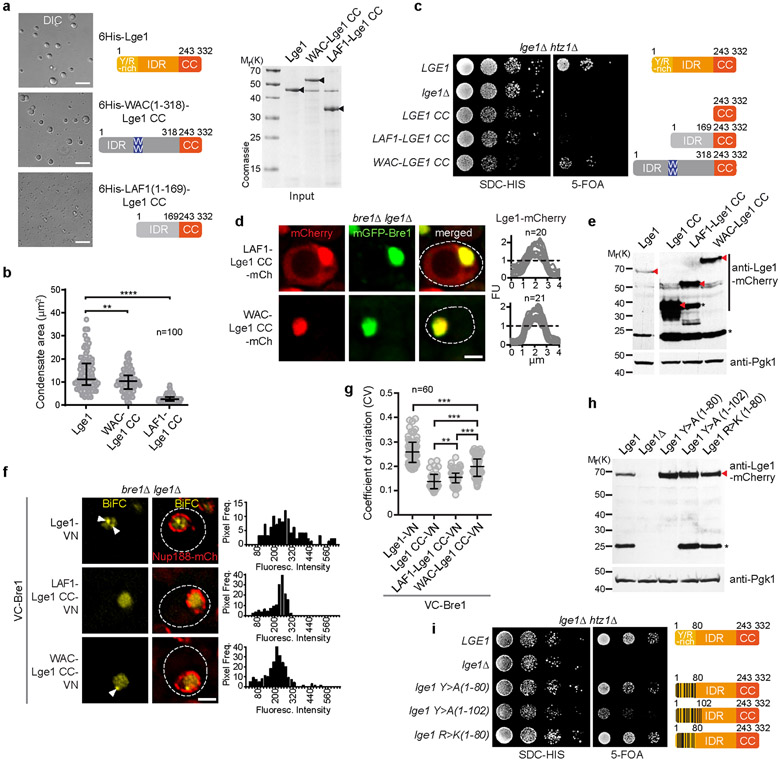
Lge1 has the hallmarks of proteins that undergo LLPS2, including intrinsic disorder, low sequence complexity and blocks of alternating charges (Extended Data Fig. 2a, b). Recombinant full-length 6His-tagged Lge1 indeed formed condensates, which grew in size to micrometer-sized spheres by fusion (Fig. 1c, Extended Data Fig. 1f-h, Video S1). Phase-separation occurred at ~0.1-0.5 μM under physiological salt concentration without crowding agents and was inhibited by 1,6-hexanediol (Extended Data Fig. 4a, b). The sedimentation of Lge1 in sucrose gradients could thus be explained by LLPS (Extended Data Fig. 1k). Deletion of the Lge1 IDR abolished LLPS, whereas the Lge1 IDR alone was sufficient for LLPS (Fig. 1c, Extended Data Fig. 1g). The N-terminus of Lge1 is enriched in tyrosine (Y), glycine (G), and arginine (R) residues (aa1-80) (Extended Data Fig. 2a). Truncating this Y/R-rich region strongly decreased LLPS (Fig. 1c, Extended Data Fig. 1g). Conversely, the Y/R-rich region was sufficient for LLPS and showed LLPS when fused to Lge1 CC, although with lesser efficiency. In sum, a short Y/R-rich ‘sticker’ region at the Lge1 N-terminus (aa1-80) may act as a seed for LLPS.
A Bre1 catalytic shell encapsulates Lge1
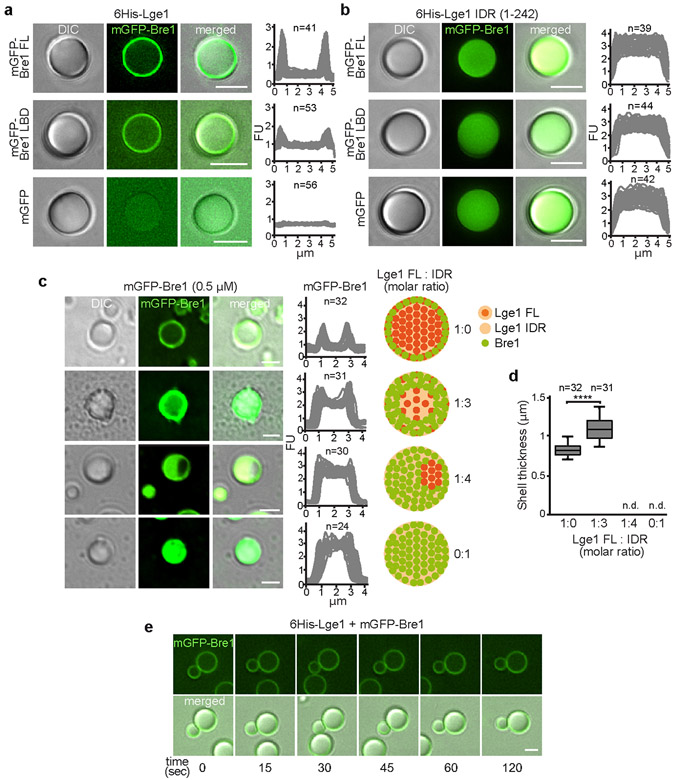
Bre1 does not phase separate on its own (Extended Data Fig. 4c, d), hence Lge1 behaves like a scaffold and Bre1 as a client. When we used recombinant mGFP-tagged Bre1 at equimolar ratio to Lge1, Bre1 only penetrated the Lge1 condensate to a certain depth, forming a shell around a Lge1 core. This shell grew in thickness with increasing Bre1 concentration (Fig. 1d, Extended Data Fig. 1j). To understand how the core-shell architecture is established, we added mGFP-Bre1 to condensates formed by Lge1 lacking the CC (i.e. Lge1 IDR). Bre1 no longer assembled a shell, and instead diffused into the condensate (Extended Data Fig. 1i, j). The Bre1 LBD was sufficient for shell formation, albeit with lesser efficiency, and this specifically depended on the Lge1 CC (Extended Data Fig. 3a, b). To further test the role of the Lge1-Bre1 interaction in shell formation, we created ‘hybrid condensates’ composed of varying ratios of full-length Lge1 mixed with the Lge1 IDR. Bre1 could penetrate deeper into the core when fewer Lge1 CCs were present (Extended Data Fig. 3c, d). This suggests that the Lge1 CC domain captures and organizes Bre1 as it infiltrates the structure from the periphery. Remarkably, the Bre1 shell inhibited condensate fusion (Extended Data Fig. 3e, Video S2), thereby restricting condensate growth (Extended Data Fig. 4d). Thus, Lge1 and Bre1 form a distinct membrane-less compartment with a catalytic E3 shell encapsulating a liquid-like Lge1 core.
The material properties of a condensate determine which molecules are incorporated or excluded. We characterized the effective mesh size using fluorescently labeled dextrans ranging from 35 – 2000 kDa20. Surprisingly, none of the probes were excluded and the partitioning ratios were similar with or without a Bre1 shell (Extended Data Fig. 4e, f). The 2000 kDa probe has a hydrodynamic radius (Rh) of ~27nm in dilute aqueous buffer, similar to a 16-unit nucleosomal array (Extended Data Fig. 4e, g). Thus, Lge1-Bre1 condensates permit the penetration of large molecules.
A key question about LLPS is how particular interactions shape the mesh and function of a condensate2,21. Both Y>A and R>K mutations in the Lge1 ‘sticker’ region strongly decreased LLPS (Extended Data Fig. 5a-c). In the context of full-length Lge1, the Y>A ‘sticker’ mutations decreased LLPS, and three additional Y>A mutations within Lge1 aa1-102 eliminated LLPS. The R>K mutations in full-length Lge1 showed only a modest decrease in LLPS. In sum, a multivalent network underlies the dynamic behavior of Lge1 condensates with tyrosines playing a key role.
LLPS accelerates H2B ubiquitination
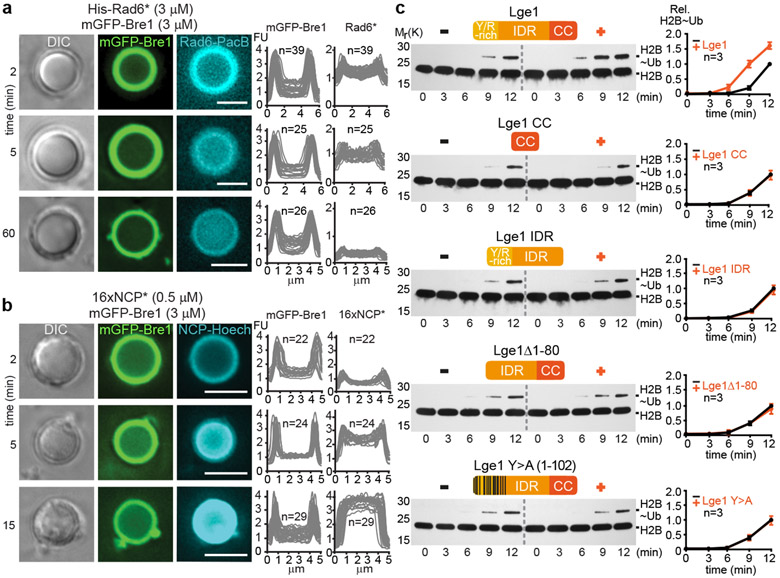
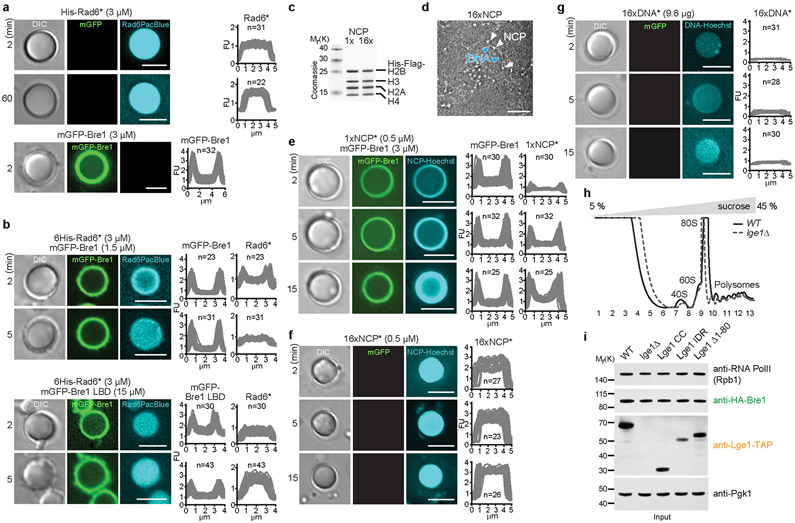
To understand the function of the core-shell condensates, we explored their influence on H2B ubiquitination. Fluorescently labeled Rad6 was rapidly recruited to the Bre1 shell of preformed Lge1-Bre1 condensates (Fig. 2a). Subsequently, Rad6 diffused further into the core, while co-enrichment with Bre1 in the shell still persisted. When Bre1 was omitted, Rad6 did not transiently accumulate in the outer shell, but became rapidly distributed throughout the condensate (Extended Data Fig. 6a). The recruitment of Rad6 to the Bre1 shell depended on a direct interaction, because Bre1 lacking the Rad6-interacting RBD and RING domains (aa308-632) failed to concentrate Rad6 in the shell (Extended Data Fig. 6b). This demonstrates that Lge1 condensates can co-enrich both the E3 Bre1 and the E2 Rad6 in a catalytic shell.
Figure 2. Lge1-Bre1 condensates promote H2BK123ub.
a. Recruitment of Pacific Blue-labelled 6His-Rad6 (His-Rad6*) to Lge1 condensates with a Bre1 shell. Fluorescent intensities were quantified across single condensates. FU, arbitrary fluorescent units, n = number of condensates. Scale bar, 5 μm. b. Partitioning of Hoechst-labeled, reconstituted yeast oligonucleosome arrays (16xNCP*) into Lge1-Bre1 condensates. Scale bar, 5 μm. c. Time-resolved in vitro H2B ubiquitination assay performed under LLPS conditions. +/− refers to the indicated Lge1 constructs used at equimolar concentration. Intensity of the H2B~Ub band was quantified and normalized to 12 min timepoint without Lge1 for each assay, n = independent experiments. Mean and standard deviation are indicated.
For the condensates to qualify as a ‘reaction chamber’ for ubiquitination, nucleosomes should also become concentrated. A 16-unit NCP array, reconstituted from yeast histones on a 16x Widom sequence, was recruited to the catalytic shell of the Lge1-Bre1 condensate (Fig. 2b, Extended Data Fig. 6c, d). Similar to Rad6, the chromatin substrate diffused into the condensate as time progressed. A similar partitioning behavior was observed for mono-nucleosomes (Extended Data Fig. 6e). When the Bre1 shell was missing, chromatin immediately diffused into the interior (Extended Data Fig. 6f). DNA alone showed no strong accumulation (Extended Data Fig. 6g). In sum, LLPS spatially organizes the ubiquitination machinery and its substrate into a distinct core-shell structure.
To test the functional importance of these ‘reaction chambers’, we reconstituted NCP ubiquitination from defined components under phase-separating conditions (Fig. 2c). Addition of full-length Lge1 accelerated H2B ubiquitination. Importantly, the effect was abolished by removing the Lge1 IDR, leaving only the Bre1-interacting CC. The Lge1 IDR alone, which undergoes LLPS but fails to assemble a Bre1 shell (Extended Data Fig. 3b), could not enhance the reaction. The stimulatory effect of full-length Lge1 required the ‘sticker’ region, specifically, the LLPS-promoting Y residues. Thus, H2B ubiquitination was accelerated by conditions that correspond to the formation of Lge1-Bre1 core-shell condensates.
Endogenous Lge1-Bre1 form large complexes
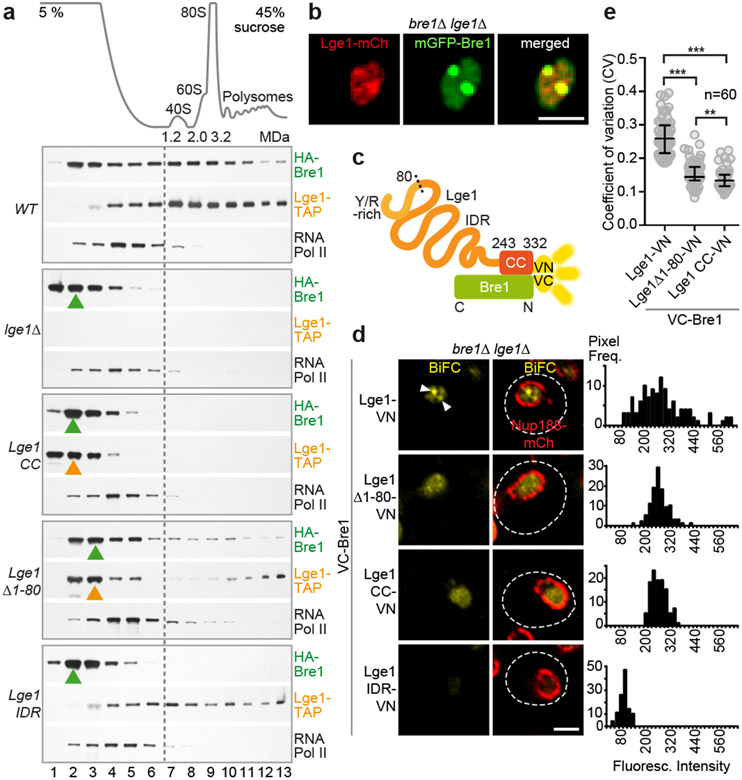
To determine whether Lge1-Bre1 condensates exist in yeast cells, we analysed the sedimentation of Lge1, Bre1 and Pol II at endogenous levels in whole cell extracts using sucrose density gradients. HA-tagged Bre1 was found throughout the gradient and overlapped with the broad peak of TAP-tagged Lge1 in the HMW part (Fig. 3a, Extended Data Fig. 6h, i). Pol II sedimented in the LMW region, suggesting that Lge1-Bre1 multimerization is not due to an association with RNA Pol II. When LGE1 was deleted, Bre1 relocalized into the LMW part of the gradient, in agreement with our reconstitution experiments (Fig. 1b). Deletion of the Lge1 IDR was sufficient to shift the remaining Lge1 CC and Bre1 into the LMW region. Removing only the ‘sticker’ region had a similar, but weaker effect as removing the entire Lge1 IDR. Consistent with Lge1 IDR condensates forming in the absence of Bre1 in vitro (Fig. 1c, Extended Data Fig. 1e), the Lge1 IDR alone sedimented in the HMW region, but failed to shift Bre1 into this region. Overall, the multimerization state of Lge1 and Bre1 in cell extracts is consistent with the formation of core-shell structures observed in vitro (Fig. 1d).
Figure 3. Endogenous Lge1-Bre1 form large complexes and nuclear puncta.
a. Sucrose gradient analysis of cell extracts from Ige1Δ cells transformed with the indicated plasmids. Ribosomal species serve as size markers. Gradient fractions were analyzed by immunoblotting. Peak fractions are highlighted (arrowheads), b. Live imaging of bre1Δ lge1Δ cells co-expressing the indicated constructs from a strong GPD promoter. Scale bar, 2 μm. c. Bimolecular Fluorescence Complementation (BiFC) design. Complementary Venus fragments: VN, VC. d. Live imaging of bre1Δ lge1Δ cells expressing VC-Bre1 and the indicated Lge1-VN constructs from their endogenous promoters. Arrowheads label nuclear BiFC puncta, Nup188-mCherry the nuclear envelope, dashed line the cell contour. Histograms represent pixel frequencies of fluorescence intensity values. Scale bar, 2 μm. e. Coefficient of variation (CV) of nuclear BiFC fluorescence intensity profiles (see Extended Data Fig. 7i). The higher the CV, the greater the heterogeneity of the BiFC signal. Median and interquartile range are indicated, n = number of analyzed cells. **p-value = 0.0037 and ***p-value < 0.001 determined by two-sided Mann-Whitney test.
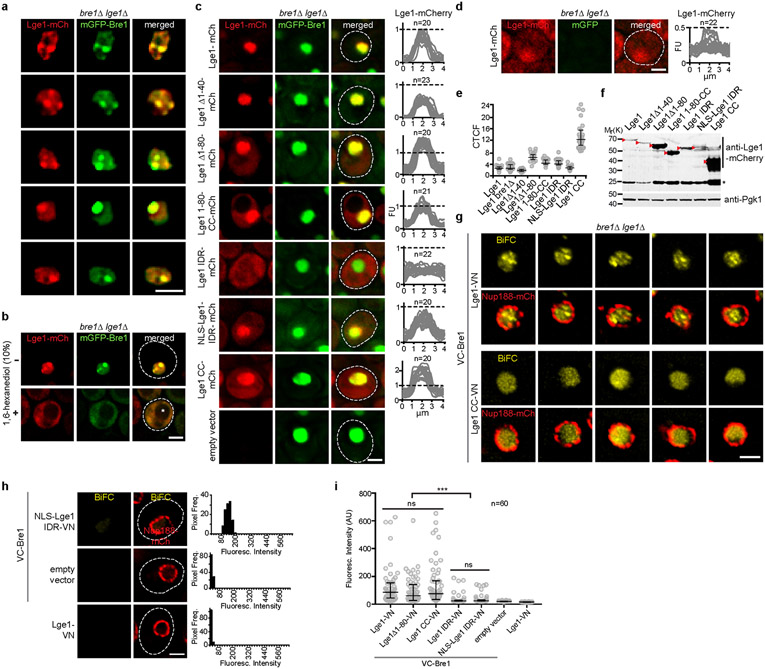
To visualize Lge1 and Bre1 in cells, we co-overexpressed them under a strong promoter. Lge1 and Bre1 co-localized into prominent nuclear foci (Fig. 3b, Extended Data Fig. 7a, b). When expressed from their endogenous promoters, Lge1 and Bre1 were homogenously dispersed in the yeast nucleus (Extended Data Fig. 7c-f). To selectively visualize Bre1 that is bound to Lge1, we used Bimolecular Fluorescence Complementation (BiFC) (Fig. 3c). VC-Bre1 exhibited BiFC with full-length Lge1-VN (Fig. 3d, Extended Data Fig. 7h, i) confirming their interaction. The BiFC signal showed multiple puncta (Fig. 3d, Extended Data Fig. 7g), which may reflect condensates. We quantified puncta formation by measuring the heterogeneity (CV, coefficient of variation) of fluorescent intensities within the nucleus (Fig. 3e). Deleting the Lge1 IDR or the Lge1 ‘sticker’ region (aa1-80) reduced BiFC puncta formation (Fig. 3d, e, Extended Data Fig. 7i). A homogenous BiFC signal, however, was maintained (Fig. 3d), consistent with the presence of the Lge1 CC, which interacts with Bre1. As in other assays, the effect of deleting the entire IDR was stronger than deleting the ‘sticker’ region only (Fig. 1c and Fig. 3a). Together, these data suggest that the nuclear BiFC puncta correspond to the pool of Bre1 undergoing LLPS when binding to Lge1.
Lge1 IDR impacts gene body ubiquitination
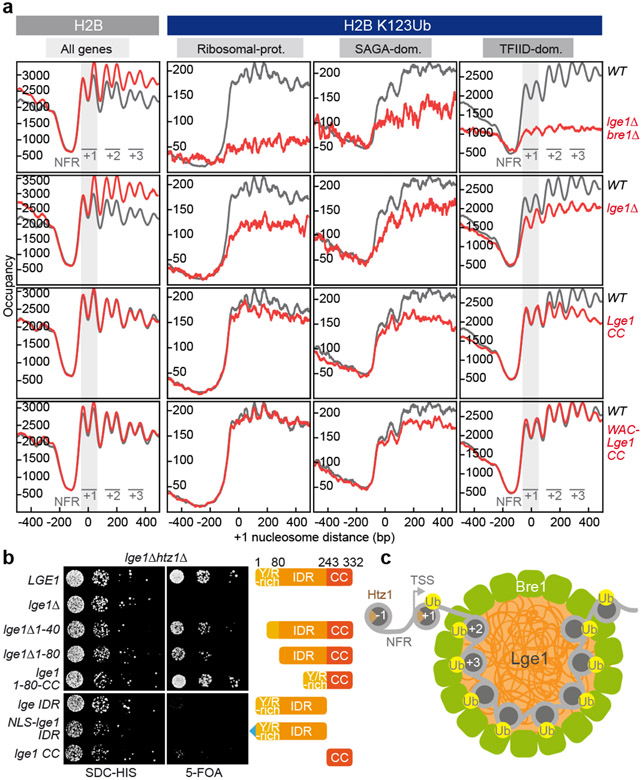
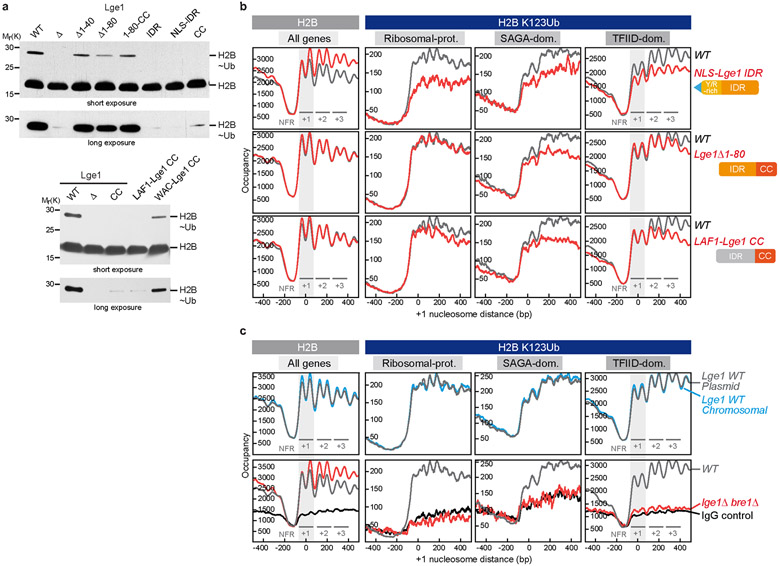
To address how LLPS contributes to H2B ubiquitination in cells, we measured global H2BK123ub levels. Deleting the Lge1 IDR strongly reduced H2Bub (Extended Data Fig. 8a), consistent with LLPS accelerating the enzymatic reaction in vitro (Fig. 2c). Deletion of the ‘sticker’ region had a weaker effect than removal of the entire Lge1 IDR. The Lge1 IDR alone failed to promote H2Bub, as it is not connected to Bre1 (see also Fig. 3a, d). To determine the genome-wide impact of Lge1-Bre1 LLPS, we analyzed the levels of H2B and H2BK123ub using ChIP-exo22, which resolved both H2B subunits within each averaged nucleosome position (Fig. 4a, left column). A lge1Δ strain showed increased nucleosome occupancy (approximated by H2B) downstream of the first (+1) gene-body nucleosome. The Lge1 CC was sufficient to sustain proper nucleosome occupancy and positioning, suggesting that Lge1-Bre1 but not Lge1-directed LLPS is involved in these aspects of chromatin organization.
Figure 4. Lge1 IDR enhances H2BK123ub in gene bodies and is required for viability in htz1Δ.
a. H2B (left) or H2BK123ub (right) ChIP-exo tag 5’ ends were plotted relative to the + 1 nucleosome of all genes for WT (gray trace) and the indicated lge1 mutants (red traces). The first three genic nucleosomes are labeled +1, +2 and +3. Two H2B peaks are observed per nucleosome position. H2BK123ub patterns are shown separately for each gene class28. b. Genetic interaction analysis. Double deletion strains harboring a wild-type LGE1 cover plasmid (URA marker) were co-transformed with the indicated plasmids (HIS marker). Growth (10-fold serial dilutions) was followed on SDC-HIS (control) and on SDC+5-fluoroorotic acid (5-FOA), which shuffles out the URA cover plasmid. c. LLPS-based ubiquitination model. The Htz1-containing +1 NCP is depicted outside of the ‘reaction chamber’ as it is ubiquitinated independently of Lge1 LLPS. For simplicity, Rad6 and the E1 are omitted and only a single layer of Bre1 molecules in the shell is shown. TSS, transcription start site; NFR, nucleosome free region.
In examining H2BK123ub, we separated all genes into three well-studied groups, ribosomal protein (RP), SAGA-dominated, and TFIID-dominated genes, which have distinct types of regulation23,24 (Fig. 4a, Extended Data Fig. 8b, c, Extended Data Fig. 9d, e). As expected, a lge1Δ bre1Δ strain showed substantial loss of H2BK123ub. A lge1Δ strain also showed reduced H2BK123ub across all gene body nucleosomes. The greater loss in the lge1Δ bre1Δ strain indicates that Bre1 retains some activity in the absence of Lge1 (see also Extended Data Fig. 8a). When the Bre1-interacting Lge1 CC was removed (NLS-Lge1 IDR), the H2BK123ub pattern resembled that in the lge1Δ strain, confirming the general importance of the Bre1-Lge1 interaction in regulating H2B ubiquitination in vivo (Extended Data Fig. 8a, b). In contrast, when the Lge1 IDR was deleted, H2BK123ub levels were mainly reduced downstream of +1 nucleosomes (Fig. 4a). This suggests that LLPS is especially important for ubiquitination within gene bodies.
To examine whether any IDR could execute the LLPS function of Lge1, we tested two IDRs from distant species. The IDR of the C. elegans P granule component LAF1 (aa1-169) undergoes LLPS25, but has no relation with H2B ubiquitination. H. sapiens WAC (aa1-318) was picked as the likely functional counterpart of Lge110 (Extended Data Fig. 2b). Using ChIP-exo, we found that the human WAC IDR, but not the unrelated LAF1 IDR, partially substituted for the yeast Lge1 IDR when fused to the Lge1 CC (Fig. 4a and Extended Data Fig. 8b, Extended Data Fig. 10a, b, d-g). This was further confirmed by measuring global H2BK123ub levels with immunoblotting (Extended Data Fig. 8a), suggesting that the IDRs of human WAC and yeast Lge1 have analogous functions.
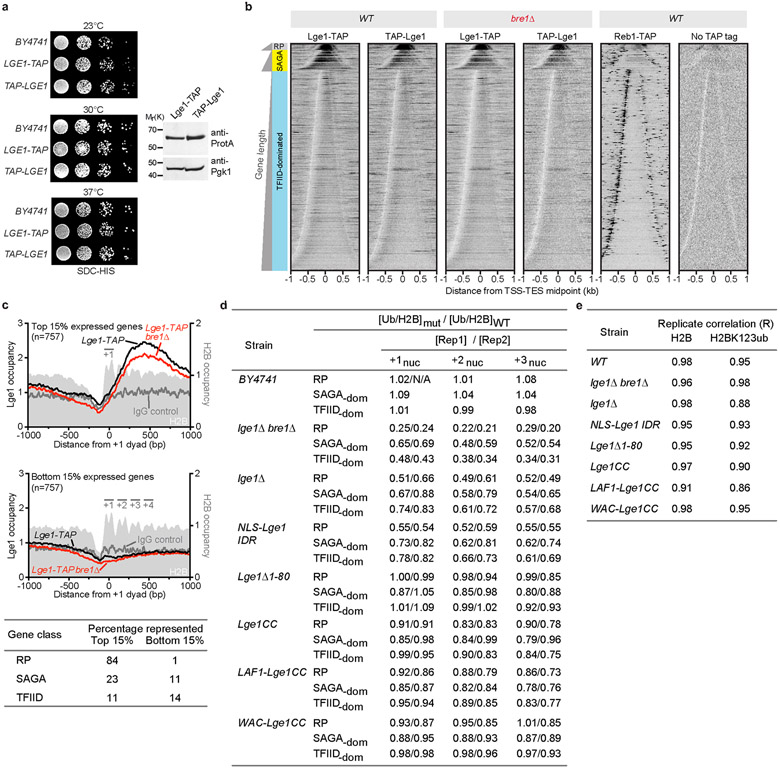
The genome-wide binding profile of Lge1 showed enrichment at all gene classes, but strongest at RP and SAGA-dominated genes (Extended Data Fig. 9a, b). Enrichment was maximal downstream of +1 nucleosomes (Extended Data Fig. 9c), consistent with the impact of Lge1 IDR deletion on H2BK123ub. The genome-wide distribution of Lge1 was largely unaffected by loss of Bre1 (Extended Data Fig. 9b, c). Thus, intrinsic features of Lge1 or yet unknown factors may guide Lge1 to its target locations. These results support a nucleosome position-specific function of Lge1 condensates, downstream of the +1 nucleosome. Ubiquitination at +1 depends on Bre1, but not through Lge1-directed LLPS.
Lge1 IDR affects viability in htz1Δ
Do Lge1-Bre1 condensates affect cell physiology? Both LGE1 and BRE1 are essential for viability in cells lacking the conserved histone variant H2A.Z (yeast Htz1)6 (Fig. 4b, Extended Data Fig. 7f). Htz1 assembles into +1 nucleosomes26, the only gene body nucleosomes whose ubiquitination does not depend on Lge1 LLPS. A truncation of the ‘sticker’ region of Lge1 (aa1-40 or aa1-80) was synthetic sick with htz1Δ, as were Y>A mutations in the N-terminus of Lge1 (aa1-102) (Fig. 4b, Extended Data Fig. 10h, i). The deletion of the Lge1 middle region (aa81-242) displayed no obvious growth defect with htz1Δ. But strikingly, deletion of the entire IDR was synthetic lethal with htz1Δ, despite the presence of the Bre1-interacting CC. Expression of the Lge1 IDR alone (aa1-242), which cannot bind Bre1, did not rescue the synthetic lethal phenotype (Fig. 4b). The Lge1-related human WAC IDR, but not the unrelated LAF1 IDR, partially compensated for the Lge1 IDR (Extended Data Fig. 10c, e), consistent with their effect on H2B ubiquitination of gene body nucleosomes. Overall, these genetic assays suggest that Lge1 LLPS becomes essential for viability when Htz1 is absent from +1 nucleosomes reinforcing the physiological importance of Lge1-Bre1 condensates.
We propose that the Bre1 shell has a direct catalytic role, whereas the core concentrates the E2 Rad6 and the chromatin substrate. By confining the reactants in a small space at high concentration, LLPS increases the opportunity for productive interactions manifold. Moreover, by avidity, the strength and specificity of multiple, simultaneous Bre1-NCP interactions will be greater than just the sum of individual binding events. The human ortholog of Bre1, RNF20/40, co-purifies with WAC, which may perform the analogous function to Lge1 in human cells10. Despite no obvious sequence similarity, WAC and Lge1 share a similar domain organization (Extended Data Fig. 2b). Our results provide an entry point to study whether LLPS contributes to DeSanto-Shinawi syndrome, a neurodevelopmental disorder caused by mutations that truncate WAC (Extended Data Fig. 2b)27. In conclusion, we have discovered that LLPS augments the catalytic activity of the chromatin modifier Bre1. We propose that core-shell condensates form dynamic histone ubiquitination hubs, which target gene body nucleosomes (Fig. 4c), thereby shaping gene architecture and expression.
Methods
Protein purification.
All recombinant proteins used in this study were expressed as published29. Proteins were cloned by PCR-based methods from genomic DNA. Mutations and deletions were generated by PCR-based methods and confirmed by sequencing. StrepII-Bre1 constructs were purified on a 5 ml Strep-Tactin® Superflow column (GE Healthcare) as described previously29. 6His-Lge1-StrepII constructs were purified on Ni-NTA Sepharose 6 FastFlow beads (GE Healthcare) coated with Co2+ (Co(NO3)2) at room temperature. Lysis was performed in a buffer containing 10 mM Tris, pH 8.0, 100 mM NaH2PO4, 1 mM TCEP, 8 M urea; followed by a washing step in washing buffer (10 mM Tris, pH 7.4, 100 mM NaH2PO4, 1 mM TCEP, 8 M urea). A linear gradient to the final buffer containing 20 mM Tris, pH 7.4, 500 mM NaCl, 1 mM TCEP, 3 M urea, 10 % vol/vol glycerol, was applied. Additional washing steps in 10 mM Tris, pH 5.9, 100 mM NaH2PO4, 1 mM TCEP, 3 M urea, 10 % vol/vol glycerol and same buffer with pH 4.5 were performed. Proteins were eluted in 10 mM Tris, pH 7.2, 300 mM or 1M NaCl, 1 mM TCEP, 1 M imidazole and directly used for phase separation assays in buffer containing 100mM NaCl and 100 mM imidazol.
Lge1 mutant R>K (R11K, R18K, R20K, R27K, R28K, R30K, R39K, R48K, R63K, R70K, R77K) was ordered to Invitrogen. Mutant Y>A 1-102 (Y4A, Y9A, Y12A, Y23A, Y38A, Y39A, Y45A, Y49A, Y53A, Y68A, Y69A, Y73A, Y79A, Y80A, Y87A, Y95A, Y102A) was ordered from GenScript.
StrepII-mGFP and StrepII-mGFP-Bre1 constructs were affinity purified on a 5 ml StrepII-Tactin® Superflow column (GE Healthcare) in buffer containing 50 mM Tris, pH 7.5, 100 mM NaCl. Proteins were eluted in 5 mM desthiobiotin and stored in 10 % vol/vol glycerol at −80 °C. 6His-TEV-Rad6 was cloned, expressed and purified as described previously29. When stated, purified 6His-TEV-Rad6 was labelled with Pacific Blue C5-Maleimide (ThermoFisher) as follows. Rad6 was incubated with Pacific Blue dissolved in DMSO for 20 min at 4 °C, prior to dialysis (18 h) in 50 mM Tris, pH 8.0, 50 mM NaCl, 50 mM KCl, 10 mM MgCl2, 1 mM TCEP. Unbound fluorophore was removed by size exclusion chromatography (SEC) on a Superdex 200 16/60 column (GE Healthcare) equilibrated with the same buffer. Purified protein was stored in final 10 % vol/vol glycerol at −80 °C.
LAF1 (residues 1-169) was amplified by PCR from a plasmid containing full length LAF1 (obtained from C. Brangwynne lab) and fused with Lge1 CC (243-332) in an expression vector. The coding region for WAC (aa1-318) was amplified by PCR from human cDNA and was fused to Lge1 CC in an expression vector. 6His-LAF1(1-169)-Lge1CC-StrepII and 6His-WAC(1-318)-Lge1CC-StrepII were purified in urea as described for 6His-Lge1-StrepII, followed by buffer exchange to 10 mM Tris, pH 8.0, 0.2 mM EDTA, 100 mM NaCl.
In vitro binding assays.
Purified GST-Lge1-StrepII constructs were mixed with StrepII-Bre1 constructs in a 1:3 molar ratio in binding buffer (50 mM Tris, pH 7.5, 100 mM NaCl, 0.5 mM DTT, 50 μg of BSA) and incubated with glutathione-Sepharose 4B beads (GE Healthcare) for 1 h at 4 °C. Beads were washed with binding buffer (without BSA) and bound proteins were eluted in 0.006 mg/ml glutathione. After trichloroacetic acid (TCA) precipitation, samples were analyzed by SDS-PAGE (4-12% gel, MOPS buffer) and Coomassie staining or by immunoblotting with anti-StrepII antibody (Qiagen, #34850).
Sucrose gradient sedimentation assay.
Recombinant proteins: 30 μg of purified proteins were applied to a 12 ml 5 - 45 % sucrose gradient in 20 mM Tris, pH 7.5, 10 mM KCl, 5 mM MgCl2, and sedimented at 27000 rpm for 15 h at 4 °C in a SW40-Ti rotor (Beckman Coulter). Gradients were fractionated in 13x 1 ml fractions by pumping Fluoriniert™ FC-40 (3M) into the bottom of the gradient while collecting the fractions from the top using a Brandel gradient fractionation system. Fractions were precipitated with TCA, washed twice with acetone and analyzed by SDS-PAGE (4 - 12 % gel, MOPS buffer) and Coomassie staining. For the Bre1-Lge1 complex, 30 μg of each protein were incubated for 30 min at 4 °C prior to loading the gradient. Fractionation of cell lysates: Cells were grown exponentially, harvested and resuspended in buffer 20 mM Tris, pH 7.5, 10 mM KCl, 5 mM MgCl2, 1mM DTT. Cells were lysed with glass beads and vortexed. Lysates were clarified by centrifugation at 14000 rpm for 5 min at 4 °C. Total protein amount was quantified by Bradford assay (BioRad) and ~350 μg were layered onto 12 ml 5 - 45 % sucrose gradients, sedimented and fractionated as described above. Ribosomal profiles were recorded as a reference by monitoring absorbance at OD 254 nm. After TCA precipitation, samples were analyzed by immunoblotting with anti-HA (Sigma, #11666606001), anti-Protein A (Sigma, P3775) and anti-RNA Polymerase II (Rpb1; Covance, #MMS-126R). Input samples were also analyzed with anti-Pgk1 (Abcam, #Ab113687) as loading control.
Lge1 phase separation assay.
Purified Lge1 proteins in a total volume of 20 μL were placed in a 16x well-glass bottom ChamberSLIP slide (Grace, BioLabs). Slides were pretreated with 1 % w/vol Pluronic® F-127 (PF127, Sigma Aldrich) and washed twice with buffer 25 mM Tris, pH 7.5, 50 mM NaCl, 1 mM DTT, 10 % vol/vol PEG6000. Final buffer composition of 20 mM Tris, pH 7.5, 100 mM NaCl, 1 mM DTT was used for the dilution of the proteins. 1,6-hexanediol was used at a final concentration of 5 or 10 % (w/v) (Sigma Aldrich, #240117). Final protein concentration and incubation times for the experiments are detailed in the corresponding figure legends. DIC imaging was performed on a temperature-controlled DeltaVision Elite microscope (GE Healthcare) at 20°C. Images were acquired with a 60x oil immersion objective coupled to a CoolSNAP HQ2 CCD camera (Photometrics). Image deconvolution was carried out using the SoftWoRx software (GE Healthcare). Images were processed with ImageJ. Quantification of the total area (μm2) of randomly selected condensates was analyzed in ImageJ. 100 condensates were measured for each condition. Statistical significance was evaluated by two-sided Mann Whitney test using the GraphPad Prism software.
Phase separation assays with fluorescent proteins.
6His-Lge1 constructs (1.5 μM) were mixed with fluorescent proteins (StrepII-mGFP, StrepII-mGFP Bre1 constructs, 6His-Rad6*, 1x NCP*, 16x NCP*, 16x 601 WIDOM DNA*) in pretreated and washed 16x well-glass bottom ChamberSLIP slides at 20 °C in a final volume of 20 μL. Buffer composition of 20 mM Tris, pH 7.5, 100 mM NaCl (50 mM NaCl for NCP assays, 1 mM DTT) was used. Concentration of fluorescent constructs and incubation times for each experiment are described in the figure legends. Samples were either directly imaged or, where stated, the experiment was followed over time. Image acquisitions parameters for images of the same experiment are always identical. Images were processed with ImageJ. Quantification of the peak fluorescence intensity of the condensates with fluorescent-tagged proteins was measured by drawing a line across at least 25 randomly selected condensates. Line-scan graphs were generated in ImageJ. Bre1 shell formation: 6His-Lge1-StrepII (1.5 μM) and StrepII-mGFP-Bre1 constructs (3 μM) were preincubated in pretreated and washed 16x well-glass ChamberSLIP slides for 15 min at 20 °C. Fluorescent shell thickness was quantified as follows: on the line-scan graphs, background signal inside the condensate was subtracted from the maximum fluorescent intensity of the peaks. Final thickness values correspond to the length (μm) of the resulting baseline of the peaks. Statistical significance was evaluated by two-sided T-test analysis with the GraphPad Prism software. Image acquisitions parameters for images of the same experiment are always identical. Number of analyzed condensates (n) is indicated in each figure.
Turbidity assay.
200ul of each purified protein (buffer: 20 mM Tris pH 7.5, 100 mM NaCl, 100 mM imizadol, 1mM DTT) were measured at 450 nm on a bottom-clear 96x well plate (Greiner Bio-One) in a Victor Nivo™ plate reader (Perkin Elmer).
Dextran experiments.
Tetramethylrhodamine isothiocyanate (TRITC)-labelled dextrans of an average molecular weight of 35- 45 (TdB Consultancy AB, #TD40), 65-85 (Sigma Aldrich, #T1162), 155 (Sigma Aldrich, #T1287), 2000 KDa (ThermoFisher, #D7139) were dissolved in 20 mM Tris, pH 7.5, 100 mM NaCl. Dextrans with a final concentration of 0.05 mg/ml were added to samples containing 6His-Lge1-StrepII (1.5 μM), 6His-Lge1 IDR-StrepII (1.5 μM) or 6His-Lge1-StrepII (1.5 μM) with a preformed Bre1 shell, each in 20 μL. Final buffer composition was 20 mM Tris, pH 7.5, 100 mM NaCl, 1 mM DTT. Samples were incubated for 15 min at 20 °C in pretreated and washed 16x well-glass bottom ChamberSLIP slides. Samples were imaged simultaneously in DIC, FITC and TRITC channels. Partition ratios were calculated based on the background corrected TRITC fluorescent intensity inside/outside of a condensate quantified with ImageJ. Total of 60 randomly selected condensates were considered for each condition.
Dynamic light scattering.
Hydrodynamic radius and molecular weight of recombinant proteins were measured at 20 °C in a ProteinSolution DynaPro-99-E50 DLS module (Wyatt).
Nucleosome array reconstitution and labelling.
Mononucleosomes (1x NCP) were reconstituted as described previously29. For chromatin reconstitution (16x NCP array), DNA consisting of 16 repeats of the 167 bp 601 Widom sequence was generated from a pUC19-16x601Widom plasmid (a gift from T. Richmond’s) by triple digestion with PstI, BamHI and DpnI for 20 h at 37 °C. 40 % w/vol PEG6000 - NaCl precipitation was used to separate the digested plasmid from array DNA, which was precipitated in EtOH and finally resuspended in 10 mM Tris, pH 8.0, 0.1 mM EDTA. Chromatin was reconstituted with the purified histone octamer and the 16x 601Widom DNA, in a histone octamer:DNA ratio (mg:mg) of 10, followed by KCl dialysis and Mono Q ion exchange chromatography, as described previously29. Samples were then dialyzed in 20 mM Tris, pH 7.5, 1 mM EDTA, 1 mM DTT for 18 h. Histone stoichiometry was assessed by SDS-PAGE and Coomassie staining. Nucleosome occupancy was tested by ScaI digestion and electrophoresis in a 1 % agarose gel. Both 1x and 16x NCPs were labelled with Hoechst 33258 (Sigma Aldrich) (1 μg/ml) by incubation for 30 min at 4 °C, followed by dialysis in 20 mM Tris, pH 7.5, 1 mM DTT for 20 h at 4 °C. Labelled 1x NCP* and 16x NCP* were stored at 4 °C. 16x DNA was labelled with Hoechst (final 1 μg/ml) by incubation for 18h at 4°C and stored at −20 °C.
Negative stain electron microscopy.
Quality of 16x NCP array was also assessed by EM. Samples in 20 mM Tris, pH 7.5, were adsorbed on glow discharged EM grids coated with carbon film and stained with 2% uranyl acetate (Merck), pH 4.0. EM samples were examined on a FEI Morgagni 268D TEM operated at 80 kV. Digital images were acquired using an 11-megapixel Morada CCD camera from Olympus-SIS.
NCP ubiquitination assay.
In vitro H2B ubiquitination assay with Lge1-Bre1 condensates. 6His-Lge1 (0.5 μM), Bre1 (3 μM), 155 kDa dextran (0.65 μM) 1xNCP (1 μM), E1 (100 nM), Rad6 (3 μM) and ubiquitin (36 μM) were incubated in 20 mM Tris HCl, pH 7.5, 75 mM NaCl, 1mM DTT. Reactions were started by addition of ATP (3 mM) and carried out for 12 min with shaking at 300 rpm at 30°C. Reactions were stopped at the indicated time points by adding 4xSDS loading buffer and boiling (5 min at 95 °C) and analyzed by SDS-PAGE and immunoblotting with anti-FLAG antibody (Sigma Aldrich, #F1804). Each experiment was reproduced at least 3 times. Condensate formation was verified by microscopy.
Yeast strains and TAP-purification.
All yeast strains used in this study are listed in the Supplementary Table. Genes in yeast were tagged/deleted by a standard one-step PCR-based technique. Microbiological techniques followed standard procedures. Cells were grown in yeast extract peptone dextrose (YPD) or, when transformed with plasmids, in selective synthetic dextrose complete (SDC) drop-out media. Tandem affinity purifications (TAP) from yeast were performed according to standard protocols.
Live-cell imaging of yeast.
Exponentially growing cells were immobilized on microscope slides with agarose pads and imaged on a DeltaVision Elite microscope (GE Healthcare). Images were acquired with a 60x oil immersion objective and recorded with a CoolSNAP HQ2 CCD camera (Photometrics). Deconvolution was carried out using the SoftWoRx software (GE Healthcare). Images were processed with ImageJ. Cell contours were marked with a dashed white line based on bright field imaging. For 1,6-hexanediol experiment, cells were incubated with 10 % (w/v) 1,6-hexanediol and 10 μg/ml digitonin (or only 10 μg/ml digitonin as control) for 10 min at 30 °C prior to imaging.
To record Lge1-Bre1 BiFC intensity in a histogram, a contour was drawn around the nucleus and fluorescence intensities were analyzed using the ImageJ "Histogram" function. For quantification of the mean nuclear BiFC intensity, mean fluorescence intensity values from the histograms were used. The coefficient of variation (CV) values were determined from histogram data (standard deviation/mean). To quantify the corrected total cell fluorescence (CTFC), a contour was drawn around a cell and the integrated density was measured using ImageJ. To quantify the fluorescence intensity of Lge1 constructs in cells, a line was drawn across the nucleus and line-scan graphs were obtained by ImageJ. Number of analyzed cells (n) is indicated in each figure. Statistical significance was evaluated by two-sided Mann-Whitney test using the GraphPad Prism software.
Yeast genetic interaction analysis.
Double mutant strains harboring a wild-type LGE1 cover plasmid (URA marker) were co-transformed with LGE1, WAC or LAF1 plasmids (HIS marker). Growth was followed on SDC-HIS (loading control) and on SDC+5-fluoroorotic acid (5-FOA) plates to shuffle out the URA cover plasmid. Cells were spotted in 10-fold serial dilutions and incubated for 2 (SDC-HIS) or 3 days (5-FOA) at 30°C.
Protein expression levels in whole cell extracts.
Yeast lysates were prepared, normalized for protein concentration and analyzed by western blotting according to standard procedures. Antibodies were used according to the manufacturer’s instructions: anti-mCherry (Abcam, #Ab125096), anti-Protein A (Sigma, P3775), anti-Pgk1 (Abcam, #Ab113687).
Global levels of H2B ubiquitination.
LGE1 was deleted in a strain carrying FLAG-H2B. This strain was then transformed with plasmid-based versions of LGE1-mCherry WT, empty vector, and the indicated mutants, all expressed from the endogenous LGE1 promoter. Cell lysates were subjected to anti-FLAG immunoprecipitation (M2 beads, Sigma, A2220). Recovered proteins were analyzed by SDS-PAGE and immunoblotting with an anti-FLAG antibody (Sigma, A8592).
ChIP-exo (5.0).
Antibodies:
Rabbit monoclonal antibody against ubiquityl-Histone H2B (Lys120)(Cell Signaling, 5546), and rabbit polyclonal to histone H2B (Abcam, ab1790)30 were used to probe for the specific ubiquitin mark and the underlying nucleosome, respectively. For TAP tagged strains, rabbit IgG (Sigma) conjugated to Dynabeads was used. Protein A module of the TAP tag was the target.
Indicated mutant strains were grown in selective CSM-HIS media, while the WT strains were grown in CSM+all media to an O.D600 of 0.8 at 25°C. Cells were crosslinked with formaldehyde for 15 min at room temperature at a final concentration of 1%, and quenched with glycine for 5 min at a final concentration of 125 mM. Cells were then centrifuged and washed with ST buffer (10 mM Tris-HCl, pH 7.5; 100 mM NaCl) at 4°C. Supernatant was removed and cell pellets were flash frozen and stored at −80°C until further use. 50 ml culture aliquots were resuspended and lysed in 750 μl FA Lysis Buffer (50 mM Hepes-KOH, pH 7.5; 150 mM NaCl; 2 mM EDTA; 1% Triton X-100; 0.1% sodium deoxycholate and complete protease inhibitor (Roche) along with 1 ml of 0.5 mm zirconia beads by bead beating for 4 cycles of 3 min on/7 min off in a Mini-Beadbeater-96 machine (Biospec). Whole cell lysates were transferred to microcentrifuge tubes and spun at 14,000 rpm for 3 min at 4°C to obtain chromatin pellets. Supernatant (representing cytoplasmic fraction) was discarded and the chromatin pellet was resuspended in 200 μl FA Lysis Buffer supplemented with 0.1% SDS and 75 μl 0.1 mm zirconia beads. Resuspended chromatin sample was sonicated in a Bioruptor (Diagenode) for 4 cycles of 30s on/30 s off. The tubes were centrifuged at 14,000 rpm for 10 minutes to collect the sonicated chromatin fraction. Chromatin obtained from 50 ml culture was used for a single ChIP experiment. Reb1-TAP tagged strain (Open Biosystems) was used a positive control to determine the success of the ChIP experiments. Appropriate antibodies (5 μg per ChIP) were conjugated to protein A Magnetic Sepharose resin (GE Healthcare Life Sciences) at 4°C for 6-8 hours. Unconjugated antibody was removed and chromatin sample was added and incubated at 4°C overnight to allow for immunoprecipitation. All steps after immunoprecipitation were essentially performed as described previously31. Prepared libraries were gel purified and were sequenced in paired-end mode with a NextSeq 500. Sequence reads were aligned to the Saccharomyces cerevisiae genome (sacCer3) using bwa-mem (v0.7.9a) (Li, H., arXiv:1303.3997v1[q-bio.GN], 1303 (2013)). Aligned reads obtained were filtered to remove PCR duplicates and any non-unique alignments. ChIP-exo Read-1 5’ ends had their coordinates shifted by 6 bp in the 3’ direction, to reflect to offset of exonuclease stops and the site of crosslinking. At least two biological replicates were performed for ChIP-exo experiments, unless otherwise indicated. These methods and information on data analysis and scripts can be accessed online (https://github.com/CEGRcode/Gallego_2019). Sequencing files can be found in https://www.ncbi.nlm.nih.gov/geo/ under accession number GSE131639.
Structural bioinformatics.
Charge profiles for Lge1 and WAC protein sequences were generated using scripts written for this purpose with a window of 10 amino-acid residues used for smoothing. Hydrophobicity profiles for Lge1 and WAC protein sequences were generated and superimposed using VOLPES server32 (http://coil.msp.univie.ac.at/app.html).
Statistics and Reproducibility
Main Figures:
Figure 1b: experiment was performed 4 times.
Figure 1c: performed 2 times.
Figure 1d: performed 3 times. Quantification of condensates is included in Extended Data Fig. 1j.
Fig. 2a, b: performed 3 times.
Figure 3a: performed 2 times.
Figure 3b: performed 3 times.
Figure 3d: performed 3 times. Quantification included in Ext. Data Figure 7i.
Figure 4a: 2 replicates.
Figure 4b: performed 6 times.
Extended Data Figures:
Ext. Data Fig. 1a: performed 6 times.
Ext. Data Fig. 1b, c: performed 5 times.
Ext. Data Fig. 1d, e: performed 4 times.
Ext. Data Fig. 1f: Lge1 1-80 was purified 2 times, Lge1 1-80-CC 3 times. The other constructs > 10 times.
Ext. Data Fig. 1h: Time lapse for droplet fusion was recorded in 2 independent experiments.
Ext. Data Fig. 1i: performed 2 times.
Ext. Data Fig. 1k: performed 3 times.
Ext. Data Fig. 2b: Sequences were analysed as described in the figure legend and in Supplemental Methods.
Ext. Data Fig. 3a, b: performed 3 times.
Ext. Data Fig. 3c: performed 2 times.
Ext. Data Fig. 3e: Time lapse recorded in 2 independent experiments.
Ext. Data Fig. 4a: performed 2 times.
Ext. Data Fig. 4b: performed 3 times.
Ext. Data Fig. 4c: performed 10 times as control.
Ext. Data Fig. 4e: performed 3 times.
Ext. Data Fig. 4g: performed 2 times.
Ext. Data Fig. 5a: performed 4 times.
Ext. Data Fig. 5c: performed 4 times.
Ext. Data Fig. 6a: performed 2 times.
Ext. Data Fig. 6b: performed 3 times.
Ext. Data Fig. 6c: Purification of mononucleosomes (1xNCP) was performed 29 times, purification of 16x NCP was performed 11 times.
Ext. Data Fig. 6d: performed 2 times.
Ext. Data Fig. 6e: performed 4 times.
Ext. Data Fig. 6f: performed 4 times.
Ext. Data Fig. 6g: performed 2 times.
Ext. Data Fig. 6h: performed 4 times.
Ext. Data Fig. 6i: corresponds to Figure 3a, performed 2 times.
Ext. Data Fig. 7a-d: performed 3 times.
Ext. Data Fig. 7e: numbers of randomly selected cells: Lge1 = 22; Lge1 bre1Δ = 33; Lge1Δ 1-40 = 24; Lge1Δ 1-80 = 25; Lge1 1-80-CC = 25; Lge1 IDR = 28; NLS-Lge1 IDR = 21; Lge1 CC = 27.
Ext. Data Fig. 7f: performed 3 times.
Ext. Data Fig. 7g: performed 3 times.
Ext. Data Fig. 7h: performed 3 times. Quantification is included in Ext. Data Fig. 7i.
Ext. Data Fig. 8a: performed 3 times.
Ext. Data Fig. 8b, c: 2 replicates.
Ext. Data Fig. 9a: Dot spots were performed 4 times. Whole cell extracts and western blotting were performed 2 times.
Ext. Data Fig. 9b-e: based on 2 replicates.
Ext Data Fig. 10a: performed 2 times.
Ext Data Fig. 10c, e: performed 4 times.
Ext Data Fig. 10d: performed 3 times.
Ext. Data Fig. 10f: performed 3 times.
Ext. Data Fig. 10h, i: performed 4 times.
Author Information
Correspondence and requests for materials should be addressed to A. Köhler.
Data and Code Availability Statement
ChIP-exo sequencing files can be accessed at NCBI Gene Expression Omnibus (https://www.ncbi.nlm.nih.gov/geo/) with the accession number GSE131639. Data analysis softwares, scripts and parameters used to analyze ChIP-exo datasets can be accessed in detail via https://github.com/CEGRcode/Gallego_2019 All source data (i.e. uncropped gels and western blots) associated with the paper are provided in Supplementary Fig. 1 and Supplementary Fig. 2.
Extended Data
Extended Data Figure 1. Lge1 interaction with Bre1 and LLPS.
a. Bre1 co-purifies with Lge1. Lge1-TAP was tandem affinity-purified from yeast. Bre1 and Lge1-CBP were confirmed by mass spectrometry. Asterisk indicates a Bre1 degradation product. b. Bre1 interacts with Lge1 in vitro. Binding assay using recombinant GST-Lge1-Strep as bait (black dot) with Strep-Bre1 constructs (arrowheads) (1:3 molar ratio). Proteins were analyzed by Coomassie staining and anti-Strep immunoblotting. Input proteins are shown in c. d. Same setup as in b. Black dots indicate immobilized Lge1 constructs, asterisk a degradation product. e. Sucrose gradient sedimentation assays (5 %−45 %) of recombinant Strep-Bre1 and GST-Lge1 proteins. Main peak fractions are highlighted (arrowheads). f. Input protein for 6His-Lge1 constructs used in phase separation assays. g. Quantification of condensate sizes in Fig. 1c. n = number of condensates. Dot plots with median and interquartile range. **p-value = 0.0189, ****p-value < 0.0001 determined by two-sided Mann-Whitney test. n.d., not determinable. h. Analysis of condensate growth using DIC imaging (6His-Lge1; 5 μM). Scale bar, 2 μm. See also Video S1. i. Increasing amounts of mGFP-Bre1 were added to preformed 6His-Lge1 IDR condensates, lacking Lge1 CC. Note that the unrestricted diffusion of Bre1 (5 μM) into Lge1 IDR condensates caused their interior to collapse into coarse aggregates. Scale bar, 2 μm. j. Quantification of mGFP-Bre1 shell thickness in Fig. 1d and Extended Fig. 1i. Box-whisker plot shows median, interquartile range, minimum and maximum values. ***p-value < 0.001 determined with two-sided T-test (1.5 μm-3 μm: t= 7.6, df= 67; 3 μm-5 μm: t=14, df=69). n = number of condensates. n.d., not determinable. k. GST-Lge1 used in Fig. 1b phase separates in vitro. Recombinant GST-Lge1 (7 μM), GST (7 μM) and buffer only (20 mM Tris pH 7.5, 10 mM KCl, 5 mM MgCl2) were visualized by DIC microscopy at 20 °C for the indicated times (min). Scale bar, 10 μm. See SF2 for uncropped gels and western blots.
Extended Data Figure 2. Lge1 structural properties and comparison with WAC.
a. Amino-acid sequence of S.cerevisiae Lge1. The Intrinsically Disordered Region (IDR; aa1-242) is highlighted in light orange; the predicted Coiled-Coil (CC; aa281-332) in dark orange; the Y/R rich ‘sticker’ (aa1-80) is underlined. The mutated Y and R residues are labelled in magenta and blue, respectively. b. Comparative sequence analyses of yeast Lge1 (left panels) and human WAC (WW domain-containing adapter protein with coiled-coil) (right panels). Cartoon shows predicted Lge1 and WAC domain organization, boundaries are drawn to scale. IDR, Intrinsically Disordered Region; CC, Coiled-Coil; WW, protein-protein interaction domain with two tryptophans (W). Asterisks indicate residues whose mutation has been implicated in DeSanto-Shinawi syndrome pathogenesis. This neurodevelopmental disorder, which causes a developmental delay and dysmorphic facial features. It is caused by mutations, which are predicted to truncate the WAC IDR and hence disconnect it from the RNF20/40-interacting CC domain (i.e. nonsense and frameshift mutations leading to nonsense mediated decay or protein truncation)33. Disorder prediction: disorder scores were calculated with the IUPred algorithm. Both Lge1 and WAC show extensive intrinsic disorder. Coiled-Coils: prediction was performed with the COILS software, showing putative CC elements at the C-termini of both proteins. Hydrophobicity: the VOLPES web-server was used to plot hydrophobicity profiles of protein sequences, see Methods for further details32. Lge1 and WAC display a similar hydrophobicity pattern in their N-terminal regions. The region with the best match is highlighted with a gray rectangle. Similarity in this region is indicated by Pearson correlation coefficient (R, 0.68) and Root-Mean-Squared Deviation (RMSD, 0.16). Charge distribution profile: both Lge1 and WAC exhibit alternating blocks of negative and positive charge. The sequence charge density was calculated using a custom-made script. A window of 10 residues was used for smoothing. Condensate formation: the catGRANULE algorithm was used to predict the propensity for condensate formation. Top scores are indicated. Note that the high scoring sequence in Lge1 corresponds approximately to the Y/R-rich region.
Extended Data Figure 3. Mechanism of Bre1 shell formation.
a-b. Reconstitution of condensates with core-shell architecture. Recombinant mGFP-tagged proteins (1.5 μM) were added to preformed 6His-Lge1 condensates or 6His-Lge1 IDR. Samples were incubated for 15 min prior to imaging by DIC and fluorescence microscopy. Scale bar, 2 μm. c. Reconstitution of ‘hybrid condensates’ with varying ratios of 6His-Lge1 FL: 6His-Lge1 IDR show differential partitioning of mGFP-Bre1 into the core. Proteins were mixed at the indicated molar ratios and incubated for 15 min at 20 °C. mGFP-Bre1 (0.5 μM) was added to the preformed condensates and incubated for 15 min prior to imaging by DIC and fluorescent microscopy. Fluorescent intensities were quantified across single condensates. Cartoons indicate putative assembly state of ‘hybrid condensates’, with a deterioration of the core-shell structure upon reduction of available Lge1 CCs. FU, arbitrary fluorescent units. n = number of condensates. Scale bar, 2 μm. d. Quantification of mGFP-Bre1 shell thickness in c. Box-whisker plot shows median, interquartile range, minimum and maximum values. ****p-value < 0.0001 determined with two-sided T-test (t= 9.4, df= 62). n = number of condensates. n.d., not determinable. e. Analysis of condensate fusion. 6His-Lge1 condensates (1.5 μM) with an mGFP-Bre1 shell (1.5 μM) were followed over time by microscopy. Condensates collide but do not fuse. Compare to Extended Data Fig. 1h. Scale bar, 2 μm. See also Video S2.
Extended Data Figure 4. Material properties of Lge1 condensates.
a. Quantification of 6His-Lge1 condensate sizes at different protein concentrations after 5 min of incubation at 20 °C. Quantification was done with ImageJ. n = number of condensates. Dot plots show median and interquartile range. **p-value 1 vs. 1.5 = 0.0046, **p-value 1.5 vs. 2 = 0.0029, ****p-value < 0.0001 determined by two-sided Mann-Whitney test, n.d., not determinable, b. Quantification of 6His-Lge1 condensate size in the presence of 1,6-hexanediol indicates an inhibition of LLPS. Concentrated Lge1 protein was diluted to 1.5 μM in buffer with 1,6-hexanediol (%, w/v) and incubated for 15 min before imaging, n = number of condensates. Dot plots show median and interquartile range. **p-value = 0.0032, ****p-value < 0.0001 determined by two-sided Mann-Whitney test, n.d., not determinable, c. Strep-mGFP-Bre1 does not phase-separate under the conditions tested. Concentrated proteins were diluted and incubated at 20 °C for 5 min prior to DIC microscopy. Scale bar, 10 μm. d. Turbidity measurements of 6His-Lge1 at 450 nm with or without Strep-Bre1. Proteins were mixed at the indicated molar ratios. LLPS of Lge1 occurred already at 0.1 μM, Strep-Bre1 shows no LLPS under the conditions tested. Mean and standard deviation are indicated, e. Condensates of 6His-Lge1, 6His-Lge1 IDR or 6His-Lge1 with an mGFP-Bre1 shell were incubated with TRITC-labelled dextran of different sizes (final dextran concentration 0.05 mg/ml) for 15 min at 20 °C. Samples were imaged by DIC and fluorescence microscopy. Scale bar, 10 μm. The table below shows the hydrodynamic radius (Rh) for dextrans in aqueous buffer; adapted from published work34, f. Lge1-Bre1 condensates are permeable to dextrans of different sizes. Dextran is never excluded (partition ratios ≥ 1). Mean and standard deviation are indicated; n = 60 condensates, g. Average Rh of recombinant proteins used in this work as measured by dynamic light scattering (DLS) at 20 °C. The expected molecular mass was calculated according to the protein’s amino-acid composition and compared to the experimental molecular mass obtained by DLS. Final data correspond to the average of at least two independent measures, n.d., not determinable.
Extended Data Figure 5. Lge1 tyrosine residues are critical for LLPS.
a. Phase-separation assay with the indicated 6His-Lge1 constructs (10 μM). Scale bar, 10 μm. Cartoons drawn to scale. Lge1 Y>A 1-102 contains three additional mutations within aa1-102 besides the Y>A mutations in the sticker (aa1-80) (see Extended Data Fig. 2a), which increases the disruption of Lge1 LLPS in vitro. b. Quantification of condensate sizes (6His-Lge1 constructs; 10 μM). n = quantified condensates. Dot plot shows median and interquartile range. ****p-value < 0.0001 determined by two-sided Mann-Whitney test, n.d., not determinable. Lge1 Y>A 1-102 contains three additional mutations within aa1-102 besides the Y>A mutations in the sticker (aa1-80). c. Input gel for a. Asterisk indicates degradation product, arrowheads Lge1 constructs. See SF2 for uncropped gels.
Extended Data Figure 6. Lge1-Bre1 condensates recruit the E2 Rad6 and chromatin.
a. Recruitment of Pacific Blue-labelled 6His-Rad6 (His-Rad6*, 3 μM) or mGFP-Bre1 (3 μM) to Lge1 condensates. Experimental conditions as in Fig. 2a. Fluorescent intensities were quantified across single condensates. FU, arbitrary fluorescent units, n = number of condensates. Scale bar, 5 μm. b. Recruitment of Rad6 to condensates was examined by adding Pacific Blue-labelled 6His-Rad6 (His-Rad6*) to 6His-Lge1 condensates in the presence and absence of an mGFP-Bre1 (1.5 μM) or mGFP-Bre1 LBD (15 μM) shell. The Bre1 LBD construct has a weaker affinity to Lge1, hence requiring a higher concentration. Microscopy was performed immediately after adding His-Rad6* (3 μM) and followed over time. Fluorescent intensities were quantified across single condensates. FU, arbitrary fluorescent units, n = number of condensates. Scale bar, 5 μm. c. Reconstituted mononucleosomes (1x NCP) and oligonucleosomes (16x NCP) were analyzed by SDS-PAGE and Coomassie staining to assess purity and stoichiometry, d. Negative Stain Electron Microscopy was performed to assess the structure of oligonucleosomes. White arrowheads label individual nucleosomes, blue arrowheads the linker DNA. Scale bar, 100 nm. e. Recruitment of mononucleosomes to Lge1 condensates with an mGFP-Bre1 shell. Hoechst-labelled, reconstituted mononucleosomes (1xNCP*; 0.5 μM) were added to 6His-Lge1 condensates with an mGFP-Bre1 shell (3 μM) and imaged over time (min). FU, arbitrary fluorescent units, n = number of condensates. Scale bar, 5 μm. f. Recruitment of oligonucleosomes to Lge1 condensates. Hoechst-labelled, reconstituted 16x nucleosomes (16xNCP*; 0.5 μM) were added to 6His-Lge1 condensates and imaged overtime (min). FU, arbitrary fluorescent units, n = number of condensates. Scale bar, 5 μm. g. Diffusion and retention of 601 Widom DNA into Lge1 condensates. Same setup as in f but with Hoechst-labeled 16x 601 Widom DNA (16xDNA*) added to 6His-Lge1 condensates, n = number of condensates. Scale bar, 5 μm. h. OD 254 nm traces of the sucrose gradient sedimentation assays (5 % - 45 %) show a reproducible fractionation pattern for cell extracts prepared from the indicated strains. The different ribosomal species and fractions are indicated and correspond to the fractions in Fig. 3a. i. Protein levels in cell extracts used for sucrose gradient assays. Anti-Pgk1 serves as a loading control. See SF2 for uncropped gels and western blots.
Extended Data Figure 7. Analysis of Lge1 and Bre1 in vivo.
a. Gallery of representative images of bre1Δ lge1Δ cells co-expressing the indicated constructs from the strong GPD promoter. Scale bar, 2 μm. b. 1,6-hexanediol treatment (10 %, w/v) reduces the formation of Lge1-Bre1 puncta, but also affects nuclear import, thus, complicating the interpretation of hexanediol effects in cells (white asterisk labels the vacuole). Dashed white line shows the cell contour. Scale bar, 2 μm. c-d. Live imaging of bre1Δ lge1Δ cells expressing mGFP-Bre1 c or an empty vector d and the indicated Lge1-mCherry constructs. Dashed white line shows the cell contour. The fluorescence intensity of Lge1-mCherry constructs was quantified across a line spanning the nucleus. For comparison, the FU value = 1 is marked with a horizontal dashed line, except for d where the dashed lines indicates FU = 0.5. n = number of randomly selected cells. FU, arbitrary fluorescence units. Scale bar, 2 μm. e. Quantification of background-corrected total cell fluorescence (CTCF) of mCherry in c-d. Dot plots show median and interquartile range, f. Comparison of protein expression levels of different Lge1-mCherry constructs in c. Cell lysates were analyzed by SDS-PAGE and immunoblotting with anti-mCherry antibody. Anti-Pgk1 serves as a loading control. Asterisk indicates degradation product. Red arrowheads indicate Lge1 constructs according to their predicted sizes. See SF2 for uncropped western blot. g. Gallery of representative images of bre1Δ lge1Δ cells expressing VC-Bre1 and Lge1-VN or Lge1 CC-VN. Nup188-mCherry marks the nuclear envelope. Scale bar, 2 μm. h. Live imaging of bre1Δ Ige1Δ cells expressing VC-Bre1 and the indicated Lge1-VN constructs from their endogenous promoters. Nup188-mCherry marks the nuclear envelope, dashed line the cell contour. Histograms represent pixel frequencies of fluorescence intensity values. Scale bar, 2 μm. i. Quantification of mean nuclear BiFC intensity in h and Fig. 3d. Median and interquartile range are indicated, n = number of cells. ***p-value < 0.001 determined by two-sided Mann-Whitney test, n.s., not significant.
Extended Data Figure 8. Lge1 IDR effects on global H2Bub, and additional ChIP-exo analyses.
a. Global levels of H2BK123 ubiquitination. A lge1Δ FLAG-H2B strain was transformed with plasmid-based variants of LGE-mCherry or an empty plasmid. Cell lysates were subjected to anti-FLAG immunoprecipitation and analyzed by SDS-PAGE and immunoblotting with anti-FLAG antibody. Different exposures of the H2Bub band are shown. See SF2 for uncropped western blots. Expression levels of the Lge1-mCherry constructs in cell extracts are shown in Extended Data Fig. 7f and Extended Data Fig. 10e. b. H2B (left) or H2BK123ub (right) ChIP-exo tag 5’ ends were plotted relative to the +1 nucleosome of all genes for WT (grey trace) and the indicated Ige1 mutants (red traces). Sequencing tags were normalized across datasets to a 30 bp window centered in the nucleosome-free region of all genes, representing unbound background regions. The first three genic nucleosomes are labeled +1, +2 and +3. Two H2B peaks are observed per nucleosome position. H2BK123ub patterns are shown separately for Ribosomal protein genes, SAGA-, and TFIID-dominated genes. Analyses were performed as in Fig. 4a c. ChIP-exo analysis shows that Lge1 function is not compromised by the plasmid-based approach used in this study (upper panel). H2B (left) or H2BK123ub (right) occupancy in strains with plasmid-based expression of LGE1 under its endogenous promoter (grey trace) was compared to strains with LGE1 in its chromosomal context (blue trace). Analysis of ChIP-exo background using a non-specific IgG antibody (lower panel). H2BK123ub enrichment in a lge1Δbre1Δ strain (red trace) is reduced to background levels (IgG negative control, black trace). Analyses were performed as described in b.
Extended Data Figure 9. Enrichment of Lge1 along gene bodies coincides with establishment of H2Bub pattern.
a. TAP-tagging does not impair Lge1 function under the conditions tested (related to ChIP-exo in b). C- or N- terminally TAP tagged versions of LGE1 were transformed into lge1Δ cells and their growth was compared to an untagged BY4741 control strain. Lge1 proteins were expressed at similar levels. Cell lysates were analyzed by SDS-PAGE and immunoblotting with anti-Protein A antibody. Anti-Pgk1 serves as a loading control. See SF2 for uncropped western blots, b. Genome wide binding profiles of Lge1. Frequency distribution of 5’ tags of Lge1 ChIP-exo are mapped to the midpoint between gene transcript start (TSS) and end (TES) for RP, SAGA and TFIID gene classes. Each class was sorted by gene length, thus generating bell plots. Lge1 binding profiles in WT and bre1Δ backgrounds are depicted. Insertion of the TAP tag at the N- or C-terminus gave similar enrichment patterns. TAP tagged Reb1 and “No TAP tag” serve as positive (site-specific binding) and negative controls, respectively, c. Lge1 binding is tied to expression of the target gene and is largely independent of Bre1 (compare black and red traces). Composite plots of Lge1 enrichment at top and bottom 15% expressed genes35 are shown in the upper and lower panels, respectively. IgG negative control is depicted as a grey trace. ChIP-exo tag 5’ ends were mapped to the +1 nucleosome dyad (as defined by MNase H3 ChIP-seq). H2B occupancy is depicted as a filled light grey trace. +1, +2, +3 and +4 nucleosome positions are highlighted. The table represents the percentage of the members of each gene class included in the top and bottom 15%. d. Quantification of H2BK123ub density for the first three genic nucleosomes positions in various Lge1 mutants. Table depicts fold enrichment of H2BK123ub density (ChIP-exo H2BK123ub/H2B) at canonical nucleosome positions +1, +2, and +3 for the indicated mutants relative to WT. Data for two biological replicates are shown. BY4741 is a positive control and correlates with WT Lge1 strain. Ratios for each gene class are indicated, to directly compare with graphs shown in Fig. 4a and Extended Fig. 8b. e. Correlation between two biological replicates for H2B and H2BK123ub datasets are shown. ChIP-exo tag 5’ ends were binned in 500 bp intervals, and the coefficient of correlation between the two datasets calculated.
Extended Data Figure 10. Specific features of yeast Lge1 and human WAC contribute to H2BK123ub and cell viability.
a. The WAC and LAF1 IDRs promote LLPS. Phase-separation assay of recombinant 6His-Lge1 and the fusion constructs 6His-WAC(1-318)-Lge1 CC and 6His-LAF1(1-169)-Lge1 CC (both proteins 5 μM; buffer 20 mM Tris pH 7.5, 100 mM NaCl, 1 mM DTT, 20 °C). Scale bar, 10 μm. Protein inputs are shown on the right (black arrows), b. Quantification of condensate sizes (μm2) in a. n = number of condensates. Dot plot showing median and interquartile range. **p-value = 0.004, ****p-value < 0.0001 determined by two-sided Mann-Whitney test. c. A synthetic genetic approach was used to interrogate the functionality of Lge1 LLPS in vivo. Cells were inviable when LGE1 and HTZ1 were deleted, indicating a functional relationship. Double deletion strains harboring a wild-type LGE1 cover plasmid (URA marker) were co-transformed with the indicated plasmids (HIS marker). Growth was followed on SDC-HIS (loading control) and on SDC+5-fluoroorotic acid (5-FOA), which shuffles out the URA cover plasmid. Cells were spotted in 10-fold serial dilutions and incubated for two (SDC-HIS) or three days (5-FOA) at 30 °C. d. Live imaging of bre1Δ lge1Δ cells expressing mGFP-Bre1 and WAC(1-318)-Lge1 CC-mCherry or LAF1(1-169)-Lge1 CC-mCherry shows protein import into the nucleus. Dashed white line indicates the cell contour. Fluorescence intensity of mCherry construct was quantified across a line spanning the nucleus. For comparison, the FU value = 1 is marked with a horizontal dashed line, n = number of cells. FU, arbitrary fluorescence units. Scale bar, 2 μm. e. Cell lysates of strains in c and d were analyzed by SDS-PAGE and immunoblotting with anti-mCherry antibody. Anti-Pgk1 serves as a loading control, asterisks indicate degradation products. Red arrowheads indicate Lge1 constructs according to their predicted sizes, f. Live imaging of bre1Δ lge1Δcells expressing VC-Bre1 and WAC (1-318)- Lge1 CC-VN or LAF1(1-169)- Lge1 CC-VN constructs from LGE1 endogenous promoter. Arrowheads label nuclear BiFC puncta, Nup188-mCherry the nuclear envelope, dashed lines the cell contours. Histograms represent pixel frequency of fluorescent intensity values. Scale bar, 2 μm. g. Coefficient of variation (CV) of the fluorescence intensity distribution of BiFC signals in f and Fig. 3e. The higher the CV, the greater the heterogeneity of the BiFC signal. A propensity for LLPS is suggested by an increased CV of the WAC (1-318)- Lge1 CC-VN construct. Dot plot showing median and interquartile range.n= number of cells. **p-value = 0.0024, ***p-value < 0.001 determined by two-sided Mann-Whitney test. h. Expression levels of Lge1-mCherry constructs used in i. Cells lysates were analyzed by SDS-PAGE and immunoblotting with anti-mCherry antibody. Anti-Pgk1 serves as a loading control. Asterisk indicates degradation products. Red arrowhead indicates Lge1 constructs, i. Genetic interaction analysis, set up as in c with the indicated plasmids. See SF2 for uncropped gels and western blots.
Supplementary Material
Video S1. Lge1 condensates grow by fusion.
DIC imaging of 6His-Lge1 (5 μM) diluted in 20 mM Tris pH 7.5, 100 mM NaCl, 1 mM DTT. Protein solution was pipetted into a 16-well μ-slide chamber and incubated at 20 °C. Imaging was started after 15 min and images were taken every 2 sec for 2 min. Scale bar, 5 μm.
Video S2. Bre1 shell prevents Lge1 condensate fusion.
DIC imaging of 6His-Lge1 (1.5 μM) with Bre1 shell (1.5 μM). Proteins were mixed and treated as in Video S1. Scale bar, 5 μm.
Acknowledgements
We thank B. Zagrovic and A. Polyansky for critical insights into the multivalency of Lge1 LLPS and Lge1/WAC sequence analyses, O.R. Abdi for technical support and G. Warren and D. Gerlich for discussions. A.K. was funded in part by a NOMIS Pioneering Research Grant, L.D.G. by a L’Oréal-UNESCO-OeAW Austria Fellowship and A.R. by an OeAW DOC Fellowship. B.F.P. and C.M. were funded by the National Institutes of Health grant HG004160.
Footnotes
Declaration of interests
B.F.P. has a financial interest in Peconic, LLC, which utilizes the ChIP-exo technology implemented in this study and could potentially benefit from the outcomes of this research The remaining authors declare no competing interests.
Supplemental Information
Supplemental Information includes two videos, Supplemental Table (strains and plasmids), and two Supplemental Figures with uncropped gels and blots.
References
- 1.Fuchs G & Oren M Writing and reading H2B monoubiquitylation. Biochimica et biophysics acta 1839, 694–701, doi: 10.1016/j.bbagrm.2014.01.002 (2014). [DOI] [PubMed] [Google Scholar]
- 2.Banani SF, Lee HO, Hyman AA & Rosen MK Biomolecular condensates: organizers of cellular biochemistry. Nature reviews. Molecular cell biology 18, 285–298, doi: 10.1038/nrm.2017.7 (2017). [DOI] [PMC free article] [PubMed] [Google Scholar]
- 3.Batta K, Zhang Z, Yen K, Goffman DB & Pugh BF Genome-wide function of H2B ubiquitylation in promoter and genic regions. Genes & development 25, 2254–2265, doi: 10.1101/gad.177238.111 (2011). [DOI] [PMC free article] [PubMed] [Google Scholar]
- 4.Cucinotta CE, Young AN, Klucevsek KM & Arndt KM The Nucleosome Acidic Patch Regulates the H2B K123 Monoubiquitylation Cascade and Transcription Elongation in Saccharomyces cerevisiae. PLoS genetics 11, e1005420, doi: 10.1371/journal.pgen.1005420 (2015). [DOI] [PMC free article] [PubMed] [Google Scholar]
- 5.Gallego LD et al. Structural mechanism for the recognition and ubiquitination of a single nucleosome residue by Rad6-Bre1. Proceedings of the National Academy of Sciences of the United States of America 113, 10553–10558, doi: 10.1073/pnas.1606863113 (2016). [DOI] [PMC free article] [PubMed] [Google Scholar]
- 6.Hwang WW et al. A conserved RING finger protein required for histone H2B monoubiquitination and cell size control. Molecular cell 11, 261–266 (2003). [DOI] [PubMed] [Google Scholar]
- 7.Kim J et al. RAD6-Mediated transcription-coupled H2B ubiquitylation directly stimulates H3K4 methylation in human cells. Cell 137, 459–471, doi: 10.1016/j.cell.2009.02.027 (2009). [DOI] [PMC free article] [PubMed] [Google Scholar]
- 8.Wood A et al. Bre1, an E3 ubiquitin ligase required for recruitment and substrate selection of Rad6 at a promoter. Molecular cell 11, 267–274 (2003). [DOI] [PubMed] [Google Scholar]
- 9.Van Oss SB et al. The Histone Modification Domain of Paf1 Complex Subunit Rtf1 Directly Stimulates H2B Ubiquitylation through an Interaction with Rad6. Molecular cell 64, 815–825, doi: 10.1016/j.molcel.2016.10.008 (2016). [DOI] [PMC free article] [PubMed] [Google Scholar]
- 10.Zhang F & Yu X WAC, a functional partner of RNF20/40, regulates histone H2B ubiquitination and gene transcription. Molecular cell 41, 384–397, doi: 10.1016/j.molcel.2011.01.024 (2011). [DOI] [PMC free article] [PubMed] [Google Scholar]
- 11.Alberti S Phase separation in biology. Current biology : CB 27, R1097–R1102, doi: 10.1016/j.cub.2017.08.069 (2017). [DOI] [PubMed] [Google Scholar]
- 12.Shin Y & Brangwynne CP Liquid phase condensation in cell physiology and disease. Science 357, doi: 10.1126/science.aaf4382 (2017). [DOI] [PubMed] [Google Scholar]
- 13.Gibson BA et al. Organization of Chromatin by Intrinsic and Regulated Phase Separation. Cell 179, 470–484 e421, doi: 10.1016/j.cell.2019.08.037 (2019). [DOI] [PMC free article] [PubMed] [Google Scholar]
- 14.Larson AG et al. Liquid droplet formation by HP1alpha suggests a role for phase separation in heterochromatin. Nature 547, 236–240, doi: 10.1038/nature22822 (2017). [DOI] [PMC free article] [PubMed] [Google Scholar]
- 15.Boija A et al. Transcription Factors Activate Genes through the Phase-Separation Capacity of Their Activation Domains. Cell 175, 1842–1855 e1816, doi: 10.1016/j.cell.2018.10.042 (2018). [DOI] [PMC free article] [PubMed] [Google Scholar]
- 16.Cho WK et al. Mediator and RNA polymerase II clusters associate in transcription-dependent condensates. Science 361, 412–415, doi: 10.1126/science.aar4199 (2018). [DOI] [PMC free article] [PubMed] [Google Scholar]
- 17.Chong S et al. Imaging dynamic and selective low-complexity domain interactions that control gene transcription. Science 361, doi: 10.1126/science.aar2555 (2018). [DOI] [PMC free article] [PubMed] [Google Scholar]
- 18.Sabari BR et al. Coactivator condensation at super-enhancers links phase separation and gene control. Science 361, doi: 10.1126/science.aar3958 (2018). [DOI] [PMC free article] [PubMed] [Google Scholar]
- 19.Turco E, Gallego LD, Schneider M & Kohler A Monoubiquitination of histone H2B is intrinsic to the Bre1 RING domain-Rad6 interaction and augmented by a second Rad6-binding site on Bre1. The Journal of biological chemistry 290, 5298–5310, doi: 10.1074/jbc.M114.626788 (2015). [DOI] [PMC free article] [PubMed] [Google Scholar]
- 20.Wei MT et al. Phase behaviour of disordered proteins underlying low density and high permeability of liquid organelles. Nature chemistry 9, 1118–1125, doi: 10.1038/nchem.2803 (2017). [DOI] [PMC free article] [PubMed] [Google Scholar]
- 21.Wang J et al. A Molecular Grammar Governing the Driving Forces for Phase Separation of Prion-like RNA Binding Proteins. Cell 174, 688–699 e616, doi: 10.1016/j.cell.2018.06.006 (2018). [DOI] [PMC free article] [PubMed] [Google Scholar]
- 22.Rossi MJ, Lai WKM & Pugh BF Simplified ChIP-exo assays. Nature communications 9, 2842, doi: 10.1038/s41467-018-05265-7 (2018). [DOI] [PMC free article] [PubMed] [Google Scholar]
- 23.Huisinga KL & Pugh BF A genome-wide housekeeping role for TFIID and a highly regulated stress-related role for SAGA in Saccharomyces cerevisiae. Molecular cell 13, 573–585 (2004). [DOI] [PubMed] [Google Scholar]
- 24.Reja R, Vinayachandran V, Ghosh S & Pugh BF Molecular mechanisms of ribosomal protein gene coregulation. Genes & development 29, 1942–1954, doi: 10.1101/gad.268896.115 (2015). [DOI] [PMC free article] [PubMed] [Google Scholar]
- 25.Elbaum-Garfinkle S et al. The disordered P granule protein LAF-1 drives phase separation into droplets with tunable viscosity and dynamics. Proceedings of the National Academy of Sciences of the United States of America 112, 7189–7194, doi: 10.1073/pnas.1504822112 (2015). [DOI] [PMC free article] [PubMed] [Google Scholar]
- 26.Lai WKM & Pugh BF Understanding nucleosome dynamics and their links to gene expression and DNA replication. Nature reviews. Molecular cell biology 18, 548–562, doi: 10.1038/nrm.2017.47 (2017). [DOI] [PMC free article] [PubMed] [Google Scholar]
- 27.DeSanto C et al. WAC loss-of-function mutations cause a recognisable syndrome characterised by dysmorphic features, developmental delay and hypotonia and recapitulate 10p11.23 microdeletion syndrome. Journal of medical genetics 52, 754–761, doi: 10.1136/jmedgenet-2015-103069 (2015). [DOI] [PubMed] [Google Scholar]
- 28.Vinayachandran V et al. Widespread and precise reprogramming of yeast protein-genome interactions in response to heat shock. Genome research, doi: 10.1101/gr.226761.117 (2018). [DOI] [PMC free article] [PubMed] [Google Scholar]
- 29.Turco E, Gallego LD, Schneider M & Kohler A Monoubiquitination of histone H2B is intrinsic to the Bre1 RING domain-Rad6 interaction and augmented by a second Rad6-binding site on Bre1. The Journal of biological chemistry 290, 5298–5310, doi: 10.1074/jbc.M114.626788 (2015). [DOI] [PMC free article] [PubMed] [Google Scholar]
- 30.Van Oss SB et al. The Histone Modification Domain of Paf1 Complex Subunit Rtf1 Directly Stimulates H2B Ubiquitylation through an Interaction with Rad6. Molecular cell 64, 815–825, doi: 10.1016/j.molcel.2016.10.008 (2016). [DOI] [PMC free article] [PubMed] [Google Scholar]
- 31.Rossi MJ, Lai WKM & Pugh BF Simplified ChIP-exo assays. Nature communications 9, 2842, doi: 10.1038/s41467-018-05265-7 (2018). [DOI] [PMC free article] [PubMed] [Google Scholar]
- 32.Bartonek L & Zagrovic B VOLPES: an interactive web-based tool for visualizing and comparing physicochemical properties of biological sequences. Nucleic acids research, doi: 10.1093/nar/gkz407 (2019). [DOI] [PMC free article] [PubMed] [Google Scholar]
- 33.DeSanto C et al. WAC loss-of-function mutations cause a recognisable syndrome characterised by dysmorphic features, developmental delay and hypotonia and recapitulate 10p11.23 microdeletion syndrome. Journal of medical genetics 52, 754–761, doi: 10.1136/jmedgenet-2015-103069 (2015). [DOI] [PubMed] [Google Scholar]
- 34.Armstrong JK, Wenby RB, Meiselman HJ & Fisher TC The hydrodynamic radii of macromolecules and their effect on red blood cell aggregation. Biophysical journal 87, 4259–4270, doi: 10.1529/biophysj.104.047746 (2004). [DOI] [PMC free article] [PubMed] [Google Scholar]
- 35.Yassour M et al. Ab initio construction of a eukaryotic transcriptome by massively parallel mRNA sequencing. Proceedings of the National Academy of Sciences of the United States of America 106, 3264–3269, doi: 10.1073/pnas.0812841106 (2009). [DOI] [PMC free article] [PubMed] [Google Scholar]
Associated Data
This section collects any data citations, data availability statements, or supplementary materials included in this article.
Supplementary Materials
Video S1. Lge1 condensates grow by fusion.
DIC imaging of 6His-Lge1 (5 μM) diluted in 20 mM Tris pH 7.5, 100 mM NaCl, 1 mM DTT. Protein solution was pipetted into a 16-well μ-slide chamber and incubated at 20 °C. Imaging was started after 15 min and images were taken every 2 sec for 2 min. Scale bar, 5 μm.
Video S2. Bre1 shell prevents Lge1 condensate fusion.
DIC imaging of 6His-Lge1 (1.5 μM) with Bre1 shell (1.5 μM). Proteins were mixed and treated as in Video S1. Scale bar, 5 μm.
Data Availability Statement
ChIP-exo sequencing files can be accessed at NCBI Gene Expression Omnibus (https://www.ncbi.nlm.nih.gov/geo/) with the accession number GSE131639. Data analysis softwares, scripts and parameters used to analyze ChIP-exo datasets can be accessed in detail via https://github.com/CEGRcode/Gallego_2019 All source data (i.e. uncropped gels and western blots) associated with the paper are provided in Supplementary Fig. 1 and Supplementary Fig. 2.


