

SUMMARY
The M2-1 protein of human respiratory syncytial virus (HRSV) is a transcription anti-terminator that regulates the processivity of the HRSV RNA-dependent RNA polymerase (RdRP). Here, we report a crystal structure of HRSV M2-1 bound to a short positive-sense gene-end RNA (SH7) at 2.7 Å resolution. We identified multiple critical residues of M2-1 involved in RNA interaction and examined their roles using mutagenesis and MicroScale Thermophoresis (MST) assay. We found that hydrophobic residue Phe23 is indispensable for M2-1 to recognize the base of RNA. We also captured spontaneous binding of RNA (SH7) to M2-1 in all-atom simulations using a robust Gaussian accelerated molecular dynamics (GaMD) method. Both experiments and simulations revealed that the interactions of RNA with two separate domains of M2-1, the zinc-binding domain (ZBD) and the core domain (CD), are independent of each other. Collectively, our results provided a structural basis for RNA recognition by HRSV M2-1.
In Brief
Gao et al. determined a 2.7-Å resolution crystal structure of human respiratory syncytial virus (HRSV) M2-1 protein in complex with a short positive-sense gene-end RNA. Gaussian accelerated molecular dynamics (GaMD) simulations captured spontaneous binding of RNA to M2-1. The results provided a structural basis for RNA recognition by M2-1.
Graphical Abstract
INTRODUCTION
Human respiratory syncytial virus (HRSV) is a significant human pathogen of non-segmented negative-sense (NNS) RNA viruses that include rabies and Ebola viruses (Bohmwald et al., 2016; Diez-Domingo et al., 2014; Nair et al., 2010; Shi et al., 2017). HRSV infection is the leading cause of severe lower track respiratory diseases in young children, older adults, and immunocompromised patients worldwide (Nair et al., 2010; Pneumonia Etiology Research for Child Health (PERCH) Study Group, 2019; Shi et al., 2017). The HRSV genome contains 10 genes (NS1, NS2, N, P, M, SH, G, F, M2, and L) that encode 11 proteins (Collins and Karron, 2013). All genes are transcribed, capped, and methylated by the RNA-dependent RNA polymerase (RdRP) into individual mRNAs (Collins et al., 2013; Fearns and Plemper, 2017; Noton and Fearns, 2015). The RdRP consists of a large protein (L) and a co-factor phosphoprotein (P) (Grosfeld et al., 1995; Mazumder and Barik, 1994; Munday et al., 2015). During transcription, the RdRP initiates at a single promoter in the 3′ leader region (Le) of the genome and terminates the mRNA transcription responding to the gene start (GS), and gene end (GE) signals (Dickens et al., 1984; Kuo et al., 1996). In HRSV, the GE is highly conserved with consensus sequence 3′-UCA(A/U)U(-/U/G) (A/U) (A/U) (U/A)UUUU-5′ (negative-sense, variable positions are in parentheses) and the corresponding mRNA-sense sequence is 5′-AGU(U/A)A(-/A/C) (U/A) (U/A) (A/U)AAAA-3′ (positive-sense) (Figure S1) (Collins and Karron, 2013). During replication, the same RdRP also replicates the entire genome, and the RdRP ignores these signals and synthesizes a full-length complementary antigenome (Collins et al., 2013; Noton and Fearns, 2015).
The M2 gene encodes two proteins, M2-1 and M2-2, both shown to regulate the RNA synthesis of the viral genome (Bermingham and Collins, 1999; Collins et al., 1996). M2-1 is one of the four essential components (L, P, N, and M2-1) required for the recovery and growth of the recombinant virus in cell culture (Collins et al., 1996). Primarily, M2-1 is an essential transcriptional anti-terminator for transcription of complete sets of viral mRNAs, and M2-1 prevents both intra- and inter-genic premature transcription by the RdRP (Collins et al., 1996; Cuesta et al., 2000; Fearns and Collins, 1999; Hardy et al., 1999; Hardy and Wertz, 1998; Sutherland et al., 2001). Recent evidence showed that M2-1 is colocalized with newly synthesized viral mRNA but not with viral genomic RNA and RdRP in cytoplasmic inclusion bodies-associated granules (Blondot et al., 2012; Bouillier et al., 2019; Kiss et al., 2014; Richard et al., 2018; Rincheval et al., 2017).
M2-1 is essential for the transcription processivity of HRSV and but not for a closely related human metapneumovirus (HMPV) (Afonso et al., 2016; Buchholz et al., 2005; Fearns and Collins, 1999). Both HRSV and HMPV belong to the Pneumoviridae family of NNS RNA viruses. The conservations are shown in the multiple sequence alignments of M2-1 from RSV (ORSV, BRSV, A2, and B1 strains of HRSV) and MPV (HMPV, and A, C, and D strains of AMPV) (Figure S2). Previous biochemical and crystallographic studies of apo HRSV M2-1 protein revealed that M2-1 is a tetramer in solution, and each M2-1 is composed of an N-terminal zinc-binding domain (ZBD), an oligomerization domain (OD), and a C-terminal core domain (CD) (Esperante et al., 2013; Tanner et al., 2014; Tran et al., 2009). The crystal structure of HMPV M2-1 showed an interesting asymmetric tetramer, with one protomer in the open state and three other protomers in the close state (Leyrat et al., 2014). Several biochemical and mutagenesis studies showed that the surface of CD is essential for the interactions with RNA oligos (preferentially recognizes poly(A)) and the interactions with the polymerase co-factor P protein (Blondot et al., 2012; Tanner et al., 2014). Those studies showed that M2-1 binds preferably to A-rich, mRNA-sense GE single-strand RNA sequences (Blondot et al., 2012; Tanner et al., 2014). Another study showed that the ZBD of HMPV has several critical residues that interact with DNA sequence AGTT (Leyrat et al., 2014). It was speculated that M2-1 likely binds to nascent mRNA transcripts, preventing premature termination through stabilization of the transcription complex, and inhibition of RNA secondary structure formation. It was also speculated that M2-1 could play a posttranscriptional role after binding to mRNAs (Reimers et al., 2005; Rincheval et al., 2017). Also, M2-1 is phosphorylated in vivo on serines 58 and 61, and the regulation of its phosphorylation state seems crucial for RNA binding (Cartee and Wertz, 2001). Despite all those advancements, understanding the mechanism of HRSV RNA recognition has been hampered by the lack of the structural basis of the M2-1 protein in the complex of RNA.
Here, we present a crystal structure of HRSV M2-1 bound to a 7-nucleotide (7-nt) positive-sense GE RNA (SH7) at 2.7 Å resolution. The crystal structure of M2-1:SH7 confirmed several conserved residues in two separate domains that were studied previously (Blondot et al., 2012; Esperante et al., 2013; Leyrat et al., 2014; Molina et al., 2018b; Muniyandi et al., 2018; Tanner et al., 2014; Tran et al., 2009), and also identified several previously unknown residues (such as Lys8, Phe9, His22, and Phe23) that are involved in the protein:RNA interactions. We further examined the roles of several critical residues responsible for the RNA recognition by M2-1 using mutagenesis and MicroScale Thermophoresis (MST) assays, guided by the structure. We also performed all-atom simulations on the binding of the SH7 RNA from the solution to the M2-1 tetramer using a robust Gaussian accelerated molecular dynamics (GaMD) method (Miao et al., 2015). The GaMD simulations allowed us to identify low-energy bound conformations of RNA on the surface of the ZBD and CD of the M2-1 protein, being consistent with the crystal structure. Collectively, our results provide a structural basis for RNA recognition by the HRSV M2-1 protein.
RESULTS
Overview of the Crystal Structure of the M2-1:SH7 Complex
We determined a crystal structure of the HRSV M2-1 in complex with SH7 RNA at 2.7 Å resolution (Figure 1). The SH7 RNA sequence is part of the positive-sense GE of the SH gene: 5′-AGUUAAU-3′. The HRSV M2-1:SH7 complex was crystallized with four M2-1 protomers A, B, C, and D (colored in blue, green, yellow, and cyan, respectively) in one tetramer and two 7-nt RNA, RNA1, and RNA2 (colored in red and orange, as a partial duplex) in each crystallographic asymmetric unit (Figure 1A). We obtained the initial phase using the apo HRSV M2-1 structure (PDB: 4C3B) (Tanner et al., 2014) as a search model by molecular replacement. We then built and refined the M2-1:SH7 structure using the 2Fo-Fc omitted map. We summarized the crystallographic data of the M2-1:SH7 complex in Table 1. An example of the electron density map for building the RNA was shown in Figure S3.
Figure 1. Crystal Structure of the HRSV M2-1:SH7 Complex.

(A) The front view (left panel) and side view (right panel) of the HRSV M2-1:SH7 complex. The M2-1 subunits A, B, C, and D are in blue, green, yellow, and cyan, respectively. The RNA1 and RNA2 oligos are in red and orange, respectively. The RNA interacting residues of M2-1 are in magenta. The Zn2+ ions are shown as gray spheres. The side view highlights the interactions between RNA and zinc-binding domain (ZBD) of M2-1 as shown in the dotted box; details in (B).
(B) The interactions between the RNA1 and M2-1. The RNA residues are colored in red. The A6 is flipped out to interact with the ZBD of M2-1. The RNA interacting residues of M2-1 are colored in magenta.
(C) The sequences of the SH7 RNA oligos RNA1 and RNA2 are the same: 5′-AGUUAAU-3′. The base-pairings are shown as dotted lines. The A6 of RNA1 and A1 of RNA2 that are recognized by Phe23 are highlighted in black dots. Detailed interactions in Figure 3.
(D) The cartoon representation of the M2-1:SH7 complex structure; front view in (A). M2-1 tetramers are shown as a light blue circle. RNA1 and RNA2 are shown as the red and orange lines.
Table 1.
Data Collection and Refinement Statistics
| Data Collection | |
| Space group | P 41 21 2 |
| Cell dimensions | |
| a, b, c (Å) | 94.75, 94.75, 199.63 |
| α, β, γ (°) | 90.00, 90.00, 90.00 |
| Resolution (Å) | 94.75–2.70 (2.85–2.70) |
| Unique reflections | 25,630 (2,512) |
| Completeness (%) | 99.57 (99.60) |
| Rpim (all I+ and I−) | 0.027 (0.390) |
| I/σ(I) | 13.3 (2.1) |
| Multiplicity | 24.3 (26.0) |
| Wilson B factor | 89.50 |
| Refinement | |
| Refinement resolution (Å) | 63.52–2.703 (2.8–2.703) |
| Reflections used in refinement | 25,591 (2,502) |
| Reflections used for Rfree | 1,279 (124) |
| Rwork | 0.2265 (0.3078) |
| Rfree | 0.2889 (0.3902) |
| No. of non-hydrogen atoms | 5,329 |
| Macromolecules | 5,311 |
| Ligands | 4 |
| Solvent | 14 |
| Ramachandran statistics (%) | |
| Favored | 94.70 |
| Allowed | 5.30 |
| Outliers | 0.00 |
| Root-mean-square deviations | |
| Bond lengths (Å) | 0.017 |
| Bond angles (°) | 1.51 |
| Clashscore | 11.09 |
| Average B factor | 95.15 |
| Macromolecules | 95.21 |
| Ligands | 99.23 |
| Solvent | 70.53 |
X-ray diffraction data of M2-1:SH7. Values in parentheses are for the highest-resolution shell. The Rfree test dataset is 5% of the total reflections randomly chosen and excluded from the refinement.
As expected, M2-1 are tetramers in solution with no alternative oligomer formation. Within the tetramer, the M2-1 protomers interact with one another through a series of hydrogen bonds, as shown in apo HRSV and HMPV M2-1 structures (Leyrat et al., 2014; Tanner et al., 2014). The M2-1 tetramer in the M2-1:SH7 complex aligns well with the M2-1 tetramer in the apo form (Tanner et al., 2014) and the M2-1:P90-110 complex (Selvaraj et al., 2018), with the root-mean-square deviation (RMSD) less than 0.7 and 0.9 Å, respectively. This indicated no significant conformational changes of the M2-1 protomer upon binding to RNA (Figure S4A).
Interestingly, one nucleotide A (A6) flips out from the main fold of RNA (A5 and A7) and forms base stacking interactions with Phe23 and hydrogen bonds with Cys7, Lys8, and Phe9 in the ZBD of the M2-1 protomer A (highlighted in Figure 1B). The structure also shows that the base stacking residue (Phe23) forms a hydrogen bond toward the 2′ OH group of the RNA ribose, where the same 2′ O position is lacking in DNA. Those interactions suggested the ZBD of M2-1 explicitly recognizes the nucleobase of RNA. However, we could not exclude the possibility of recognition of other nucleotides, such as G, C, or U. Those highlighted interactions may favor the interaction with A, but may not be limited to A.
Another interesting feature is that SH7 RNA1 pairs partially with another SH7 RNA2 as a duplex in the structure (sequence and interaction sites are shown in Figure 1C). Previous studies indicated that M2-1 had a low affinity for double-strand RNA (Blondot et al., 2012; Tanner et al., 2014), suggesting that the base-pairing part of the RNA might be due to the crystallography packing. Despite this, the interactions observed between RNA and M2-1 were the non-pairing parts of the duplex, and the interacting residues in the ZBD of M2-1 agreed with previous biochemical studies (Blondot et al., 2012; Tanner et al., 2014).
Finally, we showed a simplified cartoon representation of the structure of the M2-1:SH7 complex (Figure 1D). Although SH7 RNAs formed a partial duplex, it is worth noting that only the nucleotide A from non-paired regions of the RNA partial duplex interacted with the ZBD of M2-1. We speculate that a single nucleotide A is not sufficient to be recognized by M2-1, and additional residues and restraints (i.e., a longer length of RNA) may be necessary for M2-1 to gain high specificity.
Nucleotide Selectivity by the ZBD of M2-1
The comparison of M2-1 protomers, in particular, the protomer that interacts with RNA and the protomer of the protein alone, did not reveal significant conformational changes. For example, the superimposition of the protomer (A) of M2-1:SH7 to that of apo M2-1 (Tanner et al., 2014) and M2-1:P90-110 (Selvaraj et al., 2018) revealed that both RMSDs were less than 0.5 Å (Figure S4B). In most ribonucleoprotein complex, the solvent-accessible surface shows a positive charge electrostatic distribution for regions that are responsible for the protein:RNA contacts. In contrast, the structure of M2-1:SH7 revealed that the RNA interaction surface of ZBD is not dominant by the positive charge electrostatic interactions (Figure S5A).
Strikingly, the interaction residues identified in this study agreed well with those from previous studies through the comparison of the HMPV M2-1 in a complex of AMP and a short DNA oligo (5′ AGTT) (Leyrat et al., 2014). For AMP, superimposition of the HMPV M2-1:AMP with HRSV M2-1:SH7 revealed that the adenine base (yellow) in HMPV M2-1:AMP interacts with the ZBD through the stacking interactions with Lys8 and Phe23 and further hydrogen bonding with Cys7 (Figure 2A). The adenine base in HMPV M2-1:AMP sits almost at the same location as that of the adenine base of A6 (red) of RNA1 in HRSV M2-1:SH7. For the short DNA, superimposition of the HMPV M2-1:DNA with HRSV M2-1:SH7 revealed that the T3 (yellow) of the DNA oligo is the stacking base with Phe23. Again, the base of T3 locates at the adenine base of A6 (red) of RNA1 in HRSV M2-1:SH7 (Figure 2B). Additional interactions are also found on this surface and the composite surface between the ZBD and CD. The comparison suggested the stacking efforts are critical to recognize the A base of RNA.
Figure 2. Interactions between the ZBD of M2-1 and RNA.

(A) Superimposition of the HRSV M2-1:SH7 (this work, PDB: 6PZQ) with HMPV M2-1:AMP (PDB: 4CS9). The color scheme of M2-1:SH7 is the same as in Figure 1. The HMPV M2-1 and the AMP are shown in gray and yellow, respectively.
(B) Superimposition of the HRSV M2-1:SH7 (this work, PDB: 6PZQ) with HMPV M2-1:DNA (PDB: 4CSA). The color scheme of M2-1:SH7 is the same as in Figure 1. The HMPV M2-1 and the DNA are shown in gray and yellow, respectively.
(C) The sequence alignments of M2-1 from RSV and MPV. The conservation is highlighted in the degree of blue color, with the most conservation in dark blue. The interaction residues identified in the crystal structure are highlighted in black dots.
(D) The RNA binding analysis of the WT and mutants of M2-1 by MST assay. The proteins used in MST assays are shown in Figure S6, and the representative MST assays are shown in Figure S7. The binding affinities for WT (gray bar) and mutants (blue bars) are shown as μM. The dotted line is the level of WT.
Together, these data support a model that hydrophobic residues (i.e., Phe9 and Phe23) of the ZBD make critical contributions to RNA recognition. In the M2-1:SH7 structure, several conserved hydrophobic residues, such as Phe9 and Phe23 of ZBD, formed previously unrecognized stacking interactions with the bases of RNA (Figure 1B). Hydrogen bonds were observed between RNAs as well as between RNA and the side chains of M2-1. Additional protein:RNA electrostatic interactions between the positively charged residues, such as Arg and Lys; the van der Waals contacts between non-charged residues were also observed.
Additional Evidence of the RNA Recognition by the ZBD
Although there is only one protomer of M2-1 interacting with RNA in the crystal structure, we noticed extra electron densities for the other three protomers near residue Phe23 of M2-1. Based on the above comparison of HMPV M2-1 with AMP and short DNA (Figure 2), we modeled AMPs near two of the protomers (C and D), and the electron densities are shown in Figure S3.
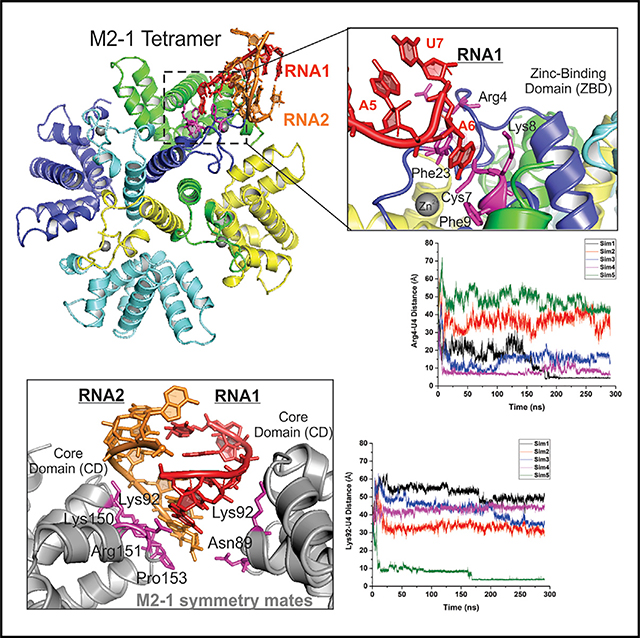
There are even more electron densities near the third protomer (B) of M2-1. To further understand the potential protein:RNA interactions, we displayed an adjacent asymmetric unit within 4 Å of the original structure. We immediately found that RNA2 interacts with M2-1 tetramer 2 (symmetry mate, gray), and RNA2′ (the equivalent of RNA2 in original tetramer, orange) interacts with the ZBD of original M2-1. Due to the symmetry, we used RNA1 and RNA2′ as examples to simplify the explanation. The A6 base of RNA1 forms hydrogen bonds with residues Cys7 and Lys8, and forms base stacking with Phe23 of the M2-1 protomer (A) (Figure 3B, panel 4). The A1 base of RNA2′ forms van der Waals and stacking with the residue Phe23, and A1, G2, and U3 of RNA2′ form hydrogen bonds with residues Arg4, Asn5, and Lys8 of the M2-1 protomer (D) (Figure 3B, panel 3). By symmetry, M2-1 shows similar interactions with RNA1′ and RNA2′ (Figure 3B, panels 1 and 2).
Figure 3. Interactions between RNAs and the ZBDs of Two M2-1 Tetramers.

(A) The front view (left panel) and side view (right panel) of the M2-1:SH7 and its symmetry mate. The color scheme of the M2-1 tetramer 1 is the same as in Figure 1. The M2-1 tetramer 2 (symmetry mate) is colored in gray. RNA1 (RNA1′, symmetry mate) and RNA2 (RNA2′, symmetry mate) are colored in red and orange, respectively. The RNA interacting residues of M2-1 are in magenta. The side view shows that the angle between the main axes of two tetramers is 110°.
(B) The interactions between RNA and the zinc-binding domain (ZBD) of M2-1. Four interaction regions are highlighted in boxes 1, 2, 3, and 4. The color schemes are the same as in Figure 1. The zoom-in views of RNA interactions with ZBD (A, boxes 1–4). The RNA interaction residues (within 3.5 Å) of M2-1 are colored in magenta and labeled with residue numbers.
(C) The cartoon representation of the M2-1:SH7 and its symmetry mate. M2-1 tetramers 1 and 2 are shown as light blue and gray circles, respectively. RNA1/1′ and RNA2/2′ are shown as red and orange lines, respectively.
Given the asymmetric electron densities near Phe23 of M2-1 protomers, we envision this as one M2-1 tetramer recognizes a single poly(A) RNA. We used more RNA than M2-1 (molar ratio of M2-1:RNA is 1:1.2) for crystallization. In theory, if one tetramer recognizes four poly(A) RNAs, or more than one (two or three) poly(A) RNA(s) at a time, it would quickly exhaust all the RNA oligos and unlikely yield a homogeneous protein:RNA complexes. Furthermore, we checked the electron maps throughout the M2-1 surface but could not find other noticeable densities, suggesting that the observed recognition efforts on the Phe23 is site-specific.
RNA Interacts with the CD of M2-1 through Phosphate Backbones
As noted above, previous data suggested that the positively charged CD of M2-1 interacted with RNA and P competitively (Blondot et al., 2012; Tanner et al., 2014; Tran et al., 2009). Next, we examined such interactions in the new co-crystal structure. We displayed the M2-1 in adjacent asymmetric units (tetramer 3 and 4, gray) within 4 Å of the original structure, which shows that the CD of M2-1 interacts with the phosphate backbone of RNA (Figures 4A and 4B). We identified the residues in the CD of M2-1 that interact with RNA. For example, the side chains of Lys92, Lys150, Arg151, and Lys154 of the M2-1 tetramer 3 (M2-1 tetramer 1 equivalent) form direct contacts with the phosphate backbone of RNA2 (Figure 4A, inset). The side chain of Asn89 and Lys92 of M2-1 tetramer 4 (M2-1 tetramer 2 equivalent) forms direct contacts with the phosphate backbone of RNA1 (Figure 4B, inset).
Figure 4. Interactions between RNAs and the CD of M2-1 Tetramers.

(A) The top view of M2-1 tetramers 3 and 4 (its symmetry mates) that interact with RNA through the CD. The M2-1 tetramer 1 and RNAs are the same as in Figure 1. The M2-1 tetramers 3 and 4 are colored in gray. The protein:RNA interactions between RNAs and the CD of M2-1 tetramers. The zoom-in views of RNA interactions with CD of M2-1 (insert). The RNA interaction residues (within 3.5 Å) of M2-1 are colored in magenta and labeled with residue numbers.
(B) The side view of M2-1 tetramers 3 and 4 (its symmetry mates) that interact with RNA through the CD. The color scheme is the same as in (A). For clarity, the M2-1 tetramer 1 is omitted.
(C) The sequence alignments of CD of M2-1 from RSV and MPV. The conservation is highlighted in the degree of the blue color, most conservation with dark blue. The interaction residues identified in the crystal structure are highlighted in black dots.
(D) The analysis of RNA binding to the WT (gray bar) and mutants (orange bars) of M2-1 by MST assays. The proteins used in MST assays are shown in Figure S6, and the representative MST assays are shown in Figure S7. The binding affinities are shown as μM. The dotted line is the level of WT.
In summary, two protomers of the M2-1 tetramers interact with the bases of RNA through ZBD, and the other two protomers of M2-1 tetramers interact with the phosphate backbone of the RNA through CD. Therefore, we speculate that ZBD specifically recognizes RNA, and CD interactions with RNA are independent of nucleotide sequences. Collectively, the interactions in the M2-1:SH7 complex suggest that M2-1 interacts with RNA in both RNA sequence-independent and RNA sequence-dependent manners.
Mutagenesis Analysis of the RNA Interaction Residues
Previous studies identified several conserved regions that bind RNA (Blondot et al., 2012; Esperante et al., 2013; Molina et al., 2018b; Tanner et al., 2014; Tran et al., 2009). For example, one study indicated the ZBD is crucial for RNA interactions (Esperante et al., 2013), and another study suggested the CD is critical for RNA binding (Tran et al., 2009). Our crystal structure reveals that RNA interacts with both ZBD and CD, such as residues Arg4, Asn5, Cys7, Lys8, Phe9, and Phe23 for ZBD; Lys92, Lys150, Arg151, and Lys154 for CD.
To examine the roles of RNA interaction residues observed in our crystal structure, we performed mutagenesis studies on selected residues. We prepared and purified the wild-type (WT) and mutants of M2-1. The representative size-exclusion chromatography and the SDS-PAGE gels are shown in Figure S6. We used MST assays to assess the importance of conserved residues in RNA recognition further. Due to length restraint, we tested the binding affinities of 13-nt SH RNA (5′-AGUUAAUUAAAAA-3′), which has been studied previously (Tanner et al., 2014), to WT and mutants of M2-1. To increase the sensitivity and prevent the interference with the RNA binding, we used the Cy5-labeled SH RNA positive-sense RNA, and a representative MST trace, data, and fitting are shown in Figure S7.
The MST results reveal that WT M2-1 shows the highest affinity (Kd = 0.87 μM) with RNA. As expected, most M2-1 mutants have reduced binding affinity to RNA compared with the WT M2-1, as shown in Table S1. Mutations of residues Lys150Ala (1.11 μM) and Arg151Asp (1.21 μM) are comparable with that of WT; Arg4Ala (1.76 μM), His22Ala (1.59 μM), and Thr91Asp (1.72 μM) has reduced the affinity by 2-fold; Phe9Ala (5.69 μM) and Lys92Ala (5.17 μM) have more reducing effects by a factor of 6-fold. The mutation of Cys7Ala leads to the largest decrease of the affinity to (8.56 μM), which is likely due to the disruption of the Zn2+ binding motif Cys(3)-His(1) and cause the misfold of the ZBD (Esperante et al., 2013; Hardy and Wertz, 2000). In the crystal structure, Phe23 of M2-1 stacks with the adenine (A) base of SH7, and we hypothesized that Phe23 plays a crucial role in recognizing RNA. We did multiple mutageneses of Phe23, and we successfully obtained Phe23Trp. Surprisingly, Phe23Ala and Phe23Ser did not express at all. If the stacking efforts are essential, we predict that Phe23Trp would boost the binding affinity of M2-1 to RNA. As a result, the mutant M2-1 containing Phe23Trp has an increased binding affinity (0.71 μM) compared with that of WT. Similarly, Phe9Tyr has a slight increase in the binding affinity (0.81 μM) (Figures 2C and 4C). These results are consistent with critical intermolecular contacts between M2-1 and RNA observed in M2-1:SH7 structure and previous biochemical data (Blondot et al., 2012; Esperante et al., 2013; Hardy and Wertz, 2000; Molina et al., 2018b; Tanner et al., 2014). Collectively, these results suggest that residues Arg4, Thr91, Lys150, and Arg151 cause limited perturbations to the binding of M2-1, whereas Phe9, Phe23, and Lys92 are essential for M2-1 interacting with RNA.
We also tested the importance of the stacking interactions in RNA binding. MST-based RNA binding assays revealed that Phe9Ala mutation leads to a 6-fold reduction of the RNA binding. Phe9Tyr shows slightly better binding to RNA, suggesting that additional hydrogen bonds might form for OH group. Phe23 is facing the base of the RNA. Collectively, these results reveal limited structural changes in the main chain. Therefore, the observed reduced RNA binding is likely due to the loss of intermolecular contacts between the side chains of critical residues and the base or phosphate backbones of RNA.
GaMD Simulations Captured Spontaneous Binding of RNA to the M2-1 Protein
Binding of the seven-nucleotide SH7 RNA to the M2-1 protein was investigated through all-atom GaMD simulations. As summarized in Table 2, the GaMD boost potential was 16.93 ± 4.50 kcal/mol. All five simulations were combined for structural clustering of the diffusing RNA using the hierarchical agglomerative algorithm with CPPTRAJ (Roe and Cheatham, 2013). The top 5 clusters were obtained to identify the most probable binding conformations of the RNA on the protein. RNA binding to the ZBD of M2-1 (Figure 5A; Video S1) was the first ranked cluster and binding to the CD (Figure 5B; Video S2) as the second ranked cluster, which were in good agreement with the crystal structure.
Table 2.
Summary of GaMD Simulations Performed to Capture Binding of RNA to the M2-1 Protein
| System | Natomsa | ID | Length (ns) | ΔVavgb (kcal/mol) | σΔVc (kcal/mol) |
|---|---|---|---|---|---|
| M21 + RNA | 187013 | Sim1 | 300 | 16.80 | 4.49 |
| Sim2 | 300 | 16.88 | 4.49 | ||
| Sim3 | 300 | 17.13 | 4.53 | ||
| Sim4 | 300 | 16.86 | 4.49 | ||
| Sim5 | 300 | 16.98 | 4.51 |
Natoms is the number of atoms in the system.
ΔVavg is the average of GaMD boost potential.
σΔV is the standard deviation of GaMD boost potential.
Figure 5. Gaussian Accelerated Molecular Dynamics (GaMD) Simulations of the M2-1:SH7 Interactions.

(A) Binding of RNA (magenta) to the ZBD of the M2-1 protein (blue ribbons) with the interacting protein residues highlighted in magenta sticks.
(B) Binding of RNA (red) to the CD of the M2-1 protein (green ribbons) with the interacting protein residues highlighted in magenta sticks.
(C) Time courses of the distance between the CZ atom of M2-1 residue Arg4 in the ZBD and a P atom of the RNA base U-4 in five GaMD simulations.
(D) Time courses of the distance between the NZ atom of M2-1 residue Lys92 in the CD and a P atom of the RNA base U-4 in five GaMD simulations.
(E) 2D potential mean force (PMF) free energy profiles of the RNA radius of gyration (Rg) and the distance between protein residue Arg4 and RNA base U4. Low-energy Unbound and Bound states of the RNA on the surface of the M2-1 ZBD domain were labeled.
(F) 2D PMF free energy profiles of the RNA Rg and the distance between protein residue Lys92 and RNA base U4. Low-energy Unbound and Bound states of the RNA on the surface of the M2-1 CD were labeled.
The two structural clusters of RNA were further analyzed to identify important interactions between the M2-1 and RNA. During GaMD simulations, residues Lys8 and His22 in the M2-1 ZBD-formed hydrogen bonds with RNA bases U7 and A5, respectively. More importantly, residue Arg4 in the M2-1 ZBD formed a salt bridge with the phosphate backbone of RNA base U4 as shown in Figure 5C. In the M2-1 CD, a salt bridge was formed between protein residue Lys92 and the phosphate backbone of RNA base U4 (Figure 5D). Another salt bridge was formed between residue Lys150 in the M2-1 CD and the RNA base A5 (Figure 5B). Despite differences in the RNA binding pose, RNA interactions with protein residues Arg4, Lys92, and Lys150 captured in the GaMD simulations were similarly observed in the X-ray crystal structure (Figures 3 and 4).
In addition, all GaMD simulations were combined for free energy calculations using the PyReweighting toolkit (Miao et al., 2014). The protein-RNA distance and RNA radius of gyration was used as the reaction coordinates. Low-energy conformational states were identified from the GaMD reweighted free energy profiles (Figures 5E and 5F). For RNA binding to the M2-1 ZBD, the distance between charge centers of Arg4 (CZ) and U4 (P) at the free energy minimum was ~5 Å (Figure 5E). For RNA binding to the M2-1 CD, the distance between charge centers of Lys92 (NZ) and U4 (P) at the free energy minimum was ~3 Å (Figure 5F). Overall, the simulation predicted low-energy conformations of the M2-1:SH7 correlated with the X-ray crystal structure.
The Interactions of M2-1 to RNA and P
Previous studies suggested that M2-1 binds to RNA and P protein in a competitive manner (Blondot et al., 2012; Tran et al., 2009). A recent crystal structure of M2-1:P90-110 reveals the interface between M2-1 and P90-110 (Selvaraj et al., 2018). Notably, most regions of M2-1 responsible for RNA interaction (same color scheme as Figure 1, RNA in red and orange) in this study do not overlap with the main regions essential for P interaction in M2-1:P90-110 (M2-1 in gray, and P90-110 in pink, PDB: 6G0Y). The interacting residues of M2-1 to P90-110 are Arg126, Thr130, Tyr134, Ser137, Gln144, Arg151, Pro153, Thr160, and Asn163. Among those, the overlapping residue is Arg151, which also shown to interact with RNA (Figures 6A and 6C), and this agrees with the competitive binding by a previous biochemical study (Blondot et al., 2012).MST results showed that Arg151Asp does not change much of the binding affinity of RNA to M2-1, 1.21 μM, compared with 0.87 μM of WT (Figure 4C). To better illustrate the relative locations of P90-110 respective to two RNA interactions regions (ZBD and CD), an M2-1 tetramer and the interfaces of two M2-1 tetramers are shown in Figures 6B and 6D, respectively.
Figure 6. Structural Superimposition of M2-1:SH7 and M2-1:P90-110.

The color schemes of M2-1:SH7 are the same as in Figure 1. The M2-1 and P90-110 of the M2-1:P90-110 complex are colored in gray and pink, respectively.
(A) Comparison of the locations of RNA and P fragments with the M2-1 ZBD superimposed. The protein residues interacting with RNA are highlighted in magenta and those with P90-110 in light blue.
(B) Comparison of the locations of the four P fragments and RNA oligos with the M2-1 tetramer superimposed.
(C) Comparison of the locations of RNA and P fragments with the M2-1 CD superimposed. The protein residues interacting with RNA are highlighted in magenta and those with P90-110 in light blue.
(D) Overview of the locations of RNA and P fragments relative to the CD of two M2-1 tetramers.
The comparison clearly shows that the RNA interaction sites are primarily different from the P interaction sites, suggesting that these two interactions may occur at the same time. The fact that residue Arg151 is involved in interacting with both RNA and P90-110, the M2-1 binding of RNA or P protein affects one another. However, the minimal effects of Arg151 mutant examined by mutagenesis suggest that the competition effects may be less than previously thought (Tran et al., 2009).
Also, the tetramer N-terminal face forms a large and continuous surface of positive charge, whereas the C-terminal face also shows a vast positive charge separated by four tracts of negative charge (Figure S5). The positively charged tetramer surface areas would favor electrostatic interactions with the negatively charged binding partners, either the RNA phosphate backbone or the P protein.
DISCUSSION
Previous studies showed that SH GE RNA has a relatively high binding affinity o the M2-1 compared with other RNAs, and thus we chose SH7 for this study (Blondot et al., 2012; Tanner et al., 2014). We also tested different lengths of SH GE RNAs and tried poly(A) sequences of different lengths (e.g., poly5A, poly6A, poly7A, and poly13A), but the crystallization trials were not successful.
In summary, RNA recognition by HRSV M2-1 is more complicated than we initially thought. The combination of structural and biochemical studies described here provides strong evidence of the mechanism of how M2-1 recognizes and interacts with RNA. In brief, M2-1 has two distinct RNA binding domains, ZBD and CD. ZBD is responsible for the specific binding, such as the GE RNA sequence, while CD recognizes the phosphate chain of RNA. Further inspections of the interaction interface, ZBD of M2-1 does not show a large positive charged surface but instead shows significant stacking effects with M2-1 that are important for RNA recognition. In contrast, the CD near the RNA binding sites show extensive positive charged surface electrostatics, suggesting that the side chains of these regions may be responsible for the RNA binding. Interestingly, our study is consistent with a recent study that showed both the ZBD (Arg3 and Arg4) and CD (Lys92-Val97, Leu149-Leu152, and Asp155-Lys159) of M2-1 interact with RNA (Molina et al., 2018a).
Analysis of M2-1 WT and mutants by MST supports that the aromatic residues in the ZBD of M2-1 are critical for the RNA stacking (i.e., Phe9 and Phe23), and the positively charged residues in the CD of M2-1 are essential for RNA interaction (i.e., Lys92, Lys150, and Arg151). For example, only two mutations Phe9Tyr and Phe23Trp have increased affinities to M2-1. For Phe9Tyr, it is likely due to the extra -OH group that may stabilize the interactions with RNA. For Phe23Trp, with enhanced hydrophobic interactions with RNA, it is likely to introduce favorable interactions for A stacking and increase the RNA binding affinity. All other mutations cause the decreases of the affinities, especially the residues in the CD of M2-1. Interestingly, mutations of Phe23Ala and Phe23Ser do not express at all in cells, suggesting Phe23 is critical to the integrity and proper folding of M2-1.
The mutations of selected residues within ZBD and CD are unlikely to cause significant structural changes. The crystal structure of M2-1:SH7 shows minor structural perturbations in the main chain compared with the apo M2-1. Therefore, it was not immediately evident why mutations (i.e., Lys92Ala) lead to a substantial degree loss of binding compared with other residues (Lys150Ala or Arg151Asp) in the same patch only lead to a slight degree loss of binding. Note that the complex structure shows that Lys92 of both M2-1 tetramers interacts with RNA, but only Lys150 and Arg151 of one M2-1 tetramer interacts with RNA. The critical role of Lys92 may be partially due to the interactions with multiple M2-1 tetramers.
GaMD simulations confirmed the interactions of the RNA (SH7) to the two distinct RNA binding domains of the M2-1 protein—the ZBD and CD. Note that GaMD simulation predicted binding conformations of the RNA were not exactly the same as the X-ray crystal structure. Low-energy conformational states of RNA bound to the M2-1 protein were identified from the 2D free energy profiles calculated from GaMD simulations. Detailed analysis of the bound conformations of RNA to the M2-1 protein revealed key interactions that facilitate RNA recognition and binding to the M2-1 protein. Upon binding to the protein ZBD, RNA made contacts with residues Arg4, Asn5, Lys8, His22, and Phe23 in the M2-1 protein. Notably, protein residue Arg4 formed a stable salt bridge with the phosphate backbone of RNA base U4. With binding to the protein CD, RNA made contacts with residues Lys92, Lys150, Arg151, Pro153, and A154 in the M2-1 protein. Protein residues Lys92 and Lys150 formed stable salt bridges with RNA bases U4 and A5, respectively. Therefore, the GaMD simulation findings were consistent with the X-ray crystallographic results and provided additional dynamic information and mechanistic insights into the RNA binding process (Videos S1 and S2).
Collectively, these new crystallographic and dynamics simulations, as well as previously published results, support a model that ZBD of M2-1 is responsible for A base recognition, while the CD of M2-1 is responsible for stabilizing the RNA backbone. The dual roles of RNA recognition and interactions identified in the structure enable an in-depth understanding of the mechanism of how M2-1 interacts with RNA. Therefore, M2-1 interactions with P and RNA and the oligomeric states are critical to facilitate RSV transcription regulation and maybe in a posttranscriptional function.
STAR★METHODS
EXPERIMENTAL MODEL AND SUBJECT DETAILS
Bacterial Strains
The bacterial strains used in this study are listed in the Key Resources Table. The growth and maintenance of the bacterial cells are according to the manufacturer’s manual and described in the Method Details.
KEY RESOURCES TABLE.
| REAGENT or RESOURCE | SOURCE | IDENTIFIER |
|---|---|---|
| Bacterial and Virus Strains | ||
| Escherichia coli TOP10 | Thermo Fisher Scientific | N/A |
| Escherichia coli BL21 Star (DE3) | Thermo Fisher Scientific | N/A |
| Chemicals, Peptides, and Recombinant Proteins | ||
| M2-1 of human respiratory syncytial virus (HRSV) strain A2 | This Paper | UniProtKB/Swiss-Prot: P04545.1 |
| M2-1 Mutants of human respiratory syncytial virus (HRSV) | This Paper | Figure S6 |
| Critical Commercial Assays | ||
| MicroScale Thermophoresis (MST) assay | NanoTemper | Model# Monolith NT.115 |
| QuikChange II Site-Directed Mutagenesis | Agilent | Cat# 200523 |
| Deposited Data | ||
| Crystal structure of HRSV M2-1 bound to a 7-nucleotide (7-nt) positive-sense GE RNA (SH7) (generated in the study) | This Paper | PDB: 6PZQ |
| Crystal structure of apo HRSV M2-1 (used in the study) | Leyrat et al., 2014 | PDB: 4C3B |
| Crystal structure of M2-1:P90-110 (used in the study) | Selvaraj et al., 2018 | PDB: 6G0Y |
| Crystal structure of HMPV M2-1:AMP (used in the study) | Leyrat et al., 2014 | PDB: 4CS9 |
| Crystal structure of HMPV M2-1:DNA (used in the study) | Leyrat et al., 2014 | PDB: 4CSA |
| Oligonucleotides | ||
| 7-nucleotide (7-nt) positive-sense GE RNA (SH7): 5’-AGUUAAU-3’ | This Paper | N/A |
| Recombinant DNA | ||
| Primers for mutagenesis studies of M2-1 proteins, see Table S2 | This paper | N/A |
| Software and Algorithms | ||
| HKL2000 | Otwinowski and Minor, 1997 | https://hkl-xray.com/ |
| PHENIX | Echols et al., 2012 | https://www.phenix-online.org/ |
| COOT | Emsley and Cowtan, 2004 | https://www2.mrc-lmb.cam.ac.uk/personal/pemsley/coot/ |
| PyMOL | Rigsby and Parker, 2016 | https://pymol.org/ |
| MUSCLE | Madeira et al., 2019 | https://www.ebi.ac.uk/Tools/msa/muscle/ |
| JalView | Waterhouse et al., 2009 | https://www.jalview.org/ |
| CHARMM-GUI | Jo et al., 2008 | http://www.charmm-gui.org |
| GaMD | Miao et al., 2015 | http://miao.compbio.ku.edu/GaMD/ |
| AMBER18 | Case et al., 2018 | https://ambermd.org |
| CPPTRAJ | Roe and Cheatham, 2013 | https://amber-md.github.io/cpptraj/CPPTRAJ.xhtml |
| PyReweighting | Miao et al., 2014 | http://miao.compbio.ku.edu/PyReweighting/ |
METHOD DETAILS
Protein Expression and Purification
A DNA representing of the M2-1ORF (HRSV strain A2) was inserted into vector pLICv1_His6-tev-yORF to allow expression of M2-1 fused at its N terminus to 6*His-GFP. M2-1 was separated by the TEV protease cleavage sequence to allow the removal of the tags. The E. coli BL21(DE3) cells were grown at 37°C until an OD600 of 0.8 was reached, after which expression was induced by the addition of 0.5mM IPTG. Cells were maintained at 16°C overnight and pelleted by centrifugation. The cells were then resuspended in the high salt lysis buffer (50 mM sodium phosphate, pH7.4; 500mM NaCl; 5 mM Imidazole, pH7.4; 10% Glycerol; 0.2% NP-40). The cells were disrupted by sonication 15min (3s ON, 3s OFF, 60% amplitude) on ice water in the high salt lysis Buffer. After lysate centrifugation at 16,000 RPM during 40min at 4°C, protein from the soluble fraction was loaded on a cobalt column, washed with 10 volumes of high salt lysis buffer, 10 volumes high salt wash buffer (50 mM sodium phosphate, pH7.4; 1.5 M NaCl; 5 mM Imidazole, pH7.4; 10% Glycerol) and elute with 5 volumes of Elution buffer (50 mM sodium phosphate, pH7.4; 500 mM NaCl; 250 mM Imidazole, pH7.4; 10% Glycerol). The eluted protein was cleavage with TEV protease in a 20:1 w/w ratio overnight at room temperature in the dialysis buffer (25 mM Tris-HCl, pH8.0; 300 mM NaCl; 10% Glycerol; 1 mM DTT) resulting in an almost complete cleavage. The protein was then exchanged into the buffer (50mM MES pH 6.0; 150 mM NaCl; 5% Glycerol) and loaded onto a HiTrap Heparin HP column (GE Healthcare) for further purification using a step-wise NaCl gradient. Finally, M2-1 was gel-filtrated using a Superdex 200 column (GE Healthcare) equilibrated with buffer (50mM HEPES, pH7.5; 200 mM NaCl; 5% Glycerol), The 260/280 nm absorbance ratio was measured to be around one at the end of the purification indicating no presence of nucleic acid. Single-point mutations were introduced in using DpnI-dependent QuikChange site-directed mutagenesis method (Agilent). The sequence of each construct was confirmed by DNA sequencing (Eurofins Genomics).
Crystallization of the M2-1:SH7 Complex
The RNA oligo SH7 used for crystallography studies in this study were selected from the positive-sense gene-end RNA sequences (Figure S1). The M2-1 protein was concentrated to ~10mg/ml and mixed with SH7 RNA with the ratio 1:1.2 for crystallization. The vapor diffusion sitting drop crystallization trials were used to set up in 96-well Intelli plates with a phoenix robot. Multiple commercial and lab-made crystallization screen kits have been used for screening.
Data Collection and Structure Solution
High diffraction quality crystals of the M2-1:SH7 were obtained after one week in mother liquor containing 0.2 M magnesium chloride hexahydrate, 0.1 M Tris pH 8.5, 25% w/v polyethylene glycol 3,350. The crystals were frozen in liquid nitrogen, and diffraction data up to 2.7 Å were recorded at the Southeast Regional Collaborative Access Team (SER-CAT) 22-ID beamline line. The M2-1:RNA complex was crystallized in P41212 space group, with a cell dimension of a = 94.620Å, b = 94.620Å, c = 198.680Å, α = 90.00°, β = 90.00°, γ = 90.00°. Data were integrated and scaled using the program HKL2000 (Otwinowski and Minor, 1997). The initial phase was determined by molecular replacement in PHENIX (Echols et al., 2012) followed by iterative rounds of the manual building in COOT (Emsley and Cowtan, 2004). The refinement was performed in PHENIX, and no NCS averaging was used in the refinement.
Microscale Thermophoresis (MST) Assay
Microscale thermophoresis (MST) (Mueller et al., 2017) was conducted using an NT.115 MST instrument (NanoTemper) equipped with red and blue filter sets. A range of concentrations of M2-1 (1.5nM~50 uM) was incubated with 20 nM Cy5 labeled SH-GE positive-sense RNA in MST buffer for 5min before taking measurements. The MST buffer was purchase through NanoTemper. The samples were loaded into the NanoTemper Technologies glass capillaries, and MST measurements were carried out using a 20% excitation power and 40% MST power, the dissociation constants (Kd) were determined using the mass action equation via the NanoTemper Technologies software from triplicate experiments and reported as ± SEM.
Gaussian Accelerated Molecular Dynamics (GaMD)
GaMD is an unconstrained enhanced sampling approach that works by adding a harmonic boost potential to smooth the potential energy surface of biomolecules to reduce the system energy barriers(Miao et al., 2015). The added harmonic boost potential follows a Gaussian distribution. Free energy profiles of biomolecules are obtained by reweighting of GaMD simulations for quantitative characterization of biomolecular pathways such as protein-ligand binding, protein folding, protein-nucleic interactions, and protein-protein interactions(Miao et al., 2015; Miao and McCammon, 2016, 2017; Palermo et al., 2017; Pang et al., 2017). Low-energy conformations of biomolecules can be identified from the reweighted free energy profiles (Hamelberg et al., 2004; Shen and Hamelberg, 2008). Without the requirement of carefully selected predefined collective variables, GaMD is advantageous to study unrestrained biomolecular binding pathways and interactions.
A brief description of the method is provided here: Consider a system with N atoms at positions . When the potential of the system is less than an energy cut-off E, the boost potential of the system is added as follows:
| (Equation 1) |
| (Equation 2) |
where k is the harmonic force constant. The two adjustable parameters E and k are automatically determined by the application of three enhanced sampling principles. First, for any two arbitrary potential values and found on the original energy surface, if , ΔV should be a monotonic function that does not change the relative order of the biased potential values, i.e., . Second, if , the potential difference observed on the smoothened energy surface should be smaller than that of the original, i.e., . By combining the first two criteria and plugging in the formula of and ΔV, we obtain:
| (Equation 3) |
where Vmin and Vmax are the system minimum and maximum potential energies, respectively. To ensure that Equation 3 is valid, k has to satisfy: . Let us define , then 0<k0≤1. Third, the standard deviation (SD) of ΔV needs to be small enough (i.e., narrow distribution) to ensure accurate reweighting using cumulant expansion to the second order: σΔV = k(E – Vavg)σV≤σ0, where Vavg and σV are the average and SD of ΔV with σ0 as a user-specified upper limit (e.g., 10kBT) for accurate reweighting. When E is set to the lower bound E = Vmax according to Equation 3, k0 can be calculated as:
| (Equation 4) |
Alternatively, when the threshold energy E is set to its upper bound , k0 is set to:
| (Equation 5) |
if is calculated between 0 and 1. Otherwise, k0 is calculated using Equation 4.
Energetic Reweighting of GaMD Simulations
For energetic reweighting of GaMD simulations to calculate potential mean force (PMF), the probability distribution along a reaction coordinate is written as p*(A). Given the boost potential ΔV(r) of each frame, p*(A) can be reweighted to recover the canonical ensemble distribution p(A), as:
| (Equation 6) |
where M is the number of bins, β = kBT and is the ensemble-averaged Boltzmann factor of ΔV(r) for simulation frames found in the jth bin. The ensemble-averaged reweighting factor can be approximated using cumulant expansion:
| (Equation 7) |
where the first two cumulants are given by
| (Equation 8) |
The boost potential obtained from GaMD simulations usually follows near-Gaussian distribution (Miao and McCammon, 2017). Cumulant expansion to the second-order thus provides a good approximation for computing the reweighting factor (Miao et al., 2014, 2015). The reweighted free energy F(A) = _ kBTlnp(A) is calculated as
| (Equation 9) |
where F*(A) = − kBTlnp*(A) is the modified free energy obtained from GaMD simulation and Fc is a constant.
Simulation System Setup
The X-ray structure of M2-1 protein with RNA (PDB ID: 6PZQ [9]) was used to set up the system for simulations. A seven-nucleotide RNA structure (AGUUAAU) was placed >20 Å away from the protein. CHARMM-GUI (Brooks et al., 2009; Jo et al., 2008; Lee et al., 2016) was used to solvate the system in the explicit solvent. The system was further neutralized in 0.15MNaCl at 310 K temperature. The CHARMM36 (Vanommeslaeghe et al., 2010) parameter set was used for the protein and RNA, and TIP3P (Jorgensen et al., 1983) for water molecules. The CHARMM-GUI output files were downloaded for performing GaMD simulations using AMBER 18. The GaMD simulations are summarized in Table 2.
Simulation Protocol
Input files for initial energy minimization, equilibration, and conventional molecular dynamics (cMD) were given in the output by the CHARMM-GUI web server. They were used for preparing the system for GaMD simulations. The system was energy minimized using the steepest-descent algorithm for 5000 steps at a constant number, volume, and temperature (NVT). The system was then equilibrated for 25 ps at 303.15 K at a constant number, pressure, and temperature (NPT). The system was then simulated using cMD for 10 ns at 303.15 K and 1atm pressure. To prepare the system for GaMD simulations, GaMD equilibration was performed for 20 ns, followed by five independent 300 ns dual-boost GaMD production runs as listed in Table 2. Simulation frames were saved every 0.1 ps in each production run (i.e., a total number of 3 × 10⁶ frames) for analysis.
Figure Preparation
All the figures representing model and electron density maps were generated using PyMOL (Rigsby and Parker, 2016) and COOT (Emsley and Cowtan, 2004). Sequence alignments were performed using MUSCLE (Madeira et al., 2019) and displayed using JalView (Waterhouse et al., 2009).
Replication
All the MicroScale Thermophoresis (MST) measurements have been performed at least three times for each wild-type (WT) and mutant M2-1 proteins. Gaussian accelerated molecular dynamics (GaMD) simulations have been carried out five independent runs.
Strategy for Randomization and/or Stratification
This has been described among the Method Details in “Simulation Protocol” and “Simulation Analysis”.
Blinding at Any Stage of the Study
Not applicable in this study.
Sample-Size Estimation and Statistical Method of Computation
This has been described among the Method Details in “Simulation Protocol” and “Simulation Analysis”.
Inclusion and Exclusion Criteria of Any Data or Subjects
This has been described among the Method Details in “Simulation Protocol” and “Simulation Analysis”.
QUANTIFICATION AND STATISTICAL ANALYSIS
Simulation Analysis
Simulation analysis was carried out using CPPTRAJ(Roe and Cheatham, 2013). The hierarchical agglomerative clustering algorithm was used to cluster snapshots of the diffusing RNA with all five production GaMD simulations combined. The top-ranked structural clusters were identified as the most probable binding conformations of the RNA on the protein surface. Distances between the RNA and protein residues and the radius of gyration (Rg) of RNA were calculated as reaction coordinates. The PyReweighting toolkit (Miao et al., 2014) was applied to reweight GaMD simulations. A bin size of 1.5Å and a cutoff of 500 frames in one bin were used to calculate 2D free energy profiles of the RNA Rg and RNA-protein distances. All GaMD simulation trajectories were combined for the free energy calculations (Figure 5). The average and standard deviation of GaMD boost potential were calculated for a number of 3 × 10⁶ frames in each GaMD trajectory (Table 2).
RESOURCE AVAILABILITY
Lead Contact
Further information and requests for resources and reagents should be directed to and will be fulfilled by the Lead Contact, Bo Liang (bo.liang@emory.edu).
Materials Availability
This study did not generate new unique reagents.
Data and Code Availability
The atomic coordinates and structure factors for the reported crystal structure generated during this study is available at the Protein DataBank with accession code 6PZQ.
Supplementary Material
Highlights.
HRSV M2-1 is a transcription anti-terminator regulating polymerase processivity
Hydrophobic residue Phe23 is indispensable for M2-1 to recognize the base of RNA
Zinc-binding domain (ZBD) and core domain (CD) of M2-1 independently interact RNA
Dynamic binding of RNA to similar domains of M2-1 is observed in GaMD simulations
ACKNOWLEDGMENTS
The crystallographic data were collected at the Southeast Regional Collaborative Access Team (SER-CAT) 22-ID beamline at the Advanced Photon Source, Argonne National Laboratory, which was supported by the United States Department of Energy, Office of Science, Office of Basic Energy Sciences, under contract W-31-109-Eng-38. B.L. was supported by NIGMS R01GM130950 and the Start-Up Fund from Emory University School of Medicine. Y.M. was supported by the startup funding in the College of Liberal Arts and Sciences at the University of Kansas. We want to thank Dr. Karen Kirby for the MST training and Dr. Stefan Sarafianos to allow us to use the MST instrument. We want to thank the members of the Liang group at Emory University School of Medicine for performing the experimental studies, including the crystallographic, mutagenesis, and MST assays, and the members of the Miao group at the University of Kansas for computational simulations.
Footnotes
DECLARATION OF INTERESTS
The authors declare no competing interests.
REFERENCES
- Afonso CL, Amarasinghe GK, Banyai K, Bao Y, Basler CF, Bavari S, Bejerman N, Blasdell KR, Briand FX, Briese T, et al. (2016). Taxonomy of the order mononegavirales: update 2016. Arch. Virol 161, 2351–2360. [DOI] [PMC free article] [PubMed] [Google Scholar]
- Bermingham A, and Collins PL (1999). The M2–2 protein of human respiratory syncytial virus is a regulatory factor involved in the balance between RNA replication and transcription. Proc. Natl. Acad. Sci. U S A 96, 11259–11264. [DOI] [PMC free article] [PubMed] [Google Scholar]
- Blondot ML, Dubosclard V, Fix J, Lassoued S, Aumont-Nicaise M, Bontems F, Eleouet JF, and Sizun C (2012). Structure and functional analysis of the RNA- and viral phosphoprotein-binding domain of respiratory syncytial virus M2-1 protein. PLoS Pathog. 8, e1002734. [DOI] [PMC free article] [PubMed] [Google Scholar]
- Bohmwald K, Espinoza JA, Rey-Jurado E, Gomez RS, Gonzalez PA, Bueno SM, Riedel CA, and Kalergis AM (2016). Human respiratory syncytial virus: infection and pathology. Semin. Respir. Crit. Care Med 37, 522–537. [DOI] [PMC free article] [PubMed] [Google Scholar]
- Bouillier C, Cosentino G, Leger T, Rincheval V, Richard CA, Desquesnes A, Sitterlin D, Blouquit-Laye S, Eleouet JF, Gault E, et al. (2019). The interactome analysis of the respiratory syncytial virus protein M2-1 suggests a new role in viral mRNA metabolism post-transcription. Sci. Rep 9, 15258. [DOI] [PMC free article] [PubMed] [Google Scholar]
- Brooks BR, Brooks CL 3rd, Mackerell AD Jr., Nilsson L, Petrella RJ, Roux B, Won Y, Archontis G, Bartels C, Boresch S, et al. (2009). CHARMM: the biomolecular simulation program. J. Comput. Chem 30, 1545–1614. [DOI] [PMC free article] [PubMed] [Google Scholar]
- Buchholz UJ, Biacchesi S, Pham QN, Tran KC, Yang L, Luongo CL, Skiadopoulos MH, Murphy BR, and Collins PL (2005). Deletion of M2 gene open reading frames 1 and 2 of human metapneumovirus: effects on RNA synthesis, attenuation, and immunogenicity. J. Virol 79, 6588–6597. [DOI] [PMC free article] [PubMed] [Google Scholar]
- Cartee TL, and Wertz GW (2001). Respiratory syncytial virus M2-1 protein requires phosphorylation for efficient function and binds viral RNA during infection. J. Virol 75, 12188–12197. [DOI] [PMC free article] [PubMed] [Google Scholar]
- Collins PL, and Karron RA (2013). Respiratory syncytial virus and metapneumovirus In Fields Virology, Sixth Edition (Wolters Kluwer Health Adis (ESP)). [Google Scholar]
- Collins PL, Hill MG, Cristina J, and Grosfeld H (1996). Transcription elongation factor of respiratory syncytial virus, a nonsegmented negative-strand RNA virus. Proc. Natl. Acad. Sci. U S A 93, 81–85. [DOI] [PMC free article] [PubMed] [Google Scholar]
- Collins PL, Fearns R, and Graham BS (2013). Respiratory syncytial virus: virology, reverse genetics, and pathogenesis of disease. Curr. Top. Microbiol. Immunol 372, 3–38. [DOI] [PMC free article] [PubMed] [Google Scholar]
- Cuesta I, Geng X, Asenjo A, and Villanueva N (2000). Structural phosphoprotein M2-1 of the human respiratory syncytial virus is an RNA binding protein. J. Virol 74, 9858–9867. [DOI] [PMC free article] [PubMed] [Google Scholar]
- Dickens LE, Collins PL, and Wertz GW (1984). Transcriptional mapping of human respiratory syncytial virus. J. Virol 52, 364–369. [DOI] [PMC free article] [PubMed] [Google Scholar]
- Diez-Domingo J, Perez-Yarza EG, Melero JA, Sanchez-Luna M, Aguilar MD, Blasco AJ, Alfaro N, and Lazaro P (2014). Social, economic, and health impact of the respiratory syncytial virus: a systematic search. BMC Infect. Dis 14, 544. [DOI] [PMC free article] [PubMed] [Google Scholar]
- Echols N, Grosse-Kunstleve RW, Afonine PV, Bunkoczi G, Chen VB, Headd JJ, McCoy AJ, Moriarty NW, Read RJ, Richardson DC, et al. (2012). Graphical tools for macromolecular crystallography in PHENIX. J. Appl. Crystallogr 45, 581–586. [DOI] [PMC free article] [PubMed] [Google Scholar]
- Emsley P, and Cowtan K (2004). Coot: model-building tools for molecular graphics. Acta Crystallogr. D Biol. Crystallogr 60, 2126–2132. [DOI] [PubMed] [Google Scholar]
- Esperante SA, Noval MG, Altieri TA, de Oliveira GA, Silva JL, and de Prat-Gay G (2013). Fine modulation of the respiratory syncytial virus M2-1 protein quaternary structure by reversible zinc removal from its Cys(3)-His(1) motif. Biochemistry 52, 6779–6789. [DOI] [PubMed] [Google Scholar]
- Fearns R, and Collins PL (1999). Role of the M2-1 transcription antitermination protein of respiratory syncytial virus in sequential transcription. J. Virol 73, 5852–5864. [DOI] [PMC free article] [PubMed] [Google Scholar]
- Fearns R, and Plemper RK (2017). Polymerases of paramyxoviruses and pneumoviruses. Virus Res. 234, 87–102. [DOI] [PMC free article] [PubMed] [Google Scholar]
- Grosfeld H, Hill MG, and Collins PL (1995). RNA replication by respiratory syncytial virus (RSV) is directed by the N, P, and L proteins; transcription also occurs under these conditions but requires RSV superinfection for efficient synthesis of full-length mRNA. J. Virol 69, 5677–5686. [DOI] [PMC free article] [PubMed] [Google Scholar]
- Hamelberg D, Mongan J, and McCammon JA (2004). Accelerated molecular dynamics: a promising and efficient simulation method for biomolecules. J. Chem. Phys 120, 11919–11929. [DOI] [PubMed] [Google Scholar]
- Hardy RW, Harmon SB, and Wertz GW (1999). Diverse gene junctions of respiratory syncytial virus modulate the efficiency of transcription termination and respond differently to M2-mediated antitermination. J. Virol 73, 170–176. [DOI] [PMC free article] [PubMed] [Google Scholar]
- Hardy RW, and Wertz GW (1998). The product of the respiratory syncytial virus M2 gene ORF1 enhances readthrough of intergenic junctions during viral transcription. J. Virol 72, 520–526. [DOI] [PMC free article] [PubMed] [Google Scholar]
- Hardy RW, and Wertz GW (2000). The Cys(3)-His(1) motif of the respiratory syncytial virus M2-1 protein is essential for protein function. J. Virol 74, 5880–5885. [DOI] [PMC free article] [PubMed] [Google Scholar]
- Jo S, Kim T, Iyer VG, and Im W (2008). CHARMM-GUI: a web-based graphical user interface for CHARMM. J. Comput. Chem 29, 1859–1865. [DOI] [PubMed] [Google Scholar]
- Jorgensen WL, Chandrasekhar J, Madura JD, Impey RW, and Klein ML (1983). Comparison of simple potential functions for simulating liquid water. J. Chem. Phys 79, 926–935. [Google Scholar]
- Kiss G, Holl JM, Williams GM, Alonas E, Vanover D, Lifland AW, Gudheti M, Guerrero-Ferreira RC, Nair V, Yi H, et al. (2014). Structural analysis of respiratory syncytial virus reveals the position of M2-1 between the matrix protein and the ribonucleoprotein complex. J. Virol 88, 7602–7617. [DOI] [PMC free article] [PubMed] [Google Scholar]
- Kuo L, Grosfeld H, Cristina J, Hill MG, and Collins PL (1996). Effects of mutations in the gene-start and gene-end sequence motifs on transcription of monocistronic and dicistronic minigenomes of respiratory syncytial virus. J. Virol 70, 6892–6901. [DOI] [PMC free article] [PubMed] [Google Scholar]
- Lee J, Cheng X, Swails JM, Yeom MS, Eastman PK, Lemkul JA, Wei S, Buckner J, Jeong JC, Qi Y, et al. (2016). CHARMM-GUI input generator for NAMD, GROMACS, AMBER, OpenMM, and CHARMM/OpenMM simulations using the CHARMM36 additive force field. J. Chem. Theory Comput 12, 405–413. [DOI] [PMC free article] [PubMed] [Google Scholar]
- Leyrat C, Renner M, Harlos K, Huiskonen JT, and Grimes JM (2014). Drastic changes in conformational dynamics of the antiterminator M2-1 regulate transcription efficiency in Pneumovirinae. eLife 3, e02674. [DOI] [PMC free article] [PubMed] [Google Scholar]
- Madeira F, Park YM, Lee J, Buso N, Gur T, Madhusoodanan N, Basutkar P, Tivey ARN, Potter SC, Finn RD, et al. (2019). The EMBL-EBI search and sequence analysis tools APIs in 2019. Nucleic Acids Res. 47, W636–W641. [DOI] [PMC free article] [PubMed] [Google Scholar]
- Mazumder B, and Barik S (1994). Requirement of casein kinase II-mediated phosphorylation for the transcriptional activity of human respiratory syncytial viral phosphoprotein P: transdominant negative phenotype of phosphorylation-defective P mutants. Virology 205, 104–111. [DOI] [PubMed] [Google Scholar]
- Miao Y, Feher VA, and McCammon JA (2015). Gaussian accelerated molecular dynamics: unconstrained enhanced sampling and free energy calculation. J. Chem. Theory Comput 11, 3584–3595. [DOI] [PMC free article] [PubMed] [Google Scholar]
- Miao Y, and McCammon JA (2016). Graded activation and free energy landscapes of a muscarinic G-protein-coupled receptor. Proc. Natl. Acad. Sci. U S A 113, 12162–12167. [DOI] [PMC free article] [PubMed] [Google Scholar]
- Miao Y, and McCammon JA (2017). Gaussian accelerated molecular dynamics: theory, implementation, and applications. Annu. Rep. Comput. Chem 13, 231–278. [DOI] [PMC free article] [PubMed] [Google Scholar]
- Miao Y, Sinko W, Pierce L, Bucher D, Walker RC, and McCammon JA (2014). Improved reweighting of accelerated molecular dynamics simulations for free energy calculation. J. Chem. Theory Comput 10, 2677–2689. [DOI] [PMC free article] [PubMed] [Google Scholar]
- Molina IG, Esperante SA, Marino-Buslje C, Chemes LB, and de Prat-Gay G (2018a). Cooperative RNA recognition by a viral transcription antiterminator. J. Mol. Biol 430, 777–792. [DOI] [PubMed] [Google Scholar]
- Molina IG, Josts I, Almeida Hernandez Y, Esperante S, Salgueiro M, Garcia Alai MM, de Prat-Gay G, and Tidow H (2018b). Structure and stability of the human respiratory syncytial virus M2-1 RNA-binding core domain reveals a compact and cooperative folding unit. Acta Crystallogr. F Struct. Biol. Commun 74, 23–30. [DOI] [PMC free article] [PubMed] [Google Scholar]
- Mueller AM, Breitsprecher D, Duhr S, Baaske P, Schubert T, and Langst G (2017). MicroScale thermophoresis: a rapid and precise method to quantify protein-nucleic acid interactions in solution. Methods Mol. Biol 1654, 151–164. [DOI] [PubMed] [Google Scholar]
- Munday DC, Wu W, Smith N, Fix J, Noton SL, Galloux M, Touzelet O, Armstrong SD, Dawson JM, Aljabr W, et al. (2015). Interactome analysis of the human respiratory syncytial virus RNA polymerase complex identifies protein chaperones as important cofactors that promote L-protein stability and RNA synthesis. J. Virol 89, 917–930. [DOI] [PMC free article] [PubMed] [Google Scholar]
- Muniyandi S, Pangratiou G, Edwards TA, and Barr JN (2018). Structure and function of the human respiratory syncytial virus M2-1 protein. Subcell. Biochem 88, 245–260. [DOI] [PubMed] [Google Scholar]
- Nair H, Nokes DJ, Gessner BD, Dherani M, Madhi SA, Singleton RJ, O’Brien KL, Roca A, Wright PF, Bruce N, et al. (2010). Global burden of acute lower respiratory infections due to respiratory syncytial virus in young children: a systematic review and meta-analysis. Lancet 375, 1545–1555. [DOI] [PMC free article] [PubMed] [Google Scholar]
- Noton SL, and Fearns R (2015). Initiation and regulation of paramyxovirus transcription and replication. Virology 479–480, 545–554. [DOI] [PMC free article] [PubMed] [Google Scholar]
- Otwinowski Z, and Minor W (1997). Processing of X-ray diffraction data collected in oscillation mode. Methods Enzymol. 276, 307–326. [DOI] [PubMed] [Google Scholar]
- Palermo G, Miao Y, Walker RC, Jinek M, and McCammon JA (2017). CRISPR-Cas9 conformational activation as elucidated from enhanced molecular simulations. Proc. Natl. Acad. Sci. U S A 114, 7260–7265. [DOI] [PMC free article] [PubMed] [Google Scholar]
- Pang YT, Miao Y, Wang Y, and McCammon JA (2017). Gaussian accelerated molecular dynamics in NAMD. J. Chem. Theory Comput 13, 9–19. [DOI] [PMC free article] [PubMed] [Google Scholar]
- Pneumonia Etiology Research for Child Health (PERCH) Study Group (2019). Causes of severe pneumonia requiring hospital admission in children without HIV infection from Africa and Asia: the PERCH multi-country case-control study. Lancet 394, 757–779. [DOI] [PMC free article] [PubMed] [Google Scholar]
- Reimers K, Buchholz K, and Werchau H (2005). Respiratory syncytial virus M2-1 protein induces the activation of nuclear factor kappa B. Virology 331, 260–268. [DOI] [PubMed] [Google Scholar]
- Richard CA, Rincheval V, Lassoued S, Fix J, Cardone C, Esneau C, Nekhai S, Galloux M, Rameix-Welti MA, Sizun C, et al. (2018). RSV hijacks cellular protein phosphatase 1 to regulate M2-1 phosphorylation and viral transcription. PLoS Pathog. 14, e1006920. [DOI] [PMC free article] [PubMed] [Google Scholar]
- Rigsby RE, and Parker AB (2016). Using the PyMOL application to reinforce visual understanding of protein structure. Biochem. Mol. Biol. Educ 44, 433–437. [DOI] [PubMed] [Google Scholar]
- Rincheval V, Lelek M, Gault E, Bouillier C, Sitterlin D, Blouquit-Laye S, Galloux M, Zimmer C, Eleouet JF, and Rameix-Welti MA (2017). Functional organization of cytoplasmic inclusion bodies in cells infected by respiratory syncytial virus. Nat. Commun 8, 563. [DOI] [PMC free article] [PubMed] [Google Scholar]
- Roe DR, and Cheatham TE 3rd (2013). PTRAJ and CPPTRAJ: software for processing and analysis of molecular dynamics trajectory data. J. Chem. Theory Comput 9, 3084–3095. [DOI] [PubMed] [Google Scholar]
- Selvaraj M, Yegambaram K, Todd E, Richard CA, Dods RL, Pangratiou GM, Trinh CH, Moul SL, Murphy JC, Mankouri J, et al. (2018). The structure of the human respiratory syncytial virus M2-1 protein bound to the interaction domain of the phosphoprotein P defines the orientation of the complex. mBio 9, e01554–18. [DOI] [PMC free article] [PubMed] [Google Scholar]
- Shen T, and Hamelberg D (2008). A statistical analysis of the precision of reweighting-based simulations. J. Chem. Phys 129, 034103. [DOI] [PubMed] [Google Scholar]
- Shi T, McAllister DA, O’Brien KL, Simoes EAF, Madhi SA, Gessner BD, Polack FP, Balsells E, Acacio S, Aguayo C, et al. (2017). Global, regional, and national disease burden estimates of acute lower respiratory infections due to respiratory syncytial virus in young children in 2015: a systematic review and modelling study. Lancet 390, 946–958. [DOI] [PMC free article] [PubMed] [Google Scholar]
- Sutherland KA, Collins PL, and Peeples ME (2001). Synergistic effects of gene-end signal mutations and the M2-1 protein on transcription termination by respiratory syncytial virus. Virology 288, 295–307. [DOI] [PubMed] [Google Scholar]
- Tanner SJ, Ariza A, Richard CA, Kyle HF, Dods RL, Blondot ML, Wu W, Trincao J, Trinh CH, Hiscox JA, et al. (2014). Crystal structure of the essential transcription antiterminator M2-1 protein of human respiratory syncytial virus and implications of its phosphorylation. Proc. Natl. Acad. Sci. U S A 111, 1580–1585. [DOI] [PMC free article] [PubMed] [Google Scholar]
- Tran TL, Castagne N, Dubosclard V, Noinville S, Koch E, Moudjou M, Henry C, Bernard J, Yeo RP, and Eleouet JF (2009). The respiratory syncytial virus M2-1 protein forms tetramers and interacts with RNA and P in a competitive manner. J. Virol 83, 6363–6374. [DOI] [PMC free article] [PubMed] [Google Scholar]
- Vanommeslaeghe K, Hatcher E, Acharya C, Kundu S, Zhong S, Shim J, Darian E, Guvench O, Lopes P, Vorobyov I, et al. (2010). CHARMM general force field: a force field for drug-like molecules compatible with the CHARMM all-atom additive biological force fields. J. Comput. Chem 31, 671–690. [DOI] [PMC free article] [PubMed] [Google Scholar]
- Waterhouse AM, Procter JB, Martin DM, Clamp M, and Barton GJ (2009). Jalview version 2—a multiple sequence alignment editor and analysis workbench. Bioinformatics 25, 1189–1191. [DOI] [PMC free article] [PubMed] [Google Scholar]
Associated Data
This section collects any data citations, data availability statements, or supplementary materials included in this article.
Supplementary Materials
Data Availability Statement
The atomic coordinates and structure factors for the reported crystal structure generated during this study is available at the Protein DataBank with accession code 6PZQ.