

SUMMARY
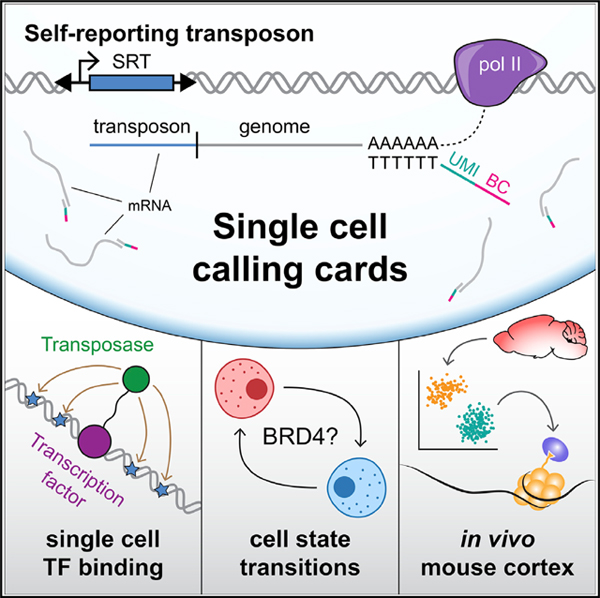
Cellular heterogeneity confounds in situ assays of transcription factor (TF) binding. Single-cell RNA sequencing (scRNA-seq) deconvolves cell types from gene expression, but no technology links cell identity to TF binding sites (TFBS) in those cell types. We present self-reporting transposons (SRTs) and use them in single-cell calling cards (scCC), a novel assay for simultaneously measuring gene expression and mapping TFBS in single cells. The genomic locations of SRTs are recovered from mRNA, and SRTs deposited by exogenous, TF-transposase fusions can be used to map TFBS. We then present scCC, which map SRTs from scRNA-seq libraries, simultaneously identifying cell types and TFBS in those same cells. We benchmark multiple TFs with this technique. Next, we use scCC to discover BRD4-mediated cell-state transitions in K562 cells. Finally, we map BRD4 binding sites in the mouse cortex at single-cell resolution, establishing a new method for studying TF biology in situ.
In Brief
Moudgil et al. present a single-cell method for simultaneously capturing gene expression and transcription factor binding site data from the same cells, first in cell lines and then in the mouse brain.
Graphical Abstract
INTRODUCTION
Transcription factors (TFs) regulate the gene expression patterns that specify cell state (Gurdon, 2016; Hafler et al., 2012; Mizuguchi et al., 2001; Zhu et al., 2012). They are central to a number of critical developmental processes including the maintenance of pluripotency (Liu et al., 2008; Takahashi and Yamanaka, 2006), fate choice (Mizuguchi et al., 2001; Zhu et al., 2012), and embryogenesis (Fogarty et al., 2017). Perturbing TF activity can disrupt cellular development, homeostasis, or function, resulting in altered morphology (Gonen et al., 2018; Kvon et al., 2016), cellular transdifferentiation (Davis et al., 1987), or increased susceptibility to disease (Lee and Young, 2013). A better understanding of TF binding during development and homeostasis would provide insights into how cellular diversity arises and is maintained under normal and abnormal biological conditions.
Single-cell RNA sequencing (scRNA-seq) has emerged as the de facto approach for characterizing cellular diversity in complex tissues and organisms (Campbell et al., 2017; Cao et al., 2017; Fincher et al., 2018; Han et al., 2018; Karaiskos et al., 2017; Zeisel et al., 2015). Recently, multi-modal scRNA-seq technologies have emerged (Angermueller et al., 2016; Cao et al., 2018; Clark et al., 2018; Dey et al., 2015; Macaulay et al., 2015; Peterson et al., 2017; Stoeckius et al., 2017) linking transcriptional information to other genomic assays. These methods address the fact that, while scRNA-seq can describe the current state of a biological system, it alone cannot explain how that state arose. A notable lacuna in the single-cell repertoire is a method for jointly assaying transcriptome and TF binding. Such a method would lead to the genome-wide identification of TF binding sites across multiple cell types in complex tissues. Chromatin immunoprecipitation sequencing (ChlP-seq) is the most popular approach to studying TF binding (Johnson et al., 2007), and, while a number of antibody-based single-cell methods to detect DNA-protein contacts have been reported (Ai et al., 2019; Carter et al., 2019; Grosselin et al., 2019; Hainer et al., 2019; Harada et al., 2019; Kaya-Okur et al., 2019; Rotem et al., 2015; Wang et al., 2019), these techniques have generally mapped highly abundant proteins, such as modified histones and CTCF. DamID can recover TF binding sites by detecting nearby exogenously methylated adenines (Greil et al., 2006; Vogel et al., 2007), but in single cells it has only been used to study lamina-associated domains (Kind et al., 2013, 2015; Rooijers et al., 2019). A combined single-cell assay of DamID and transcriptome (scDam&T-seq) has been described (Rooijers et al., 2019) but is a plate-based assay that limits throughput. None of the other single-cell techniques that measure DNA-protein interactions simultaneously capture mRNA, restricting their use to predetermined cell types. Single-cell assays for transposase-accessible chromatin using sequencing (ATAC-seq; Buenrostro et al., 2015; Cao et al., 2018) could be used to identify nucleosome-free regions that may be bound by TFs, though they rely on motif inference to identify potential DNA binding proteins. These assays do not directly measure TF occupancy nor can they be used to study transcriptional regulators that bind DNA indirectly or non-specifically, such as chromatin remodelers.
We have previously developed transposon calling cards to assay TF binding (Wang et al., 2007, 2011, 2012a). This system relies on two components: a fusion between a TF and a transposase and a transposon carrying a reporter gene. The fusion transposase deposits transposons near TF binding sites, which are subsequently amplified from genomic DNA and sequenced. Thus, the redirected transposase leaves “calling cards” at the genomic locations it has visited, which can be identified later in time. The result is a genome-wide assay of all binding sites for that particular TF. In mammalian cells, we have heterologously expressed the piggyBac transposase (Ding et al., 2005) fused to the TF SP1 and shown that the resulting pattern of insertions reflects SP1’s binding preferences (Wang et al., 2012a). However, this method was only feasible in bulk preparations of thousands of cells.
Here, we present single-cell calling cards (scCC), an extension of transposon calling cards that simultaneously profiles mRNA content and TF binding at single-cell resolution. The key component of our work is the self-reporting transposon (SRT), a novel element whose genomic location can be mapped from mRNA. We show that the RNA-based calling card method is more efficient than our standard DNA-based protocol and can be used to map TF binding sites with a directed transposase. We also demonstrate that the unfused piggyBac transposase, through its native affinity for the bromodomain TF BRD4, can be used to identify BRD4-bound super-enhancers (SEs). We then present the scCC method, which allows cell-type-specific mapping of SRTs from scRNA-seq libraries. Thus, in one experiment, we can cluster cells by transcriptional identity and identify TF binding sites within those cell types. We highlight the range of this technology using a breadth of TFs in a variety of cell lines. We then use scCC to discover bromodomain-dependent cell-state dynamics in K562 cells. Finally, we identify cell-type-specific BRD4 binding sites in vivo in the postnatal mouse cortex. These results demonstrate that scCC could be a broadly applicable tool to study specific TF binding interactions across multiple cell types within heterogeneous systems.
RESULTS
SRTs Can Be Mapped from mRNA Instead of Genomic DNA
To combine scRNA-seq with calling cards, we first developed a transposon whose genomic location could be determined from mRNA. We created a piggyBac SRT by removing the polyadenylation signal (PAS) downstream of the reporter gene (Figure 1A; Methods S1) in the transposon. RNA polymerase II (Pol II) transcribes the SRT reporter and continues through the terminal repeat (TR) into the flanking genomic sequence. Thus, SRTs “self-report” their locations through the unique genomic sequence found in the 3’ untranslated regions (UTRs) of the reporter gene transcripts. While previously published gene- or enhancer-trap transposons (Cadiñanos and Bradley, 2007) could also encode local positional information in RNA, they are resolution-limited to the nearest gene or enhancer, respectively. In contrast, SRT-derived transcripts contain the transposon-genome junction, so insertions can be mapped with base-pair precision.
Figure 1. Self-Reporting Transposons Are Mapped More Efficiently from RNA Compared to DNA.

(A) Schematics of a self-reporting piggyBac transposon with puromycin reporter gene (PB-SRT-Puro) and undirected (PBase) and SPI-directed (SP1-PBase) piggyBac transposases.
(B) Molecular workflow for mapping SRTs from bulk RNA libraries.
(C) Overlap of SRTs recovered by DNA- or RNA-based protocols in HCT-116 cells.
(D) Distribution of insertions with respect to genetic annotation between SRT libraries prepared from either DNA or RNA. TR, terminal repeat; Puro, puromycin; PAS, polyadenylation signal.
SRTs are mapped following reverse transcription (RT) and PCR amplification of self-reporting transcripts. These transcripts contain stretches of adenines that are derived from either cryptic PASs or templated polyadenine tracts in genomic DNA downstream of the SRT insertion site (Figure 1B). We then use a modified tagmentation protocol to enrich for the transposon-genome junction (STAR Methods). We confirmed SRTs generate reproducible libraries, require a functional transposase, and can be recovered from virtually any chromatin state (Methods S1).
To compare how the new RNA-based approach fares against our standard DNA-based method (Wang et al., 2012a), we tested both protocols on the same population of cells. Our DNA-based library yielded 31,001 insertions, while the RNA-based protocol recovered 62,500 insertions (Table S1). Importantly, 80% of the insertions found by DNA calling cards were also recovered in the RNA-based library (25,060 insertions; Figure 1C). Thus, at the level of individual transpositions, RNA-based mapping is highly sensitive. Moreover, the RNA protocol recovered a further 37,440 insertions that were not found in the DNA-based library. We analyzed the distribution of insertions by both genetic annotation (Figure 1D) and chromatin state (Methods S1) and found no appreciable differences in either case between the DNA and RNA libraries. Finally, we also confirmed that SRTs could still be used to study TF binding using established TF-piggyBac constructs and quantified the redirectability of these fusions (Methods S1). Thus, RNA-based recovery of transposons appears to be unbiased with respect to our established, DNA- based protocol.
Clustering of Undirected piggyBac Insertions Identifies BRD4-Bound SEs
Previous studies have shown that undirected piggyBac preferentially inserts transposons near SEs (Yoshida et al., 2017), unique regulatory elements involved in regulating cell identity (Hnisz et al., 2013). SEs are enriched for the histone modification H3K27ac as well as Pol II and transcriptional coactivators like the mediator element MED1 and the bromodomain protein BRD4 (Hnisz et al., 2013; Loven et al., 2013; Whyte et al., 2013). piggyBac has a strong biophysical affinity for BRD4, as these proteins can be co-immunoprecipitated (Gogol-Döring et al., 2016). Thus, we hypothesized that, given the millions of insertions recoverable by SRTs (Table S1), we would be able to identify BRD4-bound SEs simply from the localization of undirected piggyBac transpositions.
In HCT-116 cells, undirected piggyBac showed non-uniform densities of insertions at BRD4-bound loci (Figure 2A; for guidance on interpreting a calling card track, see STAR Methods). At statistically significant peaks of piggyBac calling cards, piggyBac showed high reproducibility of normalized insertions between biological replicates (R2 > 0.99; Figure 2B). We calculated the mean BRD4 enrichment, as assayed by ChlP-seq (McCleland et al., 2016), over all piggyBac peaks, which showed significantly increased BRD4 signal compared to a permuted control set (Figure 2C; Kolmogorov-Smirnov [KS] test p < 10−9). Maximum BRD4 ChIP-seq signal was observed at calling card peak centers and decreased symmetrically in both directions. Moreover, piggyBac peaks showed striking overlap with ChIP-seq profiles for several histone modifications (Sloan et al., 2016; ENCODE Project Consortium, 2012), in particular, an enrichment for H3K27 acetylation (Figure 2D). Since bromodomains bind acetylated histones, this observation further supports the notion that undirected piggyBac insertions can be used to map BRD4 binding. Peaks were also enriched in H3K4me1, another canonical enhancer mark, and depleted for H3K9me3 and H3K27me3, modifications associated with heterochromatin (Lawrence et al., 2016). In all, piggyBac insertion density is highly correlated with BRD4 binding throughout the genome and that regions enriched for undirected piggyBac insertions share features common to enhancers.
Figure 2. Undirected piggyBac SRTs Mark BRD4-Bound Super-enhancers.

(A) Browser view of an undirected PBase insertions in HCT-116 cells at a SE alongside BRD4 and H3K27ac ChIP-seq data.
(B) Reproducibility of normalized insertions at PBase peaks.
(C) Mean BRD4 ChIP-seq signal at PBase peaks compared to permuted control set.
(D) Heatmap of H3K27ac, H3K4me1, H3K9me3, and H3K27me3 ChIP-seq signal at PBase peaks.
(E) Receiver-operator characteristic curve for SE detection using PBase peaks.
(F) Precision-recall curve for SE detection using PBase peaks.
See also Figure S1. SE, super-enhancer; IPM, insertions per million mapped insertions; AUROC, area under receiver-operator curve; AUPRC, area under precision-recall curve; FC, fold change.
We next assessed whether undirected piggyBac peaks can be used to identify BRD4-bound SEs. We constructed receiver-operator characteristic curves based on our ability to detect SEs from piggyBac (Figure 2E). The high area under the curve (0.98) indicates that we can robustly identify BRD4-bound SEs from piggyBac transpositions. Across a range of sensitivities, calling card peaks are highly specific and have high positive predictive value (AUPRC = 0.92; Figure 2F). These trends also hold true for the hyperactive piggyBac mutant (Methods S1).Thus, undirected piggyBac transpositions can accurately assay BRD4-bound SEs.
We also investigated how similar piggyBac transposition is to that ofTn5, thetransposase used in ATAC-seq (Buenrostroetal., 2013, 2015) to identify open chromatin. Since BRD4 and H3K27ac co-occur at accessible loci, it may be that undirected calling cards and ATAC-seq provide redundant information. If that were the case, we should be able to identify BRD4-bound SEs with high sensitivity from ATAC-seq data alone, much as we have shown for piggyBac. We called SEs using publicly available ATAC-seq data from HCT-116 cells (Ponnaluri et al., 2017) in the same manner that we did for BRD4 ChIP-seq. We found almost no overlap between BRD4-bound SEs and these so- called SEs from ATAC-seq data (Figure S1A). Moreover, there are a small number (4.3%) of piggyBac peaks that are not found in accessible chromatin (Figure S1B), suggesting that there may be regulatory elements in closed chromatin that calling cards are better able to detect. Globally, over 20% of Tn5 insertions are directed to accessible sites, starkly higher than undirected piggyBac but comparable to TF-piggyBac fusions (Figure S1C). That piggyBac’s preference for targetting open chromatin can be markedly increased by a covalently linked TF highlights both piggyBac’s baseline insensitivity for accessible sites and the efficacy of TF redirection. Finally, we find that piggyBac peaks are an order of magnitude larger than ATAC-seq peaks and, as a result, capture more BRD4 binding (Figure S1D). We conclude that unfused piggyBac reflects BRD4’s binding preferences whereas Tn5 reports on all accessible chromatin; as a result, undirected calling cards are not equivalent to ATAC-seq.
scCC Enables Simultaneous Identification of Cell Type and Cell-Type-Specific BRD4 Binding Sites
We next sought to recover SRTs from scRNA-seq libraries, which would let us identify cell types from transcriptomic clustering and, using the same source material, simultaneously pro-file TF binding in those cell types. We adopted the 10x Chromium platform due to its high efficiency of cell and transcript capture as well as its ease of use (Zheng et al., 2017) but with a modified protocol (Methods S1). We split the first-strand synthesis product in two: one half is used to generate a scRNA-seq library, while the other half undergoes specific amplification for SRTs followed by circularization. The circularization step brings the cell barcode and unique molecular index (UMI), found at the 3’ ends of each transcript, next to the transposon-genome junction. In this way, SRTs can be mapped and assigned to single cells using high-throughput short read sequencing (Figure 3A). After sequencing, the cell barcodes shared between both libraries are used to connect individual insertions to specific cell types. We call this protocol scCC.
Figure 3. scCC Maps BRD4 Binding in Single Cells.

(A) Schematic of the scCC library preparation strategy from scRNA-seq libraries.
(B) Barnyard plot of scCC on a mixture of human HCT-116 and mouse N2a cells.
(C) UMAP of scRNA-seq of a mixture of human HCT-116 and K562 cells.
(D) Browser view of BRD4 peaks specific to HCT-116 and K562 cells deconvolved using scCC.
See also Figures S2 and S3. TR, terminal repeat; BC, barcode; pA, poly(A) sequence; UMI, unique molecular index.
We first validated scCC by performing a species-mixing experiment with human HCT-116 cells and mouse N2a cells transfected with hyperactive piggyBac (HyPBase) and PB-SRT-Puro. The resulting scRNA-seq library showed strong species separation with an estimated multiplet rate of 3.2% (Figure S2A). We restricted our calling card analysis to those insertions whose cell barcodes were observed in the scRNA-seq library (Table S2). The distribution of insertions across these cells reflected a continuum from pure mouse to pure human (Figures S2B and S2C). Since intramolecular ligation in the circularization step or the subsequent PCR may introduce artifacts, such as the mis-assignment of a barcode from a mouse cell to an insertion site in a human cell, we required that a given insertion in a given cell must have at least two different UMIs associated with it. This filter greatly improved the number of pure mouse and human cells (Figure S2D), yielding clear species separation with an estimated multiplet rate of 7.9% (Figure 3B). Thus, scCC can accurately map SRT insertions in single cells.
We then asked whether scCC could discern cell-type-specific BRD4 binding. We transfected two human cell lines, HCT-116 and K562, with HyPBase and PB-SRT-Puro and mixed them together. The resulting scRNA-seq libraries clearly distinguished these two cell types (Figures 3C and S3A). We prepared scCC libraries from these cells and used the cell barcodes from the HCT-116 and K562 clusters to assign insertions to the two different cell types (Table S2). The distribution of insertions per cell varied by cell type (Figure S3D) and was not explained by differences in total RNA content (Figures S3B and S3C). Over 93% and 96% of HCT-116 and K562 cells, respectively, had at least one insertion event (Table S2). Using the scCC insertion data, we called peaks and successfully identified BRD4-bound loci that were specific to HCT-116 cells, shared between HCT-116 and K562, and specific to K562 cells, respectively (Figure 3D). Both HCT-116 and K562 peaks showed statistically significant enrichment for BRD4 ChIP-seq signal over randomly permuted peaks (Figures S3E and S3F; KStest p < 10−9 in both instances). Furthermore, 57% of HCT-116 peaks and 81% of K562 peaks were specifically bound in their respective cell type. We estimated that with a p value cutoff of 10−9, our sensitivity for detecting BRD4-bound SEs would be approximately 60% (Methods S1), while the actual sensitivity at this level was 67%. Finally, at statistically significant peaks, normalized insertion counts were highly concordant between biological replicates in both cell types (R2 = 0.91 and 0.94, respectively; Figures S3G and S3H). In all, these experiments demonstrate that scCC can be used to identify and deconvolve cell-type-specific BRD4 binding sites.
scCC Identifies Binding Sites across a Spectrum of TFs and in a Variety of Cell Types
Our success mapping BRD4 SEs in single cells gave us confidence that we would also be able to map TF binding with scCC. We transfected HCT-116 and K562 cells with an SP1 fusion construct (SP1-HyPBase) and performed scCC (Table S2). As was observed in bulk (Methods S1), SP1-HyPBase-directed insertions recovered from single cells localized to SP1 binding sites in both HCT-116 and K562 cells (Figures 4A and 4E). In both cell lines, we observed significant enrichment of SP1 ChIP-seq signal at scCC peaks (Figures 4B and 4C and Figures 4F and 4G) and motif analysis identified the SP1 DNA binding motif (Figure 4D and Figure 4H) (p < 10−30 in each instance). SP1 is known to preferentially bind near transcription start sites (TSSs) and is also thought to play a role in demethylating CpG islands (Brandeis et al., 1994; Macleod et al., 1994; Philipsen and Suske, 1999). Accordingly, we observed significant enrichments for insertions near TSSs, CpG islands, and unmethylated CpG islands in particular (Figures S4A and S4B; G test of independence p < 10−9 in each instance).
Figure 4. scCC Works with a Variety of Transcription Factors and Cell Lines.

(A-D) scCC with SP1-HyPBase in HCT-116cells reveal SP1 binding sites. (A) Browser view of a peak from SP1 scCC. (B) Mean SP1 ChlP-seq signal at scCC SP1 peaks. (C) Heatmap of SP1 ChlP-seq signal across all scCC SP1 peaks. (D) Core SP1 motif elicited from SP1 scCC peaks.
(E-H) Same as (A)-(D) but in K562 cells.
(I-L) scCC with FOXA2-HyPBase in HepG2 cells reveal FOXA2 binding sites. (I) Browser view of a peak from FOXA2 scCC. (J) Mean FOXA2 ChlP-seq signal at scCC FOXA2 peaks. (K) Heatmap of FOXA2 ChlP-seq signal across all scCC FOXA2 peaks. (L) Core FOXA2 motif elicited from FOXA2 scCC peaks.
(M-P) scCCwith BAP1-HyPB in OCM-1Acells reveal BAP1 binding sites. (M) Browser view of a peak from BAP1 scCC. (N) Mean bulk BAP1 calling cardssignal at scCC BAP1 peaks. (O) Heatmap of bulk BAP1 calling cards signal across all scCC BAP1 peaks. (P) YY1 motif elicited from BAP1 scCC peaks.
See also Figure S4. FC, fold change.
We next performed scCC in HepG2 cells with the pioneer factor FOXA2 (Table S2), which has been shown to be required for normal liver development and drives core transcriptional networks in cancer cells (Fournier et al., 2016; Lee et al., 2005). As with SP1, we observed a specific enrichment of insertions at FOXA2 binding sites (Figure 4I). Peaks called from scCC FOXA2 data were enriched in FOXA2 ChIP-seq signal (Figures 4J and 4K) and motif analysis was able to infer the core FOXA2 DNA binding motif (Figure 4L).
Last, we mapped the binding of BAP1 in the uveal melanoma cell line OCM-1A (Yen et al., 2018) using scCC (Table S2). Unlike SP1 and FOXA2, BAP1 does not bind DNA directly; instead, it is drawn to chromatin in a complex (Carbone et al., 2013; Yu et al., 2010) where it acts as a histone deubiquitinase. Despite this indirect interaction, we were able to resolve sharp BAP1-directed peaks (Figure 4M). These peaks showed high concordance with bulk RNA calling card data that we also generated in this system (Figures 4N and 4O; Table S1). Sequence analysis elicited the motif of YY1 (Figure 4P), a DNA binding TF and known member of the BAP1 complex (Yu et al., 2010). BAP1 is known to preferentially bind promoters (Dey et al., 2012), and, as such, we observed a significant enrichment for BAP1-directed insertions nearTSSs (Figure S4C; G test of independence p < 10−9). While BAP1 is a member of the Polycomb repressive complex, there are conflicting reports as to its direct effects on gene expression (Campagne et al., 2019; Matatall et al., 2013; Yu et al., 2010). We cross-referenced our single-cell BAP1 peaks against published RNA-seq data in unperturbed and BAP1 knockdown OCM-1A cells (Yen et al., 2018). Genes where BAP1 is bound at the promoter, as opposed to in the gene body or at a nearby inter-genic locus, are significantly more likely to have increased expression upon BAP1 knockdown (Figure S4D; Fisher’s exact test p < 10−9). This suggests that, in this model of uveal melanoma, promoter-bound BAP1 primarily acts as a repressor of gene expression.
Collectively, these results indicate that scCC can successfully map DNA-protein interactions for a range of TFs and in a variety of cell types. Furthermore, scCC showed high reproducibility in all four tested conditions (R2 between 0.71 and 0.95; Figures S4E–S4H). Although TF-piggyBac fusions have been previously reported to decrease transposase activity (Wu et al., 2006), our findings were more equivocal: some fusions showed less activity per cell than undirected HyPBase, while others were more efficient (Figures S4I–S4L). Thus, there may be some variability in the number of recovered insertions depending on the TF and cell type of interest. Overall, however, the method is robust.
scCC Reveal Bromodomain-Dependent Cell-State Dynamics in K562 Cells
SEs and BRD4 are thought to mark genes important for specifying cell identity, and, while the strongest evidence for this comes from comparisons between organ systems or between sharply delineated disease states (Hnisz et al., 2013; Whyte et al., 2013), recent studies have shown that even closely related subpopulations of the same cell type can show subtle changes in BRD4 enrichment and enhancer utilization (Knoechel et al., 2014; Rathert et al., 2015). Recently, K562 cultures have been shown to be mixtures of a stem-like state characterized by high levels of the surface marker CD24, and a more differentiated, erythroleukemic state marked by low CD24 expression, with individual cells dynamically oscillating between these two extremes (Litzenburger et al., 2017). As we had profiled BRD4 binding in K562 cells with scCC, we wondered whether we could see evidence of these two states and, if so, whether there was differential utilization of BRD4 between them.
We first scored cells based on a principal-component analysis (PCA) of gene expression (Figures S5A and S5B), which revealed a gradient of identities along a stem-like-to-differentiated cell-state axis (Figure 5A). We then separated cells into CD24high and CD24low clusters (Figures S5C and S5D) and asked whether we could detect any differences in BRD4 binding between them in our scCC data. Indeed, we found multiple peaks that showed significant differential binding (Figure 5B). We corroborated these hits by comparing our peak calls to bulk BRD4 and H3K27ac ChlP-seq data, as well as to RNA pol II ChlA-PET data, which connects putative enhancers to actively transcribed genes (Fullwood et al., 2009). We highlight two genes that showed both differential binding and expression: VMP1, bound more in the CD24high stem-like cells, and PVT1, bound more in the differentiated, CD24’°w cells (Figures S5F and S5G). VMP1 overexpression is sufficient to induce autophagy (Ropolo et al., 2007), which is important for hematopoietic stem cell function (Folkerts et al., 2019; Ho et al., 2017) and may be one pathway recruited during these dynamic state transitions. PVT1 can act as both a tumor-suppressor and oncogene, in both instances acting on the MYC locus (Cho et al., 2018).
Figure 5. scCC Uncovers Bromodomain-Dependent Cell-State Dynamics in K562 Cells.

(A) Gradient of cell states from scRNA-seq analysis of K562 cells.
(B) Differential BRD4 binding analysis of undirected HyPBase peaks in K562 cells.
(C) Representative distributions of CD24high and CD24low cells after either 96 h of DMSO (top) or JQ1 (bottom) treatment.
(D)Proportion of CD24high cells over a 7-day time course of JQ1 treatment (three-way ANOVA p < 0.01).
(E) Proportion of CD24high cells after BRD4 CRISPRi (Welch’s t test p < 0.01).
(F) Representative plots of annexin V and PI staining in K562 cells pretreated with either DMSO or JQ1 (250 nM) and subsequently treated for 48 h with either DMSO or imatinib (1 μM).
(G) Quantification of (F) (two-way ANOVA p < 0.01).
See also Figures S5 and S6. Bars represent means; error bars denote standard deviations. Experiments were performed in triplicate. DMSO, dimethyl sulfoxide; SSC, side scatter; CRISPRi, CRISPR interference; NT, non-targeting; gRNA, guide RNA; IMA, imatinib; PI, propidium iodide.
We next investigated whether the observed differences in BRD4 binding might be causally responsible for establishing these two cell states. Downregulating BRD4 has been shown to influence cell identity across a range of cell types (Di Micco et al., 2014; Kfoury et al., 2017; Najafova et al., 2017). Thus, we hypothesized that BRD4 inhibition would change the distribution of cells in the stem-like and differentiated states. Moreover, due to the asymmetric nature of significant hits (Figure 5B), there is a subset of peaks specific to the CD24high state that are not shared by the CD24low state, suggesting that there may be a gene regulatory network that is recruited as cells transit from the differentiated to stem-like state and lost as they return. Hence, not only should the distribution of CD24high/CD24low cells change upon BRD4 perturbation but the stem-like CD24high population should be more susceptible to such an intervention.
We tested this hypothesis by treating cells with JQ1, a small-molecule bromodomain inhibitor often used to disrupt BRD4 binding and alter target gene expression (Delmore et al., 2011; Garcia-Carpizo et al., 2018; Loven et al., 2013; Sdelci et al., 2019). JQ1 treatment shifted the population from one containing equal proportions of CD24high/CD24l°w cells to one composed of almost exclusively CD24low cells (>95%, Figure 5C). This conversion took place rapidly over the first 2 days, plateaued by day 4, and remained stable 1 week after treatment. In contrast, the control cells remained evenly split between the two states at this time point (Figure 5D; two-way ANOVA p < 0.01). JQ1 was not selectively cytotoxic to CD24high cells as there were no significant differences in the levels of annexin V, an early marker of apoptosis, between CD24high and CD24low cells, regardless of whether they had been exposed to JQ1 or DMSO (Figure S6A; three-way ANOVA p = 0.84). Additionally, we examined whether CD24 is a direct target of BRD4, which would imply that the loss of CD24 staining was an unremarkable consequence of JQ1 treatment. We did not find evidence of BRD4 binding sites, either by ChlP-seq or calling cards, or of elevated H3K27 acetylation in the vicinity of CD24 (Figure S6B). We also compared the relative changes in mRNA levels of MYC, a known BRD4 target (Knoe-chel et al., 2014; Lovén et al., 2013; Rathert et al., 2015; Zuber et al., 2011), to that of CD24 during the first 24 h of JQ1 exposure. While MYC levels fell within the first 3 h of exposure, transcript levels of CD24 decreased most precipitously between 3 and 9 h after JQ1 induction (Figure S6C). This delayed response suggests a regulatory cascade rather than direct transcriptional control. Thus, JQ1 treatment does not trivially downregulate a cell-surface marker but rather likely perturbs gene regulatory networks that include CD24.
While JQ1 shows greatest affinity for BRD4, it does have some promiscuity toward other bromodomains, including the ortho-logs BRD2 and BRD3 (Filippakopoulos et al., 2010). To address whether off-target effects were responsible for the shift in cell states, we downregulated BRD4 expression with CRISPR interference (CRISPRi). We confirmed that our BRD4 guide RNA (gRNA) specifically reduced expression of BRD4 and not BRD2 nor BRD3 (Figure S6D; Welch’s t test p < 0.05). As with JQ1, we observed a significant decrease in the proportion of CD24high cells with the BRD4 gRNA compared to the non-targeting (NT) gRNA (Figure 5E; Welch’s t test p < 0.01), though not to the same levels as JQ1. This suggests that, while BRD4 is necessary for the observed cell-state dynamics between CD24high and CD24low cells, it is likely that other bromodomains also play a role.
CD24high/CD24l°w cells have been previously shown to have different chemosensitivities, with the latter population showing more apoptosis when exposed to imatinib (Litzenburger et al., 2017). Therefore, we asked whether BRD4 inhibition increases imatinib sensitivity in K562 cells. If so, it would imply that the observed state shift functionally alters K562 cells as opposed to simply modulating a cell-surface marker. We first pretreated K562 cells with either DMSO or JQ1 and then challenged each pretreatment group with either DMSO or imatinib and stained for apoptosis. In the DMSO pretreatment group, the percentage of CD24high cells rose to 54% on average, while for JQ1-pre-treated cells the mean was 17% (Figure 5F). When imatinib was added, a substantially greater fraction of JQ1-pretreated cells underwent apoptosis relative to DMSO-pretreated cells (Figures 5F and 5G; two-way ANOVA p < 0.01). Thus, JQ1 sensitizes K562 cells to imatinib. Furthermore, BRD4 CRISPRi partially phenocopied this sensitization (Figures S6E and S6F; Tukey’s honestly significant difference p = 0.68). This phenomenon is likely dosage dependent: in our experiments, CRISPRi reduced BRD4 mRNA levels by less than 50% (Figure S6D), whereas the JQ1 concentration we used is expected to almost completely abolish BRD4 activity (Filippakopoulos et al., 2010). Thus, while a mild knockdown can reduce CD24 expression, greater inhibition may be necessary to induce imatinib sensitivity. Nevertheless, these results establish that BRD4 inhibition functionally and phenotypically shifts the underlying cell state of K562 cells.
Finally, we examined whether the JQ1-induced K562 cell-state shift was a non-specific response to generic drug treatment. We treated K562 cultures with a panel of cell-cycle inhibitors, another class of commonly used antineoplastic agents. We first confirmed that all drugs altered the proportions of cells in either G1 or G2/M phase (Figure S6G). Cultures remained under drug treatment until 5 days had elapsed, at which point we measured CD24 levels and stained for apoptosis (Figure S6H). JQ1 caused the greatest reduction in CD24high cells (one-way ANOVA p < 0.01) and induced significantly less apoptosis than lovastatin, its closest competitor (one-way ANOVA p < 0.01). Thus, JQ1’s effect on cell state appears to be mediated by a unique mechanism of action that is not readily replicated by cell-cycle perturbation.
scCC Deconvolves Cell-Type-Specific BRD4 Binding Sites in the Mouse Cortex
To establish broad utility for scCC, we sought to record TF binding in vivo. Since in vivo models preclude puromycin selection, we designed an SRT carrying a fluorescent reporter (Figure 6A) and tested this reagent in cell culture. When this element was transfected without transposase, merely 3.4% of cells registered as positive, likely due to the action of the self-cleaving ribozyme downstream of the transposon. However, when the construct was co-transfected with piggyBac, this figure rose as high as 48%, a 16-fold increase in signal (Figure 6B). Thus, this new construct, PB-SRT-tdTomato, allows us to collect cells carrying calling card insertions by fluorescence activated cell sorting (FACS).
Figure 6. scCC Deconvolves BRD4-Bound Loci in the Mouse Cortex.

(A) Schematic of PB-SRT-tdTomato.
(B) Distribution of fluorescence intensity in K562 cells transfected with PB-SRT-tdTomato with and without piggyBac transposase.
(C) Neuron and astrocyte clusters from scRNA-seq analysis of mouse cortex libraries transduced with AAV-HyPBase and AAV-PB-SRT-tdTomato.
(D) Browser view of scCC HyPBase peaks in astrocytes and neurons alongside whole-cortex H3K27ac ChIP-seq.
(E) Expression specificity distributions ofgenes overlapping astrocyte or neuron peaks; horizontal lines indicate medians of the distributions. See also Figure S7. TR, terminal repeat; Rz, ribozyme.
Next, we delivered PB-SRT-tdTomato and HyPBase to the postnatal mouse cortex by performing adeno-associated viral (AAV) transduction (Cammack et al., 2020) in P0–2 pups and then generating scRNA-seq and scCC libraries between P14 and P28. Most transduced cells were neurons or astrocytes (Tables S2 and S3; Figure 6C; Methods S1), which is consistent with the known tropism of AAV9 (Cammack et al., 2020; Schuster et al., 2014). Therefore, we analyzed insertions in neurons (excluding neuroblasts and doublets) and astrocytes to determine whether scCC could recover biological differences between cell types in vivo. After calling peaks, we identified astrocyte-specific, neuron-specific, and shared BRD4 binding sites (Figure 6D). Since BRD4 ChlP-seq has not yet been reported for the mouse brain, we compared our peak calls to a recent cortical H3K27ac ChlP-seq dataset (Stroud et al., 2017), and, while this dataset is a melange of all cell types in the brain, scCC peaks in both astrocytes and neurons showed statistically significant enrichment of H3K27ac signal (Figures S7A and S7C; KS test p < 10−9 in each case). Moreover, genes near astrocyte peaks were more likely to be specifically expressed in astrocytes and vice versa for genes near neuron peaks (Figure 4E; STAR Methods). Furthermore, Gene Ontology enrichment analysis (Mi et al., 2017) on the set of genes near astrocyte peaks included terms like “gliogenesis,” and “glial cell differentiation,” as well as copper metabolism (Figure S7B), a known function of astrocytes (Scheiber and Dringen, 2013), while the set of genes near neuronal peaks was enriched for terms related to synapse assembly, axonal guidance, and neuron development (Figure S7D). We conclude that scCC can accurately identify cell-type-specific BRD4 binding sites in vivo.
Last, we asked whether scCC in vivo could discriminate BRD4 binding between closely related cell types, much as we had shown in vitro with K562 cells. From our scRNA-seq data, we identified upper- and lower-layer cortical excitatory neurons (Figure 7B; Table S3; Methods S1) and compared Hy-PBase scCC data between them to identify shared and specific BRD4-bound loci. As a positive control, we found a shared BRD4 binding site at the Pou3f3 (Brn-1) locus (Figure 7A), which was broadly expressed in both populations (Figure 7C) and has been used to label layers 2–5 of the postnatal cortex (Molyneaux et al., 2007; Pucilowska et al., 2012). Differential binding analysis showed specific BRD4 enrichment at Pou3f2 (Brn-2) in upper-layer neurons, which is more restricted to layers 2–4 than Pou3f3 (Fan et al., 2008; Molyneaux et al., 2007), while lower cortical neurons showed BRD4 binding at Bcl11b (Ctip2) and Foxp2, common markers of layer 5 and layer 6 neurons, respectively (Figure 7A; one-tailed Poisson p < 10−9 in each instance) (Molyneaux et al., 2007; Rasin et al., 2007). The expression patterns of these genes mirrored BRD4’s binding specificity, with Pou3f2’s expression mostly contained in the layer 2–4 cluster and the expression of Bcl11b and Foxp2 restricted to the layer 5–6 neuron population (Figure 7C). Thus, scCC can identify differentially bound loci between very similar cell types in vivo.
Figure 7. scCC Unmixes BRD4 Binding in Cortical Excitatory Neurons and Identifies Known Layer Markers.

(A) Browser view of scCC HyPBase peaks in upper (layer 2–4) or lower (layer 5–6) cortical excitatory neurons alongside whole-cortex H3K27ac ChlP-seq.
(B) Layer 2–4 and layer 5–6 cortical excitatory neurons highlighted among the scRNA-seq clusters.
(C) Single-cell gene expression patterns of the four genes from (A).
DISCUSSION
scCC enables simultaneous characterization of gene expression and TF binding in heterogeneous systems. The method is robust and flexible: we have demonstrated that it can map multiple kinds of DNA binding proteins—from sequence-specific TFs like SP1 and FOXA2, to indirect, chromatin-associated factors like BRD4 and BAP1—in a variety of in vitro systems and in vivo in the mouse cortex. Furthermore, our finding that cell-state transitions in K562 cells are mediated by bromodomain proteins including BRD4 demonstrates how scCC can lead to new hypotheses about transcriptional regulation in dynamic systems. Our approach fills a recognized void in the field (Shapiro et al., 2013; Shema et al., 2019) and is readily compatible with high-throughput droplet microfluidic platforms such as the 10x Chromium. We anticipate this technique will empower researchers to study TF binding in a variety of challenging ex vivo and in situ models.
The defining feature of scCC is the SRT. While here we have reported piggyBac and Sleeping Beauty SRTs (Methods S1), the self-reporting paradigm may be broadly generalizable. Expanding the palette of SRT systems could yield further insight into chromatin dynamics (Yoshida et al., 2017). Moreover, SRTs may enable multiplexed studies of TF binding, either through the simultaneous expression of many TFs, each tagged to a different transposase, or through the use of multiple bar-coded TF-piggyBac fusions expressed polyclonally in culture. Since SRTs can be widely dispersed through the genome, full-length sequencing of self-reporting transcripts may find new PASs (Methods S1). Finally, SRTs could lead to new single-cell transposon-based assays. For example, just as CRISPR/Cas9 has been combined with scRNA-seq to assess the transcriptional effects of many single gene perturbations in parallel (Dat-linger et al., 2017; Dixit et al., 2016), SRTs could enable massively multiplexed transposon mutagenesis screens to be read out by scRNA-seq.
One concern with calling cards is the potential for insertional mutagenesis of target genes leading to cell death and, consequently, false negatives. Previous work in diploid yeast found that calling cards are deposited into the promoters of essential and non-essential genes at comparable frequencies (Wang et al., 2011). Since mammalian genomes have much larger inter-genic regions than yeast, human and mice genomes are likely also able to tolerate calling card transpositions. Long-term follow-up of mice transduced intracranially with AAV calling cards showed no significant tissue pathology, behavioral deficits, developmental defects, or metabolic dysregulation (Cammack et al., 2020). This suggests calling cards imposes, at most, a small mutagenic burden, though more studies are needed to verify this.
Another potential drawback of calling cards is that exogenous expression of a TF at supraphysiological levels may lead to ectopic binding and, consequently, false positives. We note that over 90% of our peaks from scCC of SP1 in HCT-116 cells and FOXA2 in HepG2 cells were within 1,000 bp of a ChIP-seq peak from the respective TF. This suggests that calling card peaks reflect endogenous binding, though this behavior may vary by factor. Overexpression might also alter the transcriptome of transfected cells. Comparing gene expression levels between cells treated with TF-piggyBac and the undirected piggyBac control cells can determine whether there is transcriptional perturbation and to what extent. Tagging the endogenous TF locus with piggyBac ensures native expression levels and would alleviate both concerns.
The relatively few insertions recovered on a per-cell basis inflates the number of cells that must be analyzed. We recommend processing enough cells to obtain at least 15,000 insertions to analyze BRD4-bound SEs with undirected piggyBac, and at least 30,000 insertions for both constructs in TF-directed experiments. This should achieve moderate sensitivities (~50%; Methods S1) that can be increased by collecting more insertions. The scant data recovered on a per-cell level likely stem from limited transposase activity—up to 15–30 insertions per cell for PBase (Kettlun et al., 2011; Saridey et al., 2009; Wang et al., 2008; Wilson et al., 2007) and potentially up to 100 for HyPBase (Kalhor et al., 2018; Yusa et al., 2011)—and the low capture rate of mRNA transcripts in droplet scRNA-seq (Hwang et al., 2018). This sparsity precludes certain kinds of analyses, such as multi-modal data integration. Moreover, piggyBac’s strict preference for TTAA tetramers also contributes to broader peaks with lower spatial resolution. While we overcame the latter constraint by focusing on peak centers and narrow peaks, peak width is inversely correlated with the number of insertions analyzed; as such, improving recovery of SRTs from single cells should be prioritized. Some of these gains may come organically as the transcript capture rates of scRNA-seq technologies improve. Since the per-cell costs for scRNA-seq are falling exponentially (Svensson et al., 2018), combining scCC with sample multiplexing strategies like cell hashing (Stoeckius et al., 2018) or combinatorial barcoding (Rosenberg et al., 2018) may be an attractive approach to increase sensitivity.
Finally, calling card insertions, being integrated into the genome and preserved through mitosis, could serve as a molecular memory for recording TF binding events. The use of an inducible transposase (Qi et al., 2017) would enable the recording and identification of temporally restricted TF binding sites. This would help uncover the stepwise order of events underlying the regulation of specific genes and inform cell-fate decision making. More generally, transposon insertions could serve as barcodes of developmental lineage. Single transposition events have been used to delineate relationships during hematopoiesis (Rodriguez-Fraticelli et al., 2018; Sun et al., 2014). Multiplexing several SRTs across every cell in an organism could code lineage in a cumulative and combina-torially diverse fashion, generating high-resolution cellular phylogenies.
STAR ★METHODS
Detailed methods are provided in the online version of this paper and include the following:
RESOURCE AVAILABILITY
Lead Contact
Further information and requests for resources and reagents should be directed to, and will be fulfilled by, the Lead Contact, Robi D. Mitra (rmitra@wustl.edu).
Materials Availability
Plasmids generated in this study have been deposited to Addgene, where possible, and are available to the community. Plasmids encoding the piggyBac transposase are not available through Addgene due to licensing restrictions. These plasmids are available upon request to the Lead Contact.
Data and Code Availability
Data generated in this study have been submitted to the Gene Expression Ominbus (GEO) with accession number GSE148448. All code used to analyze the data is available online at https://github.com/arnavm/calling_cards.
EXPERIMENTAL MODEL AND SUBJECT DETAILS
HCT-116, N2a, HEK293T, and HepG2 cells were cultured in Dulbecco’s Modified Eagle Medium (DMEM) supplemented with 10% fetal bovine serum (FBS) and 1% of either penicillin-streptomycin or antibiotic-antimycotic. K562 (unless otherwise indicated) and OCM-1A cells were grown under the same conditions as described above, replacing DMEM with RPMI 1640 Medium. Cells were grown at 37°C with 5% carbon dioxide (CO2). Media was replenished every 2 days. HepG2 cells were a gift from the Genome Engineering iPSC Center (GEiC) at Washington University in St. Louis School of Medicine. OCM-1A cells were a gift from Dr. Michael Onken. For the CD24high/CD24lowcell state analyses, K562 cells were grown in IMDM containing 10% v/v FBS and 1% penicillin-streptomycin at 37°C with 5% CO2. Frozen aliquots were thawed and passaged every 48 hours until they reached a maximum concentration of 800,000 cells/ml. For experiments, cells were seeded at mid-log phase concentrations, around 400,000 cells/ml. At this point, ratio of CD24high/CD24low cells was approximately 1:1, as determined by flow cytometry.
All mouse experiments were done following procedures described in (Cammack et al., 2020). In brief, we cloned the PB-SRT-tdTomato and HyPBase constructs into AAV vectors. The Hope Center Viral Vectors Core at Washington University in St. Louis pack-aged each construct in AAV9 capsids. Titers for each virus ranged between 1.1×10¹³ and 2.2×10¹³ viral genomes/ml. We mixed equal volumes of each virus and performed intracranial cortical injections of the mixture into newborn wild-type C57BL/6J pups (P0–2). As a gating control, we injected one litter-matched animal with AAV9-PB-SRT-tdTomato only. After 2 to 4 weeks, we sacrificed mice and dissected the cortex (8 libraries) or hippocampus (1 library). The sex of mice was not taken into consideration. All animal practices and procedures were approved by the Washington University in St. Louis Institutional Animal Care and Use Committee (IACUC) in accor-dance with National Institutes of Health (NIH) guidelines.
METHOD DETAILS
DNA- versus RNA-based recovery
Approximately 500,000 HCT-116 cells were plated in a single well of a 6-well plate. Cells were transfected with 2.5 μg of the SP1-PBase plasmid and 2.5 μg of the PB-SRT-Puro plasmid using Lipofectamine 3000 following manufacturer’s instructions. After 24 hours, cells were split and plated 1:10 in each of three 10 cm dishes. Puromycin was then added to a final concentration of 2 μg/ml and colonies were grown under selection for two weeks. We obtained approximately 2,300 colonies. All cells were pooled together and split into two populations. One half was subjected to DNA extraction, self-ligation, and inverse PCR, as described previously (Wang et al., 2012a), with the following modification: digestion with MspI was not performed as the SRT construct contained an second MspI cut site near the terminal repeat. The other half of cells underwent RNA extraction and SRT library preparation (see below).
In vitro bulk calling card experiments
We cotransfected 10–12 replicates of HCT-116 cells with 5 mg of PB-SRT-Puro plasmid and 5 mg PBase plasmid via Neon electroporation Each replicate contained 2×10⁶ cells. As a negative control, we transfected one replicate of HCT-116 cells with 5 μg PB-SRT-Puro plasmid only. We used the following settings-pulse voltage: 1,530 V; pulse width: 20 ms; pulse number: 1. We used the same experimental setup for experiments with PB-SRT-Puro and each of SP1-PBase, HyPBase, and SP1-HyPBase plasmids, as well as with SB-SRT-Puro and SB100X (the latter a gift from Dr. Zsuzsanna Izsvák; Mátés et al., 2009) plasmids. After transfection, each replicate was plated into a 10 cm dish. For the OCM-1A library, we transfected 1.25 mg of PB-SRT-Puro and 1.25 mg of either HyPBase or BAP1-HyPBase (the latter a gift from Dr. Michael Onken; Yen et al., 2018) using the TransIT-LT1 transfection reagent following manufacturer’s protocol for 6-well plates. Puromycin was added after 24 hours to a final concentration of 2 μg/ml. Cells were grown under selection for one week, by which time almost all negative control transfectants were dead. After 7 days, we dissociated each replicate with trypsin-EDTA and created single cell suspensions in phosphate-buffered saline (PBS). Aliquots of each replicate were cryopreserved in cell culture media (see above) supplemented with 5% DMSO. The remaining cells were pelleted by centrifugation at 300g for 5 minutes. Cell pellets were either processed immediately or kept at −80°C in RNAProtect Cell Reagent.
Isolation and RT of bulk RNA
Total RNA was isolated from each replicate using the RNEasy Plus Mini Kit following manufacturer’s instructions. Briefly, cell pellets were resuspended in 600 μl of Buffer RLT Plus with 1% 2-mercaptoethanol. Cells were homogenized by vortexing. DNA was removed by running lysate through gDNA Eliminator spin columns, while RNA was bound by passing the flow-through over RNEasy spin columns. An on-column treatment with DNaseI was also performed. After washing, RNA was eluted in 40 μl RNase-free H2O. RNA was quantitated using the Qubit RNA HS Assay Kit.
We performed first strand synthesis on each replicate with Maxima H Minus Reverse Transcriptase. We mixed 2 μg of total RNA with 1 μl 10 mM dNTPsand 1 μl of 50 μM SMART_dT18VN primer (for a complete list of oligonucleotides, see Table S4), brought the total volume up to 14 μl, and incubated it at 65°C for 5 minutes. After transferring to ice and letting rest for 1 minute, we added 4 μl 5X Maxima RT Buffer, 1 μl RNaseOUT, and 1 μl of 1:1 Maxima H Minus Reverse Transcriptase diluted in 1x RT Buffer (100 U). The solution was mixed by pipetting and incubated at 50°C for 1 hour followed by heat inactivation at 85°C for 10 minutes. Finally, we digested with 1 μl RNaseH at 37°C for 30 minutes. cDNA was stored at −20°C.
Amplifying self-reporting transcripts from RNA
The PCR conditions for amplifying self-reporting transcripts (i.e., transcripts derived from self-reporting transposons) involved mixing 1 ml cDNA template with 12.5 μl Kapa HiFi HotStart ReadyMix, 0.5 μl 25 μM SMART primer, and either 1 μl of 25 μM SRT_PAC_F1 primer (in the case of puromycin selection) or 0.5 μl of 25 μM SRT_tdTomato_F1 primer (in the case of tdTomato screening). The mixture was brought up to 25 μl with ddH2O. Thermocycling parameters were as follows: 95°C for 3 minutes; 20 cycles of: 98°C for 20 s-65°C for 30 s-72°C for 5 minutes; 72°C for 10 minutes; hold at 4°C forever. As a control, cDNA quality can be assessed with exon-spanning primers for β-actin [see Table S4 for examples of human primers (Raff et al., 1997))]under the same thermocycling settings.
PCR products were purified using AMPureXP beads. 12 μl of resuspended beads were added to the 25 μl PCR product and mixed homogenously by pipetting. After a 5-minute incubation at room temperature, the solution was placed on a magnetic rack for 2 minutes. The supernatant was aspirated and discarded. The pellet was washed twice with 200 μl of 70% ethanol (incubated for 30 s each time), discarding the supernatant each time. The pellet was left to dry at room temperature for 2 minutes. To elute, we added 20 μl ddH2O to the pellet, resuspended by pipetting, incubated at room temperature for 2 minutes, and placed on a magnetic rack for one minute. Once clear, the solution was transferred to a clean 1.5 mLtube. DNA concentration was measured on the Qubit 3.0 Fluorometer using the dsDNA High Sensitivity Assay Kit.
Generation of bulk RNA calling card libraries
Calling card libraries from bulk RNA were generated using the Nextera XT DNA Library Preparation Kit. One nanogram of PCR product was resuspended in 5 μl ddH2O. To this mixture we added 10 μl Tagment DNA (TD) Buffer and 5 μl Amplicon Tagment Mix (ATM). After pipetting to mix, we incubated the solution in a thermocycler preheated to 55°C. The tagmentation reaction was halted by adding 5 μl Neutralization Tagment (NT) Buffer and was kept at room temperature for 5 minutes. The final PCR was set up by adding 15 μl Nextera PCR Mix (NPM), 8 μl ddH20,1 μl of 10 μM transposon primer (e.g., OM-PB-NNN) and 1 μl Nextera N7 indexed primer. The transposon primer anneals to the end of the transposon terminal repeat-piggyBac, in the case of OM-PB primers, or Sleeping Beauty, in the case of OM-SB primers-and contains a 3 base pair barcode sequence. Every N7 primer contains a unique index sequence that is demultiplexed by the sequencer. Each replicate was assigned a unique combination of barcoded transposon primer and indexed N7 primer, enabling precise identification of each library’s sequencing reads.
The final PCR was run under the following conditions: 95°Cfor30s; 13 cycles of: 95°Cfor 10s-50°Cfor30s-72°Cfor30 s; 72°Cfor 5 minutes; hold at 4°C forever. After PCR, the final library was purified using 30 μl (0.6x) AMPure XP beads, as described above. The library was eluted in 11 μl ddH2O and quantitated on an Agilent TapeStation 4200 System using the High Sensitivity D1000 ScreenTape.
Colony formation assay
For the piggyBac transfectants, we electroporated 500,000 HCT-116 cells with 750 ng of PB-SRT-Puro and 750 ng of either HyPBase or SP1-HyPBase plasmid using the aforementioned Neon settings. For the SRT-only conditions, cells received 750 ng of PB-SRT-Puro. We used the same design for the Sleeping Beauty transfectants, replacing the transposases with either SB100X or SP1-SB100X and using SB-SRT-Puro as the transposon. Each set of 500,000 cells were plated in a single well of a 6-well plate and allowed to recover overnight. We then added puromycin to a final concentration of 2 mg/ml. We cultured cells under selection for one week. Colonies were visualized using a solution comprising 1X PBS, 1% formaldehyde, 1% methanol, and 0.05% w/v crystal violet. After aspirating median, we covered cells with this solution, staining plates for 20 minutes washing under cold water and air drying.
In vitro single cell calling card experiments
All cell lines (HCT-116, K562, N2a, HepG2, and OCM-1A) were cultured as described above. HCT-116 cells were transfected using Neon electroporation with the aforementioned settings. K562 cells were electroporated with the following settings-pulse voltage: 1,450 V; pulse width: 10 ms; pulse number: 3. N2a cells were electroporated with the following settings-pulse voltage: 1,050 V; pulse width: 30 ms; pulse number: 2. HepG2 cells were electroporated with the following settings-pulse voltage: 1,200 V; pulse width: 50 ms; pulse number: 1. Each replicate for electroporation was comprised of 2×10⁶ cells. All cells were allowed to recover for 24 hours before undergoing puromycin selection. A negative control replicate, transfected only with PB-SRT-Puro, was treated identically in parallel. Replicates were harvested once the negative control cells had died. For the species mixing experiment, we transfected one replicate each of HCT-116 and N2a cells with 5 μg PB-SRT-Puro and 5 μg HyPBase. For the cell line mixing experiment, we trans-fected four replicates each of HCT-116 and K562 cells with 5 μg PB-SRT-Puro and 5 μg HyPBase. In all cases, cells were cultured independently and mixed immediately prior to generating single cell emulsions. For single cell calling cards analysis of SP1 binding in HCT-116 and K562 cells, we transfected four replicates each with 5 μg PB-SRT-Puro and 5 μg SP1-HyPBase. These libraries were not mixed. We used the demultiplexed data from the cell line mixing experiment with HyPBase as controls. For single cell calling cards analysis of FOXA2 binding in HepG2 cells, we transfected six replicates each with 5 μg PB-SRT-Puro; three of these replicates were co-transfected with 5 μg HyPBase, while the other three were co-transfected with 5 μg FOXA2-HyPBase. We used the mouse ortholog of FOXA2, which has 97% primary sequence identity with human FOXA2. For single cell calling cards analysis of BAP1 binding in OCM-1A cells, we lipofected (as described above) six replicates each with 1.25 μg PB-SRT-Puro; three of these replicates were co-transfected with 1.25 μg HyPBase, while the other three were co-transfected with 1.25 μg BAP1-HyPBase.
Single cell RNA-seq library preparation
Single cell RNA-seq libraries were prepared using 10x Genomics’ Chromium Single Cell 3’ Library and Gel Bead Kit. Each replicate was targeted for recovery of 6,000 cells. Library preparation followed a modified version of the manufacturer’s protocol. We prepared the Single Cell Master Mix without RT Primer, replacing it with an equivalent volume of Low TE Buffer. Gel-in-emulsion (GEM) generation and GEM-RT incubation proceeded as instructed. At the end of Post GEM-RT cleanup, we added 36.5 μl Elution Solution I and transferred 36 μl of the eluted sample to a new tube (instead of 35.5 μl and 35 μl, respectively). The eluate was split into two 18 μl aliquots and kept at-20°C until ready for further processing. One fraction was kept for single cell calling cards library preparation (see next section), while the other half was further processed into a single cell RNA-seq library.
We then added the RT Primer sequence to the products in the scRNA-seq aliquot. We created an RT master mix by adding 20 μl of Maxima 5X RT Buffer, 20 μl of 20% w/v Ficoll PM-400,10 μlof10 mM dNTPs, 2.5 μl RNase Inhibitor and 2.5 μl of 100 μM 10x_TSO. To this solution we added 18 μl of the first RT product and 22 μl of ddH2O. Finally, we added 5 μl Maxima H Minus Reverse Transcriptase, mixed by flicking, and centrifuged briefly. This reaction was incubated at 25°C for 30 minutes followed by 50°C for 90 minutes and heat inactivated at 85°C for 5 minutes.
The solution was purified using DynaBeads MyOne Silane following 10x Genomics’ instructions, beginning at “Post GEM-RT Cleanup -Silane DynaBeads” step D. The remainder of the single cell RNA-seq protocol, including purification, amplification, frag-mentation, and final library amplification, followed manufacturer’s instructions.
Single cell calling cards library preparation
To amplify self-reporting transcripts from single cell RNA-seq libraries, we took 9 ml of RT product (the other half was kept in reserve) and added it to 25 μl Kapa HiFi HotStart ReadyMix and 15 μl ddH2O. We then prepared a PCR primer cocktail comprising 5 μl of 100 μM Bio_Illumina_Seq1_scCC_10X_3xPT primer, 5 μl of 100 μM Bio_Long_PB_LTR_3xPT, and 10 μl of 10 mM Tris-HCl, 0.1 mM EDTA buffer. One μl of this cocktail was added to the PCR mixture and placed in a thermocycler. Thermocycling settings were as follows: 98°C for 3 minutes; 20–22 cycles of 98°Cfor20s-67°Cfor30 s-72°C for 5 minutes; 72°Cfor 10 minutes; 4°C forever. PCR purification was performed with 30 μl AMPure XP beads (0.6x ratio) as described previously. The resulting library was quantitated on an Agilent TapeStation 4200 System using the High Sensitivity D5000 ScreenTape.
Single cell calling card library preparation was performed using the Nextera Mate Pair Sample Prep Kit with modifications to the manufacturer’s protocol. The library was circularized by bringing 300 fmol (approximately 200 ng) of DNA up to a final volume of 268 μl with ddH2O, then adding 30 μl Circularization Buffer 10x and 2 μl Circularization Ligase (final concentration: 1 nM). This reaction was incubated overnight (12–16 hours) at 30°C. After removal of linear DNA (following manufacturer’s instructions), we sheared the library on a Covaris E220 Focused-ultrasonicator with the following settings-peak power intensity: 200; duty factor: 20%; cycles per burst: 200; time: 40 s; temperature: 6°C.
The library preparation was performed per manufacturer’s instructions until adaptor ligation. We designed custom adapters (Table S4) so that the standard Illumina sequencing primers would not interfere with our library. Adapters were prepared by combining 4.5 μl of 100 μM scCC_P5_adapter, 4.5 μl of 100 μM scCC_P7_adapter, and 1 μl of NEBuffer 2, then heating in a thermocycler at 95°C for 5 minutes, then holding at 70°C for 15 minutes, then ramping down at 1% until it reached 25°C, holding at that temperature for 5 minutes, before keeping at 4°C forever. One microliter of this custom adaptor mix was used in place of the manufacturer’s recommended DNA Adaptor Index. The ligation product was cleaned per manufacturer’s instructions. For the final PCR, the master mix was created by combining 20 μl Enhanced PCR Mix with 28 μl of ddH2O and 1 μl each of 25 μscCC_P5_primer and 25 μM scCC_P7_primer. This was then added to the streptavidin bead-bound DNA and amplified under the following conditions: 98°C for 30 s; 15 cycles of: 98°C for 10 s-60°C for 30 s-72°C for 2 minutes; 72°C for 5 minutes; 4°C forever. All of the PCR supernatant was transferred to a new tube and purified with 35 μl (0.7x) AMPure XP beads following manufacturer’s instructions. The final library was eluted in 25 μl Elution Buffer and quantitated on an Agilent TapeStation 4200 System using the High Sensitivity D1000 ScreenTape.
Staining protocols for K562 cells
CD24 surface protein was quantified using monoclonal human antibodies. Cells were spun down at 300g for 3 minutes and washed twice with 1 mL of Cell Staining Buffer. The cell pellet was then resuspended in 50 μl of Cell Staining Buffer containing 0.2 μg of either CD24-APC or CD24-BV421. The tube was rotated at 4°C in the dark for 30 minutes. After, cells were washed twice (as before) and finally resuspended in 200 μl of Cell Staining Buffer. Cells were excited with 450/45 and 660/20 lasers (wavelength/filter bandwidth, both in nm). For concomitant analysis of DNA content, we used CD24-APC. Cells were incubated with 10 μg/ml Hoechst 33342 in 5 mL of growth medium for 30 minutes prior to the staining protocol. For simultaneous assessment of apoptosis, cells were stained with CD24-BV421. After the final wash, instead of resuspending in 200 μl of Cell Staining Buffer, cells were washed twice with Annexin V Staining Buffer. Cells were then incubated in 50 μl Annexin V Staining Buffer containing 0.2 μg Annexin V-FITC and 100 μg/ml pro-pidium iodide (PI). The reaction was incubated for 15 minutes at room temperature in the dark. Afterward, we added 150 μl of Annexin V Staining Buffer and proceeded to flow cytometry. All samples were measured on a Beckman-Coulter CytoFLEX S flow cytometer. Cells were excited with 450/45, 525/40, and 610/20 lasers. We collected 10,000 events per sample. The resulting data were processed with FlowJo Software for Mac Version 10.
JQ1 treatment of K562 cells
For the longitudinal treatment of K562 cells with JQ1, we seeded cells at log phase growth and treated them with growth medium containing DMSO (~0.4% final concentration) or 250 nM JQ1 (dissolved in DMSO). Medium was replaced every 48 hours without splitting. On days 1, 2, 3, 4, and 7, cells were split in half: one half was stained for CD24 and DNA content, while the other half was stained for CD24 and apoptosis (both described above). Experiments were performed with three biological replicates.
For qRT-PCR, we cultured K562 cells in either DMSO or 250 nM JQ1, in triplicate, and collected cells at 0,3,6, 9,12, and 24 hours of treatment. Cells were pelleted, resuspended in 300 μl of RNA CellProtect, and stored at −80°C. When we were ready to extract RNA, we thawed cells, prepared samples using QIAGEN RNEasy Plus Mini Kit, and quantitated with the Qubit RNA High Sensitivity kit. We reverse transcribed 500 ng of RNA with the SuperScript VILO cDNA Synthesis Kit in a 20 μl reaction, with the following thermocycling parameters: 25°C for 10 minutes; 42°Cfor2 hours; 85°C for 5 minutes. We then performed PCR with 2 μl of the RT product as template, 1 μl each of forward and reverse primer (10 μM), 6 μl ddH2O, and 10 μl PowerUp SYBR Green Master Mix. We ran the PCR on an ABI QuantStudio 3 with the following settings: 2 minutes at 50°C, then 2 minutes at 95°C (hot start); 45 cycles of 95°C for 15 s followed by 60°C for 1 minute. We generated melt curves after each PCR and all samples yielded a single peak. Gene-specific primers were obtained from PrimerBank (Wang et al., 2012b). Data were normalized to the levels of β-actin.
BRD4 CRISPRi of K562 cells
For CRISPRi, we first made lentivirus expressing dCas9-KRAB (Fulco et al., 2016; Xie et al., 2017) from Addgene plasmid #89567, a gift from Gary Hon, packaged in HEK293T cells along with pMD2.G (Addgene plasmid #12259) and psPAX2 (Addgene plasmid #12260), both gifts from Didier Trono. We cloned a BRD4 guide RNA, selected from the Dolcetto collection (Sanson et al., 2018), into the sgOpti plasmid (Addgene plasmid #85681, a gift from Eric Lander & David Sabatini) using Golden Gate assembly with Esp3I. We used an in-house pipeline to design a non-targeting gRNA sequence, which was cloned into CROP-seq-opti (Lalli et al., 2019). Plasmids were transfected into HEK293T cells using Lipofectamine 2000. Media was collected after 24 and 48 hours, and subsequently concentrated using Lenti-X Concentrator. Viral titers were functionally assed on HEK293T cells using the appropriate antibiotic (blasticidin or puromycin).
Next, we generated a polyclonal pool of dCas9-KRAB-expressing K562 cells. We seeded each well of a 6-well plate with 200,000 cells each containing 2 mL of growth media supplemented with 4 mg/ml polybrene and 1,000,000 infectious lentiviral particles for an estimated multiplicity of infection (MOI) of 5. Plates were centrifuged at 2,000g for 30 minutes and returned to the incubator. After 48 hours, cells were split to mid-log phase concentration (~400,000 cells/ml) and selected on blasticidin (10 μg/ml) for 48 hours. We made frozen stocks from these cells.
For the knockdown experiments, cells were thawed and allowed to recover for 4 days. We confirmed that the proportions of CD24high/CD24low was approximately equal at this point. We then seeded 200,000 cells into each well of a 6-well plate. Three wells received the BRD4 gRNA lentivirus, while the other three received the non-targeting gRNA lentivirus, at MOI 2.5. We followed the same transduction protocol described above. After 48 hours of incubation, puromycin was added to the medium at a final concentration of 2 μg/ml. After a further 48 hours, cells were passaged 1:1 into 10 cm dishes containing 10 mL of growth medium. The surviving cells were allowed to expand for a further 5 days before being stained for CD24 (nine days after gRNA transduction.)
The BRD4 gRNA was validated by performing qRT-PCR on RNA samples from treated cells with primers for either BRD2, BRD3, or BRD4, as described above.
Imatinib treatments of K562 cells
Cells were challenged with imatinib either after JQ1 treatment or BRD4 CRISPRi. For the former, we plated 200,000 cells each well of a 6-well plate with 2 mL of growth medium. Half of the wells received DMSO while the other half received 250 nM JQ1. Cells were incubated for 5 days, with fresh media changes on days 1, 2, and 3. On day 5, a portion of each well was stained for CD24. The remaining cells in each well were split between two new wells. One well continued to receive medium supplemented with DMSO, while the other was treated with medium containing imatinib mesylate at a concentration of 1 μM. After 48 hours, every well was stained for CD24 as well as annexin V and propidium iodide, for apoptotic activity. Cells undergoing BRD4 or non-targeted CRISPRi were split in two and treated with either DMSO or imatinib (1 μM) as described and in triplicate. The resulting data were processed with FlowJo. We set gates such that we could exclude debris but that we would capture both live and dying cells. This gate was used to calculate levels of annexin V and PI.
Cell cycle perturbation of K562 cells
We perturbed the cell cycle with lovastatin and nocodazole, two drugs classically used to synchronize cells in culture (Jackman and O’Connor, 2001), as well as the cyclin-dependent kinase inhibitors CVT-313 (Brooks et al., 1997) and RO-3306 (Vassilev et al., 2006). All drugs were dissolved in DMSO except nocodazole, which was dissolved in ethanol. We treated 200,000 cells per well in 6-well plates with either DMSO, ethanol (~0.4% final concentration), 250 nM JQ1, 12 μM lovastatin, 40 ng/μl nocodazole (in ethanol), 1 μM CVT-313, or 4.5 μM RO-3306. Media was refreshed every 48 hours. After 36 hours of treatment, we stained for CD24 levels and nuclear DNA content. We gated for live, single cells using the forward scatter (FSC) and side scatter channels (SSC). Univariate cell cycle analysis was performed with FlowJo. We confirmed that all drugs perturbed cell cycle by altering the proportions of cells in either G1 or G2/M phase (Figure S6G). CVT-313 caused a significant increase in G1 arrest cells (one-way ANOVA p < 0.05) and both nocodazole and RO-3306 caused significant G2 arrest (one-way ANOVA p < 0.01). While lovastatin has been reported to arrest cells in G1, in our hands it caused a significant decrease in G1 phase K562 cells (one-way ANOVA p <0.01). Cultures remained under drug treatment until five days had elapsed, at which point we measured CD24 levels and stained for apoptosis (Figure S6H). As before, we set gates to exclude debris to quantitate annexin V and PI, and measured CD24 in live cells gated on FSC and SSC. The G2 inhibitors, in particular, had very few cells in the FSC/SSC gate (typically below 5%).
SRT-tdTomato fluorescence validation
To test the fluorescence properties of the SRT-tdTomato construct, we transfected K562 cells as previously described with either 1 μg of pUC19 plasmid; 0.5 μg of PB-SRT-tdTomato plasmid and 0.5 μg pUC19; 0.5 μg of PB-SRT-tdTomato and 0.5 μg pBase plasmid; and 0.5 μg of PB-SRT-tdTomato and 0.5 μg HyPBase plasmid. Cells were allowed to expand for 8 days, after which fluorescence activity was assayed on an Attune NxT Flow Cytometer with an excitation wavelength of 561 nm. Flow cytometry data were visualized using FlowCal (Castillo-Hair et al., 2016). We also performed bulk RNA calling cards on HEK293T cells transfected with SRT-tdTomato with or without HyPBase plasmid. While these cells were not sorted based on fluorescence activity, the SRT library from cells transfected with both SRT and transposase were more complex and contained many more insertions than the library from cells receiving SRT alone (Methods S1).
In vivo scCC experiments
We separately packaged the PB-SRT-tdTomato and HyPBase constructs in AAV9 viral particles (Cammack et al., 2020) and delivered mixtures of both viruses to the developing mouse cortex via intracranial injections at P1. After 2–4 weeks, we dissected the cortex, dissociated it to a single cell suspension, performed FACS to isolate tdTomato-positive cells, and generated both scRNA-seq and scCC libraries.
Mouse cortical tissues were dissociated to single suspensions following a modification of previously published methods (Avey et al., 2018; Saxena et al., 2012). We incubated samples in a papain solution containing Hibernate-A with 5% v/v trehalose, 1x B-27 Supplement, 0.7 mM EDTA, 70 μM 2-mercaptoethanol, and 2.8 mg/ml papain. After incubation at 37°C, cells were treated with DNaseI, triturated through increasingly narrow fire-polished pipettes, and passed through a 40-micron filter prewetted with resuspension solution: Hibernate-A containing 5% v/v trehalose, 0.5% Ovomucoid Trypsin Inhibitor, 0.5% Bovine Serum Albumin (BSA), 33 μg/ml DNaseI (Worthington), and 1x B-27 Supplement. The filter was washed with 6 mL of resuspension solution. The resulting suspension was centrifuged for 4 minutes at 250 g. The supernatant was discarded. The pellet was then resuspended in 2 mL of resuspension solution and resuspended by gentle pipetting.
We eliminated subcellular debris using gradient centrifugation. We first prepared a working solution of 30% w/v OptiPrep Density Gradient Medium mixed with an equal volume of 1x Hank’s Balanced Salt Solution (HBSS) with 0.5% BSA. We then prepared solutions of densities 1.057,1.043,1.036, and 1.029 g/ml using by combining the working solution with resuspension solution at ratios of 0.33:0.67, 0.23:0.77, 0.18:0.82, and 0.13:0.87, respectively. We layered 1 mL aliquots of each solution in a 15 mL conical tube beginning with the densest solution on the bottom. The cell suspension was added last to the tube and centrifuged for 20 minutes at 800g at 12°C. The top layer was then aspirated and purified cells were isolated from the remaining layers. These cells were then resuspended in FACS buffer: 1x HBSS, 2 mM MgCl2, 2 mM MgSO4, 1.25 mM CaCl2,1 mM D-glucose, 0.02% BSA, and 5% v/v trehalose. Cells were centrifuged for 4 minutes at 250 g, the supernatant was discarded, and the pellet was resuspended in FACS buffer by gentle pipetting.
Cells were then sorted based on fluorescence activity. As a gating control, we analyzed cells from cortices injected with AAV9-PB-SRT-tdTomato only. We then collected cells from brains transfected with AAV9-PB-SRT-tdTomato and AAV9-HyPBase whose fluorescence values exceeded the gate. After sorting, cells were centrifuged for 3 minutes at 250 g. The supernatant was discarded and cells were resuspended in FACS buffer at a concentration appropriate for 10x Chromium 3’ scRNA-seq library preparation.
QUANTIFICATION AND STATISTICAL ANALYSIS
Statistical analyses were performed in Python 3.7.3 using SciPy (Virtanen et al., 2020) and statsmodels (Seabold and Perktold, 2010) as well as R 3.5.3 using the multcomp package (Hothorn et al., 2008). Flow cytometry figures were created with FlowJo. All other figures were created with Python using matplotlib (Hunter, 2007). Statistical details for individual experiments have been provided in the main text, figure legends, and Method Details. In general, we used 10–12 replicates for bulk RNA calling cards experiments; at least three separate libraries for single cell calling cards experiments; and three biological replicates for the K562 cell state experiments.
Interpreting calling card tracks
Calling card tracks depict recovered transposons as discrete data points. Each circle in the track is an independent transposition event whose genomic coordinate is along the x axis. The y axis is the number of reads supporting each insertion on a log10 scale. The total, genome-wide library size is shown at left (n). To better compare transpositions across libraries with different numbers of insertions, we also plotted the normalized local insertion rate as a density track.
Sequencing and analysis: bulk DNA CC libraries
DNA calling card libraries were sequenced on the Illumina HiSeq 2500 platform. To increasethe complexity of the library, PhiX was added at a final loading concentration of 50%. Reads were demultiplexed by the 3 base-pair barcode TAG followed by the end of the trans-poson terminal repeat, culminating with the piggyBac insertion site motif TTAA. Reads that had exact matches to these sequences were hard trimmed using cutadapt (Martin, 2011) with the following settings: -g “ATAGTTTACGCAGACTATCTTTCTAGGGTTAA”-minimum-length 1-discard-untrimmed -e 0-no-indels. Reads passing this filter were then trimmed of vector sequence along read 2 using cutadapt with the following settings: -g “AATCACTTAAGCCGGTAC””-minimum-length 1-discard-untrimmed -e 0-no-indels. The remaining reads were aligned to the human genome (build hg38) with NovoAlign and the following settings: -n 40 -o SAM -o SoftClip. Aligned reads were validated by confirming that they mapped adjacent to the insertion site motif. Successful reads were then converted to calling card format (.ccf.; see http://wiki.wubrowse.org/Calling_card) using custom programs (available at https://github.com/arnavm/calling_cards) and visualized on the WashU Epigenome Browser v46 (Zhou et al., 2011) (http://epigenomegateway.wustl.edu/legacy/).
Sequencing and analysis: bulk RNA CC libraries
Multiple calling card libraries were pooled together for sequencing on the Illumina HiSeq 2500 platform with 50% phiX. Reads were demultiplexed by the N7 index sequences added during the final PCR. Read 1 began with the 3 base-pair barcode followed by the end of the transposon terminal repeat, culminating with the insertion site motif (TTAA in the case of piggyBac; TA in the case of Sleeping Beauty) before entering the genome. piggyBac reads were checked for exact matches to the barcode, transposon sequence, and insertion site at the beginning of reads before being hard trimmed using cutadapt with the following settings: -g “ANNNGCGTCAATTTTACGCAGACTATCTTTCTAGGGTTAA”-minimum-length 1-discard-untrimmed -e 0-no-indels, where NNN is replaced with the primer barcode. Sleeping Beauty libraries were trimmed with the following settings: -g “ANNNTAAGTGTATGTAAACTTCCGACTTCAACTGTA”-minimum-length 1-discard-untrimmed -e 0-no-indels. Reads passing this filter were then trimmed of any trailing Nextera adaptor sequence, again using cutadapt and the following settings: -a “CTGTCTCTTATACACATCTCCGAGCCCACGAGACTNNNNNNNNNNTCTCGTATGCCGTCTTCTGCTTG”-minimum-length 1. The remaining reads were aligned to the human genome (build hg38) with NovoAlign and the following settings: -n 40 -o SAM -o SoftClip. Aligned reads were validated by confirming that they mapped adjacent to the insertion site motif. Successful reads were then converted to calling card format (.ccf.) and visualized on the WashU Epigenome Browser v46 (Zhou et al., 2011) (http://epigenomegateway.wustl.edu/legacy/).
Sequencing and analysis: scRNA-seq libraries
scRNA-seq libraries were sequenced on either Illumina HiSeq 2500 or NovaSeq machines. Reads were analyzed using 10x Genomics’ Cell Ranger with the following settings:-expect-cells = 6000-chemistry = SC3Pv2-localcores = 16-localmem = 30. The digital gene expression matrices from 10x were then further processed with scanpy (Wolf et al., 2018) for identification of highly variable genes, batch correction, dimensionality reduction, and Louvain clustering. Processed scRNA-seq datasets were stored as .loom files (http://loompy.org). We cross-referenced gene expression data with published datasets (Rosenberg et al., 2018; Rouillard et al., 2016; Saunders et al., 2018; Tasic et al., 2018; Zeisel et al., 2018) to assign cell types. The species mixing analysis was performed using Drop-seq_tools (Macosko et al., 2015).
Sequencing and analysis: scCC libraries
scCC libraries were sequenced on Illumina NextSeq 500 machines (v2 Reagent Cartridges) with 50% PhiX. We used the standard Illumina primers for read 1 and index 2 (BP10 and BP14, respectively), and custom primers for read 2 and index 1 (Table S4). Read 1 sequenced the cell barcode and unique molecular index of each self-reporting transcript. Read 2 began with GGTTAA (end of the piggyBac terminal repeat and insertion site motif) before continuing into the genome. Reads containing this exact hexamer were trimmed using cutadapt with the following settings: -g “ĜGTTAA”-minimum-length 1-discard-untrimmed -e 0-no-indels. Reads passing this filter were then trimmed of any trailing P7 adaptor sequence, again using cutadapt and with the following settings: -a “AGAGACTGGCAAGTACACGTCGCACTCACCATGANNNNNNNNNATCTCGTATGCCGTCTTCTGCTTG”-minimum-length 1. Reads passing these filters were aligned using 10x Genomics’ cellranger with the following settings:-expect-cells = 6000-nosecon-dary-chemistry = SC3Pv2-localcores = 16-localmem = 30. This workflow also managed barcode validation and collapsing of UMIs. Aligned reads were validated by verifying that they mapped adjacent to TTAA tetramers. Reads were then converted to calling card format (.ccf.). Finally, to minimize the presence of intermolecular artifacts, we required that each insertion must have been tagged by at least two different UMIs. We used the set of validated cell barcodes from each scRNA-seq library to demultiplex library-specific barcoded insertions from the scCC data. This approach requires no shared cell barcodes between individual scCC (and scRNA-seq) libraries. As a result, we excluded insertions from non-unique cell barcodes, which represented a very small number of total cells lost (<1% per multiplexed library). More details on these steps are also provided in the associated protocols. For the species mixing experiment, cells were classified as either human or mouse if at least 80% of self-reporting transcripts in that cell mapped to the human or mouse genome, respectively, and as a multiplet. The estimated multiplet rate was calculated by doubling the observed percentage of human-mouse multiplet, to account for human-human and mouse-mouse doublets.
Peak calling on calling card data
We called peaks in calling card data using Bayesian blocks (Scargle et al., 2013), a noise-tolerant algorithm for segmenting discrete, one-dimensional data, using the astropy implementation (Robitaille et al., 2013; The Astropy Collaboration et al., 2018). Bayesian blocks segments the genome into non-overlapping blocks where the density of calling card insertions is uniform. By comparing the segmentation against a background model, we were able to use Poisson statistics to assess whether a given block shows statistically significant enrichment for insertions. Let B = {b1, b2, ...bn} represent the set of blocks found by performing Bayesian block segmentation on all insertions from a TF-directed experiment (e.g., SP1-PBase). For each block bi, letxi be the number of insertions in that block in the TF-directed experiment. Similarly, let be the number of insertions in that block in the undirected experiment (e.g., PBase) normalized to the total number of insertions found in the TF-directed experiment. Then, for each block we calculated the Poisson p value of observing at least xi insertions assuming a Poisson distribution with expectation . We accepted all blocks that were significant beyond a particular p value threshold.
For the analysis of TF-directed insertions, either in bulk or in single cells, we added a pseudocount of 1 to yi, the number of insertions in block bi in the undirected experiment. We selected all blocks whose p values were significant at a Benjamini-Hochberg false discovery rate of 5% (Benjamini and Hochberg, 1995). We polished peak calls by merging statistically significant blocks that were within 250 bases of each other and by aligning block edges to coincide with TTAAs.
To identify BRD4 binding sites from undirected piggyBac insertions, we segmented those insertions using Bayesian blocks. For each block bi, we let xi denote the number of undirected insertions in that block. We also calculated , the expected number of insertions in block bi assuming piggyBac insertions were distributed uniformly across the genome. We did this by dividing the total number of TTAAs in the genome by the total number of undirected insertions, then multiplying this value by the number of TTAAs in block bi. Then, for each block we calculated the Poisson p value . We accepted all blocks that were significant beyond a particular p value threshold. Finally, we merged statistically-significant blocks that were within 12,500 bases of each other (Pott and Lieb, 2015; Whyte et al., 2013).
For the bulk PBase and HyPBase analysis, we used p value cutoffs of 10−30 and 10−62, respectively. (We chose these stringent thresholds to better resolve super-enhancers, which is our primary focus here.) For both in vitro and in vivo single cell HyPBase analyses, we used a p value cutoff of 10−9. To identify the differentially-bound loci between CD24high/CD24low K562 cells, as well as between upper and lower cortical layer neurons (i.e., Pou3f2/Brn-2, Bcl11b/Ctip2, and Foxp2), we used the same framework as described above for TF-directed analysis but did reciprocal enrichment analyses, where one dataset was used as the “experiment” track and the other as the “control” track, and vice-versa. This results in two one-sided hypothesis tests. When analyzing differential binding between upper and lower cortical layer neurons, we used a p value cutoff of 10−9. For the CD24high/CD24l°w K562 analysis, we restricted our hypothesis testing to BRD4-bound peaks found in the cell line mixing experiment that had at least 20 insertions between both groups. For each peak, we normalized the number of insertions from each population by a library-specific scaling factor and calculated the fold change in binding as log2 (Normalized CD24high insertions/Normalized CD24low insertions). We then took the smaller of the two p values and adjusted for multiple hypotheses at a Benjamini-Hochberg false discovery rate of 10%. This was plotted against the fold-change values to generate the volcano plot (colored circles indicate significant peaks after FDR correction). Data points were annotated when peaks overlapped or were near a single gene.
Density tracks were generated by taking the Bayesian blocks segmentation of each calling card dataset and, for each block, calculating the normalized number of insertions and dividing by the length of the block in kilobases (insertions per kilobase per million mapped insertions, or IPKM). This was plotted as a bedgraph file with smoothing applied in the WashU Epigenome Browser (25 pixel windows).
Custom code to facilitate these analyses is available online (https://github.com/arnavm/calling_cards). Detailed instructions on how to analyze calling card data are provided in the linked protocols.
TF binding analysis
We compared our TF-directed calling card peaks to publicly available ChIP-seq datasets. See below for more details on aligning and analyzing ChIP-seq data. We collated a list of unique transcription start sites (TSSs) by taking the 5’-most coordinates of RefSeq Curated genes in the hg38 build (UCSC Genome Browser). A list of CpG islands in HCT-116 and K562 cells and their methylation statuses were derived from previously-published Methyl-seq data (Brunner et al., 2009). We used the liftOvertool (Hinrichs et al., 2006) to convert coordinates from hg18 to hg38. We tested for enrichment in SP1 -directed insertions at TSSs, CpG islands, and unmethylated CpG islands with the G test of independence. We used the same test when testing enrichment of BAP1-directed insertions at TSSs. For motif discovery, we restricted our analysis to peaks less than 5,000 bp in length. We then used MEME-ChIP (Machanick and Bailey, with a dinucleotide shuffled control and the following settings: -dna -nmeme 600 -seed 0 -ccut 250 -meme-mod zoops -meme- minw 4 -meme-nmotifs 10. Motifs were aligned on the web version of Tomtom (Gupta et al., 2007) querying the “Vertebrates (In vivo and in silico)” database. We cross-referenced BAP1 scCC binding sites with publicly available BAP1 shRNA data (Yen et al., 2018), focusing on genes that showed a significant change in gene expression (adjusted p value < 0.05).
BRD4 sensitivity, specificity, and precision
We used a published BRD4 ChIP-seq dataset (McCleland et al., 2016) to identify BRD4-bound super-enhancers in HCT-116 cells, following previously-described methods (Loven et al., 2013; Whyte etal., 2013). We first called peaks using MACS 1.4.1 (Zhang et al., at p < 10−9 (using the parameters -p 1e-9-keep-dup = “auto” -f BAM -g hs -w -S-space = 50), then fed this into ROSE. We discarded artifactual loci less than 2,000 bp in size, yielding a final list of 162 super-enhancers. To evaluate sensitivity, we used BED- tools (Quinlan and Hall, 2010) to ask what fraction of piggyBac peaks, at various p value thresholds, overlapped the set of BRD4- bound super-enhancers. To measure specificity, we created a list of regions predicted to be insignificantly enriched (p > 0.1) for BRD4 ChIP-seq signal. We then sampled bases from this region such that the distribution of peak sizes was identical to that of the 162 super-enhancers. We sampled to 642x coverage, sufficient to cover each base with one peak, on average. We then asked what fraction of our piggyBac peaks overlapped these negative peaks and subtracted that value from 1 to obtain specificity. Finally, we calculated precision, or positive predictive value, by dividing the total number of detected super-enhancer peaks by the sum of the super-enhancer peaks and the false positive peaks.
Downsampling and replication analysis
When performing downsampling analyses on calling card insertions, we randomly sampled insertions without replacement and in proportion to the number of reads supporting each insertion. Peaks were called on the downsampled insertions at a range of p value cutoffs. Linear interpolation was performed using NumPy (Oliphant, 2015) and visualized using matplotlib (Hunter, 2007). Replication was assessed by splitting calling card insertions into two, approximately equal, files based on their barcode sequences. Each new file was treated as a single biological experiment. For each peak called from the joint set of all insertions, we plotted the number of normalized insertions (IPM) in one replicate on the x axis and the other replicate on y axis.
Analysis of external datasets
For ChlP-seq, ATAC-seq, and DNase-seq data, we aligned raw reads using Novoalign with the following settings for single-end data-sets: -o SAM -o SoftClip; while paired-end datasets were mapped with the additional flag -i PE 200–500. To calculate and visualize the fold enrichment in ChlP-seq signal at calling card peaks, we used deeptools (RamÍrez etal., 2016). We tested for significant mean enrichment in BRD4 ChlP-seq signal at piggyBac peaks over randomly shuffled control peaks with the Kolmogorov-Smirnov test. Chromatin state analysis was performed using ChromHMM as previously described (Ernst et al., 2011). For each chromatin state, we plotted the mean and standard deviation of the rate of normalized insertions (IPKM). We called peaks on SP1 ChlP-seq, DNase- and ATAC-seq data using MACS 2 with the following settings: -q 0.05-keep-dup = “auto.” For the analysis of “super-enhancers” from ATAC-seq data, we used control data derived from ATAC-seq on deproteinized human genomic DNA (Martins et al., 2018) and followed the same steps for calling super-enhancers from BRD4 ChIP-seq data (above). If necessary, files were converted to hg38 using liftOver (Hinrichs et al., 2006).
Cell state analyses of K562: scRNA-seq and scCC
Cell state analysis was performed on batch-corrected K562 scRNA-seq data derived from the HyPBase cell line mixing experiment. Principal components analysis (PCA) of single cell gene expression (Figure S5A) revealed CD24 as one of the top genes in PC1, while PC2 was enriched in hemoglobin genes, particularly the fetal-specific markers HBE1 and HBZ. Furthermore, the expression of top PC1 and PC2 genes appear to be anticorrelated: cells that strongly expressed CD24 are not likely to express HBZ, and vice-versa (Figure S5B), suggesting mutually exclusive states. We then scored cells based on the expression of VIM, TMSB4X, HBG1, and HBG2, revealing a gradient of cell states along a stem-like-to-differentiated axis (Figure 5A). We then modeled the distribution of this state score as a 3 component Gaussian mixture model, drawing cutoffs where adjacent Gaussian distributions intersected (Figure S5C). These cutoffs were then used to label cells as either stem-like (CD24high), differentiated (CD24low), or intermediate (Figure S5D). The expression levels of CD24 and HBZ, which were not used to score cells, showed high specificity for the stem-like and differentiated clusters (Figure S5E). Differentially bound peaks were called as described above.
Analysis of K562 experiments
We analyzed the JQ1 time course experiment using a two-way ANOVA with treatment and day as the independent variables and the percentage of CD24low cells as the dependent variable. For the analysis of annexin V levels in either JQ1- or DMSO-treated CD24high and CD24low cells, we used a three-way ANOVA with treatment, cell state, and day as independent variables. The imatinib experiments following either JQ1 or BRD4 CRISPRi pretreatment were analyzed using a two-way ANOVA with pretreatment (JQ1/DMSO or NT/BRD4 gRNA) and treatment as the independent variables. Multiple hypothesis correction was performed using Tukey’s honestly significant difference. For the cell cycle inhibitor experiment, data were analyzed using a one-way ANOVA with Dunnett’s post hoc test using either DMSO or EtOH (for RO-3306) as controls.
In vivo scCC analysis and validation
Single cell RNA-seq and single cell calling card libraries were prepared, sequenced, and analyzed as described above. Cell types were assigned based on the expression of key marker genes and cross-referenced with recent cortical scRNA-seq datasets (Rosenberg et al., 2018; Saunders et al., 2018; Tasic et al., 2018; Zeisel et al., 2018). BRD4-bound peak calls were validated by comparing to a previously published cortical H3K27ac ChIP-seq dataset (Stroud et al., 2017). Read alignment and statistical analysis were performed as described above.
The specificity of BRD4-bound gene expression in astrocytes and neurons was analyzed by first identifying all genes within 10,000 bases of astrocyte and neuronal BRD4 peaks. Although assigning an enhancerto its target gene is a difficult problem, using the nearest gene is common practice (Gasperini et al., 2019). To control for sensitivity of gene detection, we downsampled the neuron insertions to the same number of astrocyte insertions, then called peaks and identified nearby genes in this subset. We used gene expression data from a bulk RNA-seq dataset (Zhang et al., 2014) to compute the specificity of gene expression between astrocytes and neurons. We first discarded genes whose expression was not measured, and then set the value for genes with 0.1 FPKM to zero (to better distinguish non-expressed genes from lowly-expressed genes). Finally, for each gene gi, we calculated the specificity as AstrocyteFPKM(g/)/[AstrocyteFPKM(g;) + NeuronFPKM(g/)]. Thus, a value of 0 denotes a gene purely expressed in neurons, a value of 0.5 for a gene equally expressed in both cell types, and a value of 1 for a gene purely expressed in astrocytes. After accounting for differences in library size, we identified 383 genes near astrocyte peaks and 184 genes near neuron peaks, with 46 genes found in both datasets. We plotted the distributions of gene expression specificity for these gene sets. (Figure 4E). Gene Ontology analysis was performed on the same sets of genes using PANTHER (Mi et al., 2017) on the “GO biological process complete” database. Fisher’s exact test was used to compute p values, which were then subject to Bonferroni correction.
ADDITIONAL RESOURCES
We have created a number of protocols describing how to perform all aspects of bulk and single cell calling cards, from molecular biology and sequencing through data analysis and visualization. While these are listed in the Key Resources Table, we have also created a publicly accessible portal for easy access to all our workflows: https://www.protocols.io/groups/calling-cards/. Moving forward, this resource should contain the most up-to-date information.
KEY RESOURCES TABLE
| REAGENT or RESOURCE | SOURCE | IDENTIFIER |
|---|---|---|
| Antibodies | ||
| Brilliant Violet 421 anti-human CD24 Antibody (clone ML5) | BioLegend | Cat# 311121; RRID: AB_10915556 |
| Brilliant Violet 421 Mouse IgG2a, κ Isotype Ctrl Antibody (clone MOPC-173) | BioLegend | Cat# 400259; RRID: AB_10895919 |
| APC anti-human CD24 Antibody (clone ML5) | BioLegend | Cat# 311117; RRID: AB_1877150 |
| APC Rat IgG2a, κ Isotype Ctrl (clone RTK2758) | BioLegend | Cat# 400511; RRID: AB_2814702 |
| Bacterial and Virus Strains | ||
| AAV9-PB-SRT-tdTomato | Joseph D. Dougherty (Cammack et al., 2020) | N/A |
| AAV9-HyPBase | Joseph D. Dougherty (Cammack et al., 2020) | N/A |
| Lenti-dCas9-KRAB | This study | N/A |
| Lenti-BRD4-CRISPRi | This study | N/A |
| Lenti-NT-CRISPRi | This study | N/A |
| Chemicals, Peptides, and Recombinant Proteins | ||
| DMEM | GIBCO | Cat# 11965-084 |
| Antibiotic-Antimycotic (100X) | GIBCO | Cat# 15240-062 |
| FBS | Peak Serum | Cat# PS-FB3 |
| RPMI 1640 Medium | GIBCO | Cat# 11875-085 |
| Lipofectamine 3000 Transfection Reagent | Invitrogen | Cat# L3000015 |
| Trypsin-EDTA solution | Sigma-Aldrich | Cat# T4049 |
| DPBS, no calcium, no magnesium | GIBCO | Cat# 14190-136 |
| RNAprotect Cell Reagent | QIAGEN | Cat# 76526 |
| 2-Mercaptoethanol | GIBCO | Cat# 21985-023 |
| RNase-Free DNase Set | QIAGEN | Cat# 79254 |
| Maxima H Minus Reverse Transcriptase | Thermo Scientific | Cat# EP0752 |
| Advantage® UltraPure PCR Deoxynucleotide Mix | Takara Bio | Cat# 639125 |
| RNaseOUT Recombinant Ribonuclease Inhibitor | Invitrogen | Cat# 10777019 |
| TransIT®-LT1 Transfection Reagent | Mirus | Cat# MIR2304 |
| RNase H | New England BioLabs | Cat# M0297S |
| HiFi HotStart ReadyMix (2X) | Kapa Biosystems | Cat# KK2601 |
| AMPure XP beads | Beckman Coulter | Cat# A63880 |
| Puromycin dihydrochloride | Sigma-Aldrich | Cat# P8833 |
| Crystal violet | Sigma-Aldrich | Cat# C0775 |
| Methanol | Fisher Scientific | Cat# A452-4 |
| Formaldehyde | Fisher Scientific | Cat# BP531-500 |
| High Sensitivity D1000 Reagents | Agilent | Cat# 5067-5585 |
| Ficoll PM400 (Dry Powder) | GE Healthcare | Cat# 17030010 |
| NxGen® RNase Inhibitor | Lucigen | Cat# 30281-1 |
| Dynabeads MyOne Silane | Life Technologies | Cat# 37002D |
| IDTE pH 8.0 (1X TE Solution) | IDT | Cat# 11-05-01-13 |
| High Sensitivity D5000 Reagents | Agilent | Cat# 5067-5593 |
| NEBuffer 2 | New England BioLabs | Cat# B7002S |
| Buffer EB | QIAGEN | Cat# 19086 |
| Hibernate-A Medium | GIBCO | Cat# A1247501 |
| D-(+)-Trehalose dihydrate | Sigma-Aldrich | Cat# T9531 |
| B-27 Supplement (50X), serum free | GIBCO | Cat# 17504044 |
| 0.5M EDTA, pH 8.0 | Coming | Cat# 46-034-CI |
| Papain, Lyophilized | Worthington Biochemical | Cat# LS003118 |
| Deoxyribonuclease I, Filtered | Worthington Biochemical | Cat# LS002060 |
| Trypsin Inhbitor, Ovomucoid | Worthington Biochemical | Cat# LS003087 |
| Bovine Serum Albumin | Sigma-Aldrich | Cat# A9418 |
| OptiPrep Density Gradient Medium | Sigma-Aldrich | Cat# D1556 |
| HBSS (10X) | GIBCO | Cat# 14185052 |
| Magnesium chloride | Sigma-Aldrich | Cat# M4880 |
| Magnesium sulfate | Sigma-Aldrich | Cat# M2643 |
| Calcium chloride dihydrate | Sigma-Aldrich | Cat# C7902 |
| D-(+)-Glucose | Sigma-Aldrich | Cat# G7021 |
| Dimethyl sulfoxide (DMSO) | Sigma-Aldrich | Cat# D2650 |
| Cell Staining Buffer | BioLegend | Cat# 420201 |
| Annexin V Binding Buffer | BioLegend | Cat# 422201 |
| SuperScript VILO cDNA Synthesis Kit | Invitrogen | Cat# 11754250 |
| PowerUp SYBR Green Master Mix | Applied Biosystems | Cat# 25742 |
| (+)-JQ1 | Selleck Chemicals | Cat# S7110 |
| Propidium iodide (PI) | Invitrogen | Cat# P3566 |
| Hoechst 33342 | Thermo Scientific | Cat# 62249 |
| Blasticidin S HCl | GIBCO | Cat# A1113903 |
| Lenti-X Concentrator | Takara Bio | Cat# 631232 |
| Lipofectamine 2000 Transfection Reagent | Invitrogen | Cat# 11668030 |
| Polybrene Infection / Transfection Reagent | Sigma-Aldrich | Cat# TR-1003 |
| Esp3I | New England BioLabs | Cat# R0734S |
| T4 DNA Ligase | New England BioLabs | Cat# M0202S |
| IMDM | GIBCO | Cat# 12440046 |
| Penicillin-Streptomycin (10,000 U/mL) | GIBCO | Cat# 15140122 |
| Imatinib mesylate | Sigma-Aldrich | Cat# SML1027 |
| Lovastatin | Sigma-Aldrich | Cat# M2147 |
| Nocodazole | Sigma-Aldrich | Cat# M1404 |
| CVT-313 | Sigma-Aldrich | Cat# 238803 |
| RO-3306 | Sigma-Aldrich | Cat# SML0569 |
| Annexin V-FITC | BioLegend | Cat# 640905 |
| Critical Commercial Assays | ||
| Neon Transfection System 100 μL Kit | Invitrogen | Cat# MPK10025 |
| RNeasy Plus Mini Kit | QIAGEN | Cat# 74134 |
| Qubit RNA HS Assay Kit | Invitrogen | Cat# Q32852 |
| Qubit dsDNA HS Assay Kit | Invitrogen | Cat# Q32851 |
| Nextera XT DNA Library Preparation Kit | Illumina | Cat# FC-131-1024 |
| High Sensitivity D1000 ScreenTape | Agilent | Cat# 5067-5584 |
| Chromium Single Cell 3’ Library & Gel Bead Kit v2 | 10x Genomics | Cat# PN-120267 |
| High Sensitivity D5000 ScreenTape | Agilent | Cat# 5067-5592 |
| Nextera Mate Pair Library Prep Kit | Illumina | Cat# FC-132-1001 |
| Deposited Data | ||
| K562 CpG islands | Richard Myers | GEO: GSM1014203 |
| HCT-116 SP1 ChIP-seq | Richard Myers | ENCODE: ENCFF000PCT |
| HCT-116 CTCF ChIP-seq | Richard Myers | ENCODE: ENCFF000ZC |
| HCT-116 ChIP-seq input control (SP1, CTCF) | Richard Myers | ENCODE: ENCFF000PBO |
| HCT-116 BRD4 ChIP-seq | Ron Firestein | SRA: SRR2481799 |
| HCT-116 ChIP-seq input control (BRD4) | Ron Firestein | SRA: SRR2481800 |
| HCT-116 H3K27ac ChIP-seq | Bradley Bernstein | ENCODE: ENCFF082JPN, ENCFF176BXC |
| HCT-116 H3K4me1 ChIP-seq | Bradley Bernstein | ENCODE: ENCFF088BWP, ENCFF804MJI |
| HCT-116 H3K4me2 ChIP-seq | Bradley Bernstein | ENCODE: ENCFF936MMN, ENCFF93700L |
| HCT-116 H3K4me3 ChIP-seq | Bradley Bernstein | ENCODE: ENCFF1830ZI, ENCFF659FPR |
| HCT-116 H3K9me2 ChIP-seq | Bradley Bernstein | ENCODE: ENCFF7600ZN, ENCFF565FDP |
| HCT-116 H3K9me3 ChIP-seq | Bradley Bernstein | ENCODE: ENCFF578MDZ, ENCFF033X0G |
| HCT-116 H3K27me3 ChIP-seq | Bradley Bernstein | ENCODE: ENCFF281SBT, ENCFF124GII |
| HCT-116 H3K36me3 ChIP-seq | Bradley Bernstein | ENCODE: ENCFF850EAH, ENCFF312RKB |
| HCT-116 H3K79me2 ChIP-seq | Bradley Bernstein | ENCODE: ENCFF865KPW, ENCFF947YPU |
| HCT-116 H4K20me1 ChIP-seq | Bradley Bernstein | ENCODE: ENCFF070JDY, ENCFF334HHB |
| HCT-116 ChIP-seq input control (H3K27ac, H3K4me1, H3K4me2, H3K4me3, H3K9me2, H3K9me3, H3K27me3, H3K36me3, H3K79me2, H4K20me1) | Bradley Bernstein | ENCODE: ENCFF048Z0Q, ENCFF827YXC |
| HCT-116 H3K9ac ChIP-seq | Bradley Bernstein | ENCODE: ENCFF408RRT |
| HCT-116 ChIP-seq input control (H3K9ac) | Bradley Bernstein | ENCODE: ENCFF413RQG |
| K562 BRD4 ChIP-seq | Bradley Bernstein | ENCODE: ENCFF335PHG |
| K562 H3K27ac ChIP-seq | Bradley Bernstein | ENCODE: ENCFF000BXH |
| K562 ChIP-seq input control (BRD4, H3K27ac) | Bradley Bernstein | ENCODE: ENCFF000BWK |
| K562 SP1 ChIP-seq | Michael Snyder | ENCODE: ENCFF002DPL, ENCFF002EGC |
| K562 ChIP-seq input control (SP1) | Michael Snyder | ENCODE: ENCFF002EGI, ENCFF002EGA |
| HepG2 FOXA2 ChIP-seq | Richard Myers | ENCODE: ENCFF000PIX |
| HepG2 ChIP-seq input control (FOXA2) | Richard Myers | ENCODE: ENCFF000P0V |
| OCM-1A HyPBase DNA calling cards | Michael Onken | https://doi.org/10.1186/s12920-018-0424-0 |
| OCM-1A BAP1-HyPBase DNA calling cards | Michael Onken | https://doi.org/10.1186/s12920-018-0424-0 |
| OCM-1A RNA-seq (BAP1 and control shRNA) | Michael Onken | GEO: GSE110193 |
| Mouse cortex H3K27ac ChIP-seq | Michael Greenberg | SRA: SRR6129714 |
| Mouse cortex ChIP-seq input control (H3K27ac) | Michael Greenberg | SRA: SRR6129695 |
| K562 RNA Pol II ChIA-PET | Yijun Ruan | ENCODE: ENCFF000KYH |
| HCT-116 DNase-seq | John Stamatoyannopoulos | ENCODE: ENCFF001DCK |
| HCT-116 ATAC-seq | Sriharsa Pradhan | SRA: SRR5453778 |
| HCT-116 ATAC-seq control | Michael Guertin | GEO: GSE92674 |
| HCT-116 CpG islands | Richard Myers | GEO: GSM1014209 |
| Sequencing data and processed output | This study | GEO: GSE148448 |
| Experimental Models: Cell Lines | ||
| Neuro-2a (N2a) | ATCC | Cat# CCL-131 |
| K-562 | ATCC | Cat# CCL-243 |
| Hep G2 | ATCC | Cat# HB-8065 |
| OCM-1A | Michael Onken (Yen et al., 2018) | N/A |
| HCT 116 | ATCC | Cat# CCL-247 |
| 293T/17 [HEK293T/17] | ATCC | Cat# CRL-11268 |
| Experimental Models: Organisms/Strains | ||
| Mouse: C57BL/6J | Joseph D. Dougherty (Cammack et al., 2020) | N/A |
| Oligonucleotides | ||
| Primers and oligonucleotides | This study, see Table S4 | N/A |
| Recombinant DNA | ||
| pRM1024: PBase | This study | N/A |
| pRM1114: HyPBase | This study | N/A |
| pRM1023: SP1-PBase | This study | N/A |
| pRM1677: SP1 -HyPBase | This study | N/A |
| pRM1882: FOXA2-HyPBase | This study | N/A |
| pRM1863: BAP1-HyPBase | This study | N/A |
| pRM1304: PB-SRT-Puro | This study | RRID: Addgene_154884 |
| pRM1535: PB-SRT-tdTomato | This study | RRID: Addgene_154885 |
| pCMV(CAT)T7-SB100 | Zsuzsanna Izsvak | RRID: Addgene_34879 |
| pRM1665: SP1-SB100X | This study | RRID: Addgene_154887 |
| pRM1668: SB-SRT-Puro | This study | RRID: Addgene_154888 |
| pRM1217: AAV-HyPBase | Joseph D. Dougherty (Cammack et al., 2020) | N/A |
| pRM1648: AAV-PB-SRT-tdTomato | Joseph D. Dougherty (Cammack et al., 2020) | RRID: Addgene_154889 |
| pUC19 Vector | New England BioLabs | Cat# N3041S |
| Lenti-dCas9-KRAB-blast | Gary Hon | RRID: Addgene_89567 |
| sgOpti | Eric Lander & David Sabatini | RRID: Addgene_85681 |
| pMD2.G | Didier Trono | RRID: Addgene_12259 |
| psPAX2 | Didier Trono | RRID: Addgene_12260 |
| pRM1889: BRD4 CRISPRi plasmid | This study | RRID: Addgene_154890 |
| pRM1890: Non-targeting CRISPRi plasmid | Robi D. Mitra (Lalli et al., 2019) | RRID: Addgene_154891 |
| Software and Algorithms | ||
| cutadapt 1.16 | Martin, 2011 | RRID: SCR_011841 |
| NovoAlign 3 | Novocraft Technologies | RRID: SCR_014818 |
| Cell Ranger 2.1.0 | 10x Genomics | RRID: SCR_017344 |
| scanpy 1.3.7 | Wolf etal., 2018 | RRID: SCR_018139 |
| Drop-seq tools 1.11 | Macosko et al., 2015 | RRID: SCR_018142 |
| astropy 3.2.1 | Robitaille et al., 2013 | RRID: SCR_018148 |
| WashU Human Epigenome Browser 46 | Zhou et al., 2011 | RRID: SCR_006208 |
| MEME-ChIP 4.11.2 | Machanick and Bailey, 2011 | RRID: SCR_001783 |
| Tomtom 5.1.0 | Gupta et al., 2007 | RRID: SCR_001783 |
| MACS 1.4.1 | Zhang et al., 2008 | RRID: SCR_013291 |
| BEDTools 2.27.1 | Quinlan and Hall, 2010 | RRID: SCR_006646 |
| NumPy 1.17.2 | Oliphant, 2015 | RRID: SCR_008633 |
| SciPy 1.4.1 | Virtanen et al., 2020 | RRID: SCR_008058 |
| statsmodels 0.10.1 | Seabold and Perktold, 2010 | RRID: SCR_016074 |
| matplotlib 3.0.3 | Hunter, 2007 | RRID: SCR_008624 |
| deeptools 3.0.1 | Ramírez et al., 2016 | RRID: SCR_016366 |
| ChromHMM 1.15 | Ernst et al., 2011 | RRID: SCR_018141 |
| liftOver | Hinrichs et al., 2006 | RRID: SCR_018160 |
| FlowCal 1.2.0 | Castillo-Hair et al., 2016 | RRID: SCR_018140 |
| PANTHER 14.0 | Mi etal., 2017 | RRID: SCR_004869 |
| ROSE 0.1 | Whyte et al., 2013 & Lovén et al., 2013 | RRID: SCR_017390 |
| FlowJo Software for Mac Version 10 | Becton, Dickson and Company | RRID: SCR_008520 |
| Multcomp 1.4-12 | Hothorn et al., 2008 | RRID: SCR_018255 |
| Custom calling card code | This study | https://github.com/arnavm/calling_cards |
| Other | ||
| Qubit® 3.0 Fluorometer | Thermo Fisher | Cat# Q33216 |
| 4200 TapeStation System | Agilent | Cat# G2991AA |
| E220 Focused-ultrasonicator | Covaris | N/A |
| MasterCycler Pro PCR System | Eppendorf | Cat# 950030010 |
| Attune NxT Flow Cytometer | Thermo Fisher | N/A |
| CytoFLEX S | Beckman-Coulter | Cat# B75442 |
| QuantStudio | Applied Biosystems | Cat# A28567 |
| Protocol: Mammalian Calling Cards Quick Start Guide | This study | https://doi.org/10.17504/protocols.io.xurfnv6 |
| Protocol: Bulk Calling Cards Library Preparation | This study | https://doi.org/10.17504/protocols.io.xwhfpb6 |
| Protocol: Single Cell Calling Cards Library Preparation | This study | https://doi.org/10.17504/protocols.io.xwifpce |
| Protocol: Processing Bulk Calling Card Sequencing Data | This study | https://doi.org/10.17504/protocols.io.xwjfpcn |
| Protocol: Processing Single Cell Calling Card Sequencing Data | This study | https://doi.org/10.17504/protocols.io.4phgvj6 |
| Protocol: Calling Peaks on piggyBac Calling Card Data | This study | https://doi.org/10.17504/protocols.io.bb9xir7n |
| Protocol: Visualizing Calling Card Data on the WashU Epigenome Browser | This study | https://doi.org/10.17504/protocols.io.bca8ishw |
Supplementary Material
(A) Overlap of BRD4 super-enhancers, as inferred from BRD4 ChIP-seq, and “super-enhancers” inferred from open chromatin ATAC-seq peaks in HCT-116 cells. (B) Browser view of a BRD4 calling card peak that is not detected by ATAC-seq nor DNase-seq. (C) Comparison of transposase predilections for accessible chromatin. (D) Comparison of peak sizes and BRD4 ChIP-seq enrichment as called by DNase-seq, ATAC-seq, and undirected piggyBac calling cards, resepectively. Peaks are scaled to the median peak width (denoted by the start and end ticks) and are flanked by 3 kb in either direction. SE: super-enhancer; DHS: DNaseI hypersensitivity site; FC: fold change; kb: kilobase.
(A) Barnyard plot from scRNA-seq of human HCT-116 and mouse N2a cells. (B) Barnyard plot from scCC of HCT-116 and N2a cells without filtering (estimated multiplet rate of 25.1%). (C) Distribution of cell barcode purity from unfiltered scCC data. The x axis is the proportion of transcripts mapping to the human or mouse genomes. (D) Distribution of species purity after filtering scCC data. UMI: unique molecular indexes.
(A) Single cell expression levels of three marker genes in a mixed scRNA-seq library of human HCT-116 and K562 cells. (B) Distributions of genes per cell by cell type. (C) Distributions of transcripts per cell by cell type. (D) Distributions of HyPBase insertions recovered per cell in HCT-116 and K562 cells. (E-F) Mean BRD4 ChIP-seq signal at HyPBase peaks in HCT-116 and K562 cells, respectively, compared to randomly permuted peaks (KS test p < 10−9 in each case). (G-H) Reproducibility of normalized insertions deposited by HyPBase and recovered by scCC at BRD4 binding sites in HCT-116 and K562 cells, respectively. KS: Kolmogorov-Smirnov.
(A-B) Enrichment of SP1-HyPBase-directed insertions to TSSs, CGIs, and unmethylated CGIs in single HCT-116 and K562 cells, respectively (G test of independence p < 10−9). (C) Enrichment of BAP1-HyPBase-directed insertions TSSs in single OCM-1A cells (G test of independence p < 10−9). (D) Percent of BAP1 targets that increase expression upon BAP1 KD stratified by binding site (Fisher’s exact test p < 10−9). The dashed gray line represents the overall fraction of genes that increased expression upon KD. (E-H) Reproducibility of normalized insertions deposited by either HyPBase or TF-HyPBase fusions and recovered by scCC at TF binding sites, for the respective TF-cell line pair. (I-L) The distribution of recovered insertions per cell by construct (HyPBase versus TF-HyPBase) and cell type. TF: transcription factor; TSS: transcription start site; CGI: CpG island; KD: knockdown; IPM: insertions per million mapped insertions; n.s.: not significant.
(A) Principal component analysis of K562 scRNA-seq data. (B) Relative expression levels of highest-ranking genes in PC1 (top) and PC2 (bottom). (C) Gaussian mixture modeling of a cell-state score to define stem-like and differentiated K562 clusters. (D) Visualization of assigned cell clusters in the UMAP projection. (E) Specific expression of CD24 and HBZ in the stem-like and differentiated clusters, respectively. (F) Genome browser view of scCC in the stem-like and differentiated clusters alongside bulk BRD4 and H3K27ac ChIP-seq as well as RNA Pol II ChIA-PET. (G) Expression of VMP1 and PVT1 in the stem-like and differentiated clusters. PC: principal component.
(A) Annexin V staining in CD24high (red) or CD24low (blue) K562 cells treated with DMSO (dashed line) or JQ1 (solid line) over a seven-day time course. (B) Genome browser view of the CD24 locus. (C) qRT-PCR for MYC and CD24 expression levels in bulk K562 cells treated with JQ1 relative to DMSO-treated controls. (D) Expression changes in BRD2, BRD3, and BRD4 in K562 cells transduced with dCas9-KRAB and BRD4 CRISPRi gRNA (Welch’s t test p < 0.05). (E) Annexin V and PI co-staining in cells subjected to either non-targeting (top) or BRD4 (bottom) CRISPRi followed by either DMSO (left) or imatinib (right) treatment. (F) Average percent of annexin V/PI double positive cells in either the non-targeted or BRD4 CRISPRi replicates, stratified by either DMSO or imatinib exposure (two-way ANOVA p < 0.01). (G) Percent of K562 cells in either G1 (left) or G2 (right) phase after 36 hours of drug treatment (one-way ANOVA with Dunnett’s test *p < 0.05, **p < 0.01). (H) Percent of K562 cells in the CD24high state (left) after 5 days, and the percent of annexin V/PI double positive cells (right) at the same time point (p < 0.01 in each instance, one-way ANOVA with Dunnett’s test). Bars/points represent means; error bars denote standard deviations. Experiments were performed in triplicate. DMSO: dimethyl sulfoxide; n.s.: not significant; FC: fold change; SSC: side scatter; CRISPRi: CRISPR interference; NT: non-targeting; gRNA: guide RNA; IMA: imatinib; PI: propidium iodide.
(A) Mean H3K27ac ChIP-seq signal at HyPBase peaks in astrocytes compared to randomly permuted peaks (KS test p < 10−9) (B) GO term enrichment analysis of genes near astrocytic BRD4 binding sites. (C) Mean H3K27ac ChIP-seq signal at HyPBase peaks in neurons compared to randomly permuted peaks (KS test p < 10−9). (D) GO term enrichment analysis of genes near neuronal BRD4 binding sites. (B and D) The white line indicates the Bonferroni-adjusted p value threshold at α = 0.05. GO: Gene Ontology; KS: Kolmogorov-Smirnov; FC: fold change.
Highlights.
Novel genetic element can be mapped from mRNA and directed by DNA-binding proteins
Combined gene expression and transcription factor binding data from single cells
Mapped multiple transcription factors in several cell lines and the mouse cortex
Discovered bromodomain-dependent cell-state transitions in leukemic cells
ACKNOWLEDGMENTS
We thank Jessica Hoisington-Lopez and MariaLynn Crosby from the DNA Sequencing Innovation Lab at The Edison Family Center for Genome Sciences and Systems Biology for their sequencing expertise. Additional sequencing was performed by the Genome Technology Access Center (GTAC) in the Department of Genetics at Washington University School of Medicine. Flow cytometry was conducted and analyzed at Siteman Flow Cytometry Core at the Alvin J. Siteman Cancer Center at Washington University School of Medicine and Barnes-Jewish Hospital in St. Louis, MO. Both GTAC and the Flow Cytometry Core are supported by NCI Cancer Center Support Grant P30 CA91842 to the Siteman Cancer Center. GTAC is further supported by ICTS/ CTSA Grant UL1 TR000448 from the National Center for Research Resources (NCRR), a component of the National Institutes of Health (NIH), and NIH Road-map for Medical Research. This work was supported by the Hope Center Viral Vectors Core and a P30 Neuroscience Blueprint Interdisciplinary Center Core award to Washington University (P30 NS057105). This work was also supported by NIH grants R21 HG009750 (R.D.M. and S.A.M.), R01 GM126112 (S.A.M.), U01 MH109133 (J.D.D. and R.D.M.), and RF1 MH117070 (J.D.D. and R.D.M.) and a grant from the Children’s Discovery Institute (#MC-II-2016-533, R.D.M.). S.A.M. was supported by an Allen Distinguished Investigator Award (through the Paul G. Allen Frontiers Group), a Vallee Scholar Award, and a Sloan Research Fellowship. A.M. was supported by NIH grants T32 GM007200, T32 HG000045, and F30 HG009986, A.J.C by NIH T32 GM008151; M.J.V. by NIH F32 NS105363; M.A.L. by NIH T32 HL125241; and T.L. by NIH T32 GM007067. We thank Donald Conrad and Ben Hum-phreys for their advice and constructive feedback during this project, and Shirley McKinney for laboratory support. Last, we thank the three anonymous reviewers for their feedback and suggestions. This publication is solely the responsibility of the authors and does not necessarily represent the official view of NIH.
Footnotes
SUPPLEMENTAL INFORMATION
Supplemental Information can be found online at https://doi.org/10.1016/j.cell.2020.06.037.
DECLARATION OF INTERESTS
A.M., M.N.W., Z.Q., and R.D.M. have fled patent applications related to this work.
SUPPORTING CITATIONS
The following references appear in the Supplemental Information: Chen et al. (2017); Chiu et al. (2018); Ivics et al. (1997); Picelli et al. (2014); Sabari et al. (2018); Yen et al. (2004); Zheng et al. (2016).
REFERENCES
- Ai S, Xiong H, Li CC, Luo Y, Shi Q, Liu Y, Yu X, Li C, and He A (2019). Profiling chromatin states using single-cell itChIP-seq. Nat. Cell Biol. 21, 1164–1172. [DOI] [PubMed] [Google Scholar]
- Angermueller C, Clark SJ, Lee HJ, Macaulay IC, Teng MJ, Hu TX, Krueger F, Smallwood S, Ponting CP, Voet T, et al. (2016). Parallel single-cell sequencing links transcriptional and epigenetic heterogeneity. Nat. Methods 13, 229–232. [DOI] [PMC free article] [PubMed] [Google Scholar]
- Avey D, Sankararaman S, Yim AKY, Barve R, Milbrandt J, and Mitra RD (2018). Single-Cell RNA-Seq Uncovers a Robust Transcriptional Response to Morphine by Glia. Cell Rep. 24, 3619–3629. [DOI] [PMC free article] [PubMed] [Google Scholar]
- Benjamini Y, and Hochberg Y (1995). Controlling the False Discovery Rate: A Practical and Powerful Approach to Multiple Testing. J. R. Stat. Soc. Ser. B Methodol. 57, 289–300. [Google Scholar]
- Brandeis M, Frank D, Keshet I, Siegfried Z, Mendelsohn M, Nemes A, Temper V, Razin A, and Cedar H (1994). Sp1 elements protect a CpG island from de novo methylation. Nature 371, 435–438. [DOI] [PubMed] [Google Scholar]
- Brooks EE, Gray NS, Joly A, Kerwar SS, Lum R, Mackman RL, Norman TC, Rosete J, Rowe M, Schow SR, et al. (1997). CVT-313, a specific and potent inhibitor of CDK2 that prevents neointimal proliferation. J. Biol. Chem. 272,29207–29211. [DOI] [PubMed] [Google Scholar]
- Brunner AL, Johnson DS, Kim SW, Valouev A, Reddy TE, Neff NF, Anton E, Medina C, Nguyen L, Chiao E, et al. (2009). Distinct DNA methylation patterns characterize differentiated human embryonic stem cells and developing human fetal liver. Genome Res. 19, 1044–1056. [DOI] [PMC free article] [PubMed] [Google Scholar]
- Buenrostro JD, Giresi PG, Zaba LC, Chang HY, and Greenleaf WJ (2013). Transposition of native chromatin for fast and sensitive epigenomic profiling of open chromatin, DNA-binding proteins and nucleosome position. Nat. Methods 10, 1213–1218. [DOI] [PMC free article] [PubMed] [Google Scholar]
- Buenrostro JD, Wu B, Litzenburger UM, Ruff D, Gonzales ML, Snyder MP, Chang HY, and Greenleaf WJ (2015). Single-cell chromatin accessibility reveals principles of regulatory variation. Nature 523, 486–490. [DOI] [PMC free article] [PubMed] [Google Scholar]
- Cadinaños J, and Bradley A (2007). Generation of an inducible and optimized piggyBac transposon system. Nucleic Acids Res. 35, e87–e87. [DOI] [PMC free article] [PubMed] [Google Scholar]
- Cammack AJ, Moudgil A, Chen J, Vasek MJ, Shabsovich M, McCullough K, Yen A, Lagunas T, Maloney SE, He J, et al. (2020). Aviral toolkit for recording transcription factor-DNA interactions in live mouse tissues. Proc. Natl. Acad. Sci. USA 117, 10003–10014. [DOI] [PMC free article] [PubMed] [Google Scholar]
- Campagne A, Lee M-K, Zielinski D, Michaud A, Le Corre S, Dingli F, Chen H, Shahidian LZ, Vassilev I, Servant N, et al. (2019). BAP1 complex promotes transcription by opposing PRC1-mediated H2A ubiquitylation. Nat. Commun. 10, 348. [DOI] [PMC free article] [PubMed] [Google Scholar]
- Campbell JN, Macosko EZ, Fenselau H, Pers TH, Lyubetskaya A, Tenen D, Goldman M, Verstegen AMJ, Resch JM, McCarroll SA, et al. (2017). A molecular census of arcuate hypothalamus and median eminence cell types. Nat. Neurosci. 20, 484–496. [DOI] [PMC free article] [PubMed] [Google Scholar]
- Cao J, Packer JS, Ramani V, Cusanovich DA, Huynh C, Daza R, Qiu X, Lee C, Furlan SN, Steemers FJ, et al. (2017). Comprehensive single-cell transcriptional profiling of a multicellular organism. Science 357,661–667. [DOI] [PMC free article] [PubMed] [Google Scholar]
- Cao J, Cusanovich DA, Ramani V, Aghamirzaie D, Pliner HA, Hill AJ, Daza RM, McFaline-Figueroa JL, Packer JS, Christiansen L, et al. [DOI] [PMC free article] [PubMed] [Google Scholar]
- (2018). Joint profiling of chromatin accessibility and gene expression in thousands of single cells. Science 361, 1380–1385. [DOI] [PMC free article] [PubMed] [Google Scholar]
- Carbone M, Yang H, Pass HI, Krausz T, Testa JR, and Gaudino G (2013). BAP1 and cancer. Nat. Rev. Cancer 13, 153–159. [DOI] [PMC free article] [PubMed] [Google Scholar]
- Carter B, Ku WL, Kang JY, Hu G, Perrie J, Tang Q, and Zhao K (2019). Mapping histone modifications in low cell number and single cells using antibody-guided chromatin tagmentation (ACT-seq). Nat. Commun. 10, 3747. [DOI] [PMC free article] [PubMed] [Google Scholar]
- Castillo-Hair SM, Sexton JT, Landry BP, Olson EJ, Igoshin OA, and Tabor JJ (2016). FlowCal: A User-Friendly, Open Source Software Tool for Automatically Converting Flow Cytometry Data from Arbitrary to Calibrated Units. ACS Synth. Biol. 5, 774–780. [DOI] [PMC free article] [PubMed] [Google Scholar]
- Chen W, Jia Q, Song Y, Fu H, Wei G, and Ni T (2017). Alternative Poly-adenylation: Methods, Findings, and Impacts. Genomics Proteomics Bioinformatics 15, 287–300. [DOI] [PMC free article] [PubMed] [Google Scholar]
- Chiu AC, Suzuki HI, Wu X, Mahat DB, Kriz AJ, and Sharp PA (2018). Transcriptional Pause Sites Delineate Stable Nucleosome-Associated Premature Polyadenylation Suppressed by U1 snRNP. Mol. Cell 69, 648–663. [DOI] [PMC free article] [PubMed] [Google Scholar]
- Cho SW, Xu J, Sun R, Mumbach MR, Carter AC, Chen YG, Yost KE, Kim J, He J, Nevins SA, et al. (2018). Promoter of lncRNA Gene PVT1 Is a Tumor-Suppressor DNA Boundary Element. Cell 173, 1398–1412. [DOI] [PMC free article] [PubMed] [Google Scholar]
- Clark SJ, Argelaguet R, Kapourani C-A, Stubbs TM, Lee HJ, Alda-Catalinas C, Krueger F, Sanguinetti G, Kelsey G, Marioni JC, et al. [DOI] [PMC free article] [PubMed] [Google Scholar]
- (2018). scNMT-seq enables joint profiling of chromatin accessibility DNA methylation and transcription in single cells. Nat. Commun. 9, 781. [DOI] [PMC free article] [PubMed] [Google Scholar]
- Datlinger P, Rendeiro AF, Schmidl C, Krausgruber T, Traxler P, Klughammer J, Schuster LC, Kuchler A, Alpar D, and Bock C (2017). Pooled CRISPR screening with single-cell transcriptome readout. Nat. Methods 14, 297–301. [DOI] [PMC free article] [PubMed] [Google Scholar]
- Davis RL, Weintraub H, and Lassar AB (1987). Expression of a single transfected cDNA converts fibroblasts to myoblasts. Cell 51, 987–1000. [DOI] [PubMed] [Google Scholar]
- Delmore JE, Issa GC, Lemieux ME, Rahl PB, Shi J, Jacobs HM, Kastritis E, Gilpatrick T, Paranal RM, Qi J, et al. (2011). BET bromodomain inhibition as a therapeutic strategy to target c-Myc. Cell 146, 904–917. [DOI] [PMC free article] [PubMed] [Google Scholar]
- Dey A, Seshasayee D, Noubade R, French DM, Liu J, Chaurushiya MS, Kirkpatrick DS, Pham VC, Lill JR, Bakalarski CE, et al. (2012). Loss of the tumor suppressor BAP1 causes myeloid transformation. Science 337, 1541–1546. [DOI] [PMC free article] [PubMed] [Google Scholar]
- Dey SS, Kester L, Spanjaard B, Bienko M, and van Oudenaarden A (2015). Integrated genome and transcriptome sequencing of the same cell. Nat. Biotechnol. 33, 285–289. [DOI] [PMC free article] [PubMed] [Google Scholar]
- Di Micco R, Fontanals-Cirera B, Low V, Ntziachristos P, Yuen SK, Lovell CD, Dolgalev I, Yonekubo Y, Zhang G, Rusinova E, et al. (2014).Control of embryonic stem cell identity by BRD4-dependent transcriptional elongation of super-enhancer-associated pluripotency genes. Cell Rep. 9, 234–247. [DOI] [PMC free article] [PubMed] [Google Scholar]
- Ding S, Wu X, Li G, Han M, Zhuang Y, and Xu T (2005). Efficient transposition of the piggyBac (PB) transposon in mammalian cells and mice. Cell 122, 473–483. [DOI] [PubMed] [Google Scholar]
- Dixit A, Parnas O, Li B, Chen J, Fulco CP, Jerby-Arnon L, Marjanovic ND, Dionne D, Burks T, Raychowdhury R, et al. (2016). Perturb-Seq: Dissecting Molecular Circuits with Scalable Single-Cell RNA Profiling of Pooled Genetic Screens. Cell 167, 1853–1866.e17. [DOI] [PMC free article] [PubMed] [Google Scholar]
- ENCODE Project Consortium (2012). An integrated encyclopedia of DNA elements in the human genome. Nature 489, 57–74. [DOI] [PMC free article] [PubMed] [Google Scholar]
- Ernst J, Kheradpour P, Mikkelsen TS, Shoresh N, Ward LD, Epstein CB, Zhang X, Wang L, Issner R, Coyne M, et al. (2011). Mapping and analysis of chromatin state dynamics in nine human cell types. Nature 473, 43–49. [DOI] [PMC free article] [PubMed] [Google Scholar]
- Fan X, Kim H-J, Bouton D, Warner M, and Gustafsson J-Å (2008). Expression of liver X receptor β is essential for formation of superficial cortical layers and migration of later-born neurons. Proc. Natl. Acad. Sci. USA 105, 13445–13450. [DOI] [PMC free article] [PubMed] [Google Scholar]
- Filippakopoulos P, Qi J, Picaud S, Shen Y, Smith WB, Fedorov O, Morse EM, Keates T, Hickman TT, Felletar I, et al. (2010). Selective inhibition of BET bromodomains. Nature 468, 1067–1073. [DOI] [PMC free article] [PubMed] [Google Scholar]
- Fincher CT, Wurtzel O, de Hoog T, Kravarik KM, and Reddien PW (2018). Cell type transcriptome atlas for the planarian Schmidtea mediterranea. Science 360, eaaq1736-e1757. [DOI] [PMC free article] [PubMed] [Google Scholar]
- Fogarty NME, McCarthy A, Snijders KE, Powell BE, Kubikova N, Blakeley P, Lea R, Elder K, Wamaitha SE, Kim D, et al. (2017). Genome editing reveals a role for OCT4 in human embryogenesis. Nature 550, 67–73. [DOI] [PMC free article] [PubMed] [Google Scholar]
- Folkerts H, Wierenga AT, van den Heuvel FA, Woldhuis RR, Kluit DS, Jaques J, Schuringa JJ, and Vellenga E (2019). Elevated VMP1 expression in acute myeloid leukemia amplifies autophagy and is protective against ven-etoclax-induced apoptosis. Cell Death Dis. 10, 421. [DOI] [PMC free article] [PubMed] [Google Scholar]
- Fournier M, Bourriquen G, Lamaze FC, Côté MC, Fournier É, Joly-Beauparlant C, Caron V, Gobeil S, Droit A, and Bilodeau S (2016). FOXA and master transcription factors recruit Mediator and Cohesin to the core transcriptional regulatory circuitry of cancer cells. Sci. Rep. 6, 34962. [DOI] [PMC free article] [PubMed] [Google Scholar]
- Fulco CP, Munschauer M, Anyoha R, Munson G, Grossman SR, Perez EM, Kane M, Cleary B, Lander ES, and Engreitz JM (2016). Systematic mapping of functional enhancer-promoter connections with CRISPR interference. Science 354, 769–773. [DOI] [PMC free article] [PubMed] [Google Scholar]
- Fullwood MJ, Liu MH, Pan YF, Liu J, Xu H, Mohamed YB, Orlov YL, Velkov S, Ho A, Mei PH, et al. (2009). An oestrogen-receptor-α-bound human chromatin interactome. Nature 462, 58–64. [DOI] [PMC free article] [PubMed] [Google Scholar]
- Garcia-Carpizo V, Ruiz-Llorente S, Sarmentero J, Graña-Castro O, Pisano DG, and Barrero MJ (2018). CREBBP/EP300 bromodomains are critical to sustain the GATA1/MYC regulatory axis in proliferation. Epigenetics Chromatin 11, 30. [DOI] [PMC free article] [PubMed] [Google Scholar]
- Gasperini M, Hill AJ, McFaline-Figueroa JL, Martin B, Kim S, Zhang MD, Jackson D, Leith A, Schreiber J, Noble WS, et al. (2019). A Genome-wide Framework for Mapping Gene Regulation via Cellular Genetic Screens. Cell 176, 377–390. [DOI] [PMC free article] [PubMed] [Google Scholar]
- Gogol-Döring A, Ammar I, Gupta S, Bunse M, Miskey C, Chen W, Uckert W, Schulz TF, Izsvak Z, and Ivics Z (2016). Genome-wide Profiling Reveals Remarkable Parallels Between Insertion Site Selection Properties of the MLV Retrovirus and the piggyBac Transposon in Primary Human CD4(+) T Cells. Mol. Ther. 24, 592–606. [DOI] [PMC free article] [PubMed] [Google Scholar]
- Gonen N, Futtner CR, Wood S, Garcia-Moreno SA, Salamone IM, Samson SC, Sekido R, Poulat F, Maatouk DM, and Lovell-Badge R (2018). Sex reversal following deletion of a single distal enhancer of Sox9. Science 360, 1469–1473. [DOI] [PMC free article] [PubMed] [Google Scholar]
- Greil F, Moorman C, and van Steensel B (2006). DamID: Mapping of In Vivo Protein-Genome Interactions Using Tethered DNA Adenine Methyltransferase. Methods Enzymol. 410, 342–359. [DOI] [PubMed] [Google Scholar]
- Grosselin K, Durand A, Marsolier J, Poitou A, Marangoni E, Nemati F, Dahmani A, Lameiras S, Reyal F, Frenoy O, et al. (2019). High-throughput single-cell ChIP-seq identifies heterogeneity of chromatin states in breast cancer. Nat. Genet. 51, 1060–1066. [DOI] [PubMed] [Google Scholar]
- Gupta S, Stamatoyannopoulos JA, Bailey TL, and Noble WS (2007). Quantifying similarity between motifs. Genome Biol. 8, R24. [DOI] [PMC free article] [PubMed] [Google Scholar]
- Gurdon JB (2016). Cell Fate Determination by Transcription Factors. Curr. Top. Dev. Biol. 116, 445^54. [DOI] [PubMed] [Google Scholar]
- Hafler BP, Surzenko N, Beier KT, Punzo C, Trimarchi JM, Kong JH, and Cepko CL (2012). Transcription factor Olig2 defines subpopulations of retinal progenitor cells biased toward specific cell fates. Proc. Natl. Acad. Sci. USA 109, 7882–7887. [DOI] [PMC free article] [PubMed] [Google Scholar]
- Hainer SJ, Bošković A, McCannell KN, Rando OJ, and Fazzio TG (2019). Profiling of Pluripotency Factors in Single Cells and Early Embryos. Cell 177, 1319–1329. [DOI] [PMC free article] [PubMed] [Google Scholar]
- Han X, Wang R, Zhou Y, Fei L, Sun H, Lai S, Saadatpour A, Zhou Z, Chen H, Ye F, et al. (2018). Mapping the Mouse Cell Atlas by Microwell-Seq. Cell 172, 1091–1107. [DOI] [PubMed] [Google Scholar]
- Harada A, Maehara K, Handa T, Arimura Y, Nogami J, Hayashi-Taka-naka Y, Shirahige K, Kurumizaka H, Kimura H, and Ohkawa Y (2019). A chromatin integration labelling method enables epigenomic profiling with lower input. Nat. Cell Biol. 21, 287–296. [DOI] [PubMed] [Google Scholar]
- Hinrichs AS, Karolchik D, Baertsch R, Barber GP, Bejerano G, Clawson H, Diekhans M, Furey TS, Harte RA, Hsu F, et al. (2006). The UCSC Genome Browser Database: update 2006. Nucleic Acids Res. 34, D590–D598. [DOI] [PMC free article] [PubMed] [Google Scholar]
- Hnisz D, Abraham BJ, Lee TI, Lau A, Saint-Andre V, Sigova AA, Hoke HA, and Young RA (2013). Super-enhancers in the control of cell identity and disease. Cell 155, 934–947. [DOI] [PMC free article] [PubMed] [Google Scholar]
- Ho TT, Warr MR, Adelman ER, Lansinger OM, Flach J, Verovskaya EV, Figueroa ME, and Passegue E (2017). Autophagy maintains the metabolism and function of young and old stem cells. Nature 543, 205–210. [DOI] [PMC free article] [PubMed] [Google Scholar]
- Hothorn T, Bretz F, and Westfall P (2008). Simultaneous inference in general parametric models. Biom. J. 50, 346–363. [DOI] [PubMed] [Google Scholar]
- Hunter JD (2007). Matplotlib: A 2D Graphics Environment. Comput. Sci. Eng. 9, 90–95. [Google Scholar]
- Hwang B, Lee JH, and Bang D (2018). Single-cell RNA sequencing technologies and bioinformatics pipelines. Exp. Mol. Med. 50, 96. [DOI] [PMC free article] [PubMed] [Google Scholar]
- Ivics Z, Hackett PB, Plasterk RH, and Izsvak Z (1997). Molecular reconstruction of Sleeping Beauty, a Tc1-like transposon from fish, and its transposition in human cells. Cell 91, 501–510. [DOI] [PubMed] [Google Scholar]
- Jackman J, and O’Connor PM (2001). Methods for Synchronizing Cells at Specific Stages of the Cell Cycle. Curr. Protoc. Published online May 1, 2001. 10.1002/0471143030.cb0803s00. [DOI] [PubMed] [Google Scholar]
- Johnson DS, Mortazavi A, Myers RM, and Wold B (2007). Genome-wide mapping of in vivo protein-DNA interactions. Science 316, 1497–1502. [DOI] [PubMed] [Google Scholar]
- Kalhor R, Kalhor K, Mejia L, Leeper K, Graveline A, Mali P, and Church GM (2018). Developmental barcoding of whole mouse via homing CRISPR. Science 361, eaat9804. [DOI] [PMC free article] [PubMed] [Google Scholar]
- Karaiskos N, Wahle P, Alles J, Boltengagen A, Ayoub S, Kipar C, Kocks C, Rajewsky N, and Zinzen RP (2017). The Drosophila embryo at single-cell transcriptome resolution. Science 358, 194–199. [DOI] [PubMed] [Google Scholar]
- Kaya-Okur HS, Wu SJ, Codomo CA, Pledger ES, Bryson TD, Henik-off JG, Ahmad K, and Henik-off S (2019). CUT&Tag for efficient epigenomic profiling of small samples and single cells. Nat. Commun. 10, 1930. [DOI] [PMC free article] [PubMed] [Google Scholar]
- Kettlun C, Galvan DL, George AL Jr., Kaja A, and Wilson MH (2011). Manipulating piggyBac transposon chromosomal integration site selection in human cells. Mol. Ther. 19, 1636–1644. [DOI] [PMC free article] [PubMed] [Google Scholar]
- Kfoury N, Qi Z, Wilkinson M, Broestl L, Berrett K, Moudgil A, Sankararaman S, Chen X, Gertz J, Mitra R, et al. (2017). Brd4-bound enhancers drive critical sex differences in glioblastoma. bioRxiv. 10.1101/199059. [DOI] [PMC free article] [PubMed] [Google Scholar]
- Kind J, Pagie L, Ortabozkoyun H, Boyle S, de Vries SS, Janssen H, Amendola M, Nolen LD, Bickmore WA, and van Steensel B (2013). Single-cell dynamics of genome-nuclear lamina interactions. Cell 153, 178–192. [DOI] [PubMed] [Google Scholar]
- Kind J, Pagie L, deVries SS, Nahidiazar L, Dey SS, Bienko M, Zhan Y, Lajoie B, de Graaf CA, Amendola M, et al. (2015). Genome-wide maps of nuclear lamina interactions in single human cells. Cell 163, 134–147. [DOI] [PMC free article] [PubMed] [Google Scholar]
- Knoechel B, Roderick JE, Williamson KE, Zhu J, Lohr JG, Cotton MJ, Gillespie SM, Fernandez D, Ku M, Wang H, et al. (2014). An epigenetic mechanism of resistance to targeted therapy in T cell acute lymphoblastic leukemia. Nat. Genet. 46, 364–370. [DOI] [PMC free article] [PubMed] [Google Scholar]
- Kvon EZ, Kamneva OK, Melo US, Barozzi I, Osterwalder M, Mannion BJ, Tissieres V, Pickle CS, Plajzer-Frick I, Lee EA, et al. (2016). Progressive Loss of Function in a Limb Enhancer during Snake Evolution. Cell 167, 633–642. [DOI] [PMC free article] [PubMed] [Google Scholar]
- Lalli MA, Avey D, Dougherty JD, Milbrandt J, and Mitra RD (2019). High-throughput single-cell functional elucidation of neurodevelopmental disease-associated genes reveals convergent mechanisms altering neuronal differentiation. bioRxiv. 10.1101/862680. [DOI] [PMC free article] [PubMed] [Google Scholar]
- Lawrence M, Daujat S, and Schneider R (2016). Lateral Thinking: How His- tone Modifications Regulate Gene Expression. Trends Genet. 32, 42–56. [DOI] [PubMed] [Google Scholar]
- Lee TI, and Young RA (2013). Transcriptional regulation and its misregula- tion in disease. Cell 152, 1237–1251. [DOI] [PMC free article] [PubMed] [Google Scholar]
- Lee CS, Friedman JR, Fulmer JT, and Kaestner KH (2005). The initiation of liver development is dependent on Foxa transcription factors. Nature 435, 944–947. [DOI] [PubMed] [Google Scholar]
- Litzenburger UM, Buenrostro JD, Wu B, Shen Y, Sheffield NC, Kathiria A, Greenleaf WJ, and Chang HY (2017). Single-cell epigenomic variability reveals functional cancer heterogeneity. Genome Biol. 18, 15. [DOI] [PMC free article] [PubMed] [Google Scholar]
- Liu X, Huang J, Chen T, Wang Y, Xin S, Li J, Pei G, and Kang J (2008). Yamanaka factors critically regulate the developmental signaling network in mouse embryonic stem cells. Cell Res. 18, 1177–1189. [DOI] [PubMed] [Google Scholar]
- Lovén J, Hoke HA, Lin CY, Lau A, Orlando DA, Vakoc CR, Bradner JE, Lee TI, and Young RA (2013). Selective inhibition of tumor oncogenes by disruption of super-enhancers. Cell 153, 320–334. [DOI] [PMC free article] [PubMed] [Google Scholar]
- Macaulay IC, Haerty W, Kumar P, Li YI, Hu TX, Teng MJ, Goolam M, Saurat N, Coupland P, Shirley LM, et al. (2015). G&T-seq: parallel sequencing of single-cell genomes and transcriptomes. Nat. Methods 12, 519–522. [DOI] [PubMed] [Google Scholar]
- Machanick P, and Bailey TL (2011). MEME-ChIP: motif analysis of large DNA datasets. Bioinformatics 27, 1696–1697. [DOI] [PMC free article] [PubMed] [Google Scholar]
- Macleod D, Charlton J, Mullins J, and Bird AP (1994). Sp1 sites in the mouse aprt gene promoter are required to prevent methylation of the CpG is-land. Genes Dev. 8, 2282–2292. [DOI] [PubMed] [Google Scholar]
- Macosko EZ, Basu A, Satija R, Nemesh J, Shekhar K, Goldman M, Tirosh I, Bialas AR, Kamitaki N, Martersteck EM, et al. (2015). Highly Parallel Genome-wide Expression Profiling of Individual Cells Using Nanoliter Droplets. Cell 161, 1202–1214. [DOI] [PMC free article] [PubMed] [Google Scholar]
- Martin M (2011). Cutadapt removes adapter sequences from high- throughput sequencing reads. EMBnet. J. 17, 10–12. [Google Scholar]
- Martins AL, Walavalkar NM, Anderson WD, Zang C, and Guertin MJ (2018). Universal correction of enzymatic sequence bias reveals molecular signatures of protein/DNA interactions. Nucleic Acids Res. 46, e9. [DOI] [PMC free article] [PubMed] [Google Scholar]
- Matatall KA, Agapova OA, Onken MD, Worley LA, Bowcock AM, and Harbour JW (2013). BAP1 deficiency causes loss of melanocytic cell identity in uveal melanoma. BMC Cancer 13, 371. [DOI] [PMC free article] [PubMed] [Google Scholar]
- Mátés L, Chuah MKL, Belay E, Jerchow B, Manoj N, Acosta-Sanchez A, Grzela DP, Schmitt A, Becker K, Matrai J, et al. (2009). Molecular evolution of a novel hyperactive Sleeping Beauty transposase enables robust stable gene transfer in vertebrates. Nat. Genet. 41, 753–761. [DOI] [PubMed] [Google Scholar]
- McCleland ML, Mesh K, Lorenzana E, Chopra VS, Segal E, Watanabe C, Haley B, Mayba O, Yaylaoglu M, Gnad F, and Firestein R (2016). CCAT1 is an enhancer-templated RNA that predicts BET sensitivity in colorectal cancer. J. Clin. Invest. 126, 639–652. [DOI] [PMC free article] [PubMed] [Google Scholar]
- Mi H, Huang X, Muruganujan A, Tang H, Mills C, Kang D, and Thomas PD (2017). PANTHER version 11: expanded annotation data from Gene Ontology and Reactome pathways, and data analysis tool enhancements. Nucleic Acids Res. 45 (D1), D183–D189. [DOI] [PMC free article] [PubMed] [Google Scholar]
- Mizuguchi R, Sugimori M, Takebayashi H, Kosako H, Nagao M, Yoshida S, Nabeshima Y, Shimamura K, and Nakafuku M (2001). Combinatorial roles of olig2 and neurogenin2 in the coordinated induction of pan-neuronal and subtype-specific properties of motoneurons. Neuron 31, 757–771. [DOI] [PubMed] [Google Scholar]
- Molyneaux BJ, Arlotta P, Menezes JRL, and Macklis JD (2007). Neuronal subtype specification in the cerebral cortex. Nat. Rev. Neurosci. 8, 427–437. [DOI] [PubMed] [Google Scholar]
- Najafova Z, Tirado-Magallanes R, Subramaniam M, Hossan T, Schmidt G, Nagarajan S, Baumgart SJ, Mishra VK, Bedi U, Hesse E, et al. (2017). BRD4 localization to lineage-specific enhancers is associated with a distinct transcription factor repertoire. Nucleic Acids Res. 45, 127–141. [DOI] [PMC free article] [PubMed] [Google Scholar]
- Oliphant TE (2015). Guide to NumPy (Continuum Press). [Google Scholar]
- Peterson VM, Zhang KX, Kumar N, Wong J, Li L, Wilson DC, Moore R, McClanahan TK, Sadekova S, and Klappenbach JA (2017). Multi-plexed quantification of proteins and transcripts in single cells. Nat. Bio- technol. 35, 936–939. [DOI] [PubMed] [Google Scholar]
- Philipsen S, and Suske G (1999). A tale of three fingers: the family of mammalian Sp/XKLF transcription factors. Nucleic Acids Res. 27,2991–3000. [DOI] [PMC free article] [PubMed] [Google Scholar]
- Picelli S, Björklund AK, Reinius B, Sagasser S, Winberg G, and Sandberg R (2014). Tn5 transposase and tagmentation procedures for massively scaled sequencing projects. Genome Res. 24, 2033–2040. [DOI] [PMC free article] [PubMed] [Google Scholar]
- Ponnaluri VKC, Zhang G, Estève P-O, Spracklin G, Sian S, Xu SY, Benoukraf T, and Pradhan S (2017). NicE-seq: high resolution open chromatin profiling. Genome Biol. 18, 122. [DOI] [PMC free article] [PubMed] [Google Scholar]
- Pott S, and Lieb JD (2015). What are super-enhancers? Nat. Genet. 47, 8–12. [DOI] [PubMed] [Google Scholar]
- Pucilowska J, Puzerey PA, Karlo JC, Galan RF, and Landreth GE (2012). Disrupted ERK signaling during cortical development leads to abnormal progenitor proliferation, neuronal and network excitability and behavior, modeling human neuro-cardio-facial-cutaneous and related syndromes. J. Neurosci. 32, 8663–8677. [DOI] [PMC free article] [PubMed] [Google Scholar]
- Qi Z, Wilkinson MN, Chen X, Sankararaman S, Mayhew D, and Mitra RD (2017). An optimized, broadly applicable piggyBac transposon induction system. Nucleic Acids Res. 45, e55. [DOI] [PMC free article] [PubMed] [Google Scholar]
- Quinlan AR, and Hall IM (2010). BEDTools: a flexible suite of utilities for comparing genomic features. Bioinformatics 26, 841–842. [DOI] [PMC free article] [PubMed] [Google Scholar]
- Raff T, van der Giet M, Endemann D, Wiederholt T, and Paul M (1997). Design and testing of β-actin primers for RT-PCR that do not co-amplify processed pseudogenes. Biotechniques 23, 456–460. [DOI] [PubMed] [Google Scholar]
- RamÍrez F, Ryan DP, Grüning B, Bhardwaj V, Kilpert F, Richter AS, Heyne S, Dündar F, and Manke T (2016). deepTools2: a next generation web server for deep-sequencing data analysis. Nucleic Acids Res. 44 (W1), W160–W165. [DOI] [PMC free article] [PubMed] [Google Scholar]
- Rašin M-R, Gazula V-R, Breunig JJ, Kwan KY, Johnson MB, Liu-Chen S, Li H-S, Jan LY, Jan Y-N, Rakic P, and Sestan N (2007). Numb and Numbl are required for maintenance of cadherin-based adhesion and polarity of neural progenitors. Nat. Neurosci. 10, 819–827. [DOI] [PubMed] [Google Scholar]
- Rathert P, Roth M, Neumann T, Muerdter F, Roe J-S, Muhar M, Deswal S, Cerny-Reiterer S, Peter B, Jude J, et al. (2015). Transcriptional plasticity promotes primary and acquired resistance to BET inhibition. Nature 525, 543–547. [DOI] [PMC free article] [PubMed] [Google Scholar]
- Robitaille TP, Tollerud EJ, Greenfield P, Droettboom M, Bray E, Ald-croft T, Davis M, Ginsburg A, Price-Whelan AM, Kerzendorf WE, et al. (2013). Astropy: A community Python package for astronomy. Astron. Astrophys. 558, A33. [Google Scholar]
- Rodriguez-Fraticelli AE, Wolock SL, Weinreb CS, Panero R, Patel SH, Jankovic M, Sun J, Calogero RA, Klein AM, and Camargo FD (2018). Clonal analysis of lineage fate in native haematopoiesis. Nature 553, 212–216. [DOI] [PMC free article] [PubMed] [Google Scholar]
- Rooijers K, Markodimitraki CM, Rang FJ, de Vries SS, Chialastri A, de Luca KL, Mooijman D, Dey SS, and Kind J (2019). Simultaneous quantification of protein-DNA contacts and transcriptomes in single cells. Nat. Bio- technol. 37, 766–772. [DOI] [PMC free article] [PubMed] [Google Scholar]
- Ropolo A, Grasso D, Pardo R, Sacchetti ML, Archange C, Lo Re A, Seux M, Nowak J, Gonzalez CD, Iovanna JL, and Vaccaro MI (2007). The pancreatitis-induced vacuole membrane protein 1 triggers auto- phagy in mammalian cells. J. Biol. Chem. 282, 37124–37133. [DOI] [PubMed] [Google Scholar]
- Rosenberg AB, Roco CM, Muscat RA, Kuchina A, Sample P, Yao Z, Graybuck LT, Peeler DJ, Mukherjee S, Chen W, et al. (2018). Single-cell profiling of the developing mouse brain and spinal cord with split-pool barcoding. Science 360, 176–182. [DOI] [PMC free article] [PubMed] [Google Scholar]
- Rotem A, Ram O, Shoresh N, Sperling RA, Goren A, Weitz DA, and Bernstein BE (2015). Single-cell ChIP-seq reveals cell subpopulations defined by chromatin state. Nat. Biotechnol. 33, 1165–1172. [DOI] [PMC free article] [PubMed] [Google Scholar]
- Rouillard AD, Gundersen GW, Fernandez NF, Wang Z, Monteiro CD, McDermott MG, and Ma’ayan A (2016). The harmonizome: a collection of processed datasets gathered to serve and mine knowledge about genes and proteins. Database (Oxford) 2016, baw100. [DOI] [PMC free article] [PubMed] [Google Scholar]
- Sabari BR, Dall’Agnese A, Boija A, Klein IA, Coffey EL, Shrinivas K, Abraham BJ, Hannett NM, Zamudio AV, Manteiga JC, et al. (2018). Co-activator condensation at super-enhancers links phase separation and gene control. Science 361, eaar3958. [DOI] [PMC free article] [PubMed] [Google Scholar]
- Sanson KR, Hanna RE, Hegde M, Donovan KF, Strand C, Sullender ME, Vaimberg EW, Goodale A, Root DE, Piccioni F, and Doench JG (2018). Optimized libraries for CRISPR-Cas9 genetic screens with multiple modalities. Nat. Commun. 9, 5416. [DOI] [PMC free article] [PubMed] [Google Scholar]
- Saridey SK, Liu L, Doherty JE, Kaja A, Galvan DL, Fletcher BS, and Wilson MH (2009). PiggyBac transposon-based inducible gene expression in vivo after somatic cell gene transfer. Mol. Ther. 17, 2115–2120. [DOI] [PMC free article] [PubMed] [Google Scholar]
- Saunders A, Macosko EZ, Wysoker A, Goldman M, Krienen FM, de Rivera H, Bien E, Baum M, Bortolin L, Wang S, et al. (2018). Molecular Diversity and Specializations among the Cells of the Adult Mouse Brain. Cell 174, 1015–1030. [DOI] [PMC free article] [PubMed] [Google Scholar]
- Saxena A, Wagatsuma A, Noro Y, Kuji T, Asaka-Oba A, Watahiki A, Gurnot C, Fagiolini M, Hensch TK, and Carninci P (2012). Trehalose- enhanced isolation of neuronal sub-types from adult mouse brain. Biotechniques 52, 381–385. [DOI] [PMC free article] [PubMed] [Google Scholar]
- Scargle JD, Norris JP, Jackson B, and Chiang J (2013). Studies in astronomical time series analysis. Vi. Bayesian block representationS. Astrophys. J. 764, 167. [Google Scholar]
- Scheiber IF, and Dringen R (2013). Astrocyte functions in the copper homeostasis of the brain. Neurochem. Int. 62, 556–565. [DOI] [PubMed] [Google Scholar]
- Schuster DJ, Dykstra JA, Riedl MS, Kitto KF, Belur LR, McIvor RS, Elde RP, Fairbanks CA, and Vulchanova L (2014). Biodistribution of ad-eno-associated virus serotype 9 (AAV9) vector after intrathecal and intravenous delivery in mouse. Front. Neuroanat. 8, 42. [DOI] [PMC free article] [PubMed] [Google Scholar]
- Sdelci S, Rendeiro AF, Rathert P, You W, Lin JG, Ringler A, Hofstätter G, Moll HP, Gürtl B, Farlik M, et al. (2019). MTHFD1 interaction with BRD4 links folate metabolism to transcriptional regulation. Nat. Genet. 51, 990–998. [DOI] [PMC free article] [PubMed] [Google Scholar]
- Seabold S, and Perktold J (2010). statsmodels: Econometric and statistical modeling with python. Proceedings of the 9th Python in Science Conference, Vol. 57 (SciPy Society), p. 61. [Google Scholar]
- Shapiro E, Biezuner T, and Linnarsson S (2013). Single-cell sequencing-based technologies will revolutionize whole-organism science. Nat. Rev. Genet. 14,618–630. [DOI] [PubMed] [Google Scholar]
- Shema E, Bernstein BE, and Buenrostro JD (2019). Single-cell and single-molecule epigenomics to uncover genome regulation at unprecedented resolution. Nat. Genet. 51, 19–25. [DOI] [PubMed] [Google Scholar]
- Sloan CA, Chan ET, Davidson JM, Malladi VS, Strattan JS, Hitz BC, Gabdank I, Narayanan AK, Ho M, Lee BT, et al. (2016). ENCODE data at the ENCODE portal. Nucleic Acids Res. 44 (D1), D726–D732. [DOI] [PMC free article] [PubMed] [Google Scholar]
- Stoeckius M, Hafemeister C, Stephenson W, Houck-Loomis B, Chattopadhyay PK, Swerdlow H, Satija R, and Smibert P (2017). Simultaneous epitope and transcriptome measurement in single cells. Nat. Methods 14, 865–868. [DOI] [PMC free article] [PubMed] [Google Scholar]
- Stoeckius M, Zheng S, Houck-Loomis B, Hao S, Yeung BZ, Mauck WM 3rd, Smibert P, and Satija R (2018). Cell Hashing with barcoded anti-bodies enables multiplexing and doublet detection for single cell genomics. Genome Biol. 19, 224. [DOI] [PMC free article] [PubMed] [Google Scholar]
- Stroud H, Su SC, Hrvatin S, Greben AW, Renthal W, Boxer LD, Nagy MA, Hochbaum DR, Kinde B, Gabel HW, and Greenberg ME (2017). Early-Life Gene Expression in Neurons Modulates Lasting Epigenetic States. Cell 171, 1151–1164. [DOI] [PMC free article] [PubMed] [Google Scholar]
- Sun J, Ramos A, Chapman B, Johnnidis JB, Le L, Ho Y-J, Klein A, Hofmann O, and Camargo FD (2014). Clonal dynamics of native haemato- poiesis. Nature 514, 322–327. [DOI] [PMC free article] [PubMed] [Google Scholar]
- Svensson V, Vento-Tormo R, and Teichmann SA (2018). Exponential scaling of single-cell RNA-seq in the past decade. Nat. Protoc. 13, 599–604. [DOI] [PubMed] [Google Scholar]
- Takahashi K, and Yamanaka S (2006). Induction of pluripotent stem cells from mouse embryonic and adult fibroblast cultures by defined factors. Cell 126,663–676. [DOI] [PubMed] [Google Scholar]
- Tasic B, Yao Z, Graybuck LT, Smith KA, Nguyen TN, Bertagnolli D, Goldy J, Garren E, Economo MN, Viswanathan S, et al. (2018). Shared and distinct transcriptomic cell types across neocortical areas. Nature 563, 72–78. [DOI] [PMC free article] [PubMed] [Google Scholar]
- The Astropy Collaboration, Price-Whelan AM, Sipöcz BM, Günther HM, Lim PL, Crawford SM, Conseil S, Shupe DL, Craig MW, Dencheva N, et al. (2018). The Astropy Project: Building an inclusive, open-science project and status of the v2.0 core package. Astron. J. 156, 123. [Google Scholar]
- Vassilev LT, Tovar C, Chen S, Knezevic D, Zhao X, Sun H, Heimbrook DC, and Chen L (2006). Selective small-molecule inhibitor reveals critical mitotic functions of human CDK1. Proc. Natl. Acad. Sci. USA 103, 10660–10665. [DOI] [PMC free article] [PubMed] [Google Scholar]
- Virtanen P, Gommers R, Oliphant TE, Haberland M, Reddy T, Cournapeau D, Burovski E, Peterson P, Weckesser W, Bright J, et al. ; SciPy 1.0 Contributors (2020). SciPy 1.0: fundamental algorithms for scientific computing in Python. Nat. Methods 17, 261–272. [DOI] [PMC free article] [PubMed] [Google Scholar]
- Vogel MJ, Peric-Hupkes D, and van Steensel B (2007). Detection of in vivo protein-DNA interactions using DamID in mammalian cells. Nat. Protoc. 2, 1467–1478. [DOI] [PubMed] [Google Scholar]
- Wang H, Johnston M, and Mitra RD (2007). Calling cards for DNA-binding proteins. Genome Res. 17, 1202–1209. [DOI] [PMC free article] [PubMed] [Google Scholar]
- Wang W, Lin C, Lu D, Ning Z, Cox T, Melvin D, Wang X, Bradley A, and Liu P (2008). Chromosomal transposition of PiggyBac in mouse embryonic stem cells. Proc. Natl. Acad. Sci. USA 105, 9290–9295. [DOI] [PMC free article] [PubMed] [Google Scholar]
- Wang H, Mayhew D, Chen X, Johnston M, and Mitra RD (2011). Calling Cards enable multiplexed identification of the genomic targets of DNA-binding proteins. Genome Res. 21, 748–755. [DOI] [PMC free article] [PubMed] [Google Scholar]
- Wang H, Mayhew D, Chen X, Johnston M, and Mitra RD (2012a). “Calling cards” for DNA-binding proteins in mammalian cells. Genetics 190, 941–949. [DOI] [PMC free article] [PubMed] [Google Scholar]
- Wang X, Spandidos A, Wang H, and Seed B (2012b). PrimerBank: a PCR primer database for quantitative gene expression analysis, 2012 update. Nucleic Acids Res. 40, D1144–D1149. [DOI] [PMC free article] [PubMed] [Google Scholar]
- Wang Q, Xiong H, Ai S, Yu X, Liu Y, Zhang J, and He A (2019). Co-BATCH for High-Throughput Single-Cell Epigenomic Profiling. Mol. Cell 76, 206–216.e7. [DOI] [PubMed] [Google Scholar]
- Whyte WA, Orlando DA, Hnisz D, Abraham BJ, Lin CY, Kagey MH, Rahl PB, Lee TI, and Young RA (2013). Master transcription factors and mediator establish super-enhancers at key cell identity genes. Cell 153, 307–319. [DOI] [PMC free article] [PubMed] [Google Scholar]
- Wilson MH, Coates CJ, and George AL Jr. (2007). PiggyBac transposon-mediated gene transfer in human cells. Mol. Ther. 15, 139–145. [DOI] [PubMed] [Google Scholar]
- Wolf FA, Angerer P, and Theis FJ (2018). SCANPY: large-scale single-cell gene expression data analysis. Genome Biol. 19, 15. [DOI] [PMC free article] [PubMed] [Google Scholar]
- Wu SC-Y, Meir Y-JJ, Coates CJ, Handler AM, Pelczar P, Moisyadi S, and Kaminski JM (2006). piggyBac is a flexible and highly active transposon as compared to sleeping beauty, Tol2, and Mos1 in mammalian cells. Proc. Natl. Acad. Sci. USA 103, 15008–15013. [DOI] [PMC free article] [PubMed] [Google Scholar]
- Xie S, Duan J, Li B, Zhou P, and Hon GC (2017). Multiplexed Engineering and Analysis of Combinatorial Enhancer Activity in Single Cells. Mol. Cell 66, 285–299.e5. [DOI] [PubMed] [Google Scholar]
- Yen L, Svendsen J, Lee J-S, Gray JT, Magnier M, Baba T, D’Amato RJ, and Mulligan RC (2004). Exogenous control of mammalian gene expression through modulation of RNA self-cleavage. Nature 431, 471–476. [DOI] [PubMed] [Google Scholar]
- Yen M, Qi Z, Chen X, Cooper JA, Mitra RD, and Onken MD (2018). Transposase mapping identifies the genomic targets of BAP1 in uveal melanoma. BMC Med. Genomics 11, 97. [DOI] [PMC free article] [PubMed] [Google Scholar]
- Yoshida J, Akagi K, Misawa R, Kokubu C, Takeda J, and Horie K (2017). Chromatin states shape insertion profiles of the piggyBac, Tol2 and Sleeping Beauty transposons and murine leukemia virus. Sci. Rep. 7, 43613. [DOI] [PMC free article] [PubMed] [Google Scholar]
- Yu H, Mashtalir N, Daou S, Hammond-Martel I, Ross J, Sui G, Hart GW, Rauscher FJ 3rd, Drobetsky E, Milot E, et al. (2010). The ubiquitin carboxyl hydrolase BAP1 forms a ternary complex with YY1 and HCF-1 and is a critical regulator of gene expression. Mol. Cell. Biol. 30, 5071–5085. [DOI] [PMC free article] [PubMed] [Google Scholar]
- Yusa K, Zhou L, Li MA, Bradley A, and Craig NL (2011). A hyperactive piggyBac transposase for mammalian applications. Proc. Natl. Acad. Sci. USA 108, 1531–1536. [DOI] [PMC free article] [PubMed] [Google Scholar]
- Zeisel A, Murñoz-Manchado AB, Codeluppi S, Lönnerberg P, La Manno G, Juréus A, Marques S, Munguba H, He L, Betsholtz C, et al. (2015). Brain structure. Cell types in the mouse cortex and hippocampus revealed by single-cell RNA-seq. Science 347, 1138–1142. [DOI] [PubMed] [Google Scholar]
- Zeisel A, Hochgerner H, Lönnerberg P, Johnsson A, Memic F, van der Zwan J, Häring M, Braun E, Borm LE, La Manno G, et al. (2018). Molecular Architecture of the Mouse Nervous System. Cell 174, 999–1014.e22. [DOI] [PMC free article] [PubMed] [Google Scholar]
- Zhang Y, Liu T, Meyer CA, Eeckhoute J, Johnson DS, Bernstein BE, Nusbaum C, Myers RM, Brown M, Li W, and Liu XS (2008). Model-based analysis of ChIP-Seq (MACS). Genome Biol. 9, R137. [DOI] [PMC free article] [PubMed] [Google Scholar]
- Zhang Y, Chen K, Sloan SA, Bennett ML, Scholze AR, O’Keeffe S, Phatnani HP, Guarnieri P, Caneda C, Ruderisch N, et al. (2014). An RNA-sequencing transcriptome and splicing database of glia, neurons, and vascular cells of the cerebral cortex. J. Neurosci. 34, 11929–11947. [DOI] [PMC free article] [PubMed] [Google Scholar]
- Zheng D, Liu X, and Tian B (2016). 3’READS+, a sensitive and accurate method for 3’ end sequencing of polyadenylated RNA. RNA 22, 1631–1639. [DOI] [PMC free article] [PubMed] [Google Scholar]
- Zheng GXY, Terry JM, Belgrader P, Ryvkin P, Bent ZW, Wilson R, Ziraldo SB, Wheeler TD, McDermott GP, Zhu J, et al. (2017). Massively parallel digital transcriptional profiling of single cells. Nat. Commun. 8,14049. [DOI] [PMC free article] [PubMed] [Google Scholar]
- Zhou X, Maricque B, Xie M, Li D, Sundaram V, Martin EA, Koebbe BC, Nielsen C, Hirst M, Farnham P, et al. (2011). The Human Epigenome Browser at Washington University. Nat. Methods 8, 989–990. [DOI] [PMC free article] [PubMed] [Google Scholar]
- Zhu X, Zuo H, Maher BJ, Serwanski DR, LoTurco JJ, Lu QR, and Nishiyama A (2012). Olig2-dependent developmental fate switch of NG2 cells. Development 139, 2299–2307. [DOI] [PMC free article] [PubMed] [Google Scholar]
- Zuber J, Shi J, Wang E, Rappaport AR, Herrmann H, Sison EA, Ma- goon D, Qi J, Blatt K, Wunderlich M, et al. (2011). RNAi screen identifies Brd4 as a therapeutic target in acute myeloid leukaemia. Nature 478,524–528. [DOI] [PMC free article] [PubMed] [Google Scholar]
Associated Data
This section collects any data citations, data availability statements, or supplementary materials included in this article.
Supplementary Materials
(A) Overlap of BRD4 super-enhancers, as inferred from BRD4 ChIP-seq, and “super-enhancers” inferred from open chromatin ATAC-seq peaks in HCT-116 cells. (B) Browser view of a BRD4 calling card peak that is not detected by ATAC-seq nor DNase-seq. (C) Comparison of transposase predilections for accessible chromatin. (D) Comparison of peak sizes and BRD4 ChIP-seq enrichment as called by DNase-seq, ATAC-seq, and undirected piggyBac calling cards, resepectively. Peaks are scaled to the median peak width (denoted by the start and end ticks) and are flanked by 3 kb in either direction. SE: super-enhancer; DHS: DNaseI hypersensitivity site; FC: fold change; kb: kilobase.
(A) Barnyard plot from scRNA-seq of human HCT-116 and mouse N2a cells. (B) Barnyard plot from scCC of HCT-116 and N2a cells without filtering (estimated multiplet rate of 25.1%). (C) Distribution of cell barcode purity from unfiltered scCC data. The x axis is the proportion of transcripts mapping to the human or mouse genomes. (D) Distribution of species purity after filtering scCC data. UMI: unique molecular indexes.
(A) Single cell expression levels of three marker genes in a mixed scRNA-seq library of human HCT-116 and K562 cells. (B) Distributions of genes per cell by cell type. (C) Distributions of transcripts per cell by cell type. (D) Distributions of HyPBase insertions recovered per cell in HCT-116 and K562 cells. (E-F) Mean BRD4 ChIP-seq signal at HyPBase peaks in HCT-116 and K562 cells, respectively, compared to randomly permuted peaks (KS test p < 10−9 in each case). (G-H) Reproducibility of normalized insertions deposited by HyPBase and recovered by scCC at BRD4 binding sites in HCT-116 and K562 cells, respectively. KS: Kolmogorov-Smirnov.
(A-B) Enrichment of SP1-HyPBase-directed insertions to TSSs, CGIs, and unmethylated CGIs in single HCT-116 and K562 cells, respectively (G test of independence p < 10−9). (C) Enrichment of BAP1-HyPBase-directed insertions TSSs in single OCM-1A cells (G test of independence p < 10−9). (D) Percent of BAP1 targets that increase expression upon BAP1 KD stratified by binding site (Fisher’s exact test p < 10−9). The dashed gray line represents the overall fraction of genes that increased expression upon KD. (E-H) Reproducibility of normalized insertions deposited by either HyPBase or TF-HyPBase fusions and recovered by scCC at TF binding sites, for the respective TF-cell line pair. (I-L) The distribution of recovered insertions per cell by construct (HyPBase versus TF-HyPBase) and cell type. TF: transcription factor; TSS: transcription start site; CGI: CpG island; KD: knockdown; IPM: insertions per million mapped insertions; n.s.: not significant.
(A) Principal component analysis of K562 scRNA-seq data. (B) Relative expression levels of highest-ranking genes in PC1 (top) and PC2 (bottom). (C) Gaussian mixture modeling of a cell-state score to define stem-like and differentiated K562 clusters. (D) Visualization of assigned cell clusters in the UMAP projection. (E) Specific expression of CD24 and HBZ in the stem-like and differentiated clusters, respectively. (F) Genome browser view of scCC in the stem-like and differentiated clusters alongside bulk BRD4 and H3K27ac ChIP-seq as well as RNA Pol II ChIA-PET. (G) Expression of VMP1 and PVT1 in the stem-like and differentiated clusters. PC: principal component.
(A) Annexin V staining in CD24high (red) or CD24low (blue) K562 cells treated with DMSO (dashed line) or JQ1 (solid line) over a seven-day time course. (B) Genome browser view of the CD24 locus. (C) qRT-PCR for MYC and CD24 expression levels in bulk K562 cells treated with JQ1 relative to DMSO-treated controls. (D) Expression changes in BRD2, BRD3, and BRD4 in K562 cells transduced with dCas9-KRAB and BRD4 CRISPRi gRNA (Welch’s t test p < 0.05). (E) Annexin V and PI co-staining in cells subjected to either non-targeting (top) or BRD4 (bottom) CRISPRi followed by either DMSO (left) or imatinib (right) treatment. (F) Average percent of annexin V/PI double positive cells in either the non-targeted or BRD4 CRISPRi replicates, stratified by either DMSO or imatinib exposure (two-way ANOVA p < 0.01). (G) Percent of K562 cells in either G1 (left) or G2 (right) phase after 36 hours of drug treatment (one-way ANOVA with Dunnett’s test *p < 0.05, **p < 0.01). (H) Percent of K562 cells in the CD24high state (left) after 5 days, and the percent of annexin V/PI double positive cells (right) at the same time point (p < 0.01 in each instance, one-way ANOVA with Dunnett’s test). Bars/points represent means; error bars denote standard deviations. Experiments were performed in triplicate. DMSO: dimethyl sulfoxide; n.s.: not significant; FC: fold change; SSC: side scatter; CRISPRi: CRISPR interference; NT: non-targeting; gRNA: guide RNA; IMA: imatinib; PI: propidium iodide.
(A) Mean H3K27ac ChIP-seq signal at HyPBase peaks in astrocytes compared to randomly permuted peaks (KS test p < 10−9) (B) GO term enrichment analysis of genes near astrocytic BRD4 binding sites. (C) Mean H3K27ac ChIP-seq signal at HyPBase peaks in neurons compared to randomly permuted peaks (KS test p < 10−9). (D) GO term enrichment analysis of genes near neuronal BRD4 binding sites. (B and D) The white line indicates the Bonferroni-adjusted p value threshold at α = 0.05. GO: Gene Ontology; KS: Kolmogorov-Smirnov; FC: fold change.
Data Availability Statement
Data generated in this study have been submitted to the Gene Expression Ominbus (GEO) with accession number GSE148448. All code used to analyze the data is available online at https://github.com/arnavm/calling_cards.