

SUMMARY
Several HIV-1 and SIV vaccine candidates have been shown to provide partial protection against viral challenges in rhesus macaques. However, the protective efficacy of vaccine-elicited polyclonal antibodies has not previously been demonstrated in adoptive transfer studies in nonhuman primates. In this study, we show that passive transfer of purified antibodies from vaccinated macaques can protect naive animals against SIVmac251 challenges. We vaccinated 30 rhesus macaques with Ad26-SIV Env/Gag/Pol and SIV Env gp140 protein vaccines and assessed the induction of antibody responses and a putative protective signature. This signature included multiple antibody functions and correlated with upregulation of interferon pathways in vaccinated animals. Adoptive transfer of purified IgG from the vaccinated animals with the most robust protective signatures provided partial protection against SIVmac251 challenges in naive recipient rhesus macaques. These data demonstrate the protective efficacy of purified vaccine-elicited antiviral antibodies in this model, even in the absence of virus neutralization.
Graphical Abstract
In brief
Alter et al. demonstrate that vaccine-elicited antiviral antibodies can partially protect subjects from viral challenge in a non-human primate model of HIV infection. To demonstrate this proof-of-concept, the authors purify and transfer polyclonal IgG from vaccinated macaques showing a putative protective antbody signature to naïve indivduals. The signature, defined by systems serology, includes multiple antibody functions in the absence of broadly neutralizing antibodies.
INTRODUCTION
The development of a safe and effective vaccine will likely be critical to achieve a durable end to the global HIV-1 pandemic (Fauci, 2017). Several vaccine candidates have shown protective efficacy against viral challenges in nonhuman primates, but whether antibodies are actually responsible for the observed protection, as opposed to cellular, innate, or other immune responses, remains to be determined.
The “holy grail” of the HIV-1 vaccine field has been to generate a vaccine candidate that can induce high titers of broadly neutralizing antibodies. However, no HIV-1 vaccine candidates have to date been able to induce broadly neutralizing antibodies in nonhuman primates or humans (Escolano et al., 2019; Pauthner et al., 2017; Pauthner et al., 2019). Nevertheless, several vaccine candidates have been shown to generate functional non-neutralizing antibodies (Barouch et al., 2018; Bekker et al., 2018; Roederer et al., 2014) that have statistically correlated with protection (Barouch et al., 2015; Barouch et al., 2013; Barouch et al., 2018; Haynes et al., 2012; Roederer et al., 2014), although mechanistic correlates of protection remain unclear (Plotkin, 2008, 2010). In particular, it has not yet been proven whether non-neutralizing antibodies can protect in adoptive transfer studies in nonhuman primates. This is particularly relevant given the lack of efficacy of an ALVAC/gp120 vaccine designed to induce V1V2-binding antibodies in humans (https://www.niaid.nih.gov/news-events/experimental-hiv-vaccine-regimen-ineffective-preventing-hiv), which underscores the need for a more detailed understanding of vaccine-elicited antibodies.
To investigate the protective potential of functional non-neutralizing antibodies elicited by prototype Ad26/Env vaccines, we assessed functional antibody profiles in two previously reported vaccine studies against SIVmac251 and SHIV-SF162P3 challenges and integrated these data to define a common protective signature. This signature successfully predicted protective efficacy in a new cohort of 30 Ad26/Env vaccinated rhesus macaques against SIVmac251 challenges. Adoptive transfer of purified IgG from the vaccinated macaques that exhibited the most robust protective signature protected naive rhesus macaques against SIVmac251 challenges, demonstrating the protective efficacy of vaccine-elicited antibodies.
RESULTS
Common protective signature
We profiled humoral immune responses in two previously published Ad26/Env vaccine studies that showed protective efficacy against SIVmac251 (Barouch et al., 2015) and SHIV-SF162P3 (Barouch et al., 2018) challenges in rhesus macaques. We assessed over 300 features of Env-specific antibody responses in each animal by systems serology (Chung et al., 2015), including antibody titers, binding breadth, polyfunctionality, glycosylation profiles, Fc receptor binding, and complement binding (Chung et al., 2015; Darrah et al., 2007; Gomez-Roman et al., 2006). Antigen-specific IFN-γ ELISPOT responses were also included in the analysis (Barouch et al., 2018).
To define immune responses that correlated with protective efficacy in these prior studies, unsupervised hierarchical clustering of immunologic profiles was assessed at peak immunity and demonstrated substantial heterogeneity among vaccinated animals (Fig. S1A, C). Supervised principal component analyses (PCA) showed clustering of animals based on the vaccine regimen received (Fig. S1B, D). Following feature reduction using Elastic-Net / Least Absolute Shrinkage and Selection Operator (LASSO) regularization and penalty-based feature down-selection, a partial least squares regression (PLSR) analysis (Cawley and Talbot, 2010; Galindo-Prieto et al., 2014; Wold et al., 2001; Zou and Hastie, 2005) was performed to define the minimal set of immune features that tracked with animals that resisted infection (Ackerman et al., 2018; Chung et al., 2015; Gunn et al., 2018; Lu et al., 2016). In the SIV study, four features were sufficient to separate animals that were more resistant to infection (yellow dots) compared with those that were more susceptible to infection (blue dots) (Fig. S2A, B; R2 = 0.71, root-mean-squared error (RMSE) = 0.53, P < 0.0001). In the SHIV study, the LASSO/PLSR model identified five features that were critical in separating animals based on protective efficacy (Fig. S2C, D; R2 = 0.46, RMSE = 0.73, P < 0.0001).
To define a common protective signature across both studies, we determined the minimal set of immunologic features that predicted protective efficacy. We reasoned that a composite signature would likely be more strongly predictive of protective efficacy than any single immunologic feature. This approach is conceptually analogous to gene set enrichment analysis (GSEA) for transcriptomic analyses, in which a composite signature or pathway is typically more strongly associated with a given phenotype than is of any individual gene. To accomplish this, the relationship between each immunologic feature and protection, defined as the number of challenges required for infection, was weighted for importance in driving separation in the PLSR models. A stepwise-forward approach was then used to determine the correlates that best predicted protective efficacy concordantly in both studies.
A total of 12 immune features were selected as most relevant (Fig. 1A), including antigen-specific cellular immune responses by ELISPOT assays, antibody-dependent NK cell degranulation (CD107a), antibody binding breadth, antibody polyfunctionality, antibody-dependent cellular phagocytosis (ADCP), Fc receptor profiles, and glycan profiles. Two glycan features in this set of immune features (G1B_2, G2S1) were negatively correlated with protective efficacy. These 12 features were concentrated in the protected animals in both of the previous studies (Fig. 1B, C). Moreover, receiver operative characteristic (ROC) curves modeled on vaccine profile data from the SIV study (Fig. 1D) predicted protective efficacy in that study (red curve; AUC=0.83, P<0.001) and cross-predicted protective efficacy in the SHIV study (blue curve; AUC=0.85, P<0.001). Similarly, a model based on data from the SHIV study (Fig. 1E) was able to predict protective efficacy in that study (red curve; AUC=0.82, P=0.001) and cross-predict protective efficacy in the SIV study (blue curve; AUC=0.71, P=0.041).
Figure 1. Common protective signature for SIV and SHIV.
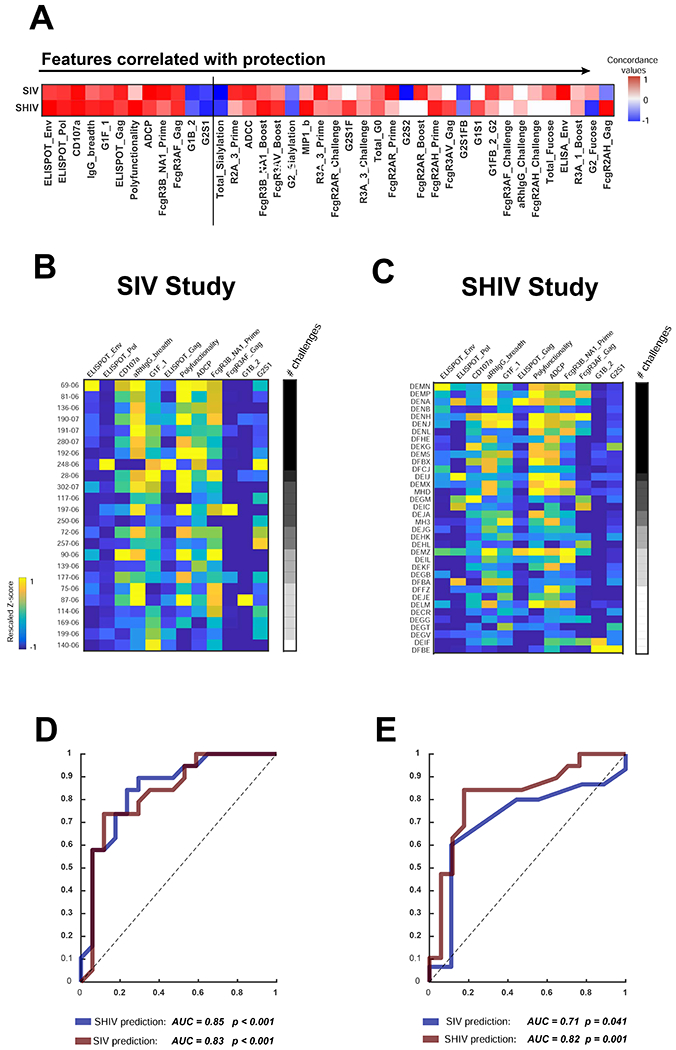
(A) Immunologic features correlated with protective efficacy in two previously published SIVmac251 and SHIV-SF162P3 challenge studies (Barouch et al., 2015; Barouch et al., 2018). Features most strongly correlated with protection in both studies are ranked from left to right, and the 12 features most strongly correlated with protection are shown to the left of the vertical line. Red to blue shading highlights a positive or negative correlations, respectively, with protective efficacy. The heat map shows the selected 12 immune features across all animals ranked by the number of challenges required for infection in the (B) SIVmac251 and (C) SHIV-SF162P3 studies. Black to white shading on the right of each heatmap depicts the number of challenges required for infection for each animal. Yellow to blue shading represents the magnitude (positive to negative) of each response in the animals. Receiver operative characteristic (ROC) curves showing predictive and cross-predictive capacity of the minimal correlates within study (red) or across study (blue) are shown in the (D) SIVmac251 and (E) SHIV-SF162P3 studies. To estimate the statistical significance of ROC curve generated by the model, we employed two types of permutation tests: shuffling the outcome labels across the samples and through the use of a random dataset. Each dataset was then used to test the likelihood of obtaining a model prediction accuracy by chance. Each permutation test performed 104 times to generate an empirical null distribution and an exact p-value. See also Figs. S1, S2.
Vaccine study
We next validated this putative protective signature in a prospective vaccine study. We primed 30 rhesus macaques with 3x10¹⁰ viral particles (vp) Ad26-SIVsmE543 Env/Gag/Pol vectors at weeks 0 and 12 and boosted the animals with 3x10¹⁰ vp Ad26 vectors combined with 0.25 mg purified SIVmac32H Env gp140 protein with alum adjuvant at weeks 24 and 50 (Abbink et al., 2007; Barouch et al., 2015; Barouch et al., 2012). Env-specific binding antibody responses by ELISA were observed in all vaccinated animals following immunization and peaked at weeks 28 and 54 after the Env gp140 protein boosts (Fig. 2A). TZM-bl based pseudovirus neutralization assays showed neutralizing antibody activity against a T cell line-adapted SIVmac251 clone but essentially no neutralizing antibody activity against a resistant SIVmac251.30 clone that is representative of the SIVmac251 challenge stock (Fig. 2B). Moreover, no neutralization was observed against the actual SIVmac251 challenge virus (data not shown). Similarly, neutralizing antibody activity was observed against a T cell line-adapted SIVsmE660 clone but essentially no neutralizing antibody activity against a resistant SIVsmE660 clone (Fig. 2B). Detailed antibody profiles consisting of over 300 immunologic features were also assessed in each animal at week 54 (Fig. S3). Striking heterogeneity was observed in the magnitude (Fig. 2C) and composition (Fig. 2D) of functional antibody profiles in the vaccinated animals, despite relatively comparable binding antibody titers (Fig. 2A). IgG depletion of plasma abrogated most functional antibody activity (data not shown). Gag-, Env-, and Pol-specific cellular immune responses were also detected by IFN-γ ELISPOT assays following vaccination (Fig. 3). One animal was vaccinated as a backup and was not included in the subsequent challenge study.
Figure 2. Antibody responses following Ad26/Env vaccination.
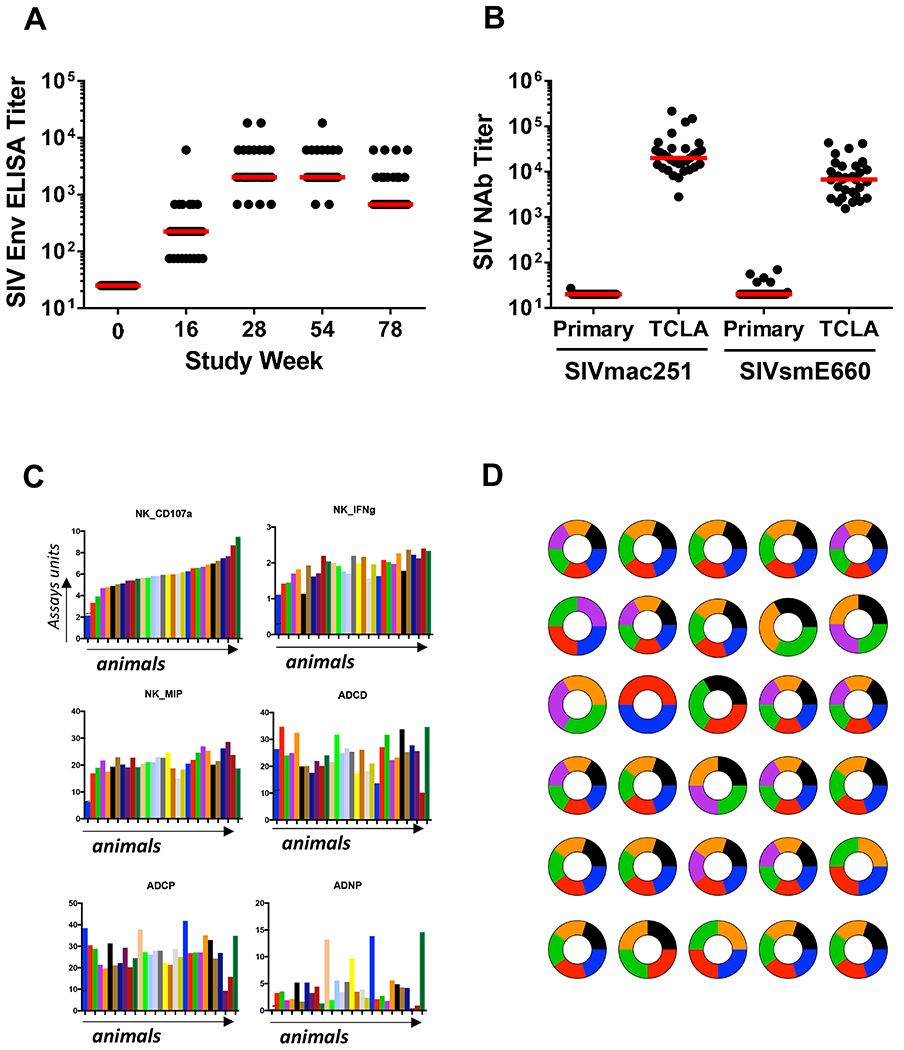
(A) ELISA titers to SIVmac32H Env gp140 following vaccination. (B) Neutralizing antibody responses to primary and T cell line-adapted clones of SIVmac251 and SIVsmE660 at week 54. (C) Functional antibody responses at week 54, including antibody-dependent NK cell activation (CD107a, IFN-γ, MIP-1β), antibody-dependent complement deposition (ADCD), antibody-dependent cellular phagocytosis (ADCP), and antibody-dependent neutrophil phagocytosis (ADNP). The dashed lines represent limits of quantitation of the assays. (D) Heterogeneity of polyfunctional antibody responses in individual animals reflected in pie charts. Pie charts represent the level of vaccine-induced NK cell degranulation (CD107a, orange), vaccine-induced NK cell cytokine secretion (IFN-g, black), vaccine induced NK cell chemokine secretion (MIP-1b, green), antibody dependent cellular phagocytosis (ADCP, blue), antibody dependent neutrophil phagocytosis (ADNP, reds), and antibody dependent complement deposition (ADCD). Data were normalized and individuals over the median were scored as 1 and individuals below the median were scored as 0 to create the pie charts. See also Fig. S3.
Figure 3. Cellular immune responses in vaccinated macaques.
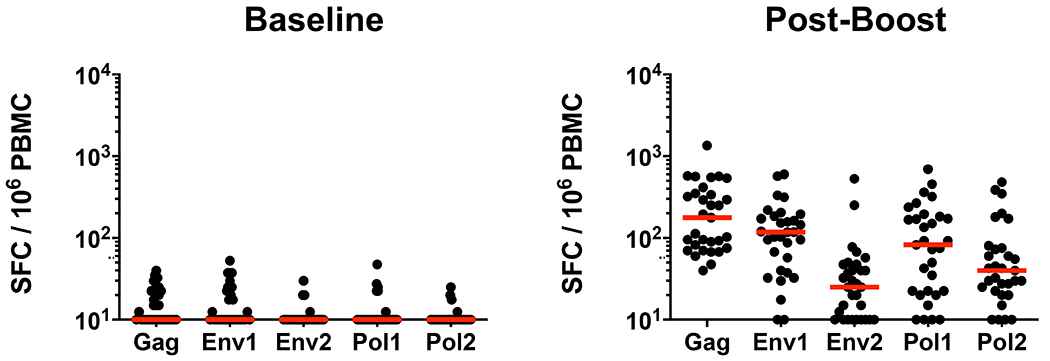
IFN-γ ELISPOT responses to Gag, Env1, Env2, Pol1, and Pol2 peptide pools in macaques at baseline and at week 4 following the boost immunization. Spot-forming cells (SFC) per million peripheral blood mononuclear cells (PBMC) are shown. The dotted lines represent limits of quantitation of the assay. Red bars indicate median responses.
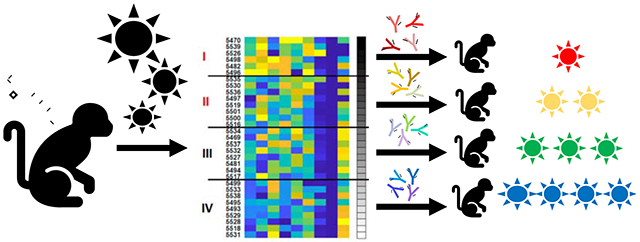
We ranked antibody profiles in all the vaccinated animals based on the protective signature. In preparation for adoptive transfer studies with purified IgG, we included the 9 features related to antibody profiles but excluded the 3 features related to cellular immune responses for this analysis. These features included markers of antibody function and binding, including NK cell CD107a degranulation, antibody polyfunctionality, phagocytosis, antibody binding breadth, Fcγ3-receptor binding (FcγR3A, FcγR3B), and Fc-glycan isoforms (G1F_1, G1B_2, G2S1). These putative protective signatures were assessed in principal component analyses (PCA) to define enrichment for this signature among vaccinated animals (Fig. 4A; black to white shaded dots) and to visualize antibody functional features (Fig. 4B; colored dots). We then ranked animals with respect to this signature in terms of a protective signature rank score (Fig. 4C), based on the feature coefficients in the original PLSR models, with a higher score representing greater predicted protection. We divided the vaccinated animals into 4 approximate quartiles based on this ranking, with quartile I representing the animals with the strongest protective signature and quartile IV representing the animals with the weakest protective signature (Fig. 4C).
Figure 4. Ranking of vaccinated animals by the protective signature.
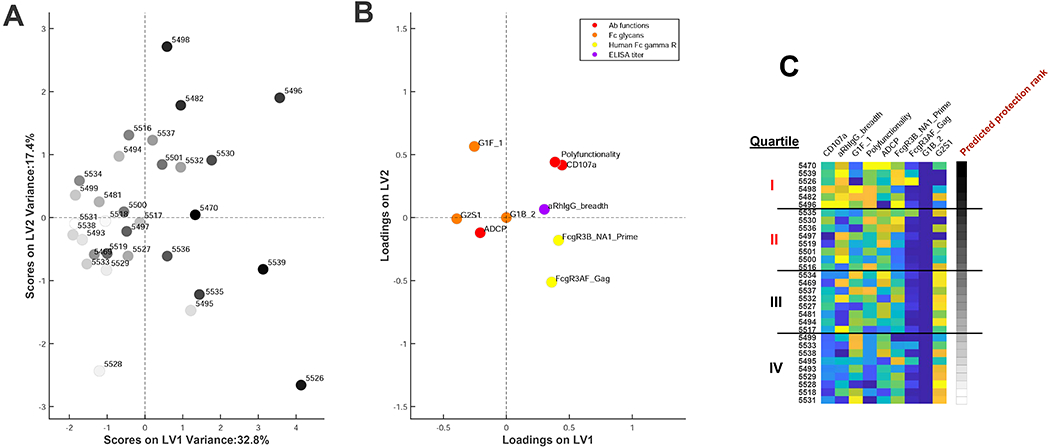
(A) Principal component analysis (PCA) of vaccinated animals stratified by the enrichment of the protective signature defined in Fig. 1 where each dot represents a vaccinated animal. The dot intensity depicts the degree of the protective antibody signature, where dark dots are highly enriched for the protective signature and light dots have lower levels of the protective signature. (B) PCA of individual protective features in the signature in the same multivariate space. (C) Heatmap showing the ranking of each vaccinated animal by enrichment of the protective antibody signature. Black to white shading shows the strength of the protective signature. Yellow to blue shading depicts the magnitude (positive to negative) of each of the signature features in the vaccinated animals.
To define the pathways responsible for the induction of this protective signature, we utilized transcriptomic profiling by RNA-Seq to assess the association between innate immune responses at baseline and following the first protein boost and the subsequent development of the protective signature (Gentleman, 2005; Gentleman et al., 2004). Significant transcriptomic differences were detected following vaccination by gene set enrichment analysis (GSEA) (Subramanian et al., 2005), including induction of type I and type II interferon signaling, metabolic pathways (MYC, MTOR), and proliferation pathways (G2M, E2F), as well as activation of monocyte and myeloid dendritic cell (MDC) signaling (Fig. S4).
The protective signature rank score of the vaccinated animals correlated most strongly with expression of genes in the mitochondrial metabolism and IL-4/IL-13 pathways on day 1 post-boost, including PINK1 (P=2x10⁻⁵) (Xiao et al., 2017; Zhou et al., 2019) and ALOX15 (P=0.0003) (Kwon et al., 2016; Snodgrass and Brune, 2019) (Figs. 5A–D, S5), as well as Toll-like receptor (TLR) signaling (Fig. S6A, B). On day 7 post-boost, increased expression of genes in the B-cell receptor (BCR) and interferon pathways, including CD22 (P=0.0068) and CD19 (P=0.0367), correlated most strongly with the protection signature rank score of the vaccinated animals (Fig. 5E–H). Moreover, using Sample Level Enrichment Analysis, activation of IL-4/IL-13 signaling on day 1 correlated with activation of BCR signaling on day 7 (P=0.027), highlighting synergy between these transcriptional cascades. Expanded analysis using the Hallmark database confirmed the correlation between interferon signaling on day 7 post-boost and the protective signature, including upregulation of antiviral genes (IRF7, IFI2/3/44, TRIM14/25/26) and chemokine signaling genes (CCL5/13, CXCL9/10) (Mostafavi et al., 2008) in animals with the protective signature (Fig. S6C–E). These data suggest that early innate immune signatures on day 1 post-boost and antiviral interferon responses on day 7 post-boost contributed to the development of the protective antibody signature.
Figure 5. Innate immune correlates of the protective signature.
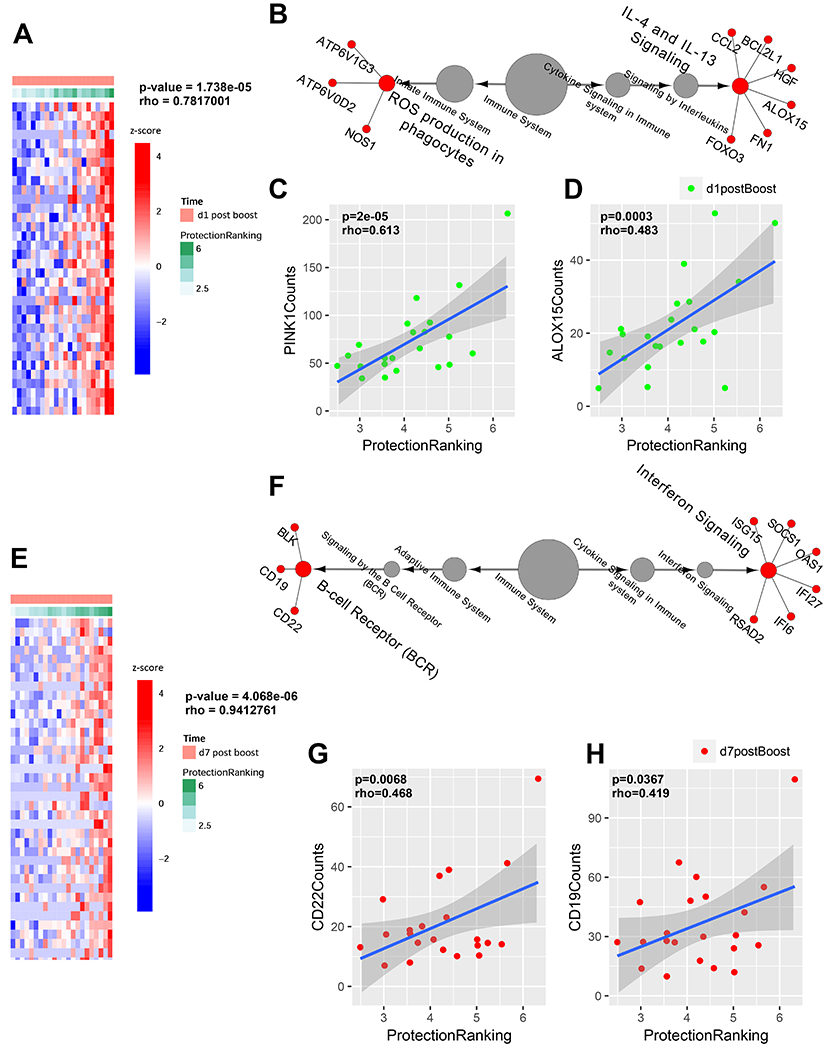
(A) Heatmap representing the top positively correlated genes on day 1 post-boost associated with the protection rank score. Rows represent genes and columns represent samples. Gene expression is represented as a gene-wise standardized expression (Z-score). Red and blue correspond to up- and down-regulated genes respectively. Green to white correspond to high to low protection rank score. (B) An over-representation test of gene expression pathways on day 1 post-boost correlated with the predicted protection rank score, demonstrating IL-4/IL-13 signaling and reactive oxygen species (ROS) and mitochondrial metabolism pathways. Scatter plots highlight correlations between (C) PINK1 and (D) ALOX15 gene expression on day 1 and protection rank score. (E) Heatmap representing the top positively correlated genes on day 7 post-boost associated with the protection rank score as in (A). (F) An over-representation test of gene expression pathways on day 7 post-boost correlated with the predicted protection rank score, demonstrating interferon signaling and B-cell receptor (BCR) pathways. Scatter plots highlight correlations between (G) CD22 and (H) CD19 gene expression and protection rank score. The Cluego plug-in in Cytoscape was used to plot the transcriptomic cascades (B, F). P-values represent Spearman rank correlation tests (C, D, G, H). See also Figs. S4–S6.
To assess the predictive capacity of the protective signature rank score, we challenged the 30 vaccinated animals and 6 contemporaneous sham controls with 6 repeated, intrarectal inoculations with 500 tissue culture infectious doses (TCID50) of the heterologous, neutralization-resistant virus SIVmac251 beginning at week 78, which was 7 months after the final boost immunization (Barouch et al., 2015; Barouch et al., 2012; Liu et al., 2010; Liu et al., 2009). Plasma viral RNA was assessed weekly in the challenged animals. We observed substantial protection against acquisition of infection in animals with the strongest protective signatures in quartile I (Fig. 6A, B; P=0.0011, log-rank test; hazard ratio 0.016, P<0.001, Cox proportional hazard model; hazard ratio 0.035, P<0.001, Weibull survival model) and in quartile II (P=0.0125, log-rank test; hazard ratio 0.055, P=0.005, Cox proportional hazard model; hazard ratio 0.116, P<0.001, Weibull survival model). In contrast, minimal to no protection was observed in animals with the weaker protective signatures in quartiles III and IV. A trend analysis confirmed decreasing protective efficacy in quartile I to quartile IV (P<0.001, Cox proportional hazard model; P<0.001, Weibull survival model). Moreover, the protective signature rank score strongly correlated with protection against SIVmac251 challenges in these animals (Fig. 6C; R=0.86; P<0.0001, Spearman rank-correlation test).
Figure 6. Protective efficacy in vaccinated animals.
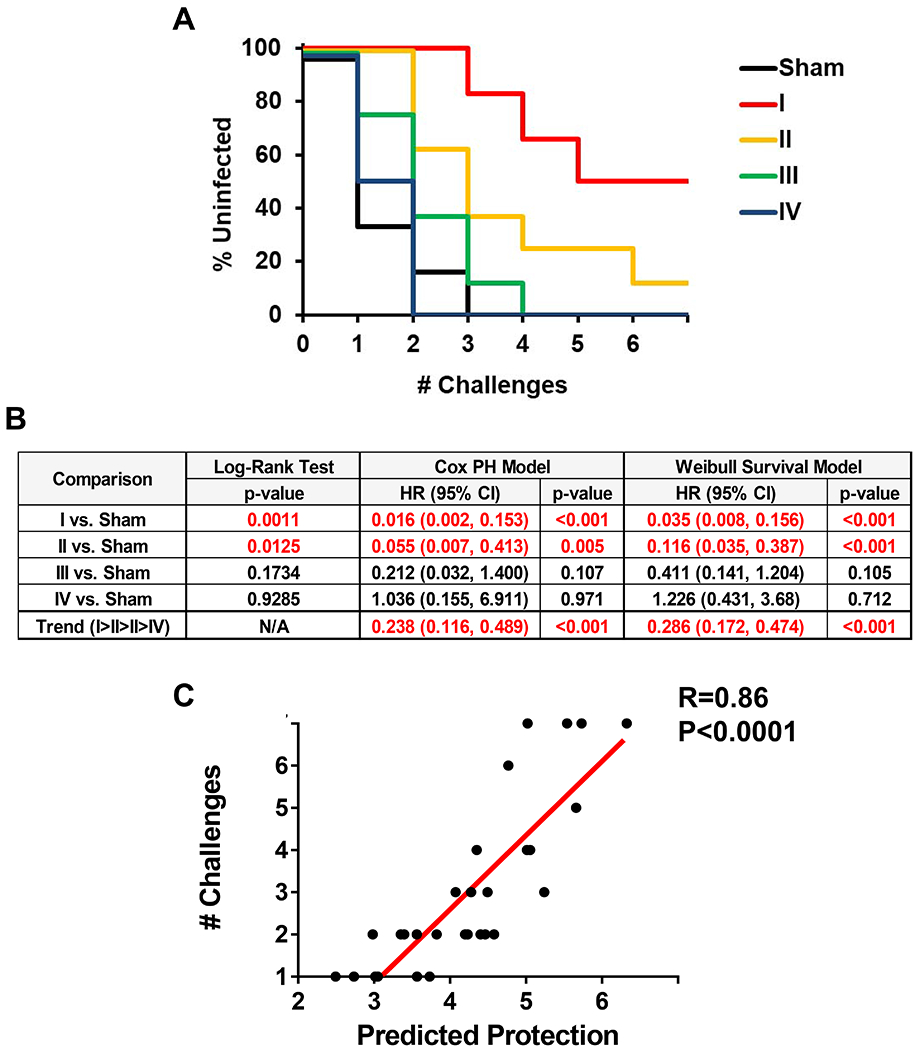
(A) Kaplan-Meier curve depicting the number of challenges required for infection in sham control macaques and in vaccinated macaques in quartiles I-IV defined by the predicted protective signature (Fig. 4). (B) Statistical analyses of protective efficacy by log-rank tests, Cox proportional hazard models, and Weibull survival models. (C) Correlation of predicted protection rank score and the number of challenges required for protection. P-value represents Spearman rank-correlation test.
Adoptive transfer study
To determine directly the protective efficacy of vaccine-elicited antibodies, we performed an adoptive transfer study using purified IgG from the vaccinated macaques (Plotkin, 2008, 2010). A technical hurdle was to obtain sufficient IgG at peak immunity to achieve robust antibody titers in recipient rhesus macaques following adoptive transfer. We plasmapheresed all vaccinated macaques four times after the week 50 boost at weeks 52, 53, 54, and 55. We obtained a median of 71 mls plasma (range 47-108 ml) per animal and purified IgG from each vaccinated animal with protein A and G sepharose beads, resulting in a median of 360 mg IgG (range 209-580 mg) per animal. Sham IgG was also purified from plasma from unvaccinated macaques. IgG preparations were diluted to 10 mg/ml and tested negative for endotoxin. Functional antibody profiling of the purified IgG preparations confirmed their serum functional profiles (data not shown).
We prepared four IgG pools (I-IV) for the adoptive transfer study, reflecting IgG from animals in quartiles I-IV (Fig. 4C), respectively. We infused 24 naive recipient rhesus macaques by the intravenous route with 100 mg/kg purified IgG from pools I, II, III, or IV (N=4/group) or 100 mg/kg sham IgG purified from unvaccinated animals (N=8). Following adoptive transfer, binding antibody titers were detected by ELISA in all recipient macaques in groups I-IV, although titers were approximately 1 log lower in the recipients compared with the vaccinated donor animals (Fig. 7A). Binding antibody titers were comparable across groups I-IV (Fig. 7B).
Figure 7. Protective efficacy following adoptive transfer of purified IgG.
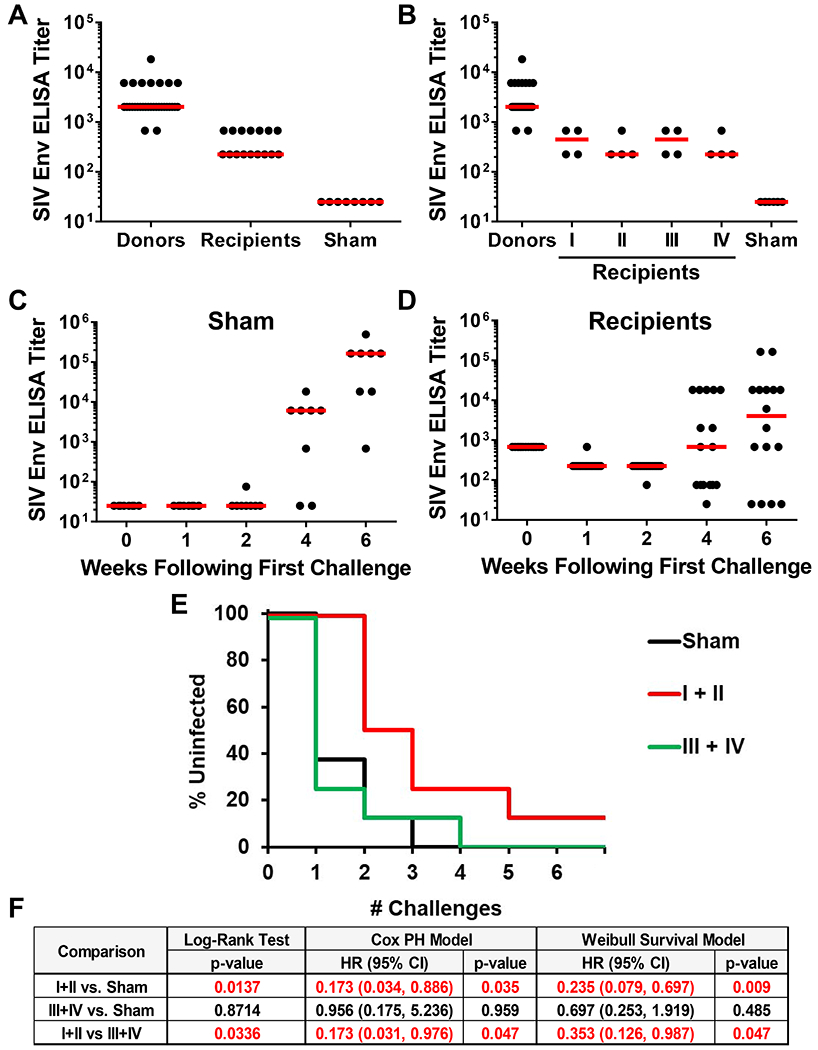
(A, B) ELISA titers to SIVmac32H Env gp140 in vaccinated macaques (Donors) and in recipient macaques (Recipients) following adoptive transfer of purified IgG from animals in quartiles I-IV. ELISA titers in animals that received (C) sham IgG or (D) IgG purified from vaccinated macaques in quartiles I-IV following the initial SIVmac251 challenge. (E) Kaplan-Meier curve depicting the number of challenges required for infection in sham control macaques and in macaques that received IgG from animals in quartiles I+II and quartiles III+IV. (F) Statistical analyses of protective efficacy by log-rank tests, Cox proportional hazard models, and Weibull survival models. See also Fig. S7.
To evaluate the protective efficacy of the passively transferred IgG, we challenged all recipient animals with 6 repeated, intrarectal inoculations with 500 TCID50 of SIVmac251 starting on day 1 after adoptive transfer. The pre-defined primary statistical analysis was the protective efficacy in groups I and II combined (N=8) vs. groups III and IV combined (N=8) vs. sham controls (N=8). Env-specific binding antibodies were detected by ELISA in the sham controls by weeks 4-6 following the first challenge, reflecting the kinetics of antibody responses to SIVmac251 infection (Fig. 7C). In the recipient animals that received IgG in groups I-IV, Env-specific ELISA titers declined by 0.5 log between week 0 and week 1, reflecting rapid clearance of the infused IgG (Fig. 7D). By weeks 4-6 following the first challenge, the majority of recipient animals in groups I-IV demonstrated increasing ELISA titers, presumably reflecting productive SIVmac251 infection, although ELISA titers continued to decline to undetectable levels in four recipient animals over this period of time (Fig. 7D).
In the primary efficacy analysis, animals in groups I and II demonstrated transient but clear protection compared with sham controls (Fig. 7E, F; P=0.0137, log-rank test; hazard ratio 0.173, P=0.035, Cox proportional hazard model; hazard ratio 0.235, P=0.009, Weibull survival model). Animals in groups I and II also showed greater efficacy than did animals in groups III and IV (P=0.0336, log-rank test; P=0.047, Cox proportional hazard model; P=0.047, Weibull survival model). In contrast, animals in groups III and IV did not show protection compared with sham controls.
In an exploratory efficacy analysis, we also assessed the protective efficacy of each individual recipient group compared with sham controls, although this analysis had limited statistical power. Nevertheless, protection was still observed in group I (Fig S7; P=0.026, Cox proportional hazard model; P=0.007, Weibull survival model). A trend analysis confirmed decreasing protective efficacy from group I to group IV (Fig S7; P=0.013, Cox proportional hazard model; P=0.010, Weibull survival model). Moreover, antibody responses at week 6 inversely correlated with protective efficacy in both sham controls and groups I-IV (data not shown), suggesting that post-challenge antibody responses largely reflected viral replication.
Taken together, these data demonstrate that passive transfer of purified IgG from vaccinated macaques with the most robust protective signature, but not from animals with the less robust protective signature, led to a modest but clear degree of protective efficacy against SIVmac251 challenges in rhesus macaques.
DISCUSSION
A major unanswered question in the HIV-1 vaccine field is whether vaccine-elicited antibodies can protect. To the best of our knowledge, we report here the first demonstration that adoptive transfer of purified polyclonal IgG from vaccinated animals can protect naïve rhesus macaques against SIVmac251 challenges. We defined a common protective signature for candidate Ad26/Env vaccines from previous studies (Barouch et al., 2015; Barouch et al., 2018) and validated this signature in a prospective vaccine study in rhesus macaques. We then showed that adoptive transfer of purified IgG from animals with this signature protected naïve rhesus macaques against SIVmac251 challenges. These data demonstrate that antibodies elicited by Ad26/Env vaccination can partially protect against SIVmac251 in rhesus macaques.
These findings are consistent with prior studies from multiple laboratories that identified functional non-neutralizing antibodies as statistical correlates of protection (Barouch et al., 2015; Barouch et al., 2013; Barouch et al., 2018; Haynes et al., 2012; Horwitz et al., 2017; Roederer et al., 2014). Our data also extend a previously reported gene expression signature of vaccine protection (Ehrenberg et al., 2019). Numerous studies have previously reported passive protection with broadly reactive monoclonal antibodies, but few studies have evaluated passive protection with polyclonal antibodies in rhesus macaques (Dugast et al., 2014).
Systems serology has the capacity to profile the polyclonal antibody responses to vaccination or infection with unprecedented depth (Chung et al., 2015). The immunologic parameters defined in the common correlate of protection (Barouch et al., 2015; Barouch et al., 2018) included features related to antibody responses, including functionality, binding breadth, Fc-receptor binding, and glycan profiles, as well as features related to cellular immune responses. These data are consistent with our previous studies that identified Env-specific antibody titers and Env-specific ELISPOT responses (Barouch et al., 2018) and antibody polyfunctionality as correlates of protection (Barouch et al., 2015). Of note, these previously identified correlates were part of the more comprehensive protective correlate defined in this study. We speculate that antibody polyfunctionality likely leveraged multiple immunologic clearance mechanisms that may contribute to protection (Liu et al., 2016), rather than a vaccinal effect mechanism.
We utilized transcriptional profiling to provide mechanistic insights related to the gene circuits involved in driving the protective antibody signature. Transcriptional cascades as early as day 1 after the boost correlated with the induction of the protective signature. These data suggest that early vaccine-induced triggering of innate immune pathways facilitated the induction of protective antibodies, including TLR and IL-4/IL-13 signaling on day 1 and BCR and interferon signaling on day 7. These findings are consistent with prior reports that suggest that early interferon signaling may drive functional and protective antibody profiles (Hamilton et al., 2017; Rubtsova et al., 2016; Zumaquero et al., 2019).
In summary, our data demonstrate that vaccine-elicited antibodies can provide partial protection against SIVmac251 challenges in rhesus macaques, even in the absence of broadly neutralizing antibodies. We speculate that neutralizing antibodies would be even more effective (Pauthner et al., 2019), but currently no HIV-1 Env immunogens can induce broadly reactive neutralizing antibodies in nonhuman primates or humans. Ad26/Env vaccines are currently being evaluated in clinical efficacy trials to determine whether or not these vaccines will prevent HIV-1 infection in humans. Moreover, the protective signature defined in this study and the approach to studying vaccine-elicited antibodies by adoptive transfer studies should prove useful in the evaluation of other vaccines for both HIV-1 and other pathogens.
Limitations of Study
This study demonstrates a proof-of-concept that vaccine-elicited antibodies can protect against pathogenic SIV challenges in nonhuman primates. However, the generalizability of these findings to other vaccines, which may have different immunologic mechanisms of protection, remains unclear. Moreover, the relevance of these findings to HIV-1 infection in humans has not yet been determined.
STAR METHODS
Resource Availability
Lead Contact
Further information and requests for resources and reagents should be directed to the Lead Contact, Dan Barouch (dbarouch@bidmc.harvard.edu).
Material Availability
This study did not generate new unique reagents.
Data and Code Availability Statement
All data generated during the current study is available in the figures and supplemental material. RNAseq data has been deposited in the Gene Expression Omnibus (GEO) database under accession number GSE156177.
Experimental model and subject details
Animals and study design
30 outbred, healthy, immunocompetent, Indian-origin, young adult (3-8 years old), male and female, previously research and procedure naive rhesus macaques (Macaca mulatta) were genotyped, and animals expressing protective MHC class I alleles and susceptible and resistant TRIM5α alleles were distributed among the groups. Animals were otherwise randomly allocated to groups. All macaques were housed at Bioqual, Rockville, MD. Animal husbandry included daily veterinary care, food and water ad libitum, and social enrichments. Animals were pairwise housed during the vaccination phase of this experiment and were singly housed following challenge. Animals were primed with 3x10¹⁰ viral particles (vp) Ad26-SIVsmE543 Env/Gag/Pol vectors at weeks 0 and 12 and were boosted the animals with 3x10¹⁰ vp Ad26 vectors combined with 0.25 mg purified SIVmac32H Env gp140 protein with alum adjuvant at weeks 24 and 50 (Abbink et al., 2007; Barouch et al., 2015; Barouch et al., 2012). The 30 vaccinated animals and 6 contemporaneous sham controls were challenged with 6 repeated, intrarectal inoculations with 500 tissue culture infectious doses (TCID50) of the heterologous, neutralization resistant virus SIVmac251 beginning at week 78, which was 7 months after the final boost immunization (Barouch et al., 2015; Barouch et al., 2012; Liu et al., 2010; Liu et al., 2009). Animals were challenged atraumatically in the dorsal recumbent position. Macaques were bled for immune response assessments and viral load determinations. Immunologic and virologic assays were performed blinded. All animal studies complied with all relevant ethical regulations and were approved by the Bioqual Institutional Animal Care and Use Committee (IACUC).
Primary immune cells
For isolation of NK cells, fresh peripheral blood was collected from healthy human volunteers by the MGH Blood bank. For the isolation of neutrophils, fresh peripheral blood was collected from healthy human volunteers by the Ragon Institute. All volunteers were over 18 years of age, male and female, and gave written consent. All samples were de-identified before use. The study was approved by the MGH Institutional Review Board. Human NK cells were isolated from fresh peripheral blood and maintained at 37°C, 5% CO2 in RPMI with 10% fetal bovine serum, L-glutamine, penicillin/streptomycin.
Cell lines
THP-1 cells (ATCC), a monocytic leukemia cell line, were maintained at 37°C, 5% CO2 in RPMI supplemented with 10% fetal bovine serum, L-glutamine, penicillin/streptomycin, HEPES, and beta-mercaptoethanol.
Method Details
Viral RNA and antibody assays
Viral RNA was isolated from cell-free plasma using a viral RNA extraction kit (Qiagen) and was quantitated (Barouch et al., 2015). Binding antibody responses were assessed by ELISA using plates coated with SIVmac32H Env gp140 (Barouch et al., 2015). Neutralizing antibody responses were assessed by TZM-bl pseudovirus neutralization assays using primary and T cell-line adapted (TCLA) clones of SIVmac251 and SIVsmE660.
ELISPOT assay
SIV-specific cellular immune responses were assessed by interferon-γ (IFN-γ) ELISPOT. ELISPOT assays utilized pools of SIVmac239 Env, Gag, and Pol 15 amino acid peptides overlapping by 11 amino acids to stimulate PBMCs. ELISPOT plates were coated with mouse anti-human IFN-γ monoclonal antibody from BD Pharmingen at a concentration of 5 μg/well overnight at 4°C. Plates were washed with DPBS containing 0.25% Tween 20, and blocked with R10 media (RPMI with 11% FBS and 1.1% penicillin-streptomycin) for 1 h at 37°C. Peptide pools were prepared at a concentration of 2 μg/well, and 200,000 cells/well were added. The peptides and cells were incubated for 18-24 h at 37°C. All steps following this incubation were performed at room temperature. The plates were washed with coulter buffer and incubated for 2 h with Rabbit polyclonal anti-human IFN-γ Biotin from U-Cytech (1 μg/mL). The plates are washed a second time and incubated for 2 h with Streptavidin-alkaline phosphatase antibody from Southern Biotechnology (1 μg/mL). The final wash was followed by the addition of Nitor-blue Tetrazolium Chloride/5-bromo-4-chloro 3 ‘indolyl phosphate p-toludine salt (NBT/BCIP chromagen) substrate solution for 7 min. The chromagen was discarded and the plates were washed with water and dried in a dim place for 24 h. Plates were scanned and counted on a Cellular Technologies Limited Immunospot Analyzer.
Antibody-dependent cellular phagocytosis (ADCP) assay
Antibody-dependent cellular phagocytosis was assessed by the measurement of the uptake of antibody-opsonized, antigen-coated fluorescent beads by a monocytic cell line. Briefly, THP-1 cells were purchased from ATCC and cultured as recommended. Biotinylated Env gp120 was used to saturate the binding sites on 1 gm fluorescent neutravidin beads (Invitrogen). Excess antigen was removed by washing the beads, which were then incubated with patient antibodies for 2 hr at 37°C. Following opsonization, beads were washed and unbound antibodies removed. THP-1 cells were added, and the cells were incubated overnight to allow phagocytosis. The cells were then fixed, and the extent of phagocytosis was measured via flow cytometry on a Stratedigm S1000EXi flow cytometer equipped with high-throughput sampler. The data are reported as a phagocytic score, which takes into account the proportion of effector cells that phagocytosed and the degree of phagocytosis (integrated MFI: frequency x MFI).
Antibody dependent cellular cytotoxicity (ADCC) assay
The rapid fluorescent ADCC (RFADCC) assay involved CEM-NKr cells pulsed with Env gp120 (6 μg/million cells) and labeled with the intracellular dye CFSE and the membrane dye PKH26. NK cells were enriched directly from seronegative donor whole blood by negative selection using RosetteSep (Stem Cell Technologies). Sample plasma was added to the labeled, antigen pulsed CEM-NKr cells after which fresh NK cells were added. The cells were incubated for 4 hr at 37°C and then fixed. The proportion of cells that maintained membrane expression of PKH26 but lost CFSE staining (i.e., lysed cells) were quantified via flow cytometry on a Stratedigm S1000EXi flow cytometer equipped with a high-throughput sampler.
Antibody-dependent complement deposition (ADCD) assay
Antibody-dependent complement deposition was assessed by the measurement of complement component C3b on the surface of target cells. CD4-expressing target cells were pulsed with Env gp120 (6 γg/million cells) and incubated with purified Abs. Freshly isolated HIV-1 negative donor plasma diluted with veronal buffer and 0.1% gelatin (1:10 dilution) was added, the cells were incubated for 20 min at 37°C. The cells were then washed with 15 mM EDTA in PBS, and complement deposition was detected via flow cytometry following staining for C3b (Cedarlane). Replicates using heat inactivated donor plasma were used as negative controls.
Antibody-dependent neutrophil-mediated phagocytosis (ADNP) assay
Antibody-dependent neutrophil-mediated phagocytosis was assessed by the measurement of the uptake of antibody-opsonized, antigen-coated fluorescent beads by primary neutrophils. Biotinylated Env gp120 was used to saturate the binding sites on 1 pm fluorescent neutravidin beads (Invitrogen). Excess antigen was removed by washing the 28 beads, which were then incubated with patient Ab samples for 20 minutes at 37°C. Leukocytes were isolated from blood collected from HIV-seronegative donors by ACK lysis of red blood cells. Following opsonization, the freshly isolated leukocytes were added, and the cells were incubated for 1 hr at 37°C to allow phagocytosis. The cells were then stained for CD66b to identify neutrophils, and fixed, and the extent of phagocytosis was measured via flow cytometry on a Stratedigm S1000EXi flow cytometer equipped with a high-throughput sampler. The data are reported as a phagocytic score, which takes into account the proportion of effector cells that phagocytosed and the degree of phagocytosis (integrated MFI: frequency x MFI) (Darrah et al., 2007).
Antibody-dependent NK cell activation
Antibody-dependent NK cell degranulation and cytokine/chemokine secretion was measured using freshly isolated NK cells, after the culture of rhesus macaque plasma with plate-bound Env gp120. Proteinbinding plates were coated with Env gp120 (300 ng/well) and incubated for 2 hr at room temperature. Plates were then blocked in 5% BSA overnight at 4°C. Fresh NK cells were isolated from whole blood from seronegative donors using negative selection with RosetteSep, as recommended by the manufacturer. Plates were washed to remove unbound antigen, sample plasma was added and incubated for 2hr at 37°C. Following the incubation, plates were washed to removed un-opsonized antibodies. Isolated primary NK cells with anti-CD107a, brefeldin A (10 mg/ml) (Sigma), and GolgiStop (BD) were added, and incubated for 5 hours at 37°C. The cells were then washed and stained for surface markers using anti-CD16, anti-CD56, and anti-CD3. The cells were then washed, fixed and permeabilized using Fix & Perm (Invitrogen), and then stained 29 intracellularly with anti-IFN-γ and anti-MIP-1β. The cells were then fixed in 4% paraformaldehyde and analyzed using flow cytometry. NK cells were defined as CD3- negative and CD16- and/or CD56-positive. All antibodies for flow cytometry were purchased from BD.
Antigen-specific antibody Fc glycan profiling
Antigen-specific IgG was purified from plasma samples, and their glycan profiles were assessed by capillary electrophoresis. Briefly, samples were heat-inactivated for 1 hour at 56°C, centrifuged, and pre-cleared. Antigen-coupled beads were prepared by incubating biotinylated antigen to streptavidin magnetic beads (New England Biolabs). Antigen-coupled beads were then incubated with the samples for one hour at 37°C. After the incubation, beads were washed to remove unbound antibodies. Cleavage of the Fc from the Fab of the IgG antibodies was performed using the IdeZ enzyme (New England Biolabs) one hour at 37°C. Following the incubation, the supernatant was collected and treated with PNGase F for one hour at 50°C to remove the glycans from the Fc domain. Glycans were then purified using GlycanAssure magnetic beads (Applied Biosystems) to bind free glycans. Glycan binding to beads and precipitation of contaminating proteins was performed using 100% acetonitrile. Bead-bound glycans were washed twice and eluted off the beads. Eluted glycans were labeled with APTS for 2 hours at 50°C. Unreacted dye was removed from the glycans using GlycanAssure magnetic beads. Bead-bound glycans were washed two times and eluted in HPLC-grade water. Following this elution, glycans were analyzed by capillary electrophoresis.
Multiplex Fc array
The quantity and quality of SHIV/SIV-specific antibodies was evaluated using a custom multiplex bead array in which antibodies were 30 characterized according to their ability to interact with rhesus and human Fc receptors and lectins. A multivariate assay was developed using a panel of SIV antigens coupled to carboxylated fluorescently-coded magnetic beads (Luminex). A total of 5 million carboxylated beads were covalently coupled to 25 μg of antigen using a two-step carbodiimide reaction. Beads were washed by centrifugation and activated for 20 min by suspension in 80 μl of 100 mM monobasic sodium phosphate, pH 6.2, followed by the addition of 10 μl each of 50 mg/mL N-hydroxysulfosuccinimide (24520, Pierce) and 1-ethyl-3-[3-dimethlyaminopropyl]carbodiimide-HCl (77149, Pierce). Activated microspheres were washed three times in 250 μl of Coupling Buffer (50 mM MES, pH 5.0), resuspended in 400 μl of buffer, and incubated with 25 μg of SFV antigen for 2 h on a rotational mixer. Finally, coupled microspheres were washed three times with 1 ml of PBS-TBN (PBS-1X, 0.1% BSA, 0.02% Tween 20, 0.05% Sodium Azide, pH 7.4), incubated for 30 minutes in 1mL PBS-TBN for blocking, and finally resuspended in 400 μl of PBS-TBN. The coupled beads were counted and stored at 4°C for up to 6 months. Fcγ receptors (FcγR), mannose binding lectin (MBL), and the complement cascade initiator C1q protein were tetramerized and utilized to characterize the Fc domains of each antigen-specific antibody population. FcγR (human FcγRIIa, FcγRIIIa, and rhesus FcγR2A-1, FcγR2A-4, FcγR3A1, FcγR3A-3) as well as human MBL2 were produced in HEK293 cells, and purified via Ni++ ion affinity and size exclusion chromatography. Human C1q was purchased from Sigma (C1740). FcRs, MBL and C1q were biotinylated using EZ-Link Sulfo-NHS-SS-Biotin (Pierce 21331) at a molar ratio of 5 mols biotin per mol of protein, or via site-specific conjugation using BirA according to the 31 manufacturer’s instructions (Avidity, BirA-500). Chemical biotinylation was carried out for 2h at RT in Tris pH 8.2, with a protein concentration of 0.2 mg/mL, afterwards the excess biotin was removed via buffer exchange into PBS. Immediately prior to use, the biotinylated receptor was mixed with a 1/4th molar ratio of Streptavadin-PE (Prozyme Cat #PJ31S), and diluted to a final concentration of 1.0 μg/mL FcγR or lectin in Assay Buffer (PBS + 0.1% BSA + 0.05% Tween). Coupled microspheres were premixed in Assay Buffer, creating a working mixture of 12.5 microspheres per bead type, per μl. Using a black, clear bottom 384-well plate (Greiner Bio One, 781906) 40 μl of the working microsphere mixture (500 beads of each type/well) was added to 10 μL of 100x diluted serum. The plate was covered and incubated for 2 hrs at RT on an XYZ plate shaker (IKA). The plate was washed five times with 65 μl of Assay Wash (PBS-1X, 0.1% BSA, 0.5% Triton-100X) using a plate washing system (BioTek 405). Antigenspecific antibody was detected using the tetrameric PE-conjugated detection reagents described above, at 1.0 μg/mL, or Rphycoerthrin (PE)-conjugated anti-rhesus IgG (Southern Biotech 6200-09), at 0.65 μg/ml, with 50μl/well. After 1 h incubation at room temperature on a shaker, the plate was washed five times with 65 μl of sheath fluid (Luminex 40-75680), and microspheres were resuspended in 40 μl of sheath fluid. A Bio-Plex array reader (FlexMap 3D, Bio-Plex Manager 5.0, Bio-Rad) detected the microspheres and binding of each PE-functionalized detection reagent was measured to calculate a Median Fluorescence Intensity (MFI). Background signal, defined as the 32 average MFI observed for each microsphere set when incubated with detection reagent in the absence of clinical antibody sample, was subtracted from the MFI for each sample.
IgG purification
Frozen plasma from vaccinated rhesus macaques were thawed and gently rocked for 1 h at 4°C to trigger precipitation of residual fibrin and other components that will interfere with subsequent purification steps. Precipitates were then collected by centrifugation at 1500 rpm for 5 min before supernatant was filtered at 0.22μM. Clarified plasma was combined with 20ml of a 1:1 mixture of PBS-washed protein A and G sepharose beads (GE Healthcare), and adjusted to a final volume of 250ml with phosphate buffered saline (PBS). IgG was then allowed to bind to the suspended Protein A and G beads under gentle agitation at 4°C overnight. Beads were separated from the supernatant by passing the suspension over an empty 25ml chromatography column using gravity flow. Beads collected in columns were washed with 200ml of TBS before bound IgG was eluted with a high salt elution buffer (Pierce Gentle Ag/Ab Elution buffer, #21027). Columns where washed with 200 ml of TBS before beads were resuspended and transferred back to the plasma flow through for two additional repetitions of these affinity purification steps. Since the elution buffer was incompatible with PBS, and since rhesus polyclonal IgG has a propensity to precipitate during molecular filtration, eluted IgG was dialyzed three times against TBS before it was dialyzed three times against PBS. After last dialysis, 100 kDa molecular filtration was used to concentrate IgG to over 10 mg/ml at 4°C, and potential precipitates formed during concentration were removed by filtration at 0.22μM. Final IgG concentration was determined by measuring optical density at 280 nm and purity was confirmed using SDS-PAGE. Absence of endotoxins was confirmed using Endosafe-PTS cartridges (Charles River PTS20F) in an Endosafe Nexgen-PTS instrument (Charles River, PTS150K).
Quantification and Statistical Analysis
Immune profile data processing
Antibody functional profiles, antibody biophysical profiles, and antibody Fc glycan profiles, as well as ELISA and ELISPOT responses, from multiple experimental replicates were averaged before they were compiled into feature matrices. Missing values in the matrix were estimated using a Knearest neighbor algorithm, a weighted average of values in K closest features to the missing feature determined by Euclidean distance. The matrices were transformed by Box-Cox transformation, a monotonic transformation to improve the normality of the dataset, while stabilizing variance. Z-score standardization was then performed to have all features mean centered and unit variance scaled before further computational analysis. The protective efficacies of the vaccine, presented by number of viral challenges before infection, was used for the multivariate regression model. Antibody polyfunctionality was defined as the number of functions from 7 functional assays that were higher than the median of the assays across all animals in the study. IgG binding breadth was defined as the binding activity to 15 SIV antigens above the median for each antigen.
Unsupervised clustering of group-specific signatures
Hierarchical clustering analysis was used to group animals based on all features to set a baseline evaluation of the data heterogeneity/homogeneity between different vaccine regimens. The degree of similarity across the individual features between every pair of animals was calculated to create a hierarchical decomposition. A dendrogram was then generated to show the hierarchy of the clusters. Principal component analyses (PCA) were performed to cluster the data points (animals) based on principal components (PCs). The PCs were generated 33 via high-dimensional reduction of features, in which each PC represents a linear combination of the features and remains orthogonal to other PCs, but retains as much of the variance in the feature dataset as possible. The degree to which the each feature contributed to the orthonormal principle component coefficients was also calculated. Unsupervised clusters were used to compare the pre-defined groups (vaccine regimens, and/or protection status).
Immune correlates of protection
The minimal humoral correlates most predictive of vaccine efficacy were identified using a 2-step model: Elastic-net regularization followed by partial least squares regression analysis (PLSR). The Elasticnet method, integrating a penalty functions of least absolute shrinkage and selection operator (LASSO) and ridge regression, was used to remove irrelevant features (that explained the same variance) in order to improve the robustness of high-dimensional modeling (Zou and Hastie, 2005). Next, PLSR was used to model the covariance relationship between the selected feature variables (X) and the outcome variable (Y) (Wold et al., 2001). PLSR is particularly useful when the number of variables is much larger than the sample size. PLSR decomposes both X and Y into a hyperplane and maximizes covariance between the hyperplanes. To define the minimal correlates that best explained protection-without overfitting - a framework of 10,000-repeated 5-fold nested cross-validations was designed (Cawley and Talbot, 2010). In each repetition, the dataset was randomly divided into 5 folds, where 80% of the dataset was used for building an Elastic net/PLSR model (inner cross-validation) and the remaining hold-out dataset was used to test the model prediction (outer cross-validation), where the goodness-of-fitness of the model was measured by mean squared error (MSE) and a 34 correlation was performed between the predicted outcome and the actual to generate a correlation coefficient (r2 ). Finally, the importance of a given variable to driving separation between groups in the model was assessed via the generation of a PLSR weight, calculated as the product of the frequency of the feature selected and its contribution to prediction accuracy across the 5000 ensembled models. This magnitude of this PLSR weight was then used to rank all features. Ultimately, the top features that together generated the best outcome prediction in the cross-validation test, with minimal over-fitting, were defined as the set of the immune correlates. In addition, the variable influence on projection (VIP) score, a weighted sum of squares of the PLSR loadings that summarized the importance of the features in a PLSR model with multiple components (Galindo-Prieto et al., 2014), were also computed. To estimate the statistical significance of the optimized model with the defined correlates, we employed two types of permutation tests: 1) shuffling the outcome labels across the samples and 2) through the use of a random dataset. Each dataset was then used to test the likelihood of obtaining a model prediction accuracy by chance. Each permutation test was performed 10,000 times to generate an empirical null distribution and an exact p-value. A p-value of less than 0.001 between actual and both permutation tests resulted in the rejection of the null hypothesis, and was considered statistically significant, providing confidence in the robustness of the model and the identified correlates.
Cross-study model prediction analysis
Correlates were first determined within individual studies. Within study correlates were then used to build a predictive PLSR model. The first study specific model was initially trained with the first study data and was then used to predict/validate protection in the second study. The same was done 35 building/training a model of data from the second study, and then was used to predict protection in the first study. The prediction accuracy and Receiver Operating Characteristic (ROC) curve was then used to evaluate the performance of the model. Furthermore, to estimate statistical significance of the prediction accuracy, a background model was generated, in which the outcomes of the second vaccine study was permuted by shuffling the order of the outcomes. 1,000 random permutations were calculated to estimate the null distribution of the prediction accuracy. Eventually an exact p-value was computed to estimate statistical significance of the actual data compared to the shuffled data, providing prediction accuracy. This crossstudy prediction analysis was repeated by exchanging the studies between model training and outcome prediction.
Concordance enrichment analysis to identify common correlates
Previously, the Elastic-Net/PLSR model, using a 5,000 repeated, 5-fold cross-validation framework, generated a PLSR weight for each feature. To define the minimal features that were most highly associated with protection across both studies, a concordance score was defined. The concordance value for each feature was computed as the product of the PLSR feature weight and its correlation coefficient with vaccine efficacy (number of challenges survived). We repeated this process for both studies. Features were then ranked based on the highest most concordant values. To determine the minimal set of common correlates, a stepwise forward approach was then used. In each step, a top feature from the concordance index was added to the candidate list and evaluated by the cross-study model predictions. As a result, a sequence of average AUCs across all tested models was generated and the feature set that exhibited the highest average AUC was identified as the 36 ultimate set of common correlates that could maximally explain protection across both studies. The prediction signature ranking score for any given animal was calculated from the partial least-squares regression (PLSR) models using the protective signature features as the independent ‘predictor’ variables and the protective efficacy (e.g., number of challenges) as the dependent ‘predicted’ variable. For instance, in Fig. 4C the columns represent the nine predictor variables from the protective signature defined in Fig. 1A, the rows represent each of the animals, and the predictive protection rank was calculated from the PLSR model regressing the protective signature against the number of challenges.
RNA-Seq
Total RNA sequencing was performed at BGI (Beijing Genomic Institute) for 26 rhesus macaques (M. mulatta) vaccinated with Ad26/Env for which sufficient peripheral blood mononuclear cells (PBMC) were available. Samples were week 24 day168 (pre-boost), week 24 day 169 (1 day post-boost), week 25 (7 days postboost), and week 44 (20 weeks post boost). Trimming (Trimmomatic v0.33), Alignment (STAR v2.4.2a), and Counting (HTSeq v0.6.1) were performed. All samples had an average of 16 million counted reads after aligning to the rhesus macaque genome, which provided ample coverage to perform downstream differential expression analysis. Downstream analysis of the RNA Seq data was done using the R statistical language and the Bioconductor suite (Gentleman et al., 2004). TMM normalization was performed. The LIMMA package (Gentleman, 2005) was used to fit linear models to and to perform a (moderated) Student’s t-test to assess the association of gene-expression to a time-point of interest. For data mining and functional analyses, genes that satisfied a p-value <0.05 were selected. When indicated, the proportions of false positives were controlled using the Benjamini and Hochberg method.
Pathway analysis
Gene Set Enrichment Analysis (GSEA) (Subramanian et al., 2005) using the Hallmark (MSIGDB), Reactome database (Reactome.org), and LM22 databases was performed to identify pathways upregulated in the post-boost timepoints compared with the pre-boost timepoint. GSEA is a statistical method to determine whether members of a particular gene set preferentially occur toward the top or bottom of a ranked-ordered gene list where genes are ranked by the strength of their association with the outcome of interest. More specifically, GSEA calculates an enrichment score (NES) that reflects the degree to which a set of genes is overrepresented among genes differentially expressed. The significance of an observed NES is obtained by permutation testing: resorting the gene list to determine how often an observed NES occurs by chance. Leading Edge analysis is performed to examine the particular genes of a gene-set contributing the most to the enrichment.
Network mapping
GeneMania Networks (Genemania.org) (Mostafavi et al., 2008) were plotted to depict co-expression of genes. Overlap between the genes included in the networks and Gene Ontology (GO) biological process was assessed using a Fisher exact test. GeneMania is a flexible, user-friendly web interface for generating hypotheses about gene function, analyzing gene lists and prioritizing genes for functional assays. Given a query list, GeneMania extends the list with functionally similar genes that it identifies using available genomics and proteomics data. GeneMania also reports weights that indicate the predictive value of each selected data set for the query. The Cytoscape (cytoscape.org) plugin was used to plot the networks. The ClueGo plug-in 38 within cytoscape was utilized to plot the immune system modules on days 1 and 7 postboost.
Statistics
Analysis of virologic and immunologic data was performed using GraphPad Prism v6.03 (GraphPad Software). Comparison of groups was performed using 2-sided Mann-Whitney tests. Correlations were assessed by 2-sided Spearman rank-correlation tests. Protective efficacy was assessed using log-rank tests, semiparametric Cox proportional-hazard models with exact partial-likelihood method to handle tied failures, and Weibull parametric survival models. For transcriptomics data, two-sided Wilcoxon rank-sum tests were used for pairwise analyses comparing feature responses across vaccine arms. The Benjamini and Hochberg method was used to calculate false discovery rate (FDR)-adjusted p-values for multiple testing corrections. Pvalues of less than 0.05 were considered significant.
Supplementary Material
Figure S3. Systems serology analysis in vaccinated macaques. Related to Fig. 2. Unsupervised hierarchical clustering of immune profiling data. Y-axis depicts individual macaques; x-axis depicts immune parameters. Yellow to blue shading represents the magnitude (positive to negative) of each response in the animals.
Figure S2. Immune features correlated with protection in prior SIV and SHIV vaccine studies. Related to Fig. 1. Correlates of protection in prior (A, B) SIVmac251 (Barouch et al., 2015) and (C, D) SHIV-SF162P3 (Barouch et al., 2018) Ad26/Env vaccine studies in rhesus macaques. Supervised principal component analyses (PCA) showing (A, C) protective efficacy and (B, D) relevant immune features. Yellow to blue shading represents robust to weak protection in each of the animals.
Figure S1. Systems serology analysis in prior SIV and SHIV vaccine studies. Related to Fig. 1. Immune profiles in prior (A, B) SIVmac251 (Barouch et al., 2015) and (C, D) SHIV-SF162P3 (Barouch et al., 2018) Ad26/Env vaccine studies in rhesus macaques. (A, C) Unsupervised hierarchical clustering of immune profiling data. Y-axis depicts individual macaques; x-axis depicts immune parameters. Yellow to blue shading represents the magnitude (positive to negative) of each response in the animals. (B, D) Supervised principal component analyses (PCA) showed clustering of animals based on the vaccine regimen received.
Figure S4. Transcriptomics analysis in vaccinated macaques. Related to Fig. 5. (A) A multi-dimensional scaling (MDS) plot was used to highlight the transcriptomic variances of the full data set (blue square, pre-boost; red circle, day 1 post-boost; green triangle, day 7 post-boost; purple +, week 20 post-boost). (B) Gene Set Enrichment Analysis (GSEA) was used to identify pathways that were induced on day 1, day 7, and week 20 post-boost compared to pre-boost. Significantly induced pathways from the Hallmark database are plotted along the y-axis. NES score with red and blue squares reflects positive and negative enrichment, respectively. (C) Jitter plot confirming the spread of the 26 animals with available RNA-Seq data into the quartiles defined by the predicted protection rank score (Fig. 4).
Figure S5. IL-4 and IL-13 signature includes both TFH and TH2 signatures in vaccinated macaques. Related to Fig. 5. The enrichment of Th2/Th1/TFH pathways on day 1 post boost using the immunologic gene-sets database (c7, mSigDB) showed a significant enrichment (GSEA, p<0.05) of both Th2 and TFH associated gene-sets. Gene mania was used to plot the leading edge genes mapping to these pathways, which included ICOS (enhancer of T-cell response) and CTLA4 (immune checkpoint for T-cell activation). Significantly up-regulated pathways are represented as red barplot, and both Th2 and TFH pathways are highlighted in networks.
Figure S6. Pathways induced on day 1 and day 7 post-boost. Related to Fig. 5. (A) Gene Set Enrichment Analysis (GSEA) was used to highlight TLR signaling pathways induced on day 1 post-boost in animals in quartile I compared with animals in quartiles II-IV. NES score reflects the degree of positive enrichment. Dotted box around the GeneRIF TLR signature highlights this persistently significant signature. (B) A coexpression network was plotted to highlight the interaction of the upregulated TLR signaling genes on day 1 post-boost that were positively correlated with the protection rank score. (C) GSEA was used to define pathways induced on day 7 post-boost that were most correlated with the protection rank score. The bar plot represents the top positively enriched pathways on the y-axis and the NES score on the x-axis. Coexpression networks were plotted to highlight the interaction of upregulated (D) type 1 interferon and (E) macrophage signaling genes on day 7 post-boost that were positively correlated with the protection rank score. Cytoscape was used to plot the co-expression network highlighting the top leading edge genes significantly enriched. GeneMania was used to infer network connections and co-expression.
Figure S7. Protective efficacy following adoptive transfer of purified IgG in individual groups. Related to Fig. 7. (A) Kaplan-Meier curve depicting the number of challenges required for infection in sham control macaques and in macaques that received IgG from animals in quartiles I, II, III, and IV. (B) Statistical analyses of protective efficacy by log-rank tests, Cox proportional hazard models, and Weibull survival models.
KEY RESOURCES TABLE
| REAGENT or RESOURCE | SOURCE | IDENTIFIER |
|---|---|---|
| Antibodies | ||
| APC-Cy7 Mouse Anti-Human CD16 | BD Biosciences | CAT#557758 RRID:AB_396853 |
| anti-rhesus IgG | Southern Biotech | CAT #: 6200-09 |
| CD56 PE-Cy7 Mouse Anti-Human CD56 | BD Biosciences | CAT#557747 |
| PE MIP-1b Mouse anti-Human | BD Biosciences | CAT#550078 RRID:AB_393549 |
| Pacific Blue™ Mouse Anti-Human CD3 | BD Biosciences | CAT#558117 RRID: AB_1595437 |
| FITC Goat IgG anti-C3 | MP Biomedicals | CAT#: 855385 |
| Pacific Blue™ anti-human CD66b Antibody | Biolegend | CAT# 305112 |
| Brilliant Violet 711™ anti-human CD4 Antibody | Biolegend | CAT #: 317440 Clone: OKT4 |
| Alexa Fluor® 700 Mouse Anti-Human CD3 | BD Biosciences | CAT#: 557917 Clone: SP34 |
| APC/Cyanine7 anti-human CD8 Antibody | Biolegend | CAT#: 344714 Clone: SK1 |
| APC anti-human CD95 (Fas) Antibody | Biolegend | CAT#: 305612 Clone: DX2 |
| CD69-ECD | Beckman Coulter Life Sciences | CAT#: 6607110 Clone: TP1.55.3 |
| PE-Cy™7 Mouse Anti-Human IFN-γ | BD Biosciences | CAT #: 557643 Clone: B27 |
| Ki-67 Mouse, FITC | BD Biosciences | CAT #: 556026 Clone: B56 |
| PE Mouse Anti-Human CD195 | BD Biosciences | CAT #: 556042 Clone: 3A9 |
| PerCP-Cy™5.5 Mouse anti-Human CD279 (PD-1) | BD Biosciences | CAT #: 561273 Clone: EH12.1 |
| Purified Rat Anti-Human CCR7 (CD197) | BD Biosciences | CAT#: 552175 Clone: 3D12 |
| Purified Mouse Anti-Human CD28 | BD Biosciences | CAT #: 348040 Clone: L293 |
| Bacterial and Virus Strains | ||
| SIVmac251 | This paper | JL |
| Ad26-SIVsmE543 Env/Gag/Pol | This paper | N/A |
| T cell-adapted SIVmac251 | This paper | N/A |
| T cell-line adapted SIVsmE660 | This paper | N/A |
| Biological Samples | ||
| Chemicals, Peptides, and Recombinant Proteins | ||
| Env gp120 | This paper | N/A |
| SIVmac239 Env, Gag, and Pol peptides | This paper | N/A |
| SIVmac32H Env gp140 protein | This paper | N/A |
| Guinea pig complement | Cedarlane | CAT #: CL5000-1 |
| Human and Rhesus Fc receptors | Duke Human Vaccine Institute | N/A |
| MBL2 | Duke Human Vaccine Institute | N/A |
| Human C1q | Sigma | CAT #: C1740 |
| Streptavidin-R-Phycoerythrin | Prozyme | CAT#:PJ31S |
| FIX&Perm Cell Permeabilization Kit | Invitrogen | CAT#: GAS001S100 CAT#: GAS002S100 |
| Brefeldin A | Sigma Aldrich | Cat#: B7651 |
| GolgiStop | BD Biosciences | Cat#: 554724 |
| N-hydroxysulfosuccinimide | Pierce | CAT #: 24520 |
| 1-ethyl-3-[3-dimethlyaminopropyl]carbodiimide-HCl (EDC) | Pierce | CAT#: 77149 |
| IdeZ | New England Biolabs | CAT#: P0770S |
| EZ-Link Sulfo-NHS-SS-Biotin | Pierce | CAT #: 21331 |
| Gentle Ag/Ab Elution buffer | Pierce | CAT #L 21027 |
| Critical Commercial Assays | ||
| BirA-500: BirA biotin-protein ligase standard reaction kit | Avidity | CAT#: BirA500 |
| RosetteSep Human NK Cell Enrichment Cocktail | Stem Cell Technologies | CAT#: 15065 |
| PKH26 Red Fluorescent Cell Linker Kit for General Cell | Sigma Aldrich | CAT#: PKH26GL |
| Membrane Labeling | ||
| GlycanAssure™ HyPerformance APTS Kit | Applied Biosystems | CAT #: A33952 |
| CellTrace™ CFSE Cell Proliferation Kit, for flow cytometry | Molecular Probes | CAT #: C34554 |
| viral RNA extraction kit | Qiagen | CAT#: 52906 |
| Deposited Data | ||
| RNAseq data | This paper | GEO GSE156177 |
| Experimental Models: Cell Lines | ||
| THP-1 Cells | ATCC | CAT#: TIB-202 RRID: CVCL_0006 |
| CEM-NKr (NK-resistant) cells | AIDS Research and Reference Reagent Program, NIAID, NIH | N/A |
| Experimental Models: Organisms/Strains | ||
| Oligonucleotides | ||
| Recombinant DNA | ||
| Software and Algorithms | ||
| Reactome database | Reactome.org | N/A |
| GeneMania Networks | Genemania.org | N/A |
| R programming language | Version 3.6.1 | https://www.r-proiect.org/ |
| GraphPad Prism | v6.03 | https://www.graphpad.com/scientific-software/prism/ |
| Cytoscape | cytoscape.org | |
| Other | ||
| FluoSpheres™ NeutrAvidin™-Labeled Microspheres, 1.0 μm, yellow-green fluorescent (505/515), 1% solids | Invitrogen | CAT#: F8776 |
| FluoSpheres™ NeutrAvidin™-Labeled Microspheres, 1.0 μm, red fluorescent (505/515), 1% solids | Invitrogen | CAT#: F8775 |
| MagPlex microspheres | Luminex corporation | CAT#: MC12001-01, MCI12040-01, MCI10077-01 |
| Streptavidin magnetic beads | New England Biolabs | CAT #: S1420S |
| protein A and G sepharose beads | GE Healthcare | CAT #: GE17-0780-01 |
Highlights.
We defined a putative protective SIV signature based on multiple antibody functions
Passive transfer of IgG from vaccinated macaques partially protected against SIV
These data demonstrate protective efficacy of vaccine-elicited antibodies in macaques
ACKNOWLEDGEMENTS
We thank P. Gilbert, W. Wagner, D. Burton, and B. Chen for generous advice, assistance, and reagents. We acknowledge support from the National Institutes of Health (AI060354, AI080289, AI102660, AI124377, AI126603, AI128751, AI129797, OD024917), the Samana Cay MGH Scholar Program, and the Ragon Institute of MGH, MIT, and Harvard.
Footnotes
Publisher's Disclaimer: This is a PDF file of an unedited manuscript that has been accepted for publication. As a service to our customers we are providing this early version of the manuscript. The manuscript will undergo copyediting, typesetting, and review of the resulting proof before it is published in its final form. Please note that during the production process errors may be discovered which could affect the content, and all legal disclaimers that apply to the journal pertain.
DECLARATION OF INTERESTS
D.H.B. is a co-inventor on related HIV-1 vaccine patents. The authors otherwise declare no competing financial interests.
REFERENCES
- Abbink P, Lemckert AA, Ewald BA, Lynch DM, Denholtz M, Smits S, Holterman L, Damen I, Vogels R, Thorner AR, et al. (2007). Comparative seroprevalence and immunogenicity of six rare serotype recombinant adenovirus vaccine vectors from subgroups B and D. J Virol 81, 4654–4663. [DOI] [PMC free article] [PubMed] [Google Scholar]
- Ackerman ME, Das J, Pittala S, Broge T, Linde C, Suscovich TJ, Brown EP, Bradley T, Natarajan H, Lin S, et al. (2018). Route of immunization defines multiple mechanisms of vaccine-mediated protection against SIV. Nature medicine. [DOI] [PMC free article] [PubMed] [Google Scholar]
- Barouch DH, Alter G, Broge T, Linde C, Ackerman ME, Brown EP, Borducchi EN, Smith KM, Nkolola JP, Liu J, et al. (2015). Protective efficacy of adenovirus/protein vaccines against SIV challenges in rhesus monkeys. Science 349, 320–324. [DOI] [PMC free article] [PubMed] [Google Scholar]
- Barouch DH, Liu J, Li H, Maxfield LF, Abbink P, Lynch DM, Iampietro MJ, SanMiguel A, Seaman MS, Ferrari G, et al. (2012). Vaccine protection against acquisition of neutralization-resistant SIV challenges in rhesus monkeys. Nature 482, 89–93. [DOI] [PMC free article] [PubMed] [Google Scholar]
- Barouch DH, Stephenson KE, Borducchi EN, Smith K, Stanley K, McNally AG, Liu J, Abbink P, Maxfield LF, Seaman MS, et al. (2013). Protective efficacy of a global HIV-1 mosaic vaccine against heterologous SHIV challenges in rhesus monkeys. Cell 155, 531–539. [DOI] [PMC free article] [PubMed] [Google Scholar]
- Barouch DH, Tomaka FL, Wegmann F, Stieh DJ, Alter G, Robb ML, Michael NL, Peter L, Nkolola JP, Borducchi EN, et al. (2018). Evaluation of a mosaic HIV-1 vaccine in a multicentre, randomised, double-blind, placebo-controlled, phase 1/2a clinical trial (APPROACH) and in rhesus monkeys (NHP 13-19). Lancet 392, 232–243. [DOI] [PMC free article] [PubMed] [Google Scholar]
- Bekker LG, Moodie Z, Grunenberg N, Laher F, Tomaras GD, Cohen KW, Allen M, Malahleha M, Mngadi K, Daniels B, et al. (2018). Subtype C ALVAC-HIV and bivalent subtype C gp120/MF59 HIV-1 vaccine in low-risk, HIV-uninfected, South African adults: a phase 1/2 trial. The lancet HIV 5, e366–e378. [DOI] [PMC free article] [PubMed] [Google Scholar]
- Cawley GC, and Talbot NLC (2010). On Over-fitting in Model Selection and Subsequent Selection Bias in Performance Evaluation. J Mach Learn Res 11, 2079–2107. [Google Scholar]
- Chung AW, Kumar MP, Arnold KB, Yu WH, Schoen MK, Dunphy LJ, Suscovich TJ, Frahm N, Linde C, Mahan AE, et al. (2015). Dissecting Polyclonal Vaccine-Induced Humoral Immunity against HIV Using Systems Serology. Cell 163, 988–998. [DOI] [PMC free article] [PubMed] [Google Scholar]
- Darrah PA, Patel DT, De Luca PM, Lindsay RW, Davey DF, Flynn BJ, Hoff ST, Andersen P, Reed SG, Morris SL, et al. (2007). Multifunctional TH1 cells define a correlate of vaccine-mediated protection against Leishmania major. Nat Med 13, 843–850. [DOI] [PubMed] [Google Scholar]
- Dugast AS, Chan Y, Hoffner M, Licht A, Nkolola J, Li H, Streeck H, Suscovich TJ, Ghebremichael M, Ackerman ME, et al. (2014). Lack of protection following passive transfer of polyclonal highly functional low-dose non-neutralizing antibodies. PLoS ONE 9, e97229. [DOI] [PMC free article] [PubMed] [Google Scholar]
- Ehrenberg PK, Shangguan S, Issac B, Alter G, Geretz A, Izumi T, Bryant C, Eller MA, Wegmann F, Apps R, et al. (2019). A vaccine-induced gene expressionsignature correlates with protection against SIV and HIV in multiple trials. Sci Transl Med 11. [DOI] [PMC free article] [PubMed] [Google Scholar]
- Escolano A, Gristick HB, Abernathy ME, Merkenschlager J, Gautam R, Oliveira TY, Pai J, West AP Jr., Barnes CO, Cohen AA, et al. (2019). Immunization expands B cells specific to HIV-1 V3 glycan in mice and macaques. Nature 570, 468–473. [DOI] [PMC free article] [PubMed] [Google Scholar]
- Fauci AS (2017). An HIV Vaccine Is Essential for Ending the HIV/AIDS Pandemic. JAMA 318, 1535–1536. [DOI] [PubMed] [Google Scholar]
- Galindo-Prieto B, Eriksson L, and Trygg J (2014). Variable influence on projection (VIP) for orthogonal projections to latent structures (OPLS). Journal of Chemometrics 28, 623–632. [Google Scholar]
- Gentleman R (2005). Bioinformatics and computational biology solutions using R and Bioconductor (New York: Springer Science+Business Media; ). [Google Scholar]
- Gentleman RC, Carey VJ, Bates DM, Bolstad B, Dettling M, Dudoit S, Ellis B, Gautier L, Ge Y, Gentry J, et al. (2004). Bioconductor: open software development for computational biology and bioinformatics. Genome biology 5, R80. [DOI] [PMC free article] [PubMed] [Google Scholar]
- Gomez-Roman VR, Florese RH, Patterson LJ, Peng B, Venzon D, Aldrich K, and Robert-Guroff M (2006). A simplified method for the rapid fluorometric assessment of antibody-dependent cell-mediated cytotoxicity. Journal of immunological methods 308, 53–67. [DOI] [PubMed] [Google Scholar]
- Gunn BM, Yu WH, Karim MM, Brannan JM, Herbert AS, Wec AZ, Halfmann PJ, Fusco ML, Schendel SL, Gangavarapu K, et al. (2018). A Role for Fc Function in Therapeutic Monoclonal Antibody-Mediated Protection against Ebola Virus. Cell host & microbe 24, 221–233 e225. [DOI] [PMC free article] [PubMed] [Google Scholar]
- Hamilton JA, Wu Q, Yang P, Luo B, Liu S, Hong H, Li J, Walter MR, Fish EN, Hsu HC, et al. (2017). Cutting Edge: Endogenous IFN-beta Regulates Survival and Development of Transitional B Cells. J Immunol 199, 2618–2623. [DOI] [PMC free article] [PubMed] [Google Scholar]
- Haynes BF, Gilbert PB, McElrath MJ, Zolla-Pazner S, Tomaras GD, Alam SM, Evans DT, Montefiori DC, Karnasuta C, Sutthent R, et al. (2012). Immune-correlates analysis of an HIV-1 vaccine efficacy trial. N Engl J Med 366, 1275–1286. [DOI] [PMC free article] [PubMed] [Google Scholar]
- Horwitz JA, Bar-On Y, Lu CL, Fera D, Lockhart AAK, Lorenzi JCC, Nogueira L, Golijanin J, Scheid JF, Seaman MS, et al. (2017). Non-neutralizing Antibodies Alter the Course of HIV-1 Infection In Vivo. Cell 170, 637–648 e610. [DOI] [PMC free article] [PubMed] [Google Scholar]
- Kwon HJ, Kim SN, Kim YA, and Lee YH (2016). The contribution of arachidonate 15-lipoxygenase in tissue macrophages to adipose tissue remodeling. Cell death & disease 7, e2285. [DOI] [PMC free article] [PubMed] [Google Scholar]
- Liu J, Ghneim K, Sok D, Bosche WJ, Li Y, Chipriano E, Berkemeier B, Oswald K, Borducchi E, Cabral C, et al. (2016). Antibody-mediated protection against SHIV challenge includes systemic clearance of distal virus. Science. [DOI] [PMC free article] [PubMed] [Google Scholar]
- Liu J, Keele BF, Li H, Keating S, Norris PJ, Carville A, Mansfield KG, Tomaras GD, Haynes BF, Kolodkin-Gal D, et al. (2010). Low-dose mucosal simian immunodeficiency virus infection restricts early replication kinetics and transmitted virus variants in rhesus monkeys. J Virol 84, 10406–10412. [DOI] [PMC free article] [PubMed] [Google Scholar]
- Liu J, O’Brien KL, Lynch DM, Simmons NL, La Porte A, Riggs AM, Abbink P, Coffey RT, Grandpre LE, Seaman MS, et al. (2009). Immune control of an SIV challenge by a T-cell-based vaccine in rhesus monkeys. Nature 457, 87–91. [DOI] [PMC free article] [PubMed] [Google Scholar]
- Lu LL, Chung AW, Rosebrock TR, Ghebremichael M, Yu WH, Grace PS, Schoen MK, Tafesse F, Martin C, Leung V, et al. (2016). A Functional Role for Antibodies in Tuberculosis. Cell 167, 433–443 e414. [DOI] [PMC free article] [PubMed] [Google Scholar]
- Mostafavi S, Ray D, Warde-Farley D, Grouios C, and Morris Q (2008). GeneMANIA: a real-time multiple association network integration algorithm for predicting gene function. Genome biology 9 Suppl 1, S4. [DOI] [PMC free article] [PubMed] [Google Scholar]
- Pauthner M, Havenar-Daughton C, Sok D, Nkolola JP, Bastidas R, Boopathy AV, Carnathan DG, Chandrashekar A, Cirelli KM, Cottrell CA, et al. (2017). Elicitation of Robust Tier 2 Neutralizing Antibody Responses in Nonhuman Primates by HIV Envelope Trimer Immunization Using Optimized Approaches. Immunity 46, 1073–1088 e1076. [DOI] [PMC free article] [PubMed] [Google Scholar]
- Pauthner MG, Nkolola JP, Havenar-Daughton C, Murrell B, Reiss SM, Bastidas R, Prevost J, Nedellec R, von Bredow B, Abbink P, et al. (2019). Vaccine-Induced Protection from Homologous Tier 2 SHIV Challenge in Nonhuman Primates Depends on Serum-Neutralizing Antibody Titers. Immunity 50, 241–252 e246. [DOI] [PMC free article] [PubMed] [Google Scholar]
- Plotkin SA (2008). Vaccines: correlates of vaccine-induced immunity. Clin Infect Dis 47, 401–409. [DOI] [PubMed] [Google Scholar]
- Plotkin SA (2010). Correlates of protection induced by vaccination. Clin Vaccine Immunol 17, 1055–1065. [DOI] [PMC free article] [PubMed] [Google Scholar]
- Roederer M, Keele BF, Schmidt SD, Mason RD, Welles HC, Fischer W, Labranche C, Foulds KE, Louder MK, Yang ZY, et al. (2014). Immunological and virological mechanisms of vaccine-mediated protection against SIV and HIV. Nature 505, 502–508. [DOI] [PMC free article] [PubMed] [Google Scholar]
- Rubtsova K, Rubtsov AV, Halemano K, Li SX, Kappler JW, Santiago ML, and Marrack P (2016). T Cell Production of IFNgamma in Response to TLR7/IL-12 Stimulates Optimal B Cell Responses to Viruses. PLoS ONE 11, e0166322. [DOI] [PMC free article] [PubMed] [Google Scholar]
- Snodgrass RG, and Brune B (2019). Regulation and Functions of 15-Lipoxygenases in Human Macrophages. Frontiers in pharmacology 10, 719. [DOI] [PMC free article] [PubMed] [Google Scholar]
- Subramanian A, Tamayo P, Mootha VK, Mukherjee S, Ebert BL, Gillette MA, Paulovich A, Pomeroy SL, Golub TR, Lander ES, et al. (2005). Gene set enrichment analysis: a knowledge-based approach for interpreting genome-wide expression profiles. Proc Natl Acad Sci U S A 102, 15545–15550. [DOI] [PMC free article] [PubMed] [Google Scholar]
- Wold S, Sjostrom M, and Eriksson L (2001). PLS-regression: a basic tool of chemometrics. Chemometrics and Intelligent Laboratory Systems 58, 109–130. [Google Scholar]
- Xiao B, Goh JY, Xiao L, Xian H, Lim KL, and Liou YC (2017). Reactive oxygen species trigger Parkin/PINK1 pathway-dependent mitophagy by inducing mitochondrial recruitment of Parkin. The Journal of biological chemistry 292, 16697–16708. [DOI] [PMC free article] [PubMed] [Google Scholar]
- Zhou J, Yang R, Zhang Z, Liu Q, Zhang Y, Wang Q, and Yuan H (2019). Mitochondrial Protein PINK1 Positively Regulates RLR Signaling. Frontiers in immunology 10, 1069. [DOI] [PMC free article] [PubMed] [Google Scholar]
- Zou H, and Hastie T (2005). Regularization and variable selection via the elastic net. Journal of the Royal Statistical Society: Series B (Statistical Methodology) 67, 301–320. [Google Scholar]
- Zumaquero E, Stone SL, Scharer CD, Jenks SA, Nellore A, Mousseau B, Rosal-Vela A, Botta D, Bradley JE, Wojciechowski W, et al. (2019). IFNgamma induces epigenetic programming of human T-bet(hi) B cells and promotes TLR7/8 and IL-21 induced differentiation. eLife 8. [DOI] [PMC free article] [PubMed] [Google Scholar]
Associated Data
This section collects any data citations, data availability statements, or supplementary materials included in this article.
Supplementary Materials
Figure S3. Systems serology analysis in vaccinated macaques. Related to Fig. 2. Unsupervised hierarchical clustering of immune profiling data. Y-axis depicts individual macaques; x-axis depicts immune parameters. Yellow to blue shading represents the magnitude (positive to negative) of each response in the animals.
Figure S2. Immune features correlated with protection in prior SIV and SHIV vaccine studies. Related to Fig. 1. Correlates of protection in prior (A, B) SIVmac251 (Barouch et al., 2015) and (C, D) SHIV-SF162P3 (Barouch et al., 2018) Ad26/Env vaccine studies in rhesus macaques. Supervised principal component analyses (PCA) showing (A, C) protective efficacy and (B, D) relevant immune features. Yellow to blue shading represents robust to weak protection in each of the animals.
Figure S1. Systems serology analysis in prior SIV and SHIV vaccine studies. Related to Fig. 1. Immune profiles in prior (A, B) SIVmac251 (Barouch et al., 2015) and (C, D) SHIV-SF162P3 (Barouch et al., 2018) Ad26/Env vaccine studies in rhesus macaques. (A, C) Unsupervised hierarchical clustering of immune profiling data. Y-axis depicts individual macaques; x-axis depicts immune parameters. Yellow to blue shading represents the magnitude (positive to negative) of each response in the animals. (B, D) Supervised principal component analyses (PCA) showed clustering of animals based on the vaccine regimen received.
Figure S4. Transcriptomics analysis in vaccinated macaques. Related to Fig. 5. (A) A multi-dimensional scaling (MDS) plot was used to highlight the transcriptomic variances of the full data set (blue square, pre-boost; red circle, day 1 post-boost; green triangle, day 7 post-boost; purple +, week 20 post-boost). (B) Gene Set Enrichment Analysis (GSEA) was used to identify pathways that were induced on day 1, day 7, and week 20 post-boost compared to pre-boost. Significantly induced pathways from the Hallmark database are plotted along the y-axis. NES score with red and blue squares reflects positive and negative enrichment, respectively. (C) Jitter plot confirming the spread of the 26 animals with available RNA-Seq data into the quartiles defined by the predicted protection rank score (Fig. 4).
Figure S5. IL-4 and IL-13 signature includes both TFH and TH2 signatures in vaccinated macaques. Related to Fig. 5. The enrichment of Th2/Th1/TFH pathways on day 1 post boost using the immunologic gene-sets database (c7, mSigDB) showed a significant enrichment (GSEA, p<0.05) of both Th2 and TFH associated gene-sets. Gene mania was used to plot the leading edge genes mapping to these pathways, which included ICOS (enhancer of T-cell response) and CTLA4 (immune checkpoint for T-cell activation). Significantly up-regulated pathways are represented as red barplot, and both Th2 and TFH pathways are highlighted in networks.
Figure S6. Pathways induced on day 1 and day 7 post-boost. Related to Fig. 5. (A) Gene Set Enrichment Analysis (GSEA) was used to highlight TLR signaling pathways induced on day 1 post-boost in animals in quartile I compared with animals in quartiles II-IV. NES score reflects the degree of positive enrichment. Dotted box around the GeneRIF TLR signature highlights this persistently significant signature. (B) A coexpression network was plotted to highlight the interaction of the upregulated TLR signaling genes on day 1 post-boost that were positively correlated with the protection rank score. (C) GSEA was used to define pathways induced on day 7 post-boost that were most correlated with the protection rank score. The bar plot represents the top positively enriched pathways on the y-axis and the NES score on the x-axis. Coexpression networks were plotted to highlight the interaction of upregulated (D) type 1 interferon and (E) macrophage signaling genes on day 7 post-boost that were positively correlated with the protection rank score. Cytoscape was used to plot the co-expression network highlighting the top leading edge genes significantly enriched. GeneMania was used to infer network connections and co-expression.
Figure S7. Protective efficacy following adoptive transfer of purified IgG in individual groups. Related to Fig. 7. (A) Kaplan-Meier curve depicting the number of challenges required for infection in sham control macaques and in macaques that received IgG from animals in quartiles I, II, III, and IV. (B) Statistical analyses of protective efficacy by log-rank tests, Cox proportional hazard models, and Weibull survival models.
Data Availability Statement
All data generated during the current study is available in the figures and supplemental material. RNAseq data has been deposited in the Gene Expression Omnibus (GEO) database under accession number GSE156177.