

SUMMARY
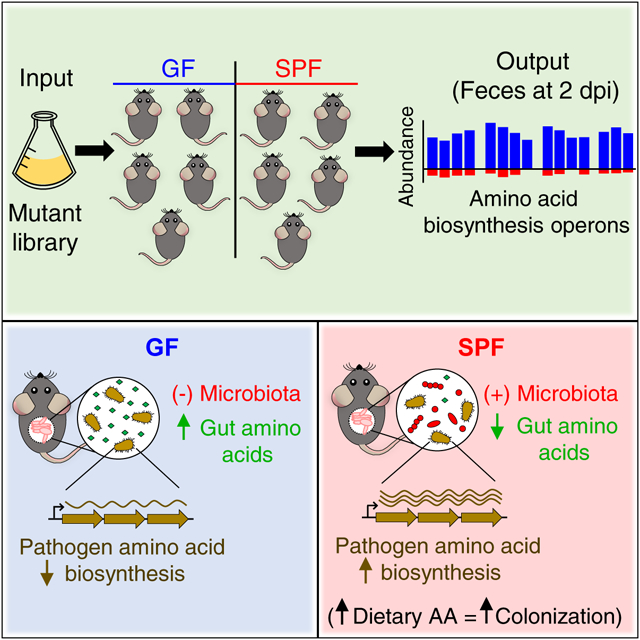
The microbiota confers host protection by limiting the colonization of pathogenic bacteria in the gut, but the mechanisms by which pathogens overcome colonization resistance remain poorly understood. Using a high-density transposon screen in the enteric pathogen Citrobacter rodentium, we find that the bacterium requires amino acid biosynthesis pathways to colonize conventionally raised mice, but not germ-free or antibiotic-treated animals. These metabolic pathways are induced during infection by the presence of the gut microbiota. Reduced amounts of amino acids are found in the gut of conventionally raised mice compared with germ-free animals. Dietary administration of high protein increases amino acid levels in the gut and promotes pathogen colonization. Thus, depletion of amino acids by the microbiota limits pathogen colonization, and in turn the pathogen activates amino acid biosynthesis to expand in the presence of the microbiota.
Keywords: C. rodentium, colonization resistance, microbiota, enteric pathogen, Tn-seq, amino acid biosynthesis
Graphical Abstract
In Brief (eTOC Blurb)
The mechanisms allowing pathogens to subvert colonization resistance are poorly understood. Using a high-density mutant library, Caballero-Flores et al. identify genes required for early pathogen expansion in the presence of the gut microbiota. They find that induction of pathogen amino acid biosynthesis and increased dietary amino acids promote pathogen colonization.
INTRODUCTION
The gastrointestinal tract of mammals is colonized by trillions of symbionts, collectively known as the gut microbiota, which provide several host benefits including digestion and absorption of nutrients, development of the immune system, and biosynthesis of micronutrients (Pickard et al., 2017; Sekirov et al., 2010). Additionally, the microbiota serves as a natural barrier to prevent the invasion and expansion of pathogens, a function termed colonization resistance (Baümler and Sperandio, 2016; Pickard et al., 2017). Several processes have been proposed to explain the host protection conferred by the microbiota including induction of immune responses, reduction of luminal oxygen and production of antimicrobial compounds (Baümler and Sperandio, 2016; Pickard et al., 2017). However, the mechanisms that pathogens employ to expand in the gut early during infection remain poorly understood.
Enteropathogenic Escherichia coli (EPEC) and Enterohemorrhagic E. coli (EHEC) are important causes of diarrhea and mortality worldwide (Croxen et al., 2013; Hartland et al., 2013). These pathogens employ a Type-III secretion system (T3SS) to attach to and colonize the intestine, thus inducing the formation of attaching and effacing (A/E) lesions on the intestinal epithelium (Kaper et al., 2004; Mundy et al., 2005). Due to the lack of a small animal model of disease for EPEC and EHEC, Citrobacter rodentium, a mouse pathogen that also harbors a homologous T3SS and induces A/E lesions, has been extensively used as a model for studying human infection by these pathogens (Collins et al., 2014; Mullineaux-Sanders et al., 2019). Several studies have addressed the mechanisms of C. rodentium pathogenesis and host response during acute infection and inflammation (Collins et al., 2014; Mullineaux-Sanders et al., 2019). In the gut, the pathogen evades competition with the microbiota, at least in part, by attaching to the epithelium and triggering epithelial hyperplasia via the T3SS (Kamada et al., 2012; Lopez et al., 2016). However, the strategies that C. rodentium employ to overcome colonization resistance in the initial phase of infection, before the onset of inflammation, remain largely unknown. Here, we used Transposon sequencing (Tn-Seq) analysis, an unbiased genetic approach that combines signature-tagged mutagenesis with high-throughput DNA sequencing (Goodman et al., 2009; van Opijnen et al., 2009), to identify genetic pathways that C. rodentium employs to subvert colonization resistance in the gut.
RESULTS
Identification of C. rodentium genes selectively required for host colonization in the presence of the microbiota.
We generated a high-density mutant library in C. rodentium comprising ~50,000 independent mutants containing single-transposon insertions in ~90% of the genes of the pathogen, as shown by Illumina sequencing of DNA extracted from the whole mutant library (Figure S1A). Sequencing of two replicates of the same library showed that the number of mutants identified were highly similar in both samples (R2 = 0.995) (Figure S1B), indicating that library preparation and sequencing are highly reproducible. Oral inoculation of the mutant library showed ~3 log lower pathogen loads in the feces of specific-pathogen free (SPF) mice on day 1, and ~1 log lower difference on day 2, compared with germ-free (GF) animals whereas minimal or no differences were observed at the peak of infection between both groups of animals (Figure S1C). Importantly, the percentage of mutated genes detected at day 2 after gavage was similar in GF and SPF mice compared with the input (Figure S1D), indicating that the screen is feasible despite the observed infection bottleneck. To identify genes required for pathogen colonization in the absence and presence of the microbiota, we then measured the relative abundance of all single mutants both in the input and the stool of GF and SPF mice 2 days after infection (Figure 1A). We found higher numbers of mutants with marked defects (>10-fold decrease) in intestinal colonization in SPF than in GF mice (Figure S1E to 1F, Table S1).
Figure 1. Identification by Tn-Seq of C. rodentium genes selectively required for host colonization in the presence of the microbiota.
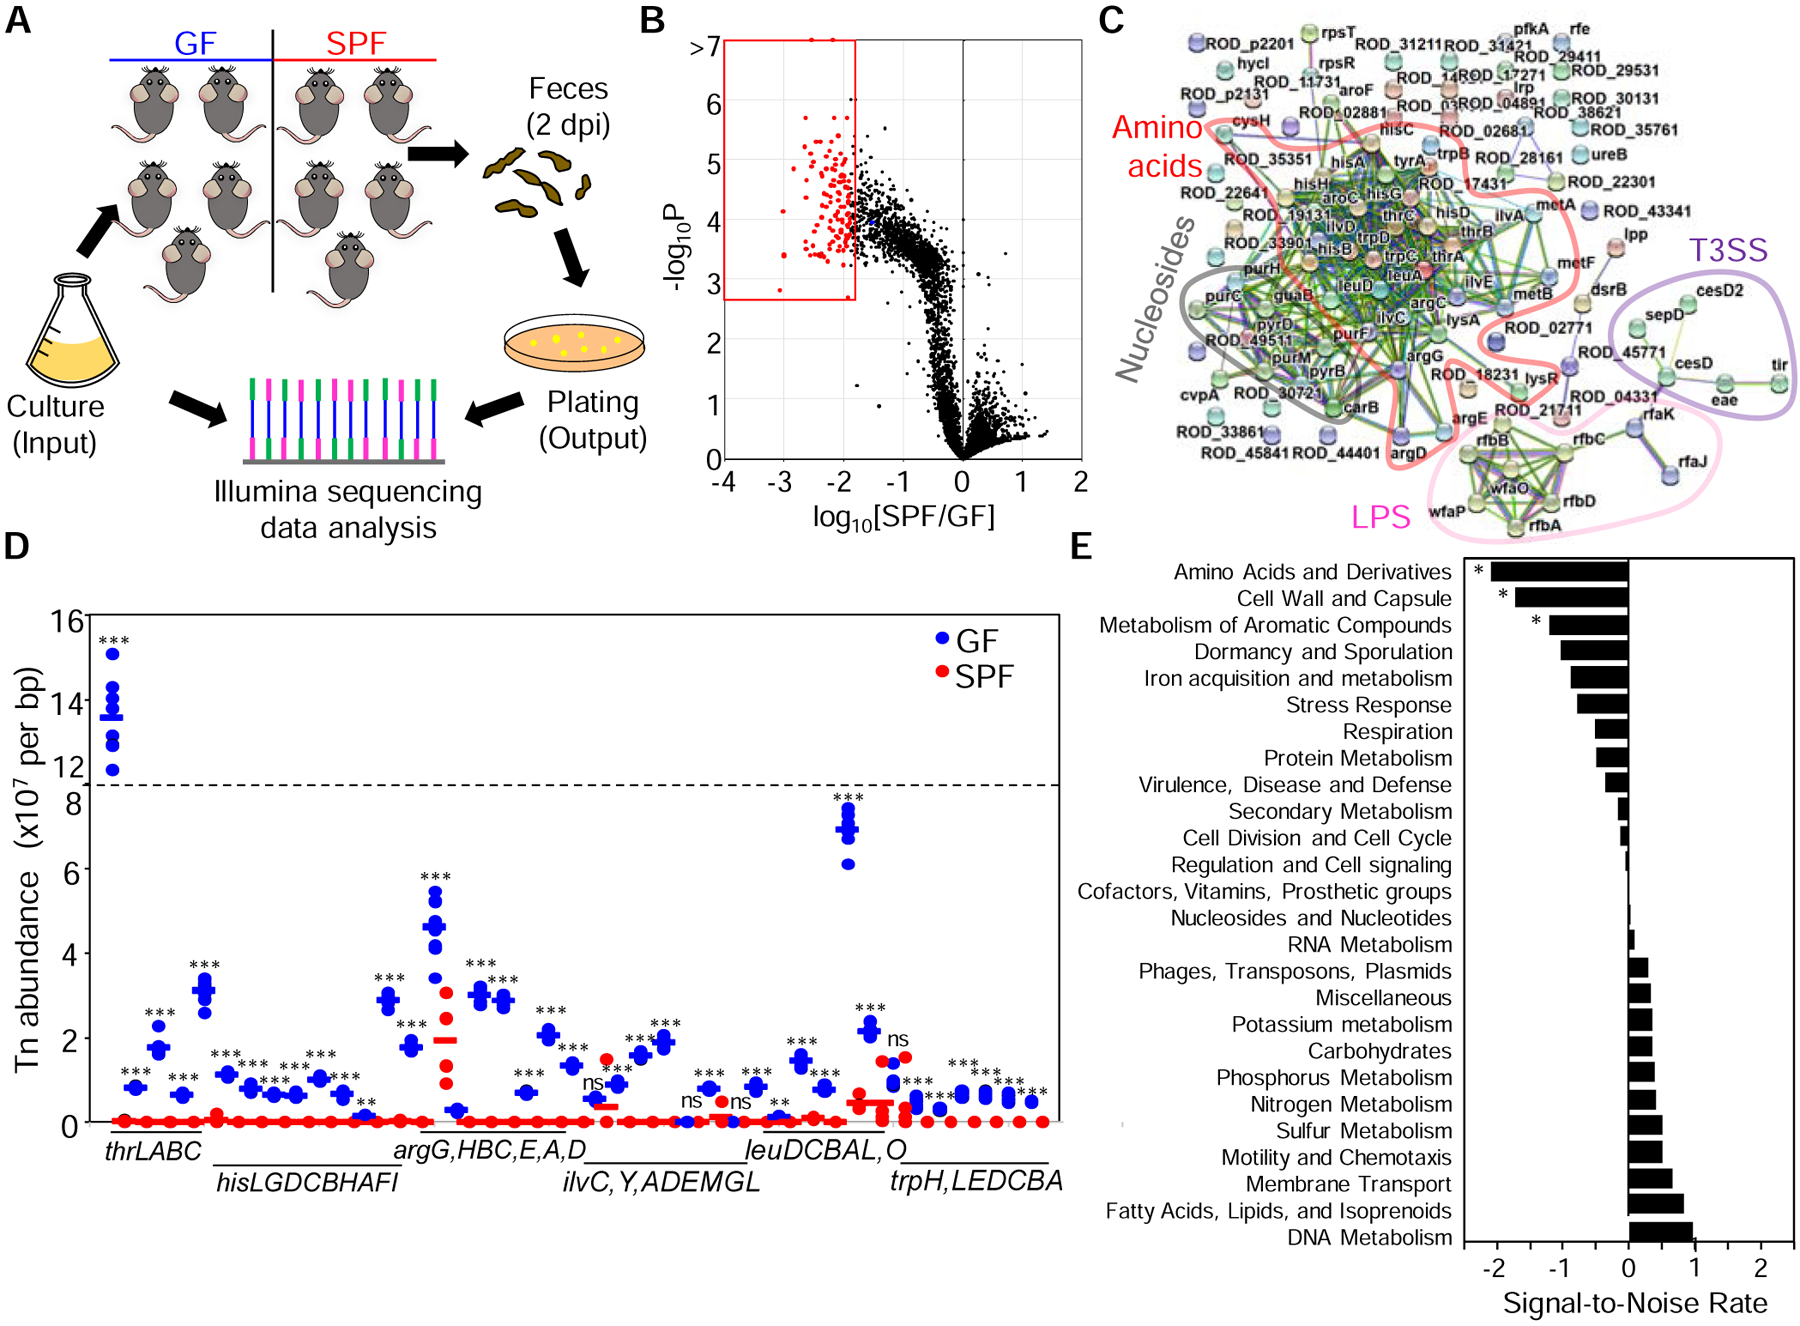
(A) A transposon mutant library was grown in vitro (input) and inoculated into GF and SPF mice. Feces were collected and plated two days post-infection (output). DNA was isolated from the input and output and sequenced by Illumina. (B) SPF/GF abundance ratios and p-values per mutated gene (dots). Red dots, top-100 genes showing the lowest SPF/GF ratios. (C) Interaction network for the top-100 genes with the lowest SPF/GF ratios. Protein-protein interactions were obtained with STRING. Most represented functional nodes are highlighted. (D) Transposon densities for operons and individual genes of the most represented AA biosynthetic pathways. (E) Mutated genes were grouped in functional categories and a SNR analysis was performed using SPF/GF ratios. Results from an experiment with n= 4–8 per group are shown (A-E). Each dot represents one mouse (D). *, p<0.05, **, p<0.01; ***, p<0.001; ns, not significant by Mann-Whitney U test (D) or Metastats test (E) comparing GF vs SPF groups. See also Figure S1 and Table S1.
We next calculated SPF/GF abundance ratios ([SPF/input]/[GF/input]) for each mutant to identify genes selectively required for efficient pathogen colonization in the presence, but not in the absence of the microbiota. The top-100 C. rodentium genes with the lowest SPF/GF ratios showed ~100 to 1000-fold lower abundance in SPF than in GF mice (Figure 1B, red dots). These genes clustered into four main functional groups: AA-, nucleoside- and lipopolysaccharide (LPS)-biosynthesis, and components of the T3SS (Figure 1C). The T3SS has been previously shown to be required for colonization of SPF but not GF mice (Kamada et al., 2012). The largest group contained 32 genes required for AA biosynthesis, with arginine (Arg), threonine (Thr), histidine (His), tryptophan (Trp) and branched-chain AA (BCAA) being the most represented pathways (Figure 1C and Table S1). We separately analyzed the average mutant numbers per animal for genes of such AA biosynthesis pathways and found that most of these mutants were recovered at higher numbers from GF mice than from SPF animals, in which their abundance (sequence reads) were close to zero (Figure 1D). We then grouped genes into functional categories and performed signal-to-noise ratio (SNR) analysis using their SPF/GF abundance ratios. This analysis showed that pathogen AA biosynthetic pathways, cell wall and capsule biosynthesis, and metabolism of aromatic compounds were significantly decreased in SPF compared to GF mice (Figure 1E). Collectively, these results suggest that biosynthesis of AA, among other functional categories, are required for pathogen colonization of SPF but not GF mice.
Pathogen AA biosynthesis is required for host colonization in the presence but not in the absence of the microbiota.
We focused our analyses on the role of pathogen AA biosynthesis in colonization resistance because this functional category contained the largest number of genes selectively required for pathogen colonization in the presence of the microbiota. To validate the Tn-Seq data, we generated single C. rodentium isogenic mutants lacking genes encoding essential enzymes for the biosynthesis of His (hisI), Ileucine (ilvA), Trp (trpA), Arg (argG), and Thr (thrC). These mutants showed no growth defects in rich medium compared with the wild-type (WT) strain and they were able to grow normally in minimal medium when the corresponding AA was supplemented to the medium (Figure 2A), thus indicating that these mutants have no additional fitness defects other than biosynthesis of a specific AA. We next compared the fitness of C. rodentium WT and single AA mutants by inoculating SPF and GF mice with a 1:1 mixture of both strains and measuring their fecal loads at different time points after infection. In accordance with the Tn-Seq data, colonization of these mutants was greatly impaired early after infection and abolished from the gut of SPF mice by day 5 compared with the WT bacterium (Figure 2B). In contrast, recovery of AA biosynthesis mutants was largely comparable to that of the WT after co-infection in GF mice (Figure 2C). We also inoculated 1:1 mixtures of WT and mutant C. rodentium strains into naïve SPF mice and SPF animals treated with a cocktail of antibiotics to deplete the microbiota. Consistent with experiments in GF mice, competitive indexes of all mutants were reduced ~ 5-logs by day 7 after co-infection in untreated mice, but only marginally or not at all, in antibiotic-treated animals (Figure 2D). Collectively, these results indicate that presence of intact AA biosynthesis pathways is required for pathogen expansion and colonization in the presence, but not in the absence of the microbiota.
Figure 2. Pathogen AA biosynthesis is required for host colonization in the presence but not in the absence of the microbiota.
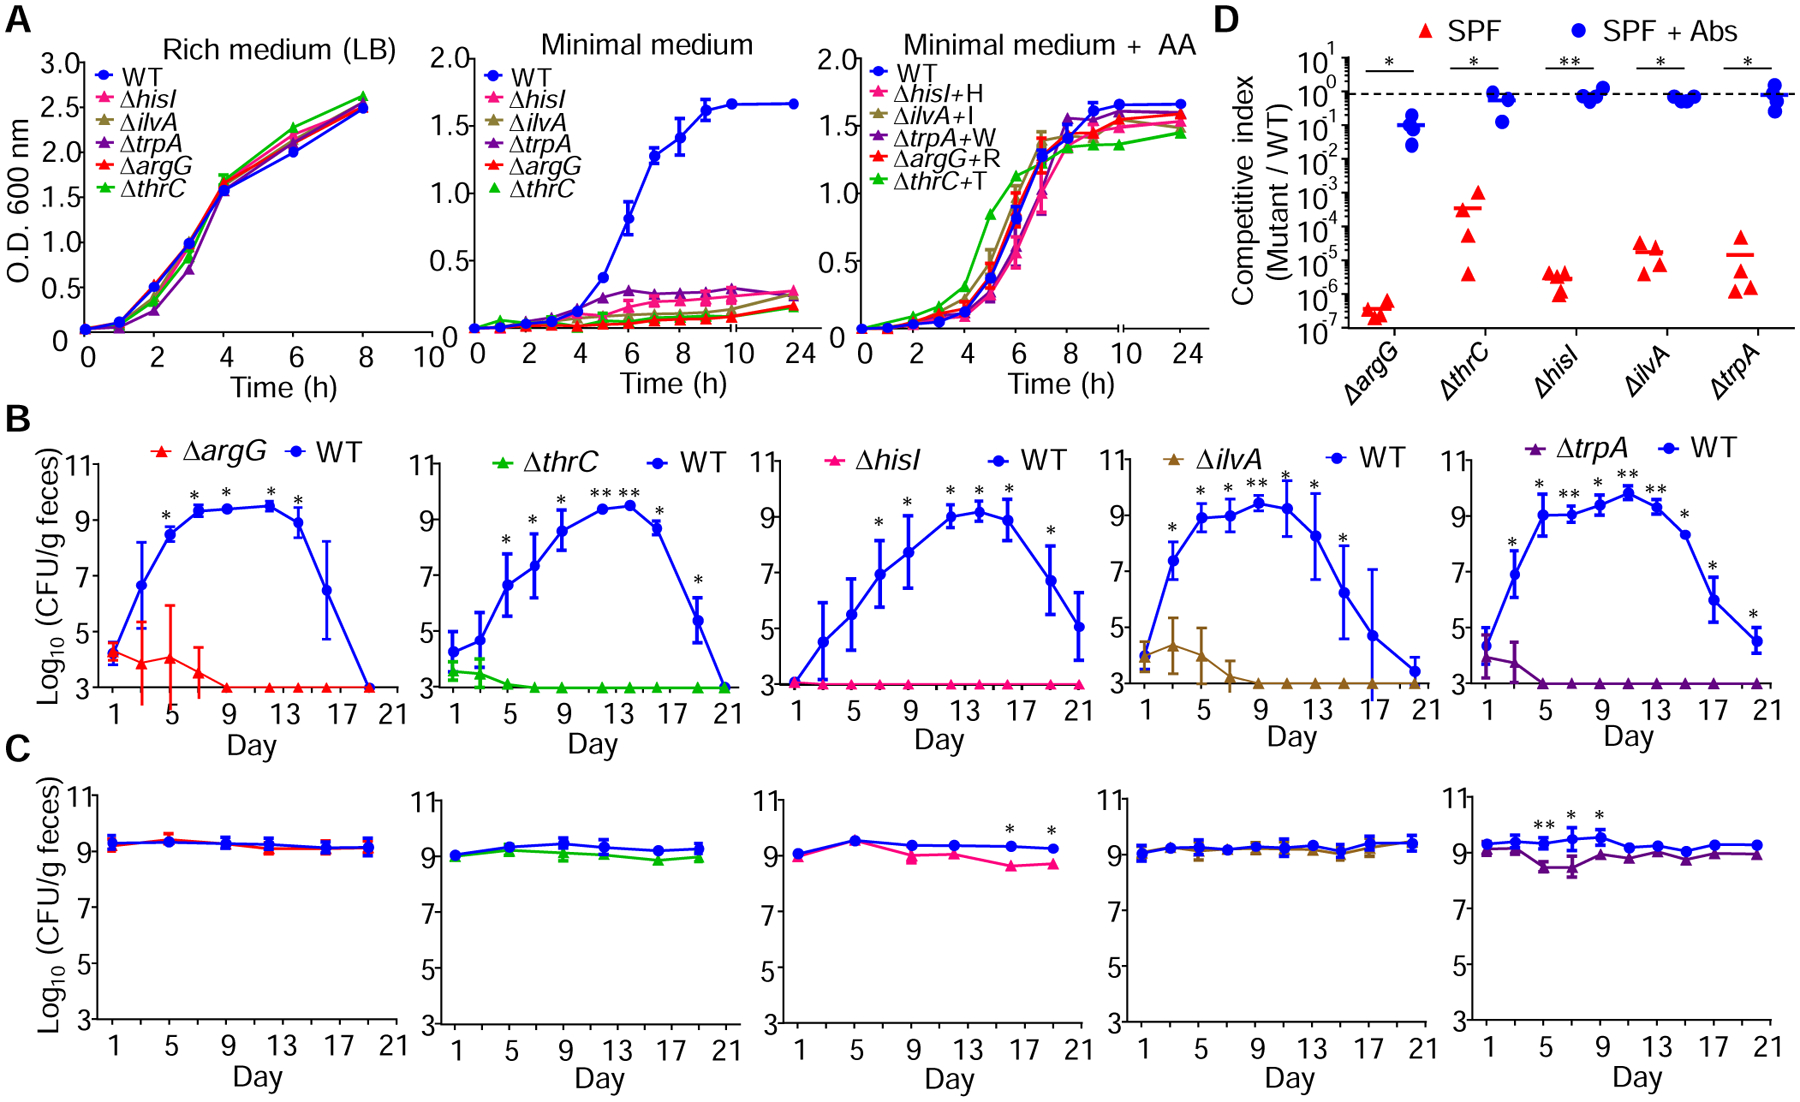
(A) Isogenic-AA deficient mutants were grown in LB, MOPS or MOPS + the indicated AA and O.D. at 600 nm was measured over time. H, His; I, Ile; W, Trp; R, Arg; T, Thr. (B and C) SPF (upper panels) or GF mice (lower panels) were inoculated with 1:1 mixtures of C. rodentium WT and the indicated mutants. WT and mutant loads were determined in feces at the indicated time points. (D) SPF mice were treated or not with antibiotics 7 days before and after infection with 1:1 mixtures of C. rodentium WT and the indicated mutants. Competitive indexes in feces at day 7 are shown. Dotted line, expected 1:1 ratio (equal fitness). Data are means ± SD (A-C) and representative of two independent experiments with n= 4–5 per group (A-D). Each symbol represents one mouse (D). *, p<0.05; **, p<0.01 by Mann-Whitney U test. See also Table S2.
Expression of pathogen AA biosynthesis genes is enhanced by the presence of the microbiota
We next examined whether the expression of pathogen AA biosynthesis genes was influenced by the presence of the microbiota using qRT-PCR and pathogen-specific primers (Table S2). The expression of C. rodentium argG, hisA, ilvA and trpC, four representative genes required for AA biosynthesis, was higher in the cecum of SPF mice than in GF animals (Figure 3A to 3D). This difference was also observed in the colon of SPF and GF mice after infection (Figure 3E to 3H). To determine whether the presence of the microbiota influences the amount of AA in the gut, we measured the concentration of AA both in the cecum and colon of SPF and GF mice. The analysis revealed that amounts of multiple AA were highly reduced in the cecal and colonic contents of SPF mice compared with those found in GF animals (Figure 3I).
Figure 3. Expression of pathogen AA biosynthesis is enhanced, and luminal AA reduced by the presence of the microbiota.
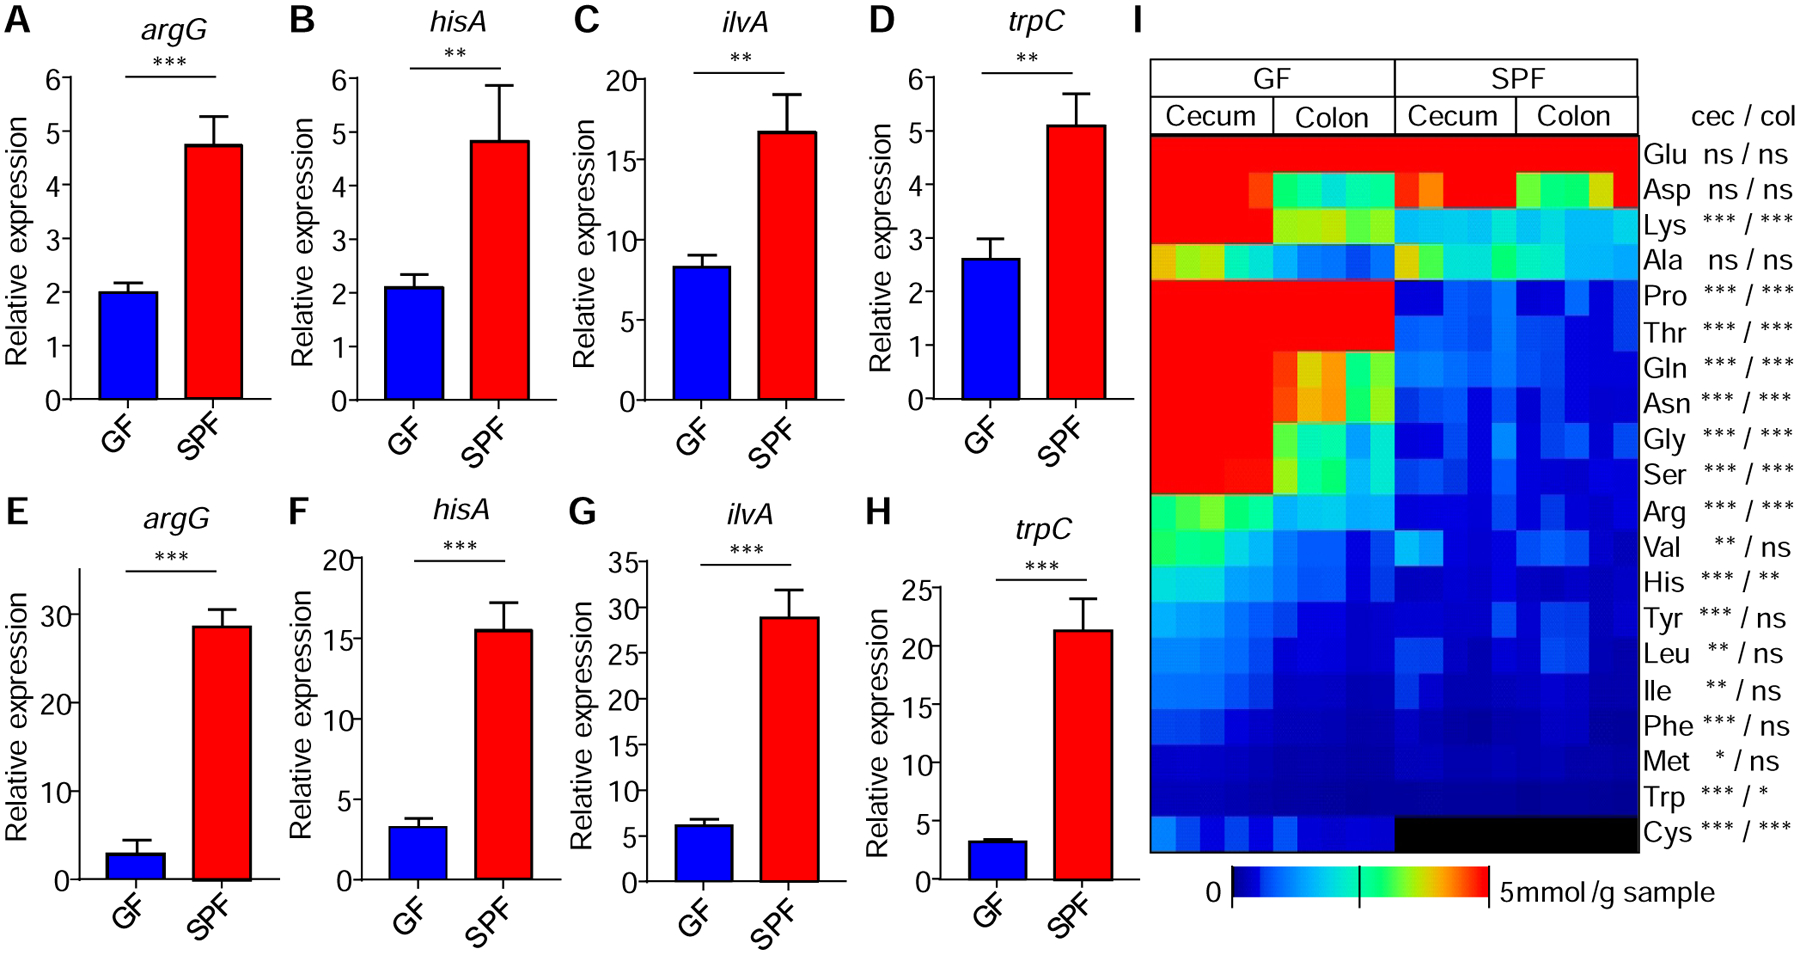
(A-H) Expression by qRT-PCR of the indicated C. rodentium AA genes in the ceca (upper panels) and colons (lower panels) of SPF mice at day 3 and 7 post-infection, respectively. (I) AA concentrations in cecum and colon of GF and SPF mice determined by CE-TOFMS. Each column represents one mouse. Data are means ± SEM and pooled from two independent experiments with n= 8 per group (A-H). Each column represents one mouse (I). *, p<0.05; **, p<0.01; ***, p<0.001; ns, not significant by unpaired two-tailed T- test comparing GF vs SPF (A-I). See also Table S2.
Administration of a high protein diet enhances pathogen colonization in the gut
The results shown above suggest that the microbiota limits the colonization of C. rodentium early during infection by depleting the concentration of AA in the gut, while the pathogen induces AA biosynthesis to subvert such a deficiency. We thus hypothesized that increased amounts of dietary protein may influence C. rodentium colonization in the gut. To test this, we designed two isocaloric, simple sugar diets containing either 14% or 50% protein content (Table S3) and fed them to SPF mice starting one week prior to pathogen inoculation (Figure 4A). We found that mice treated with 50% protein and inoculated with 109 colony-forming units (cfu) showed ~3 log higher pathogen loads on day 1 post-infection compared with mice fed to 14% protein diet (Figure 4B). These differences in pathogen colonization were mainly observed early after infection and lessened after the peak of pathogen expansion or during the eradication phase (Figure 4B). In contrast, similar pathogen loads were observed in SPF mice fed with the 14% or 50% protein diets when the mice were treated with antibiotics to deplete the microbiota (Figure 4C). Since the major difference in pathogen loads between mice treated with 14% or 50% protein diet was observed early after infection (Figure 4B), we tested whether short exposure to high protein during early infection is sufficient to promote pathogen colonization. Groups of SPF mice were fed the 14% or 50% protein diet for one day, inoculated with the pathogen, and then switched to regular chow one day after infection (Figure 4D). As previously observed, short administration of 50% protein to mice inoculated with 107 cfu showed a ~3 log increased in pathogen loads starting on day 1 post-infection and remained increased until the peak of infection compared to animals given the 14% protein diet (Figure 4E). Likewise, mice treated with the 50% protein diet and infected with 106 cfu showed increased pathogen levels early during infection, but also shorter colonization kinetics compared with the 14% group (Figure 4F). In contrast, detectable pathogen colonization was not observed when mice were treated with the 14% protein diet and inoculated with 105 cfu, whereas robust pathogen colonization was still observed in all mice fed 50% protein (Figure 4G). Consistently, there was marked gut inflammation and high pathology scores in mice inoculated with 105 cfu and fed the 50% protein diet, while intestinal inflammation was undetectable in infected mice treated with 14% protein (Figure 4H and 4I).
Figure 4. Administration of a high protein diet enhances pathogen colonization in the gut.
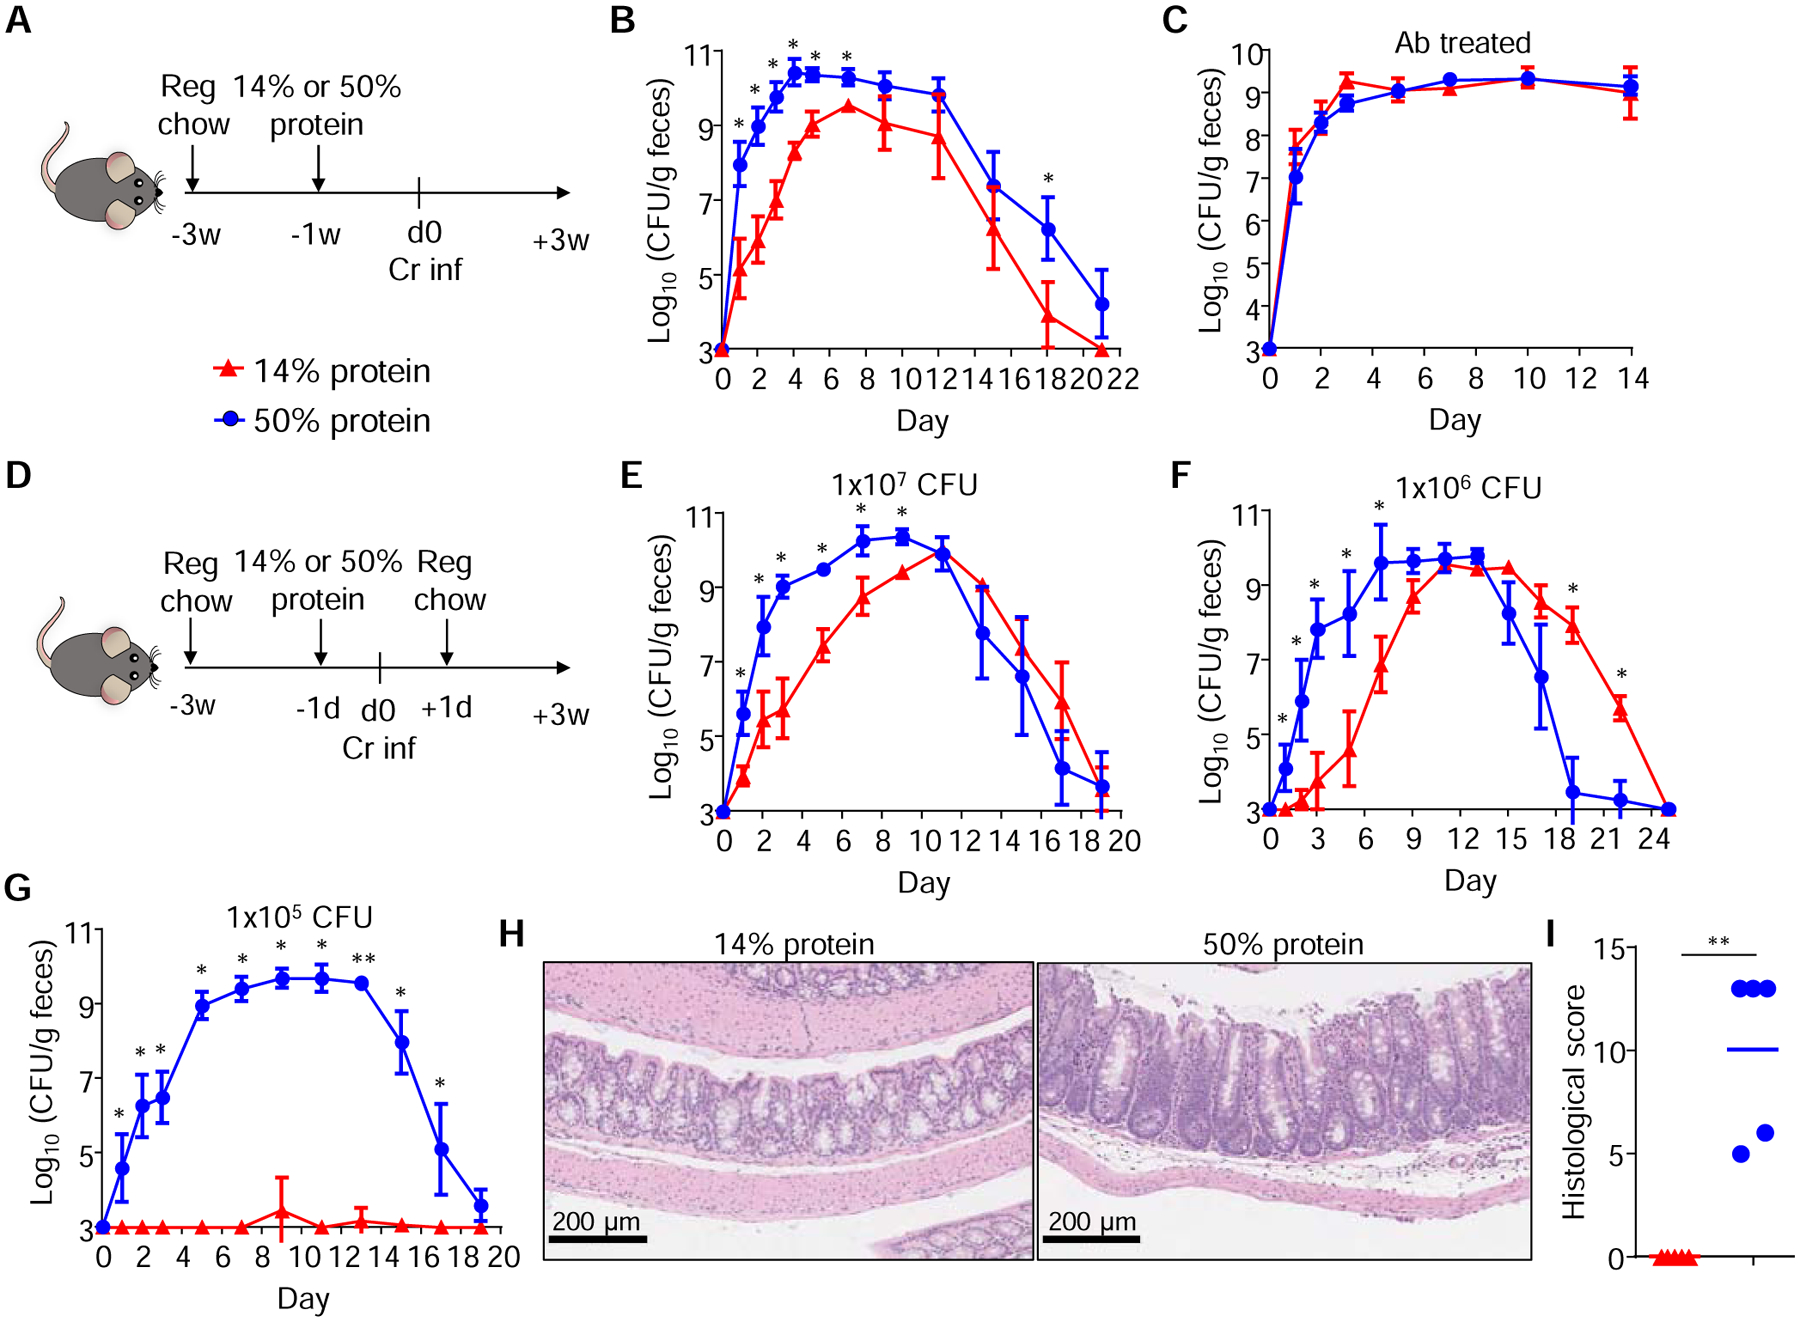
(A) SPF mice were fed a 14% or 50% protein diet 1 week before (and then maintained after) infection with 109 cfu of C. rodentium. (B) C. rodentium loads in feces of SPF mice treated as in (A). (C) Pathogen loads in feces of SPF mice treated as in (A) plus antibiotics in drinking water. (D) SPF mice were fed a 14% or 50% protein diet 1-day before and after C. rodentium infection, and then switched back to regular chow. (E-G) Pathogen loads in feces of SPF mice treated as in (D) and inoculated with 107 (E), 106 (F) or 105 (G) cfu. (H-I) Representative H&E staining sections (H) and pathology scores (I) of colons harvested from mice treated as in (G). Data are means ± SD and representative of at least two independent experiments with n= 4–5 per group (A-I). Each dot represents one mouse (I). *, p<0.05; **, p<0.01 by Mann-Whitney U test. See also Figures S2 to S4 and Table S3.
High protein diets may reduce the normal gastric acidity in humans and animals (Brooks, 1985; Lennard-Jones et al., 1968), which in turn might influence bacterial killing in the stomach. To assess this possibility, we treated SPF mice with the 14% or 50% protein diets 2 days before C. rodentium infection and then measured pathogen loads in the stomach and small intestine 1 hour after infection (Figure S2A). We did not observe differences in C. rodentium loads in the stomach or small intestine between mice treated with 14% or 50% protein diets at this early time point (Figure S2B). Our 14% and 50% protein diets used are isocaloric, but the 50% protein diet contains reduced (32%) sugar content compared with the 14% protein diet (Table S3). To exclude that reduced amounts of sugar in the 50% protein diet are responsible for enhanced pathogen colonization, we tested another isocaloric diet containing 14% protein but 31% sugar (Table S3). We found that the 14% protein/31% sugar diet did not promote pathogen colonization (Figure S2C and 2D). We also evaluated whether short-term administration of the 14% or 50% protein diet alters composition of the gut microbiota. We treated mice with the special protein diets for 1 day and then analyzed fecal microbial diversity by 16S rDNA sequencing (Figure S3A). Although microbial β-diversity was affected by 1-day treatment with the special protein diets compared with regular chow (−1d vs d0 in Figure S3B), no significant differences in β-diversity or composition of the microbiota was observed between mice fed the 14% and 50% protein diets (Figure S3B and 3C). Furthermore, when the 14% protein diet was used as baseline diet instead of regular chow (Figure S3D), short treatment with the 50% protein diet also promoted C. rodentium colonization (Figure S3E) but it did not change the composition of the microbiota compared with the 14% protein diet (Figure S3F and 3G).
The experiments described above suggest that short treatment with high protein promotes C. rodentium colonization by increasing the amount of AA in the gut. Because C. rodentium colonizes the distal small intestine before early expansion in the cecum, and the subsequent colonization of the colon (Kamada et al., 2012; Mullineaux-Sanders et al., 2019), we measured the concentration of AA in the small intestine, cecum and colon of SPF mice treated with the 14% or 50% protein diet for 2 days. The analysis revealed a marked increase in the amounts of AA in the small intestine and a modest increase in some AA in cecum and colon of mice treated with 50% protein compared with animals given 14% protein (Figure S4A to 4C). These results suggest that a high protein diet promotes enhanced pathogen colonization in the gut early during infection by increasing the amounts of AAs in the small intestine.
DISCUSSION
In this study, we used an unbiased Tn-Seq approach to identify C. rodentium genes required for early colonization in SPF and GF mice and identified AA biosynthesis and LPS-, nucleoside- and T3SS-related pathways as important factors selectively required for pathogen colonization in the presence of the microbiota. A previous Tn-Seq screen identified AA biosynthesis as an important pathway for EHEC colonization in the infant rabbit model (Warr et al., 2019). Furthermore, other Tn-Seq screens with the enteric pathogens Vibrio cholerae and Campylobacter jejuni also revealed AA- and LPS-biosynthesis, and nucleotide metabolism as critical pathways for intestinal colonization in conventionally raised animals (Fu et al., 2013; Gao et al., 2017). However, these studies did not validate experimentally the importance of these pathways, and more importantly, did not assess their effect on pathogen colonization in GF or antibiotic-treated mice and SPF animals. Consequently, these previous studies did not reveal a link to colonization resistance mechanisms or provide insights into the mechanism by which pathogens overcome such inhibition by the microbiota. Although further work is needed to understand the interaction between enteric pathogens, intestinal metabolites and the gut microbiota through different metabolic pathways, these observations provide evidence that AA-, nucleoside- and cell wall-biosynthesis pathways are used by multiple pathogens to subvert colonization resistance in the gut.
GF mice transplanted with the microbiota from patients with diarrhea showed increased gut AA concentrations and greater susceptibility to Clostridioides difficile infection whereas prophylactic dietary intervention with low protein diet in mice resulted in decreased pathogen expansion (Battaglioli et al., 2018). In the C. rodentium model, we show that the microbiota limits the availability of AA in the gut of SPF mice, whereas administration of a high protein diet markedly enhances early pathogen colonization. At high and moderate doses of inoculum, the protein-rich diet enhanced pathogen colonization early on after infection but not at the peak of bacterial expansion or during the eradication phase. With low pathogen inoculums, only the high protein diet allowed pathogen colonization. These observations suggest a model in which robust pathogen colonization requires a minimum threshold of pathogens that can only be reached at low inoculum doses after high protein intake. In conventionally raised mice, we observed robust expression of pathogen AA biosynthesis genes in the cecum and colon which contain lower AA concentrations compared to GF animals. Consistent with this, E. coli, a bacterium highly related to C. rodentium, induces AA biosynthesis genes in response to low AA concentrations in culture (Tao et al., 1999). Administration of a high protein diet was associated with a marked increase in AA in the small intestine, but only modest increases of certain AA in the cecum and colon. Because C. rodentium colonizes the distal small intestine before expansion in the cecum, and subsequent colonization of the colon (Kamada et al., 2012; Mullineaux-Sanders et al., 2019), increased amounts of AA in the small intestine may result in a higher number of pathogens passing to the cecum where the pathogen induces biosynthesis of AA pathways to overcome limiting amounts of AA. The current study may help the design of new strategies to prevent or treat enteric infections by targeting pathogen metabolic pathways such as AA biosynthesis through dietary or other types of interventions.
STAR METHODS
RESOURCE AVAILABILITY
Lead Contact
Further information and requests for resources and reagents should be directed to and will be fulfilled by the Lead Contact, Gabriel Nunez (gabriel.nunez@umich.edu).
Materials Availability
Any newly generated items in this work will be directly shared with interested parties upon request.
Data and Code Availability
Raw sequence datasets obtained in this study are freely available at https://www.ncbi.nlm.nih.gov under the following BioProject accession numbers: TnSeq data (PRJNA635914); 16S rRNA data (PRJNA635912).
EXPERIMENTAL MODEL AND SUBJECT DETAILS
Animals
SPF mice on the C57BL/6 background were originally purchased from Jackson Laboratories and bred under SPF conditions in our mouse facility at the University of Michigan. GF C57BL/6 animals were also originally obtained from Jackson Laboratory, rederived into GF conditions, and bred at the Germ-free Animal Core Facility of the University of Michigan. GF mice were maintained in flexible film isolators and were monitored regularly for contamination by aerobic and anaerobic culture and Gram stains of feces/bedding to detect unculturable microbes. All mice were regularly maintained on the conventional rodent chow 5LOD (LabDiet), a multi-component, complex carbohydrate, commercial diet formulated for life cycle nutrition. Both males and females (6–8-week old) were equally used for all experimental procedures described below. No sex-associated phenotypical differences were observed in the reported experiments. All animal studies were approved by the University of Michigan Committee on the Care and Use of Animals.
Bacterial strains
The antibiotic-sensitive (Abs)- and kanamycin-resistant (KanR)-C. rodentium, strains DBS100 and DBS120 respectively, were originally provided by Dr. David Schauer (Schauer and Falkow, 1993). The spontaneous C. rodentium Nalidixic acid-resistant (NalR) mutant was isolated by plating the DBS100 strain on Luria-Bertani (LB) agar containing Nal (35 μg/ml). The C. rodentium single mutants were constructed using the λ-Red recombinase system (Datsenko and Wanner, 2000), as described below. The E. coli S17–1 strain was kindly provided by Dr. Harry Mobley (Bachman et al., 2015). All bacteria were routinely grown at 37°C in LB broth or agar supplemented with Kan (50 μg/ml), Chl (34 μg/ml) or Nal (35 μg/ml) as required. Alternatively, MOPS minimal medium (Teknova) with or without 100 μg/ml of specific AA or 2%-casa AA was used. Optical density at 600 nm (O.D.600) was used to monitor bacterial growth in liquid cultures over time.
METHOD DETAILS
Enteric pathogen infections
For single C. rodentium inoculations, bacteria were grown in LB broth at 37°C with shaking until cultures reached an O.D.600 of ~1.0. Bacterial cultures were centrifuged, washed with PBS 1X and used to prepare bacterial suspensions containing ~5×10⁹, 5×10⁷, 5×10⁶ or 5×10⁵ cfu/ml in PBS 1X, and 0.2 ml were administered per animal by oral gavage. Fecal pellets were recovered at different time points after infection and used for measurements of pathogen loads through serial dilution plating, bacterial harvesting and/or DNA isolation, as described below. For C. rodentium co-infection assays, 0.2 ml (~1×10⁹ cfu) of a 1:1 mixture of C. rodentium DBS120 and a given mutant were orally inoculated per mouse and fecal loads were determined for each strain through serial dilution plating on LB agar containing Kan and Kan + Chl. For depletion of the microbiota, groups of SPF mice were treated with an antibiotic cocktail containing Vancomycin (0.5 g/L), Metronidazole (1 g/L), Neomycin (1 g/L) and sucrose (20 g/L) in drinking water starting 7 days before (and maintained after) pathogen infection. In some experiments, mice were sacrificed at specific times after inoculation to harvest cecum and colon for Haemotoxylin and Eosin (H&E) staining, RNA isolation or metabolite measurements (see below).
Transposon mutant library generation and inoculation
The transposon mutant library was generated by conjugative transfer of the pSAM_Cam plasmid, a suicide vector carrying a mariner-based transposon flanking the KanR cassette (Bachman et al., 2015), from the donor strain E. coli S17–1 (KanR, NalS) to the recipient C. rodentium DBS100 (NalR-KanS). Both strains were grown in LB broth at 37°C to mid-log phase (O.D.600 ~0.6). Then, the recipient bacterium was incubated at 42°C for 20 min prior to mixing with the donor in a 1:1 ratio (normalized to O.D.600 of each culture). Bacterial mixtures were centrifuged (4,500 rpm 10 min), washed with PBS 1X and spread onto 0.22 μm filter disks (Millipore) placed on LB agar plates with 250 μM IPTG (Invitrogen). After incubation at 37°C for 4–5 h, bacteria were rinsed off the filters using PBS 1X and plated onto LB agar plus Nal and Kan for mutant selection. Plates were incubated at 37°C overnight and the number of colonies were determined. Mutants were flooded with PBS 1X and collected using a cell spreader. Multiple conjugation experiments were conducted and plate harvests were pooled together in stocks containing ~10,000 mutant colonies each. Stocks were stored in 30% glycerol at −80°C until use. For the inoculum (input) preparation, aliquots of frozen stocks were thawed at 4°C, combined in LB broth and briefly grown at 37°C with shaking until culture reached an O.D.600 ~1.0. GF and SPF mice were orally treated with 100 μl of sodium bicarbonate (10% w/v) to neutralize gastric pH, and then inoculated with ~109 cfu of the input per mouse. One SPF animal died 1 day after inoculation, and thus was not included in further analyses.
Mutant library sequencing and bioinformatic analyses
DNA was purified from the pathogen library grown in vitro (input) and bacteria recovered on day 2 after infection (output) using the Wizard® Genomic DNA purification Kit (Promega). Preparation of libraries for Illumina sequencing was performed following a published protocol (Goodman et al., 2011). Briefly, genomic regions adjacent to the transposons were amplified by linear PCR using Platinum Pfx DNA polymerase (Invitrogen) and a biotinylated primer (Table S2). Products were bound to streptavidin Dynabeads (Invitrogen) and digested with MmeI (New England Biolabs). Restriction products were then individually ligated to primers containing Illumina adapters and unique barcodes (Table S2) using T4 DNA ligase (New England Biolabs). A second round of limited PCR amplification was performed, and the final products were purified using a QIAquick gel extraction kit (Qiagen). The libraries were quantified by the University of Michigan (UM)-Advanced Genomics Core using an Agilent D1000 ScreenTape System (Agilent) and by qPCR for the Illumina adapters. Samples were multiplexed and sequenced with a 10% spike-in of PhiX DNA in an Illumina HiSeq platform using 50 cycle single-end read at the same UM-Facility. Sequence images were converted into raw reads using HiSeq Control Software (Illumina). Tn-containing sequences were filtered using the Tn sequence TAACAGGTTGGATGATAAGTCCCCGGTCTTCG with BBMap (https://sourceforge.net/projects/bbmap/) after quality check by fastx_quality_stats of FASTX-Toolkit (http://hannonlab.cshl.edu/fastx_toolkit/). Tn sequences were then removed by fastx_trimmer, and experimental samples were split using fastx_barcode_splitter.pl according to barcodes shown in Table S2. After barcode removal by fastx_trimmer -f 5’, sequences were mapped to the genome of C. rodentium ICC168 ASM2708v1 using Bowtie2 (Langmead and Salzberg, 2012) and annotated/counted by HTSeq (Anders et al., 2015). Both C. rodentium ICC168 ASM2708v1 sequence and GTF files are available at the ENSEMBL database (https://bacteria.ensembl.org/info/website/ftp/index.html). The frequency of individual transposon insertions at each gene was normalized by gene size, total number of reads per sample, and the 3000 gene moving average rate using Microsoft Excel. Transposon distribution and frequency across the genome were determined using normalized mapped sequence reads (Table S1). Fitness factors were defined as the relative Tn abundance per gene in the output divided by that of the input (i.e. SPF/Input and GF/Input). A SPF/GF abundance ratio for each gene was calculated by dividing its fitness factor in SPF mice by that in GF animals: (SPF/Input)/(GF/Input). Protein-protein interaction network was obtained with STRING software using the default parameters (Szklarczyk et al., 2018). Total frequencies of pathways were calculated based on the subsystem categories of RAST (Aziz et al., 2008) using signal-to-noise rates between two groups by Morpheus (https://software.broadinstitute.org/morpheus/).
Construction of C. rodentium mutant strains
The isogenic deletion mutants were generated by allelic replacement of the target genes with an antibiotic resistance cassette as previously described (Datsenko and Wanner, 2000). Briefly, deletion cassettes were amplified by PCR with specific primer pairs (Table S2) using the plasmid pKD3 as a template containing the chloramphenicol resistance cassette. The resuling PCR products were purified using a QIAquick PCR purification kit (Qiagen) according to manufacturer’s instructions. Cultures of C. rodentium DBS120 strain containing the pKD46 (λ-Red recombinase) plasmid were induced with 1M L-Arabinose and then individually transformed with the purified PCR products using a MicroPulser Electroporator (BioRad). Mutants were selected onto LB agar plates containing Kan and Chl.
Gene expression analyses in vivo
To measure the expression of pathogen AA biosynthesis genes during infection, cecal and colonic contents were collected from infected SPF and GF mice and immediately used for RNA isolation using the RNeasy PowerMicrobiome Kit (Qiagen), following the manufacturer’s instructions. 2 μg of total RNA was converted into single-stranded cDNA using the High-Capacity cDNA Reverse Transcription Kit (ThermoFisher). Quantitative real time PCR (qRT-PCR) was performed using SYBR green PCR master mix (Alkali Scientific Inc) and a StepOne Real-time PCR system (Applied Biosystems). PCR conditions consisted of one cycle at 95°C for 15 min; 40 cycles at 94°C for 20 s, 56°C for 20 s, and 72°C for 50 s; and a final cycle at 94°C for 15 s. Relative mRNA expression was calculated by the ΔCt method and normalized to the expression of the Kanamycin cassette. qRT-PCR assays were optimized for primers targeting C. rodentium specific gene regions that did not amplify symbiont genes (Table S2).
Measurement of AA concentrations in the gut
Small intestine, cecal and colonic contents from mice were collected, immediately frozen using dry ice and stored at −80°C until use. 10 mg of freeze-dried small intestine, cecal or colonic luminal samples were mixed with 500 μl methanol containing internal standards: 20 μM each of methionine sulfone and D-camphor-10-sulfonic acid. Samples were homogenized in a Shake Master NEO machine (Bio Medical Science Inc.) using 0.1 mm zirconia and silica beads (BioSpec). 200 μl of Milli-Q water and 500 μl of chloroform were added to the mixtures and samples were shaken again. Samples were centrifuged (4,600×g/15min, 4°C), supernatants were concentrated at 40°C using a 5 kDa cutoff centrifugal filter and pellets reconstituted with 40 μl of Milli-Q water. Metabolites were analyzed using capillary electrophoresis-time-of-flight mass spectrometry (CE-TOFMS) in both positive and negative modes using a CE capillary electrophoresis system (Agilent Technologies). Peak annotation and quantification were performed using an in-house software (MasterHands) (Sugimoto et al., 2010; Yamamoto et al., 2018). AA amounts were visualized as heat-maps using MeV (http://mev.tm4.org/).
Special diet treatments
All diets used in this study are shown in Table S3. The fiber-free, simple sugar-based, protein diets were jointly designed between our group and a nutritionist at Envigo to ensure they meet both experimental and animal welfare requirements. For long-term diet experiments, mice were either weaned on special diet or treated starting 1 week before C. rodentium inoculation, and protein diets were maintained during the entire pathogen infection cycle. For short-term dietary interventions, mice were weaned on regular chow (5LOD, LabDiet) or 14% protein chow and then exposed to the testing diet (50% or 14% protein) 1 day before and after pathogen infection. Animals were then switched back to the baseline diet on day 1 after infection. For all diet experiments, mice were co-housed for three weeks to normalize their microbiota prior to feeding with special diets.
Histological scoring
The pathology score was evaluated in a blinded manner using a previously described scoring system (Chen et al., 2008). Briefly, a three- to four-point scale was used to denote severity of inflammation (0= none, 1= mild, 2= moderate, 3= severe), level of involvement (0= none, 1= mucosa, 2= mucosa and submucosa, 3= transmural), and extent of epithelial/crypt damage (0= none, 1= basal 1/3, 2= basal 2/3, 3= crypt loss, 4= crypt and surface epithelial destruction). Each variable was then multiplied by a factor reflecting the percentage of the cecum/colon involved (0–25%, 26–50%, 51–75%, 76–100%), and then summed to obtain the overall score.
16S rRNA gene sequencing analyses
Fecal samples were freshly collected, and DNA was extracted using the E.Z.N.A. stool DNA kit (Omega Bio-tek). Amplicons of the V4 region within the 16S rRNA gene were generated by the University of Michigan Microbiome Project Facility using universal primers and sequenced in an Illumina MiSeq apparatus as previously described (Kozich et al., 2013). The obtained pair end sequence reads were curated and binned into operational taxonomic units (OTUs) at > 97% identity level using Mothur v.1.40.5 (Kozich et al., 2013; Schloss et al., 2009). Taxonomic assignments were determined using the SILVA 16S rRNA reference file release 132 (Quast et al. 2013) and the Ribosomal Database Project (RDP) training set version 16 (Wang et al., 2007). Shannon α- and/or ThetaYC β-diversity indexes were determined using Mothur as previously described (Caruso et al., 2019). All scripts are equivalent to the ones used in our previous study and available in its supplemental material (Caruso et al., 2019)
QUANTIFICATION AND STATISTICAL ANALYSIS
Statistical analyses were performed using GraphPad Prism software version 6.07 (GraphPad Software Inc.). Differences between two groups were evaluated using Student’s t test or Mann-Whitney U test for normally or non-normally distributed datasets, respectively. For multiple comparisons, statistical analyses were performed using Kruskal-Wallis test for non-parametric samples with Dunn’s post hoc test. Statistical difference in transposon frequencies at individual genes between two groups was determined using the Metastats function of Mothur (Schloss et al., 2009). Differences in ThetaYC indexes was evaluated by permutational multivariate analysis of variance (PERMANOVA) using PAST (Hammer et al., 2001). Differences at P<0.05 were considered significant. Information regarding exact number of animals/samples (n=X) per group, experimental replication, dispersion/precision measures and statistical tests are described in the figure legends.
Supplementary Material
Table S1. Tn-Seq Raw data (related to Figure 1)
KEY RESOURCES TABLE
| REAGENT or RESOURCE | SOURCE | IDENTIFIER |
|---|---|---|
| Bacterial and Virus Strains | ||
| Citrobacter rodentium DBS100 | Schauer and Falkow, 1993 | N/A |
| Citrobacter rodentium DBS100 (Nalr) | This paper | N/A |
| Citrobacter rodentium DBS120 (Kanr) | Schauer and Falkow, 1993 | N/A |
| Citrobacter rodentium DBS120 ΔargC::ChlR | This paper | N/A |
| Citrobacter rodentium DBS120 ΔhisI::ChlR | This paper | N/A |
| Citrobacter rodentium DBS120 ΔilvA::ChlR | This paper | N/A |
| Citrobacter rodentium DBS120 ΔthrC::ChlR | This paper | N/A |
| Citrobacter rodentium DBS120 ΔtrpA::ChlR | This paper | N/A |
| Escherichia coli S17–1 | Bachman et al., 2015 | N/A |
| Chemicals, Peptides, and Recombinant Proteins | ||
| Ampicillin | Sigma-Aldrich | Cat# A9518 |
| Casamino acids | Fisher Scientific | Cat# BP1424–100 |
| Chloramphenicol | Sigma-Aldrich | Cat# C0857 |
| Dynabeads M-280 streptavidin | Invitrogen | Cat# 112–05D |
| Isopropylthio-β-galactoside (IPTG) | Invitrogen | Cat# 15529019 |
| Kanamycin | Roche | Cat# 10106801001 |
| L-Arabinose | Sigma-Aldrich | Cat# A3256 |
| L-Arginine | Sigma-Aldrich | Cat# A5006 |
| L-Histidine | Sigma-Aldrich | Cat# H8000 |
| L-Isoleucine | Sigma-Aldrich | Cat# W527602 |
| L-Threonine | Sigma-Aldrich | Cat# T8625 |
| L-Tryptophan | Sigma-Aldrich | Cat# T0254 |
| Metronidazole | Fagron | Cat# 804380 |
| MmeI enzyme | New England Biolabs | Cat# M0202T |
| Nalidixic acid | Sigma-Aldrich | Cat# N8878 |
| Neomycin | AG Scientific | Cat# N-1053 |
| Platitum Pfx DNA polymerase | Invitrogen | Cat# 11708 |
| T4 DNA ligase | New England Biolabs | Cat# M0202T |
| Vancomycin | Sagent Pharmaceuticals | NCD 25021-158-99 |
| Critical Commercial Assays | ||
| E.Z.N.A. stool DNA kit | Omega Bio-tek | Cat# D4015–01 |
| High-Capacity cDNA Reverse Transcription kit | ThermoFisher | Cat# 4387406 |
| MOPS minimal media kit | Teknova | Cat# M2106 |
| QIAquick gel extraction kit | Qiagen | Cat# 28706 |
| QIAquick PCR purification kit | Qiagen | Cat# 28106 |
| Radiant SYBR Green Lo-ROX qPCR kit | Alkali Scientific | Cat# QS1005 |
| RNeasy PowerMicrobiome kit | Qiagen | Cat# 26000 |
| Wizard Genomic DNA purification kit | Promega | Cat# A1120 |
| Deposited Data | ||
| Tn-seq data | This paper | www.ncbi.nlm.nih.gov; (PRJNA635914) |
| 16S rRNA sequencing data | This paper | www.ncbi.nlm.nih.gov; (PRJNA635912) |
| Experimental Models: Organisms/Strains | ||
| Mouse: C57BL/6J: WT | The Jackson Laboratory | Cat#: 000664; RRID: IMSR_JAX: 000664 |
| Oligonucleotides | ||
| See Table S2 | ||
| Recombinant DNA | ||
| pKD3 (Chloramphenicol cassette template) | Datsenko and Wanner, 2000 | N/A |
| pKD46 (λ-Red recombinase plasmid) | Datsenko and Wanner, 2000 | N/A |
| pSAM_Cam (Mariner transposon plasmid) | Bachman et al., 2015 | N/A |
| Software and Algorithms | ||
| Bowtie2 | Langmead and Salzberg, 2012 | bowtie-bio.sourceforge.net/bowtie2/index.shtml |
| FASTX-Toolkit | The Hannon Lab | hannonlab.cshl.edu/fastx_toolkit/ |
| GraphPad Prism | GraphPad | graphpad.com/scientific-software/prism/ |
| HiSeq Control Software (HSC) | Illumina | support.illumina.com/sequencing/sequencing_instruments/hiseq_2500/downloads.html |
| HTSeq | Anders et al., 2015 | github.com/simon-anders/htseq |
| MasterHands | Sugimoto et al., 2010; Yamamoto et al., 2018 | omictools.com/masterhands-tool |
| MeV | N/A | mev.tm4.org/ |
| Morpheus | N/A | software.broadinstitute.org/morpheus/ |
| Mothur | Kozich et al., 2013; Schloss et al., 2009 | mothur.org |
| PAST | Hammer et al., 2001 | folk.uio.no/ohammer/past/ |
| RAST | Aziz et al., 2008 | rast.nmpdr.org/ |
| Ribosomal Database Project (RDP) | Wang et al., 2007 | rdp.cme.msu.edu/ |
| SILVA database | Quast et al., 2013 | arb-silva.de/ |
| StepOne | ThermoFisher | thermofisher.com/us/en/home/technical-resources/software-downloads/StepOne-and-StepOnePlus-Real-Time-PCR-System.html |
| STRING | Szklarczyk et al., 2018 | string-db.org/ |
| Other | ||
| Standard chow diet | LabDiet | Cat#: 5L0D |
| 14% protein diet | Envigo | TD.00168 |
| 14% protein, 32% carbohydrate diet | Envigo | TD.190300 |
| 50% protein diet | Envigo | TD.94266 |
HIGHLIGHTS:
Tn-Seq screen revealed genes required for pathogen expansion in the mouse gut
The microbiota depletes the gut of amino acids, limiting their availability
C. rodentium induces amino acid biosynthesis for its expansion in the gut
Administration of a high protein diet promotes pathogen colonization in mice
Acknowledgements
The authors thank the University of Michigan Germ-Free Animal Core and Host Microbiome Initiative for support; Jose Luis Puente, Nobuhiko Kamada, Mark Anderson and Violeta Matus-Acuña for discussion and advice; Grace Chen for manuscript review; Kelsey Martin and Peter Kuffa for animal husbandry and lab management, respectively; and members of the Núñez laboratory for support. This work was supported by NIH grants DK095782 and DK091191 (G.N.), JSPS KAKENHI (18H04805 to S.F.), JST PRESTO (JPMJPR1537 to S.F.), AMED-CREST (JP19gm1010009 to S.F.), JST ERATO (JPMJER1902 to S.F.), the Takeda Science Foundation (to S.F.), the Food Science Institute Foundation (to S.F.), and the Program for the Advancement of Research in Core Projects under Keio University’s Longevity Initiative (to S.F.). J. M. P. was supported by grant F32DK118800 from the NIH.
Footnotes
Publisher's Disclaimer: This is a PDF file of an unedited manuscript that has been accepted for publication. As a service to our customers we are providing this early version of the manuscript. The manuscript will undergo copyediting, typesetting, and review of the resulting proof before it is published in its final form. Please note that during the production process errors may be discovered which could affect the content, and all legal disclaimers that apply to the journal pertain.
Declaration of Interests
The authors declare no competing financial or other interests.
References
- Anders S, Pyl PT, and Huber W (2015). HTSeq-A Python framework to work with high-throughput sequencing data. Bioinformatics 31, 166–169. [DOI] [PMC free article] [PubMed] [Google Scholar]
- Aziz RK, Bartels D, Best AA, Dejongh M, Disz T, Edwards RA, Formsma K, Gerdes S, Glass EM, Kubal M, et al. (2008). The RAST Server: Rapid Annotations using Subsystems Technology. BMC Genomics 9, 75. [DOI] [PMC free article] [PubMed] [Google Scholar]
- Bachman MA, Breen P, Deornellas V, Mu Q, Zhao L, Wu W, Cavalcoli JD, and Mobley HLT (2015). Genome-wide identification of Klebsiella pneumoniae fitness genes during lung infection. MBio 6, e00775. [DOI] [PMC free article] [PubMed] [Google Scholar]
- Battaglioli EJ, Hale VL, Chen J, Jeraldo P, Ruiz-Mojica C, Schmidt BA, Rekdal VM, Till LM, Huq L, Smits SA, et al. (2018). Clostridioides difficile uses amino acids associated with gut microbial dysbiosis in a subset of patients with diarrhea. Sci. Transl. Med 10, eaam7019. [DOI] [PMC free article] [PubMed] [Google Scholar]
- Baümler AJ, and Sperandio V (2016). Interactions between the microbiota and pathogenic bacteria in the gut. Nature 535, 85–93. [DOI] [PMC free article] [PubMed] [Google Scholar]
- Brooks FP (1985). Effect of diet on gastric secretion. Am. J. Clin. Nutr 42, 1006–1019. [DOI] [PubMed] [Google Scholar]
- Caruso R, Ono M, Bunker ME, Núñez G, and Inohara N (2019). Dynamic and asymmetric changes of the microbial communities after cohousing in laboratory mice. Cell Rep. 27, 3401–3412. [DOI] [PMC free article] [PubMed] [Google Scholar]
- Chen GY, Shaw MH, Redondo G, and Núñez G (2008). Innate immune receptor nod1 protects the intestine from inflammation-induced tumorigenesis. Cancer Res. 68, 10060–10067. [DOI] [PMC free article] [PubMed] [Google Scholar]
- Collins JW, Keeney KM, Crepin VF, Rathinam VAK, Fitzgerald KA, Finlay BB, and Frankel G (2014). Citrobacter rodentium: Infection, inflammation and the microbiota. Nat. Rev. Microbiol 12, 612–623. [DOI] [PubMed] [Google Scholar]
- Croxen MA, Law RJ, Scholz R, Keeney KM, Wlodarska M, and Finlay BB (2013). Recent advances in understanding enteric pathogenic Escherichia coli. Clin. Microbiol. Rev 26, 822–880. [DOI] [PMC free article] [PubMed] [Google Scholar]
- Datsenko KA, and Wanner BL (2000). One-step inactivation of chromosomal genes in Escherichia coli K-12 using PCR products. Proc. Natl. Acad. Sci. U S A 97, 6640–6645. [DOI] [PMC free article] [PubMed] [Google Scholar]
- Fu Y, Waldor MK, and Mekalanos JJ (2013). Tn-Seq analysis of Vibrio cholerae intestinal colonization reveals a role for T6SS-mediated antibacterial activity in the host. Cell Host Microbe 14, 652–663. [DOI] [PMC free article] [PubMed] [Google Scholar]
- Gao B, Vorwerk H, Huber C, Lara-Tejero M, Mohr J, Goodman AL, Eisenreich W, Galán JE, and Hofreuter D (2017). Metabolic and fitness determinants for in vitro growth and intestinal colonization of the bacterial pathogen Campylobacter jejuni. PLoS Biol. 15, e2001390. [DOI] [PMC free article] [PubMed] [Google Scholar]
- Goodman AL, McNulty NP, Zhao Y, Leip D, Mitra RD, Lozupone CA, Knight R, and Gordon JI (2009). Identifying genetic determinants needed to establish a human gut symbiont in its habitat. Cell Host Microbe 6, 279–289. [DOI] [PMC free article] [PubMed] [Google Scholar]
- Goodman AL, Wu M, and Gordon JI (2011). Identifying microbial fitness determinants by insertion sequencing using genome-wide transposon mutant libraries. Nat Protoc. 6, 1969–1980. [DOI] [PMC free article] [PubMed] [Google Scholar]
- Hammer DAT, Ryan PD, Hammer Ø, and Harper DAT (2001). Past: Paleontological Statistics Software Package for Education and Data Analysis. Palaeontol. Electron 4, 1–9. [Google Scholar]
- Hartland EL, Leong JM, and Kwaik YA (2013). Enteropathogenic and enterohemorrhagic E. coli: ecology, pathogenesis, and evolution. Front. Cell. Infect. Microbiol 3, 15. [DOI] [PMC free article] [PubMed] [Google Scholar]
- Kamada N, Kim YG, Sham HP, Vallance BA, Puente JL, Martens EC, and Núñez G (2012). Regulated virulence controls the ability of a pathogen to compete with the gut microbiota. Science 336, 1325–1329. [DOI] [PMC free article] [PubMed] [Google Scholar]
- Kaper JB, Nataro JP, and Mobley HLT (2004). Pathogenic Escherichia coli. Nat. Rev. Microbiol 2, 123–140. [DOI] [PubMed] [Google Scholar]
- Kozich JJ, Westcott SL, Baxter NT, Highlander SK, and Schloss PD (2013). Development of a dual-index sequencing strategy and curation pipeline for analyzing amplicon sequence data on the miseq illumina sequencing platform. Appl. Environ. Microbiol 79, 5112–5120. [DOI] [PMC free article] [PubMed] [Google Scholar]
- Langmead B, and Salzberg SL (2012). Fast gapped-read alignment with Bowtie 2. Nat. Methods 9, 357–359. [DOI] [PMC free article] [PubMed] [Google Scholar]
- Lennard-Jones JE, Fletcher J, and Shaw DG (1968). Effect of different foods on the acidity of the gastric contents in patients with duodental ulcer. Effect of altering the proportions of protein and carbohydrate. Gut 9, 177–182. [DOI] [PMC free article] [PubMed] [Google Scholar]
- Lopez CA, Miller BM, Rivera-Chávez F, Velazquez EM, Byndloss MX, Chávez-Arroyo A, Lokken KL, Tsolis RM, Winter SE, and Bäumler AJ (2016). Virulence factors enhance Citrobacter rodentium expansion through aerobic respiration. Science 353, 1249–1253. [DOI] [PMC free article] [PubMed] [Google Scholar]
- Mullineaux-Sanders C, Sanchez-Garrido J, Hopkins EGD, Shenoy AR, Barry R, and Frankel G (2019). Citrobacter rodentium-host-microbiota interactions: immunity, bioenergetics and metabolism. Nat. Rev. Microbiol 17, 701–715. [DOI] [PubMed] [Google Scholar]
- Mundy R, MacDonald TT, Dougan G, Frankel G, and Wiles S (2005). Citrobacter rodentium of mice and man. Cell. Microbiol 7, 1697–1706. [DOI] [PubMed] [Google Scholar]
- van Opijnen T, Bodi KL, and Camilli A (2009). Tn-seq: High-throughput parallel sequencing for fitness and genetic interaction studies in microorganisms. Nat. Methods 6, 767–772. [DOI] [PMC free article] [PubMed] [Google Scholar]
- Pickard JM, Zeng MY, Caruso R, and Núñez G (2017). Gut microbiota: Role in pathogen colonization, immune responses, and inflammatory disease. Immunol. Rev 279, 70–89. [DOI] [PMC free article] [PubMed] [Google Scholar]
- Quast C, Pruesse E, Yilmaz P, Gerken J, Schweer T, Yarza P, Rg Peplies J, and Glö Ckner FO (2013). The SILVA ribosomal RNA gene database project: improved data processing and web-based tools. Nucleic Acids Res. 41, D590–6. [DOI] [PMC free article] [PubMed] [Google Scholar]
- Schauer DB, and Falkow S (1993). The eae gene of Citrobacter freundii biotype 4280 is necessary for colonization in transmissible murine colonic hyperplasia. Infect. Immun 61, 4654–4661. [DOI] [PMC free article] [PubMed] [Google Scholar]
- Schloss PD, Westcott SL, Ryabin T, Hall JR, Hartmann M, Hollister EB, Lesniewski RA, Oakley BB, Parks DH, Robinson CJ, et al. (2009). Introducing mothur: Open-source, platform-independent, community-supported software for describing and comparing microbial communities. Appl. Environ. Microbiol 75, 7537–7541. [DOI] [PMC free article] [PubMed] [Google Scholar]
- Sekirov I, Russell SL, Caetano L, Antunes M, and Finlay BB (2010). Gut microbiota in health and Disease. Physiol Rev. 90, 859–904. [DOI] [PubMed] [Google Scholar]
- Sugimoto M, Wong DT, Hirayama A, Soga T, and Tomita M (2010). Capillary electrophoresis mass spectrometry-based saliva metabolomics identified oral, breast and pancreatic cancer-specific profiles. Metabolomics 6, 78–95. [DOI] [PMC free article] [PubMed] [Google Scholar]
- Szklarczyk D, Gable AL, Lyon D, Junge A, Wyder S, Huerta-Cepas J, Simonovic M, Doncheva NT, Morris JH, Jensen LJ, et al. (2018). STRING v11: protein-protein association networks with increased coverage, supporting functional discovery in genome-wide experimental datasets. Nucleic Acids Res. 47, 607–613. [DOI] [PMC free article] [PubMed] [Google Scholar]
- Tao H, Bausch C, Richmond C, Blattner FR, and Conway T (1999). Functional genomics: Expression analysis of Escherichia coli growing on minimal and rich media. J. Bacteriol 181, 6425–6440. [DOI] [PMC free article] [PubMed] [Google Scholar]
- Wang Q, Garrity GM, Tiedje JM, and Cole JR (2007). Naïve Bayesian classifier for rapid assignment of rRNA sequences into the new bacterial taxonomy. Appl. Environ. Microbiol 73, 5261–5267. [DOI] [PMC free article] [PubMed] [Google Scholar]
- Warr AR, Hubbard TP, Munera D, Blondel CJ, Abel Zur Wiesch P, Abel S, Wang X, Davis BM, and Waldor MK (2019). Transposon-insertion sequencing screens unveil requirements for EHEC growth and intestinal colonization. PLoS Pathog. 15, e1007652. [DOI] [PMC free article] [PubMed] [Google Scholar]
- Yamamoto Y, Nakanishi Y, Murakami S, Aw W, Tsukimi T, Nozu R, Ueno M, Hioki K, Nakahigashi K, Hirayama A, et al. (2018). A metabolomic-based evaluation of the role of commensal microbiota throughout the gastrointestinal tract in mice. Microorganisms 6, 101. [DOI] [PMC free article] [PubMed] [Google Scholar]
Associated Data
This section collects any data citations, data availability statements, or supplementary materials included in this article.
Supplementary Materials
Table S1. Tn-Seq Raw data (related to Figure 1)
Data Availability Statement
Raw sequence datasets obtained in this study are freely available at https://www.ncbi.nlm.nih.gov under the following BioProject accession numbers: TnSeq data (PRJNA635914); 16S rRNA data (PRJNA635912).