

Abstract

In this study, we synthesized and characterized a silicon phthalocyanine substituted with 3-hydroxypyridin-2-thione (SiPc-HDACi), designed to be a chemophotodynamic therapy agent acting as a histone deacetylase inhibitor, and we determined its photophysical, photochemical, and photobiological properties. Next, we evaluated its anticancer efficacy on MCF-7, double positive and MDA-MB-231, triple negative breast cancer cell lines, as well as on a healthy human endothelial cell line (HUVEC). Our results indicate that SiPc-HDACi can target nucleoli of cells, effectively inducing apoptosis while promoting cell cycle arrest thanks to its high singlet oxygen yield and its histone deacetylase downregulating properties, suggesting a powerful anticancer effect on breast cancer in vitro. Our further studies will be conducted with primary breast cancer cell culture to give a better insight into the anticancer mechanism of the compound.
Introduction
Photodynamic therapy (PDT) involves application of a photosensitizer (PS) followed by irradiation at an appropriate wavelength that generates various reactive oxygen species (ROS) to eradicate tumor.1 PDT generates ROS through two reaction types: type I reactions are based on electron transfer to cellular components to form free radicals or radical ions, whereas type II reactions result in highly reactive singlet oxygen (1O2).2,31O2 is believed to be the main toxic species that kills tumor cells either directly or by activating programmed cell death pathways.4 Both reactions occur simultaneously and the ratio between these two reaction types depends on the nature of the PS.5 Besides its direct effects on tumor cells, PDT also disrupts tumor vasculature and induces inflammatory responses to activate systemic immunity.6,7 Over the years, PDT has gained extensive attention and became a treatment option for both oncological and non-oncological medical conditions, thanks to its specificity and selectivity since PS tend to accumulate in rapidly dividing and diseased tissues while cytotoxic effect of the drug is limited to the irradiation area.8 PDT can be used to treat tumors that cannot be surgically resected and, unlike invasive and systemic treatment options, offers long-term management of the tumor even though sometimes the treatment cannot cure the disease.6 A group of second-generation PSs, phthalocyanines (Pcs), are stable synthetic macromolecules that can absorb light at a long-wavelength efficiently and generate high levels of ROS.8,9 However, unsubstituted Pcs have low solubility in water; thus, peripheral or axial substitutions of various functional groups are introduced to increase their solubility. Combining chemotherapeutics with PSs is a novel approach that overcomes problems arising from hydrophobicity while inducing a synergistic cell death effect successfully both in vivo and in vitro.10−12
Due to their direct involvement in cancer pathogenesis, histone deacetylases (HDACs) are one of the most attractive targets for cancer treatment.13 Histone proteins are regulated by various post-translational modifications including reversible acetylation at lysine residues by HDACs.14 Consisting of total 18 members, the HDAC family divides into four classes: class I Rpd-3-like proteins (HDAC1, HDAC2, HDAC3, and HDAC8); class II Hda-1-like proteins (HDAC4, HDAC5, HDAC6, HDAC7, HDAC9, and HDAC10); class III Sir2-like proteins (SIRT1-7), and class IV protein (HDAC11). Previously, high HDAC activity has been shown to be associated with disease progression and poor prognosis in both hematological and solid malignancies.15 There are a few studies evaluating anticancer efficacy of either simultaneous treatment with a PS and a chemotherapy drug16 or PS that are complexed with HDAC inhibitors (HDACis),17,18 all suggesting that PSs along with HDACis may potentiate the treatment. In 2020, Morais et al. investigated antifungal activity of aluminum-phthalocyanine chloride nanoemulsion combined with two different HDACis, sodium butyrate and trichostatin A, yet this is the only study testing a Pc derivative and HDACis simultaneously,19 while anticancer properties of HDACi and Pc combinations remain unknown.
Herein, we aimed to increase anticancer efficacy of a PDT agent, silicon phthalocyanine (SiPc) by introducing a histone deacetylase inhibitor. Hence, we designed and characterized a novel SiPc substituted with HDACi, 3-hydroxypyridin-2-thione (3-HPT) (SiPc-HDACi), that combines photodynamic activity of SiPc and anticancer properties of 3-HPT (Figure 1). We evaluated the anticancer properties of SiPc-HDACi on two different breast cancer cell lines (non-invasive MCF-7 and invasive MDA-MB-231 cells) as well as on a healthy human endothelial cell line (HUVEC).
Figure 1.

Synthetic pathway of SiPc-HDACi.
Results and Discussion
Synthesis and Characterization
SiPc-HDACi was synthesized through a base-catalyzed displacement reaction between two chloride substituents from SiPcCl2 by reaction of HDACi in dried toluene and NaH at reflux temperature. The synthetic route of the HDACi–SiPc complex is schematized in Figure 1. The structure of the SiPc-HDACi was fully characterized by FT-IR, 1H and 13C NMR spectroscopy, ESI-MS, and MALDI-TOF MS as given in the Experimental Section and Figures S1–S3 in the Supporting Information.
1H NMR spectra of SiPc-HDACi showed intense multiple signals at around δ 9.2 and 8.4 ppm belonging to the aromatic Pc ring protons. The close proximity of the ligands to the Pc ring delocalization induced field shifted resonances for the ligand protons. Thus, signals belonging to 22 aromatic hydrogen atoms of the substituent were observed between δ 6.6 and 7.7 ppm. FT-IR spectra of SiPc-HDACi also confirmed the proposed structures. The MALDI-TOF spectra of SiPc-HDACi showed molecular ion peak at m/z = 1155.3 [M + 3H]+, supporting the proposed molecular formula for these compounds. All characterization spectra of SiPc-HDACi are presented in Figures S1–S3.
Photophysical and Photochemical Properties
The UV–vis spectra of the compound were recorded in the different solvents given in the Experimental Section. SiPc-HDACi did not show any aggregation behavior in any of these solvents (Figure 2a), and no significant change in the absorption bands was observed except for the absorption intensity. The Q band absorptions in the UV–vis absorption spectrum of SiPc-HDACi in DMF was observed as a high band at 672 nm due to π–π* transitions (Figure 2a). The ground-state absorption spectra of the compounds were obtained at different concentrations to determine the molar extinction coefficients. Molar extinction coefficients of the compound were calculated according to Beer–Lambert’s law at different wavelengths (Figure S4).
Figure 2.
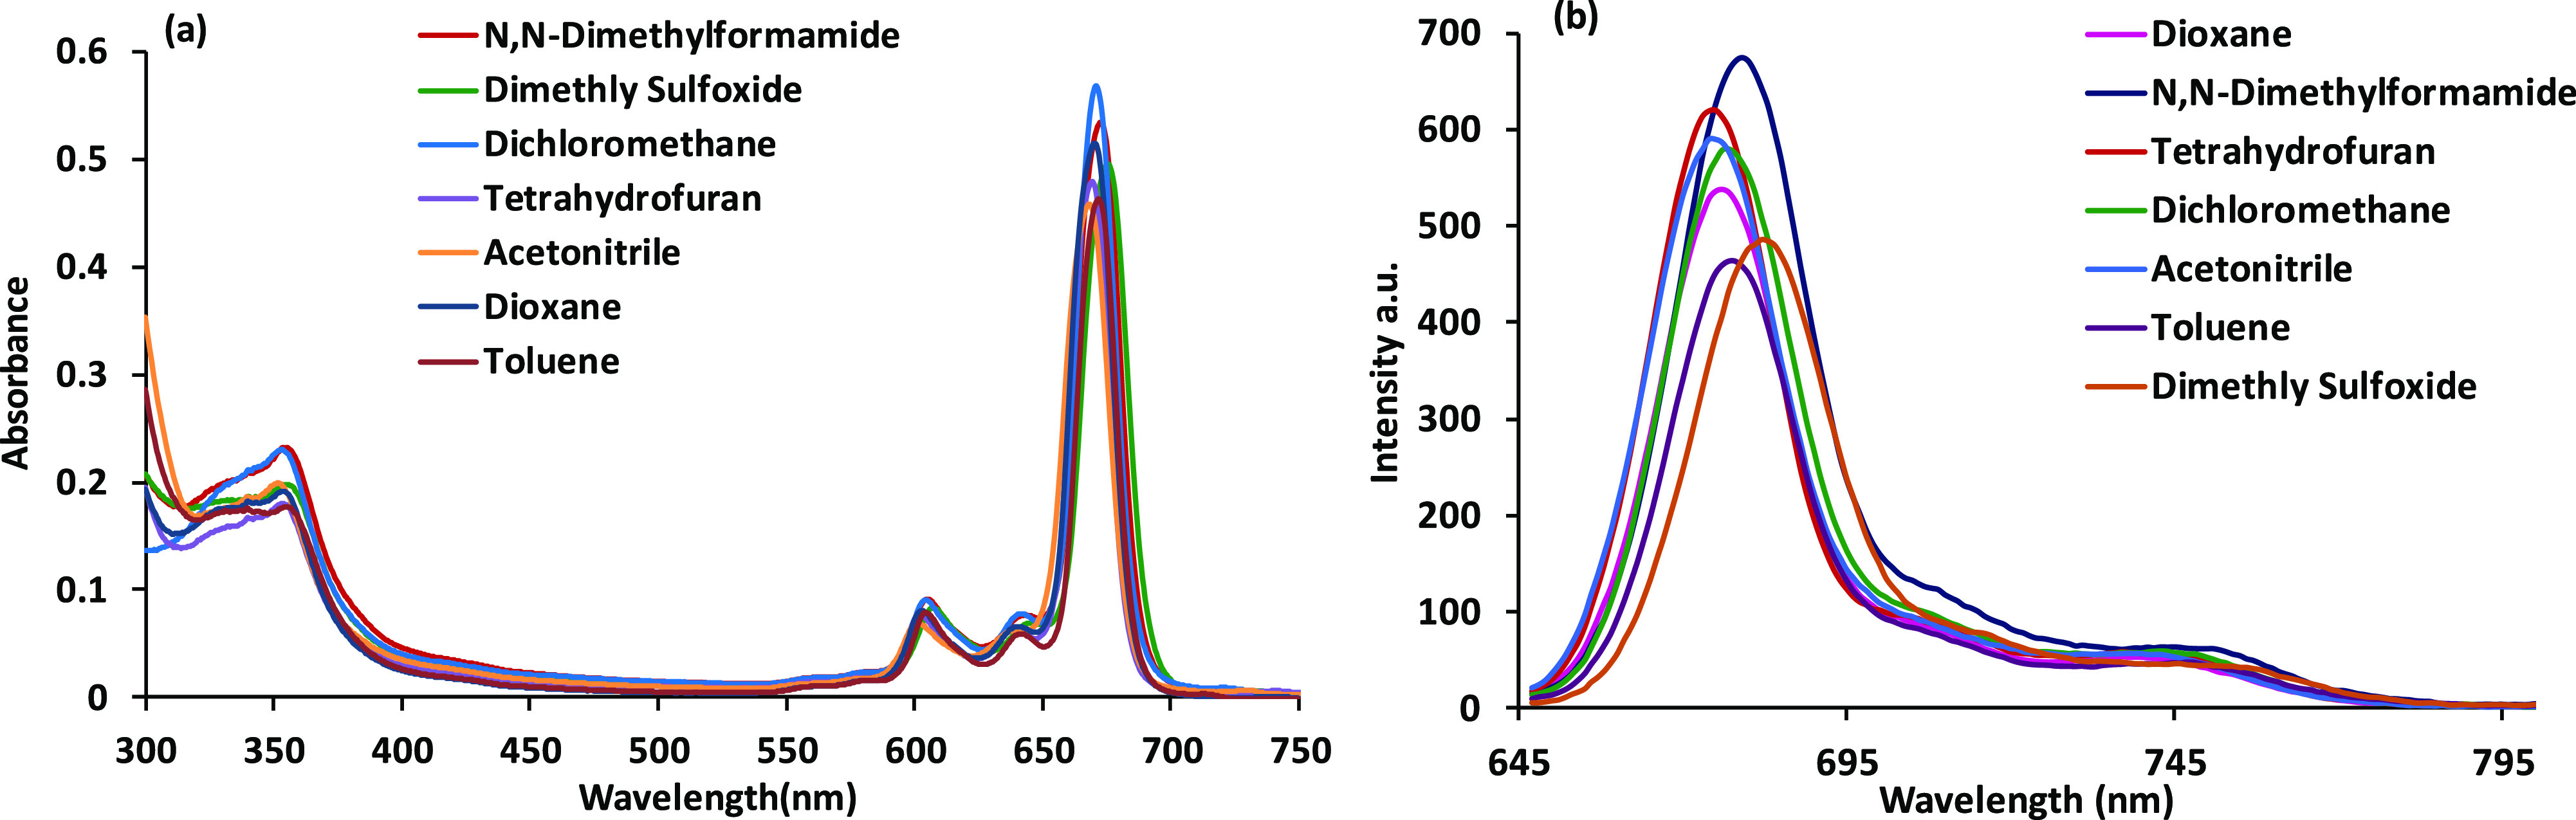
(a) Absorption spectra of in different solvents. (b) Fluorescence spectra of SiPc-HDACi in different solvents, (λexc. = 635 nm), C = 5 μM.
The fluorescence emission and absorption and excitation spectra of SiPc-HDACi in DMF are seen in Figure 3a. As presumed, the excitation and absorption bands were similar and both were mirror images of the emission bands, suggesting that SiPc-HDACi did not decay during excitation in DMF. In addition, the Stokes shift of SiPc-HDACi in DMF was determined to be 8 nm. When comparing the solvent effect in the fluorescence emission spectrum, no significant change in fluorescence wavelength was observed except for DMSO and DMF although the fluorescence emission intensity of the compound varied in various solvents (Figure 2b). A red shift of approximately 6 nm was observed in the emission spectra of SiPc-HDACi in other solvents compared to DMF and DMSO. The fluorescence quantum yield (ΦF) was determined by comparing the fluorescence of SiPc-HDACi with the fluorescence of unsubstituted ZnPc as a standard and calculated using the comparative method (eq 1) given in the Supporting Information. The ΦF value of SiPc-HDACi was calculated to be 0.05. The fluorescence lifetime (τF) of the compound was measured directly. The compound exhibited a monoexponential decay curve with a single lifetime value that was determined to be 4.91 ns (Figure 3b). 1O2 generation of SiPc-HDACi was measured directly by detecting its phosphorescence at 1270 nm. The 1O2 phosphorescence peaks at 1270 nm for SiPc-HDACi and unsubstituted ZnPc were detected in DMF solutions (Figure S5). It was clear that SiPc-HDACi produced 1O2 more powerfully than unsubstituted ZnPc. Also supported by the literature, SiPc-HDACi was found to have high 1O2 quantum yield.20−22 Using eq 2 defined in the Supporting Information, the 1O2 generation quantum yield was determined to be 0.68 for SiPc-HDACi.
Figure 3.

(a) Absorption, excitation, and emission spectra of SiPc-HDACi in DMF, λexc = 635 nm (C = 5 μM). (b) Fluorescence decay profiles of SiPc-HDACi measured using a 670 nm laser excitation source.
In Vitro Studies
Phototoxicity and Dark Toxicity
SiPc-HDACi incubation for 24 h at various concentrations under dark conditions did not alter viability significantly in all cell lines, even at high concentrations (p > 0.05) (Figure 4). In terms of phototoxicity, IC50 values for SiPc-HDACi were calculated to be 42.0, 9.2, and 37.3 μM for HUVECs, MCF-7, and MDA-MB-231 cells, respectively.
Figure 4.

Bar graphics indicating cytotoxic properties of SiPc-HDACi under dark conditions after incubating cells with the compound for 24 h, and light cytotoxicity evaluated upon light exposure by an Alamar Blue Assay. SiPc-HDACi did not influence viability on (a) HUVEC, (b) MCF-7, and (c) MDA-MB-231 cell lines while decreasing viability upon irradiation in a dose-dependent manner. Each test was done in triplicate.
On the other hand, IC50 values for Polyoxo-SiPc(23,24) (Figure S6a), which was used as a positive control that does not contain HDACi moieties, were calculated to be 45.6, 69.1, and 89.3 μM for HUVECs, MCF-7, and MDA-MB-231 cells, respectively, and bar graphics are given in Figure S6b.
Apoptosis and Necrosis Analysis by Annexin V/Propidium Iodide Staining
SiPc-HDACi treatment significantly decreased viability in all cell lines (p < 0.0001) by increasing both early (p < 0.0001) and late apoptotic cell populations (HUVEC and MCF-7, p < 0.001; MDA-MB-231, p < 0.0001), on the other hand, necrotic populations after treatment did not alter significantly (p > 0.05). Comparisons between treatment groups revealed a significantly higher viability rate in HUVECs compared to MCF-7 and MDA-MB-231 cells (p < 0.0001) and that was accompanied by higher late apoptotic population in MDA-MB-231 cells (p < 0.0001) in contrast to early apoptosis that was higher in MCF-7 cells compared to both HUVECs and MDA-MB-231 cells (p < 0.0001) (Figure 5).
Figure 5.

SiPc-HDACi promotes apoptosis without altering necrosis significantly when cells were treated with respective IC50 values determined according to the Alamar Blue Assay. (a) Representative flow cytometry quadrants. (b) SiPc-HDACi treatment significantly decreased viability in all cell lines, with a greater effect on cancer cells compared to the healthy cell line. (c) Treatment significantly increased early apoptosis in all cell lines. (d) Bar graphs indicating necrosis. SiPc-HDACi was found ineffective in initiating the necrosis pathway. (e) SiPc-HDACi significantly increased the apoptotic population in all cell lines after treatment at respective IC50 doses. Significance was considered as p < 0.05. * denotes significance between cell lines upon treatment, whereas # denotes significance between treatment and control groups.
DNA Content Analysis
SiPc-HDACi treatment increased the SubG1 (p < 0.0001), S (p < 0.001), and G2/M phases (p < 0.0001) while significantly decreasing the G1 phase (p < 0.0001) in HUVECs, suggesting G2/M arrest. In MCF-7 and MDA-MB-231 cells, cell cycle arrest at the G2/M phase was accompanied by a significant increase in SubG1 (p < 0.0001) and a significant decrease in the G1 and S phases (p < 0.0001 and p < 0.01 for MCF-7 and MDA-MB-231) (Figure 6).
Figure 6.

SiPc-HDACi treatment leads to accumulation at the G2/M phase. (a) Representative flow cytometry histograms. (b) Treatment decreased the G0/G1 phase in HUVECs while increasing the S, G2/M, and SubG1 phases. (c) SiPc-HDACi increased the G2/M and SubG1 phases while decreasing both the G0/G1 and S phases. (d) Similar to MCF-7 cells, an increase in the G2/M and SubG1 phases that was accompanied by a decrease in the G0/G1 and S phases was observed in MDA-MB-231 cells. A p value lower than 0.05 was considered as statistically significant.
Evaluation of HDAC6 and HDAC8 Protein Levels
SiPc-HDACi treatment decreased both HDAC6 (p < 0.0001 for HUVECs and MDA-MB-231 cells while p < 0.01 for MCF-7 cells) and HDAC8 (p < 0.001 for HUVECs and MDA-MB-231 cells while p < 0.05 for MCF-7 cells) protein levels in all cell lines (Figure 7). These results are in line with the literature as Patil et al. reported 3-HPT to be approximately 10-fold selective toward HDAC6 compared to HDAC8.25 Comparisons between cell lines upon treatment revealed no difference in terms of HDAC8 levels between cell lines.
Figure 7.

SiPc-HDACi treatment significantly decreased both HDAC6 and HDAC8 levels in all cell lines. (a) Treatment decreased HDAC6 protein levels in all cell lines; comparisons between treatment groups revealed that MCF-7 cells have significantly higher HDAC6 levels compared to other two cell lines upon treatment. (b) HDAC8 levels were decreased in all cell lines. The decrease in HDAC8 levels on HUVECs and MDA-MB-231 cells was higher compared to MCF-7 cells. No significant difference between cells upon treatment in terms of HDAC8 levels was observed. (c) Representative immunoblot images. The significance level was considered as p < 0.05. * denotes significance between cell lines upon treatment, whereas # denotes significance between treatment and control groups.
Evaluation of ROS Accumulation
SiPc-HDACi treatment induced ROS generation in all cell lines (HUVEC, p < 0.01; MCF-7 and MDA-MB-231, p < 0.0001) compared to control groups. Comparisons investigating treatment efficiency between cell lines revealed ROS levels in HUVECs were significantly lower than those in MCF-7 and MDA-MB-231 (Figure 8).
Figure 8.

SiPc-HDACi treatment increased dihydrorhodamine123 intensity in all cell lines significantly. (a) Quantification of the DHR123 mean fluorescence intensity for control and treated cells. (b) Representative histograms for the DHR123 measurements in treated and untreated cells. A p value lower than 0.05 was considered as significant. * denotes significance between cell lines upon treatment, whereas # denotes significance between treatment and control groups.
Evaluation of CD44, CXCR4, and CCR7 Protein Levels
HDACi decreased CD44 and CCR7 protein levels in all cell lines significantly (p < 0.0001) (Figure 9a). On the other hand, CXCR4 levels were increased in all cell lines significantly upon treatment (HUVECs and MDA-MB-231, p < 0.01; MCF-7, p < 0.001) (Figure 9a). When comparing alterations of protein levels between treatment and control groups, SiPc-HDACi decreased CD44+ cell populations by ∼39, ∼20, and ∼68% and CCR7+ cell population by ∼35, ∼21, and ∼82% in HUVEC, MCF-7, and MDA-MB-231, respectively, compared to their control counterparts (Figure 9b). Percent changes in both CD44 and CCR7 protein levels were significantly higher in MDA-MB-231 cells than MCF-7 and HUVEC (p < 0.0001), while it was higher in the HUVEC than MCF-7 cells (p < 0.0001). On the contrary, CXCR4 expression was increased by ∼128, ∼271, and ∼ 84% in HUVECs, MCF-7, and MDA-MB-231 cells, respectively, compared to their respective control groups. Percent increases in CXCR4+ cells were significantly lower in MDA-MB-231 cells when compared to HUVEC and MCF-7 cells (Figure 9b). Representative flow cytometry histograms regarding CD44, CXCR4, and CCR7 protein levels are given in Figure S7.
Figure 9.

CD44+ and CCR7+ cell populations decrease significantly in all cell lines. (a) Percentage of CD44+, CXCR4+, and CCR7+ cells in control and treatment groups. * denotes significance between control and treatment groups. (b) Relative changes in the CD44, CXCR4, and CCR7 positivity after treatment. Differences between groups were indicated with *.
Subcellular Localization
It was previously reported that subcellular localization of PS determines the mode of cell death in PDT.26 In our study, SiPc-HDACi did not localize to the mitochondria, whereas it still disrupted the mitochondrial network, leading to decreased mitochondrial signals in all cell lines. “Rounder” cells were observed compared to untreated controls of each cell line. SiPc-HDACi mainly localized to nuclei and nucleoli in all cell lines (white arrows); however, fluorescent deposits on nuclear membranes were also observed in MCF-7 and MDA-MB-231 cells (red arrows) (Figure 10).
Figure 10.

Confocal images of untreated (left column) and SiPc-HDACi-treated (right column) cells. Cells were stained with anti-mitochondria antibodies and counterstained with DAPI. White arrows indicate SiPc-HDACi deposits in nuclei and nucleoli, whereas red arrows indicate fluorescence deposits around nuclei. Scale bars indicate 20 μm. All images were taken at 63× zoom with immersion oil.
Visualization of Autophagy
Autophagy is defined as the tightly regulated process that involves delivery of the old and/or damaged cytoplasmic components to lysosomes for degradation.27 Autophagosome formation consists of three main stages: initiation, nucleation, and expansion of the isolation membrane. Initiation stage starts at the phagophore assembly site.28 At the expansion stage, microtubule-associated protein 1 light chain 3 (MAP1LC3; also known as LC3) lipidation with phosphatidylethanolamine occurs.29 Here, we observed homogeneous LC3A/B staining in untreated cells where SiPc-HDACi treatment led to autophagosome formation in MCF-7 and MDA-MB-231 cells, which is observed with puncta formation and indicated with white arrows (Figure 11) while not inducing autophagy in HUVECs.
Figure 11.

Confocal images of untreated (left column) and SiPc-HDACi-treated (right column) cells. Cells were stained with rabbit polyclonal anti-LC3A/B antibodies followed by donkey anti-rabbit Alexa Fluor 488 secondary antibodies and counterstained with DAPI. White arrows indicate puncta formation. Scale bars indicate 20 μm. All images were taken at 63× zoom with immersion oil.
Breast cancer is the most common cancer among women worldwide (excluding non-melanoma skin cancer)30 and the second leading cause of cancer-related deaths after lung cancer.31 In 2017, more than 250,000 new cases of breast cancer were diagnosed, and it is estimated that 12% of all women will be diagnosed with breast cancer during their lifetimes. Various factors play a role in breast cancer mutagenesis including gene mutations, prolonged endogenous and exogenous estrogen exposure, and family history.32 Despite the advancements in cancer management, therapies that increase the survival rate while improving life quality of patients are still required.33 As it avoids systemic adverse effects by exerting a local response and being capable of initiating antitumor immunity, PDT may be an attractive option for breast cancer treatment; both alone and in combination with other procedures. The first clinical study regarding PDT in breast cancer treatment evaluated the efficiency of Photofrin, a purified hematoporphyrin derivative on recurrent skin metastases and revealed a 50% success rate.34 PDT has been tested for treatment of both solid breast tumors as well as of superficial metastases since then and showed promising results especially when administered in combination with chemotherapy and radiotherapy.33
Small-molecule HDACis have successfully altered HDAC activity in pre-clinical models, introducing them to clinical trials. However, as reviewed by Gryder et al., two FDA-approved HDACi, suberoylanilide hydroxamic acid (SAHA) (vorinostat) and FK228 (romidepsin), were found to be inefficient in solid tumors while exerting toxic side effects.35 In 2013, Patil et al. were the first to describe 3-hydroxypyridin-2-thione (3-HPT) as an alternative to non-hydroxamate zinc-binding groups (ZBGs) for inhibition of HDAC 6 and HDAC 8.25 HDAC6 primarily resides in the cytoplasm to regulate various extranuclear proteins including tubulin and, thus, is involved in cell motility and metastasis.35 Furthermore, it also is involved in aggresome formation, which plays an important role in elimination of misfolded protein aggregates, and its inhibition has been shown to increase susceptibility to misfolded protein stress.36 Located on the X chromosome, with its co-factor-independent activity and lacking a C-terminal protein binding domain, HDAC8 differs from other class I HDACs.37 HDAC8 inhibition decreases deacetylating activity of HDAC8, in turn, promoting many cellular events including cell cycle arrest and apoptosis.37 HDAC8 activity is also related with proliferation and resistance to apoptosis in various cancer types before. As being unresponsive to most common ZBG, the hydroxamate, HDAC8 is the least inhibited isoform among class I HDACs.35 Balasubramanian et al. developed a specific HDAC8 inhibitor, PCI-34051, that induces apoptosis effectively on T-cell lymphoma and in leukemia cell lines in a calcium-mediated manner; in contrast, the same treatment remained ineffective for solid tumors.38
Studies regarding PSs in combination with HDACi for cancer treatment are limited. In 2014, Ye et al. were the first to report anticancer efficiency of four photosensitive cyclometalated Ir(III)–HDACi complexes that exerted phototoxicity against human pulmonary carcinoma cell line A549, cisplatin-resistant cell line A549R, and human normal liver cell line LO2.17 Mechanistic studies revealed all four complexes induce apoptosis by increasing ROS production, promoting mitochondrial damage, and downregulating HDAC activity, which are consistent with our findings. Kasparkova et al. developed an HDACi, suberoyl-bis-hydroxamic acid (SubH)-conjugated photosensitive platinum(IV) complex18 and evaluated its anticancer properties in ovarian carcinoma cell line A2780. This novel SubH-photosensitive Pt(IV) complex exerted higher cytotoxicity compared to its biologically inactive ligand-bearing counterpart or chemotherapeutic platin analogue cisplatin on both cisplatin sensitive and resistant cells, suggesting that HDACi substitution may induce a different cell death mechanism than photosensitive Pt(IV) or cisplatin. Halaburková et al. combined a natural photoactive compound, hypericin, with either pan-HDACis, SAHA and Trichostatin A, or valproic acid and sodium phenylbutyrate that target nuclear HDACs, to evaluate combinatorial effects in two different colorectal cancer cell lines, HCT116 and HT29, that are known to be resistant to hypericin-mediated PDT.16 The authors revealed that HDACi pretreatment induces cyclin-dependent kinase inhibitor 1A (CDKN1A) expression epigenetically and increases anticancer efficacy of hypericin-mediated PDT. Recenty, Liu et al. developed a nanogel containing second-generation PS chlorin-6 (Ce6) that not only acts as a PS but also facilitates drug delivery to tumor.39 Hypoxic conditions in tumor cells activate the hypoxia-inducible factor 1α (HIF-1α) pathway that eventually increases vascular endothelial growth factor (VEGF) expression to promote angiogenesis and tumor proliferation. The authors further introduced SAHA that was previously proven to inhibit the hypoxia signaling pathway to the Ce6-containing nanogel and observed increased antitumor efficiency that was accompanied by decreased HIF-1α and VEGF levels. As indicated, studies combining PS and HDACi for anticancer treatment are restricted to these studies, and none of them involve a phthalocyanine derivative for PDT.
Apoptosis is a tightly regulated cell death mechanism that is essential for maintenance of normal cellular homeostasis by either eliminating undesired or potentially harmful cells. Dysregulations in apoptotic pathways are related to various pathological conditions including cancer.40 Apoptosis is considered as the main cell death pathway in both photodynamic cancer therapy and HDAC inhibition.17 Consistent with previous findings, SiPc-HDACi treatment decreased viability significantly in all cell lines by promoting apoptosis without initiating a necrotic response. In addition, apoptosis was not the only programmed cell death pathway activated as a result of SiPc-HDACi treatment: further imaging studies revealed that treatment induced autophagy in both breast cancer cell lines, but not in HUVECs. Previously, both photosensitive agents and HDACis are known to promote autophagy,41 which plays a role in immunological cell death and supports PDT-mediated cell death in specially apoptosis-resistant cell lines.42 Even though it did not directly target mitochondria, SiPc-HDACi disrupted the mitochondrial network in all cell lines most likely as a result of ROS generation leading to mitochondrial dysfunction, which is linked with the intrinsic apoptotic pathway.43 DNA damage is another factor promoting apoptosis44 and HDACis are reported not to cause DNA breaks directly, but they suppress DNA repair proteins and induce ROS accumulation leading to DNA damage.45 On the other hand, PSs may promote DNA damage by generating ROS, oxidizing DNA bases, cross-linking DNA strands, or inducing sister chromatid exchanges.46 Flow cytometric analysis of DNA content relies on the differences in DNA amount cells have through cell division stages G0/G1 (pre-replicative cells), S (dividing cells), and G2/M (post-replicative plus mitotic cells). Cells with fragmented DNA can also be identified, and this fraction is named “subG1” population.47SiPc-HDACi treatment increased subG1 phases in all cell lines, which is another indicator of increased DNA damage; however, it is not clear that if this damage is a result of HDACi activity or induced by PDT. In addition to the increased SubG1 phase, treatment led to G2/M arrest accompanied by decreased G0/G1 ratios. Previously, phthalocyanines were shown to induce cell cycle arrest at both G0/G148,49 and G2/M50,51 phases in different cell lines.
PDT generates highly toxic 1O2 along with ROS, which is thought to be not the main inducer of DNA damage due to its short lifespan and limited range, unless it is generated close to DNA strands.46 In our study, confocal imaging revealed SiPc-HDACi accumulation in nucleoli and around nuclei. Thus, SiPc-HDACi treatment-induced 1O2 may lead to direct DNA damage rather than solely ROS-mediated organelle dysfunction. HDAC6 activity has been shown to regulate tumor proliferation in breast cancer and viability both in vivo and in vitro; moreover, HDAC6 ablation has sensitized cells to death promoted by loss of adhesion.52,53 In our study, SiPc-HDACi decreased HDAC6 levels in all cell lines significantly with a greater effect on HUVECs and MDA-MB-231 cells compared to MCF-7 cells. These findings may be related with estrogen-dependent regulation of HDAC6: in vitro studies performed with estradiol-treated MCF-7 and MDA-MB-231 cells revealed that HDAC6 is regulated by estrogen on hormone-responsive MCF-7 cells whereas constitutively expressed on MDA-MB 231 cells.54 HDAC8 overexpression, which is associated with poor prognosis in breast tumors,55 has also been linked with increased proliferation and migration capacity before.56,57SiPc-HDACi decreased HDAC8 protein levels significantly in all treatment groups, while no significant difference between cell lines was observed. Since both HDAC6 and HDAC8 are known to increase cell motility, we next investigated the effect of SiPc-HDACi on CXCR4, CCR7, and CD44 protein levels, which are known to play major roles in cancer migration and invasion. Small chemoattractive cytokines, chemokines, are the largest family of cytokines consisting of approximately 50 endogenous chemokine ligands and 20 chemokine receptors that regulate many cellular functions58 including tumor proliferation, metastasis, and invasion.59 C-X-C chemokine receptor type 4 (CXCR4) and CXC chemokine stromal-derived-factor-1 (SDF-1 or CXCL12) interaction regulates various events including signaling cascades that lead to increased cell survival, proliferation, migration, and invasion.58 CXCR4 expression also increases VEGF production by tumor to promote vascularization. Ruffini et al. revealed that blocking interaction between CXCR4 and its ligand CXCL12 significantly reduces metastasis in various cancers including breast cancer in vivo.60 In addition to binding to the chemokine receptors belonging to the G protein-coupled cell surface receptors (GPCRs) family, chemokines also interact with atypical chemokine receptors (ACKR)61 or glycosaminoglycans (GAGs).62 Interacting with the GAGs, members of the CD44 family act as a extracellular matrix component hyaluronan (HA) receptor and are involved in many physiological and pathological processes including cancer.63 Fuchs et al. revealed that HA modulates CXCR4-CXCL12 signaling via CD44.64 CC-chemokine receptor 7 (CCR7) is another chemokine receptor, known to play roles in tumor formation, metastasis, and invasion. CCR7 is also involved in an epithelial-to-mesenchymal transition process (EMT) in breast cancer.65 CXCR4 or CCR7 increases chemotaxis and invasiveness in breast cancer by regulating actin polymerization and pseudopodia formation66 and promotes metastasis by inhibiting detachment-induced cell death (anoikis) both in vitro and in vivo.67SiPc-HDACi treatment decreased both CD44 and CCR7 protein levels in all cell lines, suggesting that it may inhibit metastasis by decreasing migration and invasion capacities of tumor cells.
Conclusions
Due to its several advantages over conventional therapeutic options, PDT is regarded as a favorable treatment alternative for cancer. Here, we synthesized and characterized a novel 3-hydroxypyridin-2-thione-substituted silicon Pc derivative that combines the chemotherapeutic benefits of downregulating HDAC6 and HDAC8 with the photodynamic action of SiPc. We revealed that SiPc-HDACi exerts its cytotoxic effect both by promoting apoptosis and leading to cell cycle arrest in addition to decreasing HDAC6 and HDAC8 protein levels. The triple negative breast cancer (TNBC) cell line MDA-MB-231 gave the most prominent response to treatment: when treated with their respective IC50 values, the lowest viable cell rate along with the highest late apoptotic cell population as well as the highest DHR123 intensity was observed in this cell line, suggesting that combining PS with HDACi may be a novel approach regarding TNBC. When considering its aggressive nature and unresponsiveness to targeted therapies, more different treatment approaches need to be developed for TNBC treatment.68 Moreover, a treatment decreasing protein levels of CD44, a cell surface adhesion receptor that is overexpressed in many cancers and shown to play a role in invasion and migration, and CCR7, a protein involved in EMT process, would indicate that HDAC downregulation along with PDT may be capable of preventing metastases. To our knowledge, this study is the first one evaluating the anticancer efficacy of an HDACi-substituted Pc derivative. In conclusion, our results indicate that Pc derivatives combined with HDACis may be promising drug candidates for breast cancer treatment. As mentioned previously, more research regarding the development of new PDT agents targeting tumor cells to increase treatment efficiency is still needed. Our further studies will be conducted with in vivo breast cancer models as well as HDACi substitutions of various Pc derivatives in vitro.
Experimental Section
Materials and Methods
FT-IR spectra were recorded on a Perkin Elmer Spectrum 100 FT-IR spectrophotometer. MALDI-TOF mass spectrometry analyses were carried out on a Bruker micro flex LT MALDI-TOF MS spectrometer using dihydroxybenzoic acid as a matrix. 1H NMR and 13C NMR spectra were recorded in DMSO-d6 solutions on a Varian 500 MHz spectrometer. Elemental analysis was carried out using a Thermo Finnigan Flash 1112 instrument.
Starting compounds SiCl2Pc,69,70HDACi (1-(2-methyl-(1,1′-biphenylmethyl))-3-hydroxyoxypyridin-2-thione),25 and Polyoxo-SiPc(23,24) were synthesized according to the literature. Data regarding synthesis and characterization of HDACi and Polyoxo-SiPc were given in the Supporting Information (Figures S8–S19 and Figures 20–23, respectively).
Synthesis of SiPc-HDACi
HDACi (200 mg, 0.65 mmol, 2.2 equiv), NaH (100 mg, 4.2 mmol, 14.2 equiv), and dry toluene (40 mL) were placed into a flask, and argon gas was bubbled through this mixture for 5 min. After addition of SiCl2Pc (185 mg, 0.3 mmol, 1.0 equiv), the mixture was stirred in reflux conditions under an argon atmosphere overnight. The reaction mixture cooled to room temperature was filtered. The solvent was removed under reduced pressure. The resulting crude blue solid was purified by column chromatography (aluminum oxide, CH2Cl2/EtOH (100:1)) to give a blue solid (30 mg, 0.026 mmol) in 9% yield. Anal. calc for C70H48N10O2S2Si: C, 72.89; H, 4.19; N, 12.14%, Found: C, 72.75; H, 4.15; N, 12.30. FT-IR (ATR): vmax, cm–1 = 3106, 3083, 3048, 2942, 2918, 2860, 2234, 1582, 1565, 1474, 1445. 1H NMR (500 MHz, CDCl3) δH, ppm 9.2 (m, 8H, Pc-H), 8.4 (m, 8H, PcH), 7.7 (d, 2H, ArH), 7.6 (t, 2H, ArH), 7.4–7.3 (m, 14H, ArH), 6.9 (d, 2H, ArH), 6.6 (t, 2H, ArH), 5.0 (s, 4H, CH2), 2.3 (s, 6H, CH3). 13C NMR (125 MHz, CDCl3) δC, ppm 168.5, 159.0, 151.5, 149.0, 147.5, 142.1, 140.2, 139.5, 135.2, 134.0, 133.1, 130.2, 129.9, 129.5, 127.0, 126.4, 126.0, 125.5, 125.2, 120.0, 117.1, 115.2, 112.3, 110.1, 103.2, 50.0, 22.1. MALDI-TOF (m/z) calc 1152.3 for C70H48N10O2S2Si; found: 1155.3 [M + 3H]+.
Photophysical and Photochemical Measurements
The photophysical behavior of SiPc-HDACi was recorded in common organic solvents including N,N-dimethylformamide (DMF), dimethyl sulfoxide (DMSO), tetrahydrofuran (THF), dichloromethane (DCM), dioxane, acetone, and toluene (Figure 2). Photodegradation quantum yield (Φd), fluorescence lifetimes (τF), fluorescence quantum yield (ΦF), and singlet oxygen formation yield (ΦΔ) values of the SiPc-HDACi were measured and calculated according to methods, and the formulas are given in the Supporting Information.
Cell Lines and Culture Studies
MCF-7 and MDA-MB-231 cells were cultured in high glucose (4.5 g/L) Dulbecco’s modified Eagle’s medium (DMEM), while DMEM/F12 was used for culturing HUVECs, both supplemented with 10% fetal bovine serum and antibiotic solution (100 IU penicillin and 0.1 mg streptomycin).
In order to evaluate dark toxicity and phototoxicity and to calculate IC50 values on each cell line; 5000 cells per well was seeded into 96-well cell culture test plates in triplicate. For flow cytometric analyses and western blotting, 500,000 cells were seeded into 6 cm tissue culture dishes and treated with SiPc-HDACi at respective IC50 values. For flow cytometric analyses, cells were detached with trypsin–EDTA solution (0.25%, Thermo Fisher Scientific) at the end of the incubation period and washed twice with phosphate-buffered saline (PBS) prior to analysis. For confocal imaging, cells were seeded on Millicell EZ slides (Merck Millipore, USA) as 20,000 cell per well. For protein extraction, cells were lysed with ice-cold protein extraction buffer containing a protease and phosphatase inhibitor mix (Halt protease and phosphatase inhibitor cocktail, Thermo Fisher Scientific). Total protein concentrations of the lysates were determined using a BCA protein assay kit (Pierce BCA protein assay kit, Thermo Scientific). Samples were kept at −80 °C until use.
Phototoxicity and Dark Toxicity
SiPc-HDACi and Polyoxo-SiPc were dissolved in DMSO and diluted in culture medium in order to prepare 1, 5, 25, 50, and 100 μM solutions. The final concentration of DMSO was the same for each treatment group including the control group and did not exceed 0.1% in each treatment. Vehicle (DMSO)-treated cells were used as control. For evaluation of dark toxicity, cells were incubated with SiPc-HDACi or Polyoxo-SiPc at the concentrations mentioned above for 24 h. For the determination of IC50 values, cells were irradiated using a homemade LED array (700 nm wavelength) at a 500 mJ total optical dose71 after 24 h of incubation in the dark. Viability was assessed after an additional 24 h with a resazurin-based in vitro toxicology assay kit (cat. no. TOX8, Sigma Aldrich, USA). Absorbance was measured at 570 and 600 nm wavelengths using a spectrophotometer (Epoch, BioTek Instruments). The formula given below was used for determining cytotoxicity.
where O1 is the molar extinction coefficient of oxidized Alamar Blue at 570 nm (80586), O2 is the molar extinction coefficient of oxidized Alamar Blue at 600 nm (117216), A1 is the absorbance of test wells at 570 nm, A2 is the absorbance of test wells at 600 nm, P1 is the absorbance of control wells at 570 nm, and P2 is the absorbance of control wells at 600 nm.
Differences between different doses of compounds were compared by the Kruskal–Wallis test followed by Dunn’s multiple comparison test. A p value lower than 0.05 was considered as significantly different. Further cell culture studies were conducted by treating cell lines with the corresponding IC50 values of SiPc-HDACi calculated according to the Alamar Blue assay results.
Annexin V/Propidium Iodide Staining
Detached cells were suspended in Annexin V binding buffer (cat. no. 1006, BioVision Inc.) followed by staining with the Annexin V-FITC reagent (cat. no. 1001, Biovision Inc.) and propidium iodide (cat. no. P1304MP, Thermo Fisher Scientific) by incubating cells on ice for 15 min. Analyses were performed on a Beckman Coulter CytoFLEX flow cytometer. CytExpert software was used to analyze the data. For statistical analysis, two-way analysis of variance (ANOVA) followed by Tukey’s multiple comparison test was used for comparing treatment efficiency between cell lines, while effects of the treatment within the cell lines compared to corresponding controls were compared using two-way ANOVA followed by Sidak’s multiple comparison test. p < 0.05 was considered as statistically significant.
DNA Content Analysis
In order to analyze the DNA content of the cells upon treatment, a Coulter DNA prep reagent kit (Cat. No. 6607055, Beckman Coulter) was used. Detached cells were fixed and permeabilized by suspending in DNA-Prep LPR followed by staining with DNA-Prep stain by incubating at room temperature for 40 min (duration was validated and optimized). Samples were stored at 4 °C until analysis and were read with a Navios EX flow cytometry system (Beckman Coulter). Analyses were performed using ModFit Software Version 5. Two-way ANOVA followed by Bonferroni’s multiple comparisons test was performed to investigate the significant differences.
Western Blotting
Anti-HDAC6 (cat. no. 7558, Cell Signaling Technologies) and anti-HDAC8 (cat. no. 685502, Biolegend Inc.) primary antibodies were prepared at 1:1000 dilution whereas anti-GAPDH antibodies (M00227-1, Boster Bioscience) were prepared at 1:5000 dilution in Tris-buffered saline-Tween 20 solution (TBS-T) with 3% Blocker BSA (cat. no. 37520, Thermo Fisher Scientific). Total cell lysates (30 μg) were separated on 10% bis-acrylamide gels by running gels at 80 V for 3.5 h at room temperature. Then, proteins were transferred to a 0.45 μm PVDF membrane (cat. no. IPVH00010, Merck Millipore) at 300 mA for 1 h by wet transfer. Membranes were blocked in 5% skim milk in TBS-T at room temperature for 1 h followed by the incubation with primary antibodies overnight at 4 °C. Membranes were then washed with TBS-T and probed with either HRP-conjugated anti-rabbit or anti-mouse IgG secondary antibodies (7074 and 7076, respectively, both from Cell Signaling Technologies) at room temperature for 1 h. After washing membranes with TBS-T, images were acquired on a Vilber Fusion Pulse imaging system. Treatment groups were compared by using two-way ANOVA followed by Tukey’s multiple comparison test, while two-way ANOVA followed by Sidak’s multiple comparison test was used to evaluate differences between treatment and their respective controls of the cell lines.
Dihydrorhodamine 123 Assay
DHR123 is a non-fluorescent probe that readily enters cells where it is oxidized to fluorescent rhodamine in the presence of reactive oxygen and nitrogen species.72 In this study, 2.5 × 10⁵ cells were incubated with 5 μM DHR123 at room temperature for 25 min and immediately analyzed by flow cytometry (CytoFLEX, Beckman Coulter). Analyses were performed using CytExpert software. Differences between cell lines within the treatment groups were compared using two-way ANOVA followed by Tukey’s multiple comparison test, while two-way ANOVA followed by Sidak’s multiple comparison test was used to evaluate differences between control and treatment groups within cell lines.
Flow Cytometric Measurement of CD44, CXCR4, and CCR7 Levels
Anti-CD44-PE, anti-CXCR4-PerCP/Cy5.5, and anti-CCR7-PE/Cy7 antibodies were purchased from Biolegend. Cells (2.5 × 10⁵) were suspended in 100 μL of PBS and labeled by incubating with antibodies (5 μL per test) at room temperature for 20 min in the dark. Cells were washed twice, resuspended in PBS, and analyzed on a CytoFLEX flow cytometry system. Data analysis was performed on CytExpert software. Comparisons between treatment and control groups were done with two-way ANOVA followed by Sidak’s multiple comparison test. Differences in the percent changes in CD44, CXCR4, and CCR7 positive populations after treatment compared to their respective control groups between the cell lines were analyzed by one-way ANOVA followed by Tukey’s multiple comparison test. P values lower than 0.05 was considered as statistically significant (**p < 0.01 and ****p < 0.0001).
Confocal Microscopy
Cells seeded on 8-well microscopy slides were fixed with 2% glutaraldehyde solution (cat. no. 340855, Sigma Aldrich) by incubating at 4 °C for 15 min. 0.1 M glycine solution was applied to quench residual aldehydes for 1 h at room temperature that was followed by permeabilization with 0.25% Triton X-100 in PBS at room temperature for 15 min. Prior to antibody incubation, cells were blocked with 3% Blocker BSA in PBS (cat. no. 37525, Thermo Fisher Scientific) by incubating for 1 h at room temperature. Mitochondria were labeled by incubating the cells at 4 °C overnight with an Alexa Fluor 488-conjugated anti-mitochondria antibodies (cat. no. MAB1273A4, Merck Millipore) in blocking solution at 1:500 dilution. For imaging autophagosome formation, slides were incubated overnight with LC3A/B antibodies (Cell Signaling Technologies, polyclonal) at 1:200 dilution followed by incubating with an Alexa Fluor 488-conjugated donkey anti-rabbit secondary antibody (Abcam, polyclonal) for an hour at room temperature. Slides were mounted with Antifading Mounting Medium with DAPI (cat. no. SCR-038448, Dianova) and visualized under a Zeiss LSM 880 Airyscan inverted microscope at 63× magnification with immersion oil. Images were obtained using Zeiss Zen software (Black Edition).
Acknowledgments
We thank The Scientific and Technological Research Council of Turkey (TUBITAK) for financial support (project no. 118Z693).
Supporting Information Available
The Supporting Information is available free of charge at https://pubs.acs.org/doi/10.1021/acsomega.0c03180.
1H and 13C NMR spectra; mass spectra of SiPc-HDACi (Figures S1–S3); results of photophysical, photochemical measurements and related data (absorption, fluorescence, fluorescence lifetime, fluorescence quantum yield, and singlet oxygen formation (Figures S4 and S5)); bar graphics indicating cytotoxic properties of Polyoxo-SiPc under dark conditions after incubating cells with the compound for 24 h, and light cytotoxicity evaluated upon light exposure (Figure S6); flow cytometry histograms regarding control and SiPc-HDACi-treated HUVEC, MCF-7, and MDA-MB-231 cell lines indicating CD44, CXCR4, and CCR7 protein levels (Figure S7); synthesis and characterization of HDACi derivatives (Figures S8–S19); synthesis and characterization of Polyoxo-SiPc (Figures S20, S21) (PDF)
The authors declare no competing financial interest.
Supplementary Material
References
- Dang J.; He H.; Chen D.; Yin L. Manipulating tumor hypoxia toward enhanced photodynamic therapy (PDT). Biomater. Sci. 2017, 5, 1500–1511. 10.1039/C7BM00392G. [DOI] [PubMed] [Google Scholar]
- Rapozzi V.; D’Este F.; Xodo L. E. Molecular pathways in cancer response to photodynamic therapy. J. Porphyrins Phthalocyanines 2019, 23, 410–418. 10.1142/S1088424619300064. [DOI] [Google Scholar]
- Buytaert E.; Dewaele M.; Agostinis P. Molecular effectors of multiple cell death pathways initiated by photodynamic therapy. Biochim. Biophys. Acta 2007, 1776, 86–107. 10.1016/j.bbcan.2007.07.001. [DOI] [PubMed] [Google Scholar]
- Shi X.; Zhang C. Y.; Gao J.; Wang Z. Recent advances in photodynamic therapy for cancer and infectious diseases. WIREs Nanomed. Nanobiotechnol. 2019, 11, e1560 10.1002/wnan.1560. [DOI] [PMC free article] [PubMed] [Google Scholar]
- Henderson B. W.; Dougherty T. J. How does photodynamic therapy work?. Photochem. Photobiol. 1992, 55, 145–157. 10.1111/j.1751-1097.1992.tb04222.x. [DOI] [PubMed] [Google Scholar]
- Mashayekhi V.; Op ’t Hoog C.; Oliveira S. Vascular targeted photodynamic therapy: A review of the efforts towards molecular targeting of tumor vasculature. J. Porphyrins Phthalocyanines 2019, 23, 1229–1240. 10.1142/S1088424619300180. [DOI] [PMC free article] [PubMed] [Google Scholar]
- Agostinis P.; Berg K.; Cengel K. A.; Foster T. H.; Girotti A. W.; Gollnick S. O.; Hahn S. M.; Hamblin M. R.; Juzeniene A.; Kessel D.; et al. Photodynamic therapy of cancer: an update. Ca-Cancer J. Clin. 2011, 61, 250–281. 10.3322/caac.20114. [DOI] [PMC free article] [PubMed] [Google Scholar]
- Rak J.; Pouckova P.; Benes J.; Vetvicka D. Drug Delivery Systems for Phthalocyanines for Photodynamic Therapy. Anticancer Res. 2019, 39, 3323–3339. 10.21873/anticanres.13475. [DOI] [PubMed] [Google Scholar]
- Lo P.-C.; Rodríguez-Morgade M. S.; Pandey R. K.; Ng D. K. P.; Torres T.; Dumoulin F. The unique features and promises of phthalocyanines as advanced photosensitisers for photodynamic therapy of cancer. Chem. Soc. Rev. 2020, 49, 1041–1056. 10.1039/C9CS00129H. [DOI] [PubMed] [Google Scholar]
- Lazaro-Carrillo A.; Simões B. M.; Clarke R. B.; Villanueva A. PO-010 Dual chemotherapy and photodynamic therapy: a synergistic strategy to improve cancer treatment. ESMO Open 2018, 3, A231.1–A231. 10.1136/esmoopen-2018-EACR25.545. [DOI] [Google Scholar]
- Peng C.-L.; Lai P.-S.; Lin F.-H.; Yueh-Hsiu Wu S.; Shieh M.-J. Dual chemotherapy and photodynamic therapy in an HT-29 human colon cancer xenograft model using SN-38-loaded chlorin-core star block copolymer micelles. Biomaterials 2009, 30, 3614–3625. 10.1016/j.biomaterials.2009.03.048. [DOI] [PubMed] [Google Scholar]
- Peterson C. M.; Lu J. M.; Sun Y.; Peterson C. A.; Shiah J.-G.; Straight R. C.; Kopeček J. Combination chemotherapy and photodynamic therapy with N-(2-hydroxypropyl) methacrylamide copolymer-bound anticancer drugs inhibit human ovarian carcinoma heterotransplanted in nude mice. Cancer Res. 1996, 56, 3980–3985. [PubMed] [Google Scholar]
- Minucci S.; Pelicci P. G. Histone deacetylase inhibitors and the promise of epigenetic (and more) treatments for cancer. Nat. Rev. Cancer 2006, 6, 38–51. 10.1038/nrc1779. [DOI] [PubMed] [Google Scholar]
- Seto E.; Yoshida M. Erasers of histone acetylation: the histone deacetylase enzymes. Cold Spring Harbor Perspect. Biol. 2014, 6, a018713. 10.1101/cshperspect.a018713. [DOI] [PMC free article] [PubMed] [Google Scholar]
- Li Y.; Seto E. HDACs and HDAC Inhibitors in Cancer Development and Therapy. Cold Spring Harbor Perspect. Med. 2016, 6, a026831. 10.1101/cshperspect.a026831. [DOI] [PMC free article] [PubMed] [Google Scholar]
- Halaburková A.; Jendželovský R.; Koval’ J.; Herceg Z.; Fedoročko P.; Ghantous A. Histone deacetylase inhibitors potentiate photodynamic therapy in colon cancer cells marked by chromatin-mediated epigenetic regulation of CDKN1A. Clin. Epigenet. 2017, 9, 62. 10.1186/s13148-017-0359-x. [DOI] [PMC free article] [PubMed] [Google Scholar]
- Ye R.-R.; Tan C.-P.; He L.; Chen M.-H.; Ji L.-N.; Mao Z.-W. Cyclometalated Ir(III) complexes as targeted theranostic anticancer therapeutics: combining HDAC inhibition with photodynamic therapy. Chem. Commun. 2014, 50, 10945–10948. 10.1039/C4CC05215C. [DOI] [PubMed] [Google Scholar]
- Kasparkova J.; Kostrhunova H.; Novakova O.; Křikavová R.; Vančo J.; Trávníček Z.; Brabec V. A Photoactivatable Platinum(IV) Complex Targeting Genomic DNA and Histone Deacetylases. Angew Chem., Int. Ed. 2015, 54, 14478–14482. 10.1002/anie.201506533. [DOI] [PubMed] [Google Scholar]
- Morais J. A. V.; Rodrigues M. C.; Ferreira F. F.; Ranjan K.; Azevedo R. B.; Poças-Fonseca M. J.; Muehlmann L. A. Photodynamic therapy inhibits cell growth and enhances the histone deacetylase-mediated viability impairment in Cryptococcus spp. in vitro. Photodiagn. Photodyn. Ther. 2020, 29, 101583. 10.1016/j.pdpdt.2019.101583. [DOI] [PubMed] [Google Scholar]
- Li D.; Hu Q.-Y.; Wang X.-Z.; Li X.; Hu J.-Q.; Zheng B.-Y.; Ke M.-R.; Huang J.-D. A non-aggregated silicon(IV) phthalocyanine-lactose conjugate for photodynamic therapy. Bioorg. Med. Chem. Lett. 2020, 30, 127164. 10.1016/j.bmcl.2020.127164. [DOI] [PubMed] [Google Scholar]
- van de Winckel E.; David B.; Simoni M. M.; González-Delgado J. A.; de la Escosura A.; Cunha Â.; Torres T. Octacationic and axially di-substituted silicon (IV) phthalocyanines for photodynamic inactivation of bacteria. Dyes Pigm. 2017, 145, 239–245. 10.1016/j.dyepig.2017.06.004. [DOI] [Google Scholar]
- Zheng B.-Y.; Wang L.; Hu Q.-Y.; Shi J.; Ke M.-R.; Huang J.-D. Novel unsymmetrical silicon (IV) phthalocyanines as highly potent anticancer photosensitizers. Synthesis, characterization, and in vitro photodynamic activities. Dyes Pigm. 2020, 177, 108286. 10.1016/j.dyepig.2020.108286. [DOI] [Google Scholar]
- Nishida M.; Horiuchi H.; Momotake A.; Nishimura Y.; Hiratsuka H.; Arai T. Singlet molecular oxygen generation by water-soluble phthalocyanine dendrimers with different aggregation behavior. J Porphyrins Phthalocyanines 2012, 15, 47–53. 10.1142/S1088424611003008. [DOI] [Google Scholar]
- Şahin B.; Topal S. Z.; Atilla D. Synthesis, Photophysical and Photochemical Properties of a Set of Silicon Phthalocyanines Bearing Anti-Inflammatory Groups. J. Fluoresc. 2017, 27, 407–416. 10.1007/s10895-016-1969-y. [DOI] [PubMed] [Google Scholar]
- Patil V.; Sodji Q. H.; Kornacki J. R.; Mrksich M.; Oyelere A. K. 3-Hydroxypyridin-2-thione as novel zinc binding group for selective histone deacetylase inhibition. J. Med. Chem. 2013, 56, 3492–3506. 10.1021/jm301769u. [DOI] [PMC free article] [PubMed] [Google Scholar]
- Kessel D.; Luo Y. Intracellular sites of photodamage as a factor in apoptotic cell death. J. Porphyrins Phthalocyanines 2001, 05, 181–184. 10.1002/jpp.331. [DOI] [Google Scholar]
- Mizushima N.; Komatsu M. Autophagy: renovation of cells and tissues. Cell 2011, 147, 728–741. 10.1016/j.cell.2011.10.026. [DOI] [PubMed] [Google Scholar]
- Lamb C. A.; Yoshimori T.; Tooze S. A. The autophagosome: origins unknown, biogenesis complex. Nat. Rev. Mol. Cell Biol. 2013, 14, 759–774. 10.1038/nrm3696. [DOI] [PubMed] [Google Scholar]
- Huang R.; Xu Y.; Wan W.; Shou X.; Qian J.; You Z.; Liu B.; Chang C.; Zhou T.; Lippincott-Schwartz J.; et al. Deacetylation of nuclear LC3 drives autophagy initiation under starvation. Mol. Cell 2015, 57, 456–466. 10.1016/j.molcel.2014.12.013. [DOI] [PubMed] [Google Scholar]
- Fitzmaurice C.; Abate D.; Abbasi N.; Abbastabar H.; Abd-Allah F.; Abdel-Rahman O.; Abdelalim A.; Abdoli A.; Abdollahpour I.; et al. Global, Regional, and National Cancer Incidence, Mortality, Years of Life Lost, Years Lived With Disability, and Disability-Adjusted Life-Years for 29 Cancer Groups, 1990 to 2017: A Systematic Analysis for the Global Burden of Disease Study. JAMA Oncol. 2019, 5, 1749–1768. 10.1001/jamaoncol.2019.2996. [DOI] [PMC free article] [PubMed] [Google Scholar]
- DeSantis C. E.; Ma J.; Gaudet M. M.; Newman L. A.; Miller K. D.; Sauer A. G.; Jemal A.; Siegel R. L. Breast cancer statistics, 2019. Ca-Cancer J. Clin. 2019, 69, 438–451. 10.3322/caac.21583. [DOI] [PubMed] [Google Scholar]
- Toss A.; Grandi G.; Cagnacci A.; Marcheselli L.; Pavesi S.; De Matteis E.; Razzaboni E.; Tomasello C.; Cascinu S.; Cortesi L. The impact of reproductive life on breast cancer risk in women with family history or BRCA mutation. Oncotarget 2017, 8, 9144–9154. 10.18632/oncotarget.13423. [DOI] [PMC free article] [PubMed] [Google Scholar]
- Dos Santos A. F.; De Almeida D. R. Q.; Terra L. F.; Baptista M. S.; Labriola L. Photodynamic therapy in cancer treatment - an update review. J. Cancer Metastasis Treat. 2019, 25. 10.20517/2394-4722.2018.83. [DOI] [Google Scholar]
- Khan S. A.; Dougherty T. J.; Mang T. S. An evaluation of photodynamic therapy in the management of cutaneous metastases of breast cancer. Eur. J. Cancer 1993, 29A, 1686–1690. 10.1016/0959-8049(93)90105-o. [DOI] [PubMed] [Google Scholar]
- Gryder B. E.; Sodji Q. H.; Oyelere A. K. Targeted cancer therapy: giving histone deacetylase inhibitors all they need to succeed. Future Med. Chem. 2012, 4, 505–524. 10.4155/fmc.12.3. [DOI] [PMC free article] [PubMed] [Google Scholar]
- Kawaguchi Y.; Kovacs J. J.; McLaurin A.; Vance J. M.; Ito A.; Yao T.-P. The deacetylase HDAC6 regulates aggresome formation and cell viability in response to misfolded protein stress. Cell 2003, 115, 727–738. 10.1016/S0092-8674(03)00939-5. [DOI] [PubMed] [Google Scholar]
- Banerjee S.; Adhikari N.; Amin S. A.; Jha T. Histone deacetylase 8 (HDAC8) and its inhibitors with selectivity to other isoforms: An overview. Eur. J. Med. Chem. 2019, 164, 214–240. 10.1016/j.ejmech.2018.12.039. [DOI] [PubMed] [Google Scholar]
- Balasubramanian S.; Ramos J.; Luo W.; Sirisawad M.; Verner E.; Buggy J. J. A novel histone deacetylase 8 (HDAC8)-specific inhibitor PCI-34051 induces apoptosis in T-cell lymphomas. Leukemia 2008, 22, 1026–1034. 10.1038/leu.2008.9. [DOI] [PubMed] [Google Scholar]
- Liu N.; Liu H.; Chen H.; Wang G.; Teng H.; Chang Y. Polyphotosensitizer nanogels for GSH-responsive histone deacetylase inhibitors delivery and enhanced cancer photodynamic therapy. Colloids Surf., B 2020, 188, 110753. 10.1016/j.colsurfb.2019.110753. [DOI] [PubMed] [Google Scholar]
- Elmore S. Apoptosis: a review of programmed cell death. Toxicol. Pathol. 2007, 35, 495–516. 10.1080/01926230701320337. [DOI] [PMC free article] [PubMed] [Google Scholar]
- Zhang J.; Ng S.; Wang J.; Zhou J.; Tan S.-H.; Yang N.; Lin Q.; Xia D.; Shen H.-M. Histone deacetylase inhibitors induce autophagy through FOXO1-dependent pathways. Autophagy 2015, 11, 629–642. 10.1080/15548627.2015.1023981. [DOI] [PMC free article] [PubMed] [Google Scholar]
- Michaud M.; Martins I.; Sukkurwala A. Q.; Adjemian S.; Ma Y.; Pellegatti P.; Shen S.; Kepp O.; Scoazec M.; Mignot G.; et al. Autophagy-dependent anticancer immune responses induced by chemotherapeutic agents in mice. Science 2011, 334, 1573–1577. 10.1126/science.1208347. [DOI] [PubMed] [Google Scholar]
- Ježek J.; Cooper K. F.; Strich R. Reactive Oxygen Species and Mitochondrial Dynamics: The Yin and Yang of Mitochondrial Dysfunction and Cancer Progression. Antioxidants 2018, 7, 13. 10.3390/antiox7010013. [DOI] [PMC free article] [PubMed] [Google Scholar]
- Redza-Dutordoir M.; Averill-Bates D. A. Activation of apoptosis signalling pathways by reactive oxygen species. Biochim. Biophys. Acta 2016, 1863, 2977–2992. 10.1016/j.bbamcr.2016.09.012. [DOI] [PubMed] [Google Scholar]
- Lee J.-H.; Choy M. L.; Ngo L.; Foster S. S.; Marks P. A. Histone deacetylase inhibitor induces DNA damage, which normal but not transformed cells can repair. Proc. Natl. Acad. Sci. U. S. A. 2010, 107, 14639–14644. 10.1073/pnas.1008522107. [DOI] [PMC free article] [PubMed] [Google Scholar]
- El-Hussein A.; Harith M.; Abrahamse H. Assessment of DNA Damage after Photodynamic Therapy Using a Metallophthalocyanine Photosensitizer. Int. J. Photoenergy 2012, 2012, 1. 10.1155/2012/281068. [DOI] [Google Scholar]
- Darzynkiewicz Z. Critical aspects in analysis of cellular DNA content. Curr. Protoc. Cytom. 2011, 56, 7.2. 10.1002/0471142956.cy0702s56. [DOI] [PMC free article] [PubMed] [Google Scholar]
- Haywood-Small S. L.; Vernon D. I.; Griffiths J.; Schofield J.; Brown S. B. Phthalocyanine-mediated photodynamic therapy induces cell death and a G0/G1 cell cycle arrest in cervical cancer cells. Biochem. Biophys. Res. Commun. 2006, 339, 569–576. 10.1016/j.bbrc.2005.11.046. [DOI] [PubMed] [Google Scholar]
- Ahmad N.; Feyes D. K.; Agarwal R.; Mukhtar H. Photodynamic therapy results in induction of WAF1/CIP1/P21 leading to cell cycle arrest and apoptosis. Proc. Natl. Acad. Sci. U. S. A. 1998, 95, 6977–6982. 10.1073/pnas.95.12.6977. [DOI] [PMC free article] [PubMed] [Google Scholar]
- Schmidt J.; Kuzyniak W.; Berkholz J.; Steinemann G.; Ogbodu R.; Hoffmann B.; Nouailles G.; Gürek A. G.; Nitzsche B.; Höpfner M. Novel zinc and siliconphthalocyanines as photosensitizers for photodynamic therapy of cholangiocarcinoma. Int. J. Mol. Med. 2018, 42, 534–546. 10.3892/ijmm.2018.3620. [DOI] [PubMed] [Google Scholar]
- Shao J.; Xue J.; Dai Y.; Liu H.; Chen N.; Jia L.; Huang J. Inhibition of human hepatocellular carcinoma HepG2 by phthalocyanine photosensitiser PHOTOCYANINE: ROS production, apoptosis, cell cycle arrest. Eur. J. Cancer 2012, 48, 2086–2096. 10.1016/j.ejca.2011.10.013. [DOI] [PubMed] [Google Scholar]
- Lee Y.-S.; Lim K.-H.; Guo X.; Kawaguchi Y.; Gao Y.; Barrientos T.; Ordentlich P.; Wang X.-F.; Counter C. M.; Yao T.-P. The cytoplasmic deacetylase HDAC6 is required for efficient oncogenic tumorigenesis. Cancer Res. 2008, 68, 7561–7569. 10.1158/0008-5472.CAN-08-0188. [DOI] [PMC free article] [PubMed] [Google Scholar]
- Medler T. R.; Craig J. M.; Fiorillo A. A.; Feeney Y. B.; Harrell J. C.; Clevenger C. V. HDAC6 Deacetylates HMGN2 to Regulate Stat5a Activity and Breast Cancer Growth. Mol. Cancer Res. 2016, 14, 994–1008. 10.1158/1541-7786.MCR-16-0109. [DOI] [PMC free article] [PubMed] [Google Scholar]
- Saji S.; Kawakami M.; Hayashi S.-i.; Yoshida N.; Hirose M.; Horiguchi S.-i.; Itoh A.; Funata N.; Schreiber S. L.; Yoshida M.; et al. Significance of HDAC6 regulation via estrogen signaling for cell motility and prognosis in estrogen receptor-positive breast cancer. Oncogene 2005, 24, 4531–4539. 10.1038/sj.onc.1208646. [DOI] [PubMed] [Google Scholar]
- Hsieh C.-L.; Ma H.-P.; Su C.-M.; Chang Y.-J.; Hung W.-Y.; Ho Y.-S.; Huang W.-J.; Lin R.-K. Alterations in histone deacetylase 8 lead to cell migration and poor prognosis in breast cancer. Life Sci. 2016, 151, 7–14. 10.1016/j.lfs.2016.02.092. [DOI] [PubMed] [Google Scholar]
- Tang X.; Li G.; Su F.; Cai Y.; Shi L.; Meng Y.; Liu Z.; Sun J.; Wang M.; Qian M.; et al. HDAC8 cooperates with SMAD3/4 complex to suppress SIRT7 and promote cell survival and migration. Nucleic Acids Res. 2020, 48, 2912–2923. 10.1093/nar/gkaa039. [DOI] [PMC free article] [PubMed] [Google Scholar]
- An P.; Li J.; Lu L.; Wu Y.; Ling Y.; Du J.; Chen Z.; Wang H. Histone deacetylase 8 triggers the migration of triple negative breast cancer cells via regulation of YAP signals. Eur. J. Pharmacol. 2019, 845, 16–23. 10.1016/j.ejphar.2018.12.030. [DOI] [PubMed] [Google Scholar]
- Dewan M. Z.; Ahmed S.; Iwasaki Y.; Ohba K.; Toi M.; Yamamoto N. Stromal cell-derived factor-1 and CXCR4 receptor interaction in tumor growth and metastasis of breast cancer. Biomed. Pharmacother. 2006, 60, 273–276. 10.1016/j.biopha.2006.06.004. [DOI] [PubMed] [Google Scholar]
- Nagarsheth N.; Wicha M. S.; Zou W. Chemokines in the cancer microenvironment and their relevance in cancer immunotherapy. Nat. Rev. Immunol. 2017, 17, 559–572. 10.1038/nri.2017.49. [DOI] [PMC free article] [PubMed] [Google Scholar]
- Ruffini P. A.; Morandi P.; Cabioglu N.; Altundag K.; Cristofanilli M. Manipulating the chemokine-chemokine receptor network to treat cancer. Cancer 2007, 109, 2392–2404. 10.1002/cncr.22706. [DOI] [PubMed] [Google Scholar]
- Gustavsson M.; Dyer D. P.; Zhao C.; Handel T. M. Kinetics of CXCL12 binding to atypical chemokine receptor 3 reveal a role for the receptor N terminus in chemokine binding. Sci. Signaling 2019, 12, eaaw3657 10.1126/scisignal.aaw3657. [DOI] [PMC free article] [PubMed] [Google Scholar]
- Proudfoot A. E. I.; Johnson Z.; Bonvin P.; Handel T. M. Glycosaminoglycan Interactions with Chemokines Add Complexity to a Complex System. Pharmaceuticals 2017, 10, 70. 10.3390/ph10030070. [DOI] [PMC free article] [PubMed] [Google Scholar]
- Orian-Rousseau V. CD44 Acts as a Signaling Platform Controlling Tumor Progression and Metastasis. Front. Immunol. 2015, 6, 154. 10.3389/fimmu.2015.00154. [DOI] [PMC free article] [PubMed] [Google Scholar]
- Fuchs K.; Hippe A.; Schmaus A.; Homey B.; Sleeman J. P.; Orian-Rousseau V. Opposing effects of high- and low-molecular weight hyaluronan on CXCL12-induced CXCR4 signaling depend on CD44. Cell Death Dis. 2013, 4, e819 10.1038/cddis.2013.364. [DOI] [PMC free article] [PubMed] [Google Scholar]
- Xu B.; Zhou M.; Qiu W.; Ye J.; Feng Q. CCR7 mediates human breast cancer cell invasion, migration by inducing epithelial-mesenchymal transition and suppressing apoptosis through AKT pathway. Cancer Med. 2017, 6, 1062–1071. 10.1002/cam4.1039. [DOI] [PMC free article] [PubMed] [Google Scholar]
- Müller A.; Homey B.; Soto H.; Ge N.; Catron D.; Buchanan M. E.; McClanahan T.; Murphy E.; Yuan W.; Wagner S. N.; et al. Involvement of chemokine receptors in breast cancer metastasis. Nature 2001, 410, 50–56. 10.1038/35065016. [DOI] [PubMed] [Google Scholar]
- Kochetkova M.; Kumar S.; McColl S. R. Chemokine receptors CXCR4 and CCR7 promote metastasis by preventing anoikis in cancer cells. Cell Death Differ. 2009, 16, 664–673. 10.1038/cdd.2008.190. [DOI] [PubMed] [Google Scholar]
- Aysola K.; Desai A.; Welch C.; Xu J.; Qin Y.; Reddy V.; Matthews R.; Owens C.; Okoli J.; Beech D. J.; et al. Triple Negative Breast Cancer - An Overview. Hereditary Genet. 2013, 2013, 001. 10.4172/2161-1041.S2-001. [DOI] [PMC free article] [PubMed] [Google Scholar]
- Wheeler B. L.; Nagasubramanian G.; Bard A. J.; Schechtman L. A.; Kenney M. E. A silicon phthalocyanine and a silicon naphthalocyanine: synthesis, electrochemistry, and electrogenerated chemiluminescence. J. Am. Chem. Soc. 1984, 106, 7404–7410. 10.1021/ja00336a019. [DOI] [Google Scholar]
- Sasa N.; Okada K.; Nakamura K.; Okada S. Synthesis, structural and conformational analysis and chemical properties of phthalocyaninatometal complexes. J. Mol. Struct. 1998, 446, 163–178. 10.1016/S0022-2860(97)00309-8. [DOI] [Google Scholar]
- Atilla D.; Saydan N.; Durmuş M.; Gürek A. G.; Khan T.; Rück A.; Walt H.; Nyokong T.; Ahsen V. Synthesis and photodynamic potential of tetra- and octa-triethyleneoxysulfonyl substituted zinc phthalocyanines. J. Photochem. Photobiol., A 2007, 186, 298–307. 10.1016/j.jphotochem.2006.08.022. [DOI] [Google Scholar]
- Volk A. P. G.; Moreland J. G. Chapter Thirteen - ROS-Containing Endosomal Compartments: Implications for Signaling. Methods Enzymol. 2014, 535, 201–224. 10.1016/B978-0-12-397925-4.00013-4. [DOI] [PubMed] [Google Scholar]
Associated Data
This section collects any data citations, data availability statements, or supplementary materials included in this article.