

Abstract
Traumatic brain injury (TBI) is a leading cause of death and long-term disability worldwide. Although chronic disability is common after TBI, effective treatments remain elusive and chronic TBI pathophysiology is not well understood. Early after TBI, brain metabolism is disrupted due to unregulated ion release, mitochondrial damage, and interruption of molecular trafficking. This metabolic disruption causes at least part of the TBI pathology. However, it is not clear how persistent or pervasive metabolic injury is at later stages of injury. Using untargeted 1H-NMR metabolomics, we examined ex vivo hippocampus, striatum, thalamus, frontal cortex, and brainstem tissue in a rat lateral fluid percussion model of chronic brain injury. We found altered tissue concentrations of metabolites in the hippocampus and thalamus consistent with dysregulation of energy metabolism and excitatory neurotransmission. Furthermore, differential correlation analysis provided additional evidence of metabolic dysregulation, most notably in brainstem and frontal cortex, suggesting that metabolic consequences of injury are persistent and widespread. Interestingly, the patterns of network changes were region-specific. The individual metabolic signatures after injury in different structures of the brain at rest may reflect different compensatory mechanisms engaged to meet variable metabolic demands across brain regions.
Keywords: NMR metabolomics, Chronic TBI, Lateral fluid percussion, Network structure, Correlations-based analysis
Introduction
Traumatic brain injury (TBI) is a leading cause of accidental death in individuals under the age of 45, affecting 2.8 million people in the USA annually [1, 2], at a projected annual cost of ~ $60 billion [3]. Less than 1/3 of patients symptomatic 1 year after TBI show further recovery, and as a result TBI is one of the most common causes of long-term disability [4, 5]. To date, there have been no successful clinical trials for disease-modifying agents after TBI, and progress in this area is slowed by a paucity of studies exploring the pathophysiology of chronic TBI.
Despite gaps in the understanding of TBI pathophysiology, it is known that changes in brain metabolism after TBI correspond to altered neurologic function in both animal models and TBI patients. Acute TBI modifies ion flux, neurotransmitter release, and glucose metabolism and these alterations are causally linked to functional deficits after injury [6–8]. Likewise, functional recovery after TBI parallels the recovery of glucose metabolism [9]. Acute measurements of brain energy metabolism, such as N-acetylaspartate (NAA):creatine ratio [10] and absolute levels of lactate and NAA [11], may reflect severity of injury.
This relationship between post-TBI brain metabolism and function is consistent with the current understanding of brain activity-metabolism linkage in general. Maintaining ionic gradients required for neurotransmission is energetically costly and accounts for 80–85% of brain energy usage [12]. Neuronal activation in response to environmental stimuli and cognitive effort initiates additional glucose uptake and metabolic activity, requiring a rapid and dynamic response from neurons and astrocytes [13, 14]. If metabolic demands cannot be met, cognitive processes cannot be sustained [15, 16].
Even though the link between brain metabolism and early post-injury cognitive symptoms is well established [6–8], metabolism is rarely studied in chronic TBI. Studies directly assessing metabolic dysregulation in human chronic TBI patients are infrequent, and available studies are limited to quantification, relative abundance, or uptake of individual or small numbers of metabolites [17–20]. Additional methods, such as functional MRI (fMRI), provide indirect assessments of brain metabolism and link metabolism to brain activity, as the stoichiometry of oxygen utilization: glucose metabolism: glutamate cycling is 6:1:1 [21, 22]. During task performance, the fMRI BOLD signal is higher in TBI patients than in control subjects, irrespective of any performance decrements [23]. The implication is that the post-TBI brain can compensate to meet demand but is less efficient, incurring increased physiological costs for equivalent mental activity [23]. Combined, these data support a role for dysregulated metabolism in chronic TBI pathology. They also underscore the need for larger scale investigations of brain metabolism in chronic TBI.
Metabolomics is a systems biology approach that simultaneously measures large numbers of small molecule metabolites. These metabolites represent the end-products of gene and protein activity, more closely reflecting the physiological phenotype of an organism than genomic or proteomic approaches [24]. Metabolomics studies in TBI to date have focused on metabolism in the acute post-injury period [25], with only a few studies following subjects as long as 7–14 days post-injury [26–28].
Metabolism is often described as a collection of pathways; in reality, these pathways intersect at numerous points providing multiple routes to a single metabolic endpoint [29, 30]. This redundancy permits dynamic responses to changes in the supply of intermediates and demands within the network [30]. However, this redundancy also complicates interpretation of metabolic data, as metabolite levels may vary under identical circumstances [31], or may remain stable even with significant changes to the underlying metabolic pathways [32]. However, correlations-based analysis methods address some of these challenges. Correlations between metabolite concentrations imply relationships between individual members of a network [33] and changes in correlations provide critical information about the network structure, independent of metabolite concentrations [34]. Although correlated metabolites are not necessarily closely apposed in a single metabolic pathway [35], they likely have shared metabolic regulation [36]. In other words, the degree of correlation between metabolites reveals how closely related they are from a regulatory standpoint [37, 38].
Functionally distinct brain nuclei have specialized cell types, cellular compositions, primary transmitter systems, and energetic requirements that contribute to unique metabolic signatures within different brain regions [39]. However, the metabolic vulnerability or resilience of different areas of the brain to chronic injury is unknown. Here, we examined resting metabolic profiles using untargeted 1H NMR metabolomics across five brain regions in a rat lateral fluid percussion TBI model to determine relative metabolic dysregulation of different regions in chronic injury (60 days from injury). Tissue concentrations of some metabolites were altered in chronic TBI in hippocampus and thalamus. Additionally, we used correlations-based analyses to further probe relationships between metabolites, uncovering evidence of lasting changes in the regulatory structure of metabolic networks throughout the brain after TBI in resting animals. These correlation changes show that the supply of metabolic substrates is maintained, but the utilization/regulation of metabolic resources is altered. These changes reflect both compensatory and ongoing pathological processes in chronic TBI. Ultimately, these results may represent deficits in the chronically injured brain’s ability to mobilize resources to completely meet the demands of neurotransmission and cognitive processing.
Materials and Methods
Subjects
Thirty adult male Sprague-Dawley rats (275–300 g Envigo, Indianapolis, USA) were used for these studies. The animals were housed at the University of Cincinnati in a climate-controlled vivarium on a 12:12 light:dark cycle with ad libitum access to food and water and standard housing enrichment. The animals were pair-housed except for 1 week after surgery to allow the incision to heal. Upon arrival at the animal facility, animals were randomly assigned to either the control (n = 15) or TBI (n = 15) group. All procedures used in these experiments were reviewed and approved by the University of Cincinnati Institutional Animal Care and Use Committee.
Lateral Fluid Percussion Injury
TBI was produced via a lateral fluid percussion injury as previously described [40]. Briefly, a 4-mm craniectomy was placed centered over the parietal cortex midway between the bregma and lambda sutures and midway between the sagittal suture and the temporal ridge under 2.5–3% isoflurane anesthesia. A hub made from the base of a 20-g syringe needle was secured over the craniectomy with cyanoacrylic glue, dental cement, and a surgical screw. A Luer-loc cap attached to the hub protected the brain surface. Animals received buprenorphine (.03 mg/kg s.c.) and acetaminophen (100 mg/kg p.o.) for 36 h after craniectomy surgery [41]. Ninety-six hours after craniectomy, animals receiving TBI were anesthetized for 5 min with 4% isoflurane. The cap was removed, the animals were attached directly to the lateral fluid percussion device (Custom Design and Fabrication, Richmond VA) and a fluid pulse was delivered to the brain surface at a pressure of 2 atm [41]. The animals were immediately placed on their back and allowed to recover. Approximate injury severity was gauged by duration of apnea (time to first breath), and length of time required to return to upright (reflex righting time). Once upright, the animal was placed back under isoflurane anesthesia (2.5–3%), the hub and cement were removed, and the skin sutured closed. Control animals were handled but did not receive surgery or analgesics. The animals were weighed daily for the first week after surgery, then twice weekly until the end of the study. Incisions were monitored daily from the time of craniectomy until 1 week after TBI for signs of inflammation or infection. No animals developed infections. Craniectomies were completely healed at the time of euthanasia.
Sample Collection
Un-anesthetized animals were euthanized by rapid decapitation 60 days after TBI. Brains were removed from the skull and divided into left and right hemispheres. Individual brain regions were then dissected on wet ice from the right (ipsilateral to injury) hemisphere using anatomical landmarks in the same order for each animal. Tissue samples were placed into pre-weighed bead tubes (Precellys, Cayman Chemical, Ann Arbor, MI), reweighed for wet tissue weight, and snap frozen in liquid nitrogen. All samples were stored at − 80 °C until use. Collection times for each brain region were measured from the time of decapitation to the time of metabolic quenching in liquid nitrogen and consistency in the dissection protocol was verified via principal component analysis (PCA).
Tissue Sample Preparation
The total water content of each tissue was determined prior to this experiment using pooled rat brain control material (RBCM) which was 81%. Based on the weights of wet tissues, the solvent volumes used for extraction were calculated for each sample. In each extraction set, seven or eight experimental samples along with QC samples, RBCM, and blank, were extracted using a modified Bligh and Dyer extraction [42, 43]. Briefly, cold methanol and water were added to the samples in bead tubes with 2.8-mm beads, and samples were homogenized for 30 s. The samples were transferred into glass tubes containing cold chloroform and water. The final methanol:chloroform:water ratio was 2:2:1.8. The mixture was vortexed for 30 s, incubated on ice for 10 min, then centrifuged at × 2000gn for 5 min. The polar phase was transferred into a 1.5-mL Eppendorf tube and dried by vacuum centrifuge for 2–3 h at room temperature. The dried metabolites were resuspended in 200 μL of NMR buffer. A final volume of 180 μL of each sample was transferred into a 3-mm NMR tube (Norell, Morgantown, NC) for data collection.
NMR Spectroscopy Acquisition and Processing
One-dimensional 1H NMR spectra were acquired on a Bruker Avance II 600 MHz spectrometer. All data were collected at a calibrated temperature of 298 K using noesypr1d (or noesygppr1d) pulse sequence in the Bruker pulse sequence library. Experiments were run with 4 dummy scans (DS) and 256 acquisition scans (NS) with an acquisition time (AQ) of 3.4 s and a relaxation delay (D1) of 3.0 s for a total repetition cycle (AQ + D1) of 6.4 s. The NOESY mixing time was 6 ms. The spectral width was 16 ppm, and 64 K real data points were collected. All free induction decays (FIDs) were subjected to an exponential line-broadening of 0.3 Hz. Upon Fourier transformation, each spectrum was manually phased, baseline corrected, and referenced to the internal standard, trimethylsilylpropanoic acid (TMSP) at 0.0 ppm using a Topspin 3.5 software (Bruker Analytik, Rheinstetten, Germany). The signal-to-noise (S/N) of each spectra was calculated using sino command in TopSpin with signal frequency region (SIGF) 0.5–10.0 ppm and noise frequency region (NOISF) 11.0–12.0 ppm. The lowest S/N of each tissue types were FC 2595.31, BS 4900.33, T 1297.01, H 2056.02, ST 925.48, and RBCM 5337.64 (Online resource 1).
For a representative sample, two-dimensional data were collected for metabolites assignment (Online resource 2). 1H-1H total correlation spectroscopy (TOCSY) data, a relaxation delay equal to 2 s, isotropic mixing time of 80 ms with a B1 field strength of 10 kHz were used for 2048 data points with 128 scans per increment were acquired with spectral widths of 14 ppm. In addition, 2D 1H-13C heteronuclear single quantum coherence (HSQC) data, a relaxation delay equal to 1.5 s was used between acquisitions and a refocusing delay of 3.45 ms was implemented. The 2048 data points with 128 scans per increment were acquired with spectral widths of 11 ppm in F2 and 180 ppm in F1 (13C).
Spectral Analysis/Metabolites Identification
Chemical shifts were assigned to metabolites based on 1D 1H, 2D TOCSY, and HSQC NMR experiments with reference spectra found in databases, Human Metabolome Database (HMDB) [44, 45], and Chenomx® NMR Suite profiling software (Chenomx Inc. version 8.1). The concentrations of the metabolites in polar extracts were calculated using Chenomx Processor. The Chenomx software consists of a large number of metabolite reference spectra at several pH conditions. The software allows fitting of the reference spectra onto the experimental data and based on the internal standard concentration 1.0 mM TMSP, the concentration of identified metabolites are calculated. The tissue polar metabolites concentrations were then normalized to the original tissue weights prior to further analysis.
Data Analyses
The data analysis workflow is depicted in Fig. 1. Body weight and metabolite concentrations were analyzed by t test or by two-way ANOVA with Holm-Sidak correction for multiple comparisons, as appropriate. Collection times were analyzed by two-way repeated measures ANOVAwith Holm-Sidak correction. Correlations of metabolite concentration to collection times were performed using multiple regressions with Bonferroni correction. When a metabolite was not detected in all 30 samples, it was removed from further analyses. Across the 5 brain regions we had 2 metabolites, both in thalamus that did not have a detectable reading for all 30 subjects in the study. In both these metabolites, there were multiple missing values in both treatment groups. We chose to exclude those two metabolites from analysis rather than interpolate missing values. Correlations between tissue collection time and metabolite concentrations were assessed in every region for control and TBI groups independently and for the entire study population. When significant correlations were identified, these metabolites were not excluded for analysis, but the findings were considered in the interpretation of the data. All analyses were performed in JMP 13, R 3.5.0, or Graphpad 7. Adjusted p values of 0.05 or less were considered statistically significant.
Fig. 1.
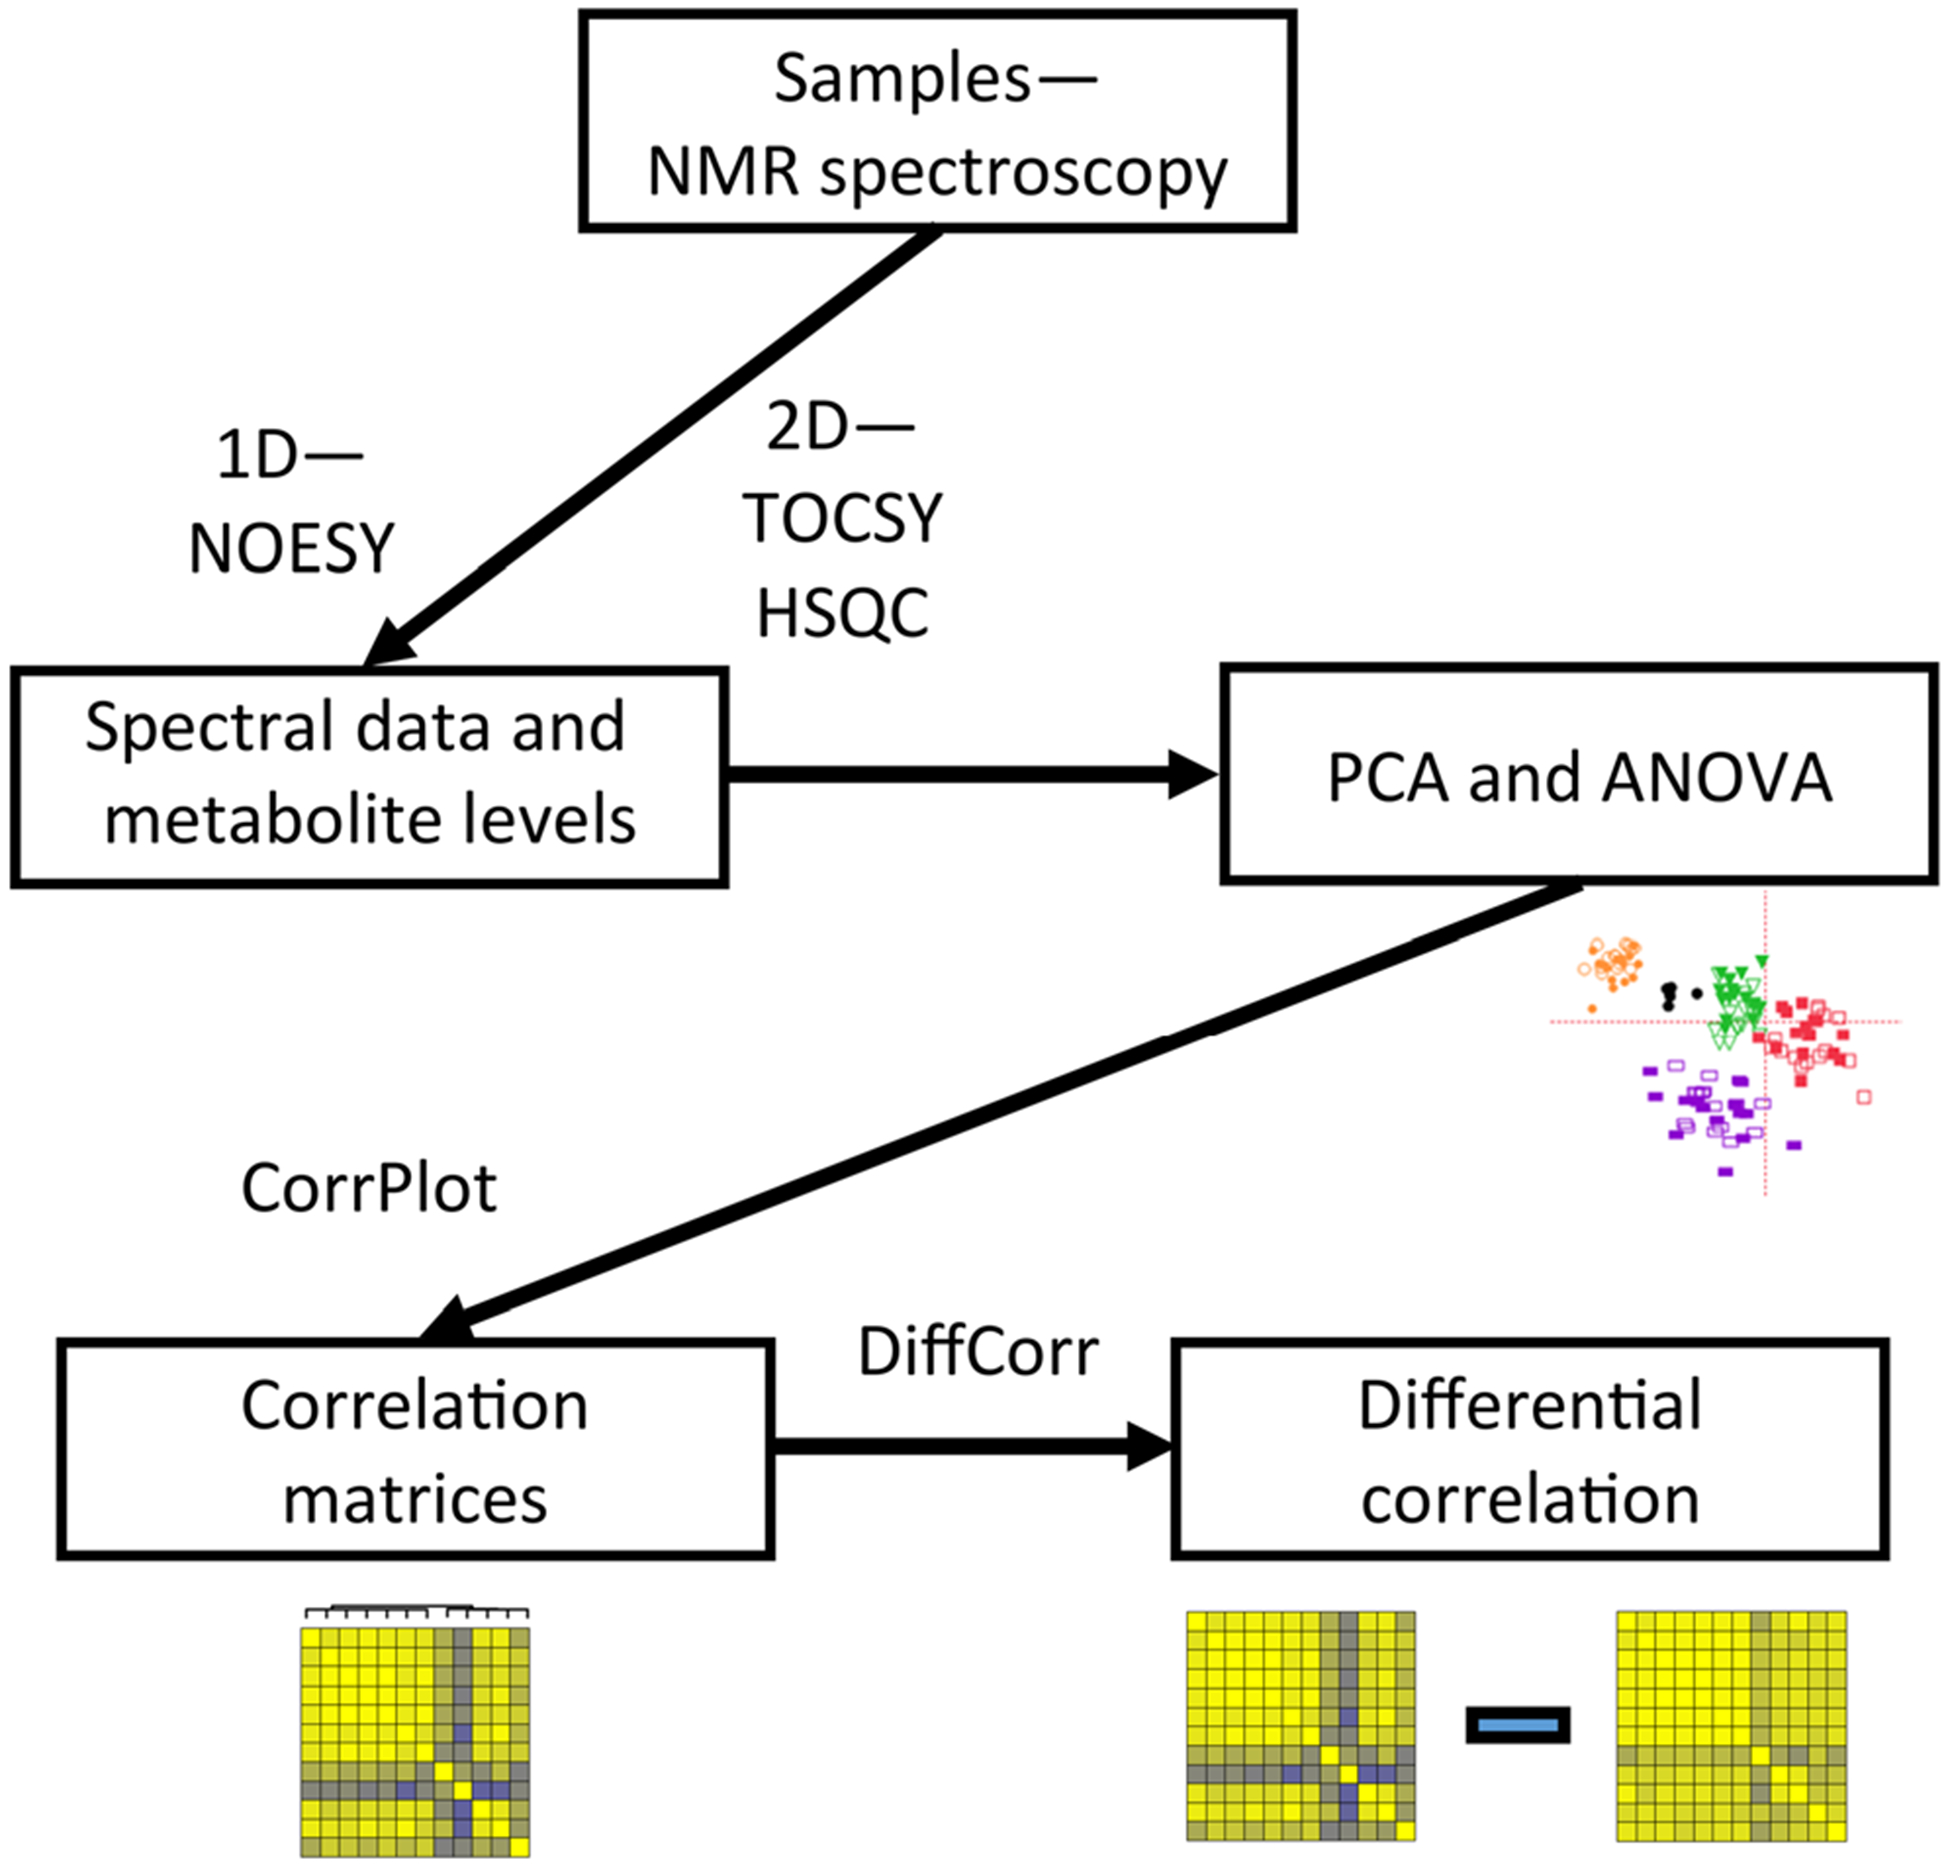
Workflow for data collection and analysis. Tissue samples were submitted to the NMR metabolomics core at Cincinnati Children’s Hospital, which performed 1D and 2D NMR analysis, as well as initial PCA analysis of spectral data. Metabolite concentrations were determined from the 1D spectra by the core. Concentration data from each region were then analyzed using the CorrPlot R package to construct correlation matrices. The DiffCorr R package was used to subtract the TBI matrix from the control matrix using Fisher’s r to z transformation, and generate apparent z scores for the differences in correlations between the two conditions
PCA was performed to determine the reproducibility of the dissection, extraction, and sample stability and to look for differences in metabolic profiles. 1H NMR spectra were processed and analyzed with AMIX for PCA analysis. The spectra from 0.5 to 10.0 ppm, excluding the region of the residual water resonance (4.67 to 5.0 ppm) and solvent peaks identified in the blanks; acetone (1.91 to 1.94 ppm), chloroform (7.62 to 7.74 ppm), and methanol (3.35–3.37 ppm), were reduced by uniform binning to 199 buckets 0.01 ppm wide. Signal intensities were summed for integration, and the spectra were normalized to constant total spectral area. Prior to PCA analysis, the binned spectra were mean-centered with no scaling. The assessment of the reproducibility was determined by median relative standard deviation (%RSD) which was 9.45% among the six RBCM samples [46].
Correlation matrices were generated in R using the CorrPlot module [47]. Metabolites were ordered using Ward’s method of hierarchical clustering [48], based on metabolite relationships in the naïve condition in each region. Differential correlation analysis was performed using the Diffcorr package in R, using Fisher’s r to z transformation to generate a z score for the difference between control and TBI correlation coefficients for each metabolite pair [49]. Finally, based on the number of unique comparisons for each region, we calculated the number of equivalent or larger z scores that would be predicted to occur by chance.
Results
Fluid Percussion Injury
Animals received a mild-moderate TBI. Reflex righting time, an approximation of injury severity, in the TBI group ranged from 146 to 450 s with a mean of 287.4 s. Fourteen of 15 of the TBI animals exhibited apnea after TBI. Apnea ranged from 0 to 21 s with a mean of 10.7 s. Seven of the 15 TBI animals had visible discoloration or thinning of the cortex at or near the injury site. Visible lesions in four of those seven animals were 1 mm or less in diameter. We tested for differences in growth trajectory that could indicate ongoing systemic changes in energy metabolism and found no differences between groups in initial or final body weight (Online resource 3).
Sample Handling
Samples were collected according to anatomical landmarks in the following order: frontal cortex, brainstem and midbrain, thalamus, hippocampus, and striatum (Fig. 2a). Collection time was measured from decapitation to the time the sample was placed in liquid nitrogen. ANOVA analysis identified main effects of both region (the time into liquid nitrogen was longer for the last region dissected than the first (F(4,56) = 496.9; p < 0.001), and treatment (TBI collection times were longer than control (F(1,14) = 5.979; p = 0.028)), and no interaction of treatment and time (F(4,56) = 1.66; p = 0.172) (Fig. 2b). The quality of the dissections was confirmed from the metabolite data using PCA to verify that samples from each region segregated by their metabolite signatures (Fig. 2c).
Fig. 2.
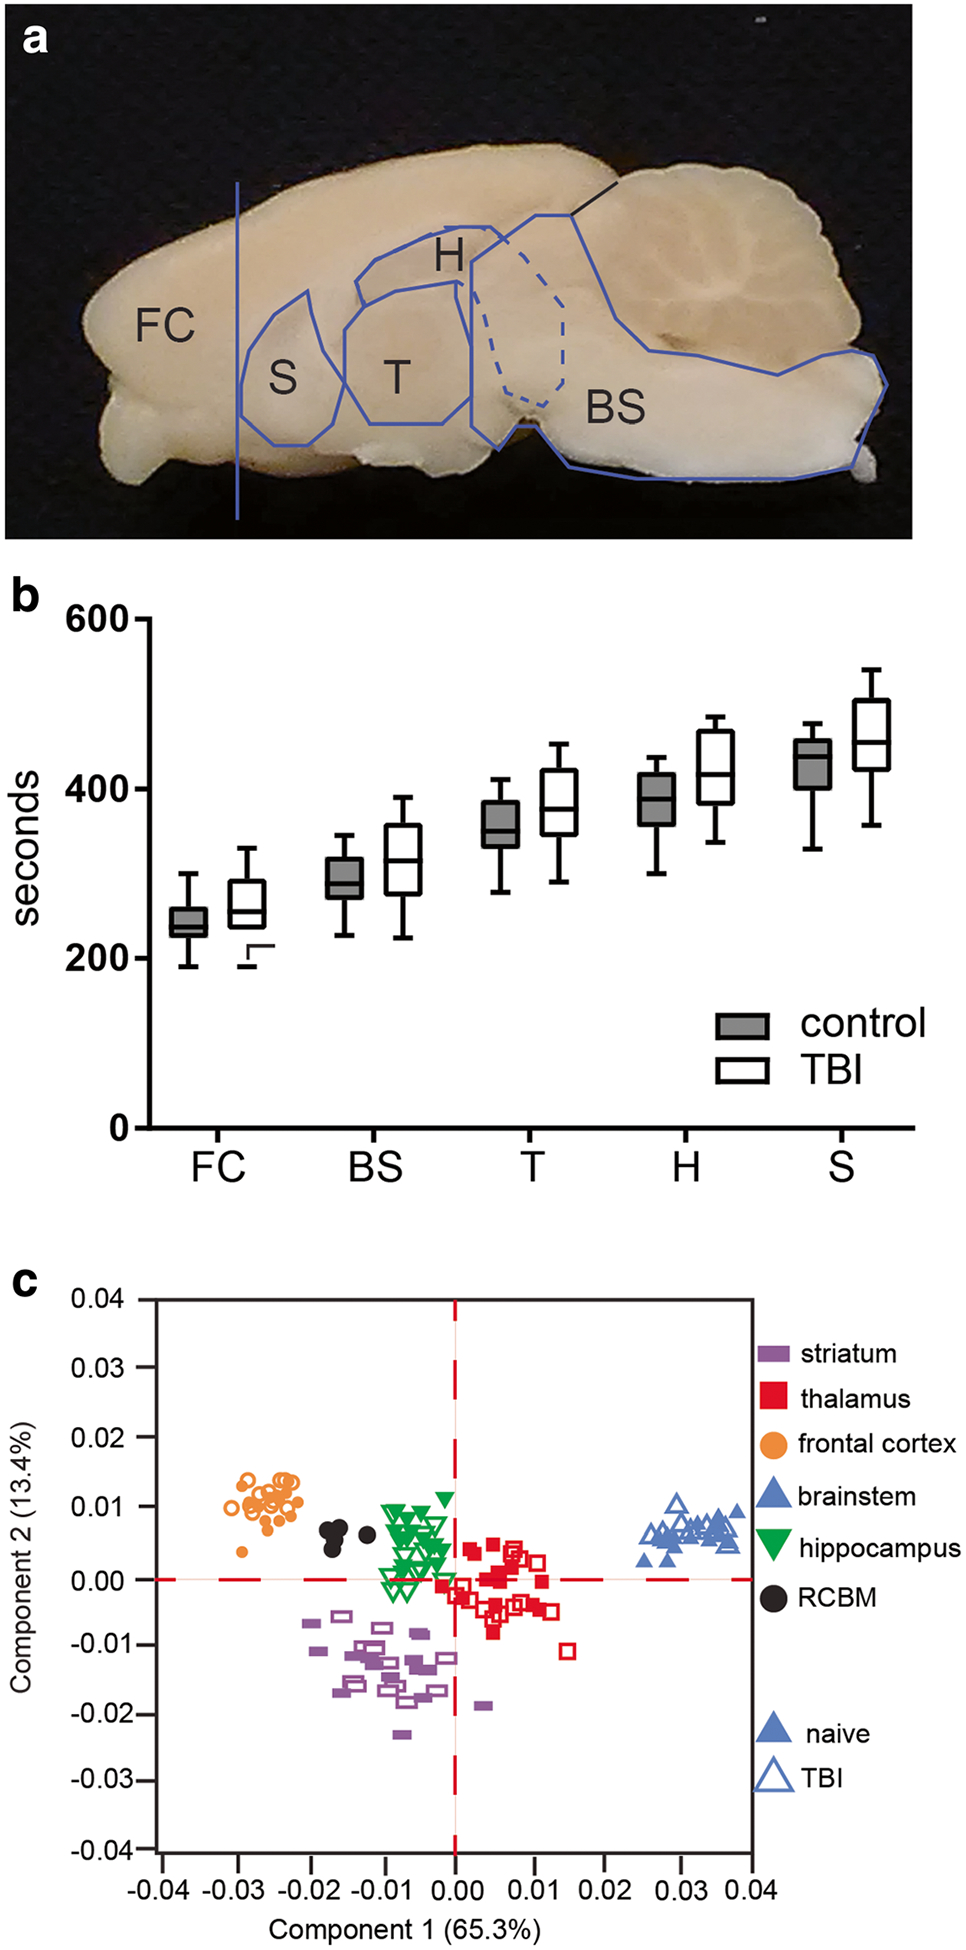
Tissue collection. a Samples were dissected according to anatomical landmarks. b Sample handling time was evaluated for consistency. Time from decapitation to tissue storage was slightly longer for TBI brains. Two-way repeated measures ANOVA, main effects of time (p < 0.01) and treatment (p = .028), and no interaction. c Brain regions clustered by metabolic profile confirming dissection protocol and sample identity. n = 15 control and 15 TBI, data is presented as median, minimum and maximum values, and 1st and 3rd interquartile range. FC, frontal cortex; BS, brainstem; T, thalamus; H, hippocampus; S, striatum, RCBM, rat brain control material
Metabolite Concentrations
In hippocampus, 46 polar metabolites were detected for analysis (Online resource 4). There were no correlations between sample collection time to any metabolite concentration in either treatment group, or the entire cohort. Tissue concentrations of six metabolites were increased in TBI, main effect of treatment group (F(45, 1288) = 36.9; p < 0.001). These metabolites were creatine (adjusted p = 0.0137), glutamate (adjusted p < 0.0001), glutamine (adjusted p = 0.0004), lactate (adjusted p < 0.0001), myoinositol (adjusted p = 0.0002), and taurine (adjusted p = 0.0140) (Fig. 3a). In thalamus, 47 metabolites were detected (Online resource 4). Two metabolites, isobutyrate and NADH, were not detected in every sample and were excluded from analyses. There were no correlations of sample collection time to metabolite concentrations in either treatment group or in the entire cohort. There was a main effect of treatment on metabolite concentrations (F(1, 1293) = 4.872; p = 0.0275). Tissue concentrations of creatine (adjusted p = 0.0083) and glutamine (adjusted p = 0.0255) were increased in TBI samples (Fig. 3b). We found no effect of treatment group on tissue concentrations of metabolites in striatum, frontal cortex, or brainstem.
Fig. 3.
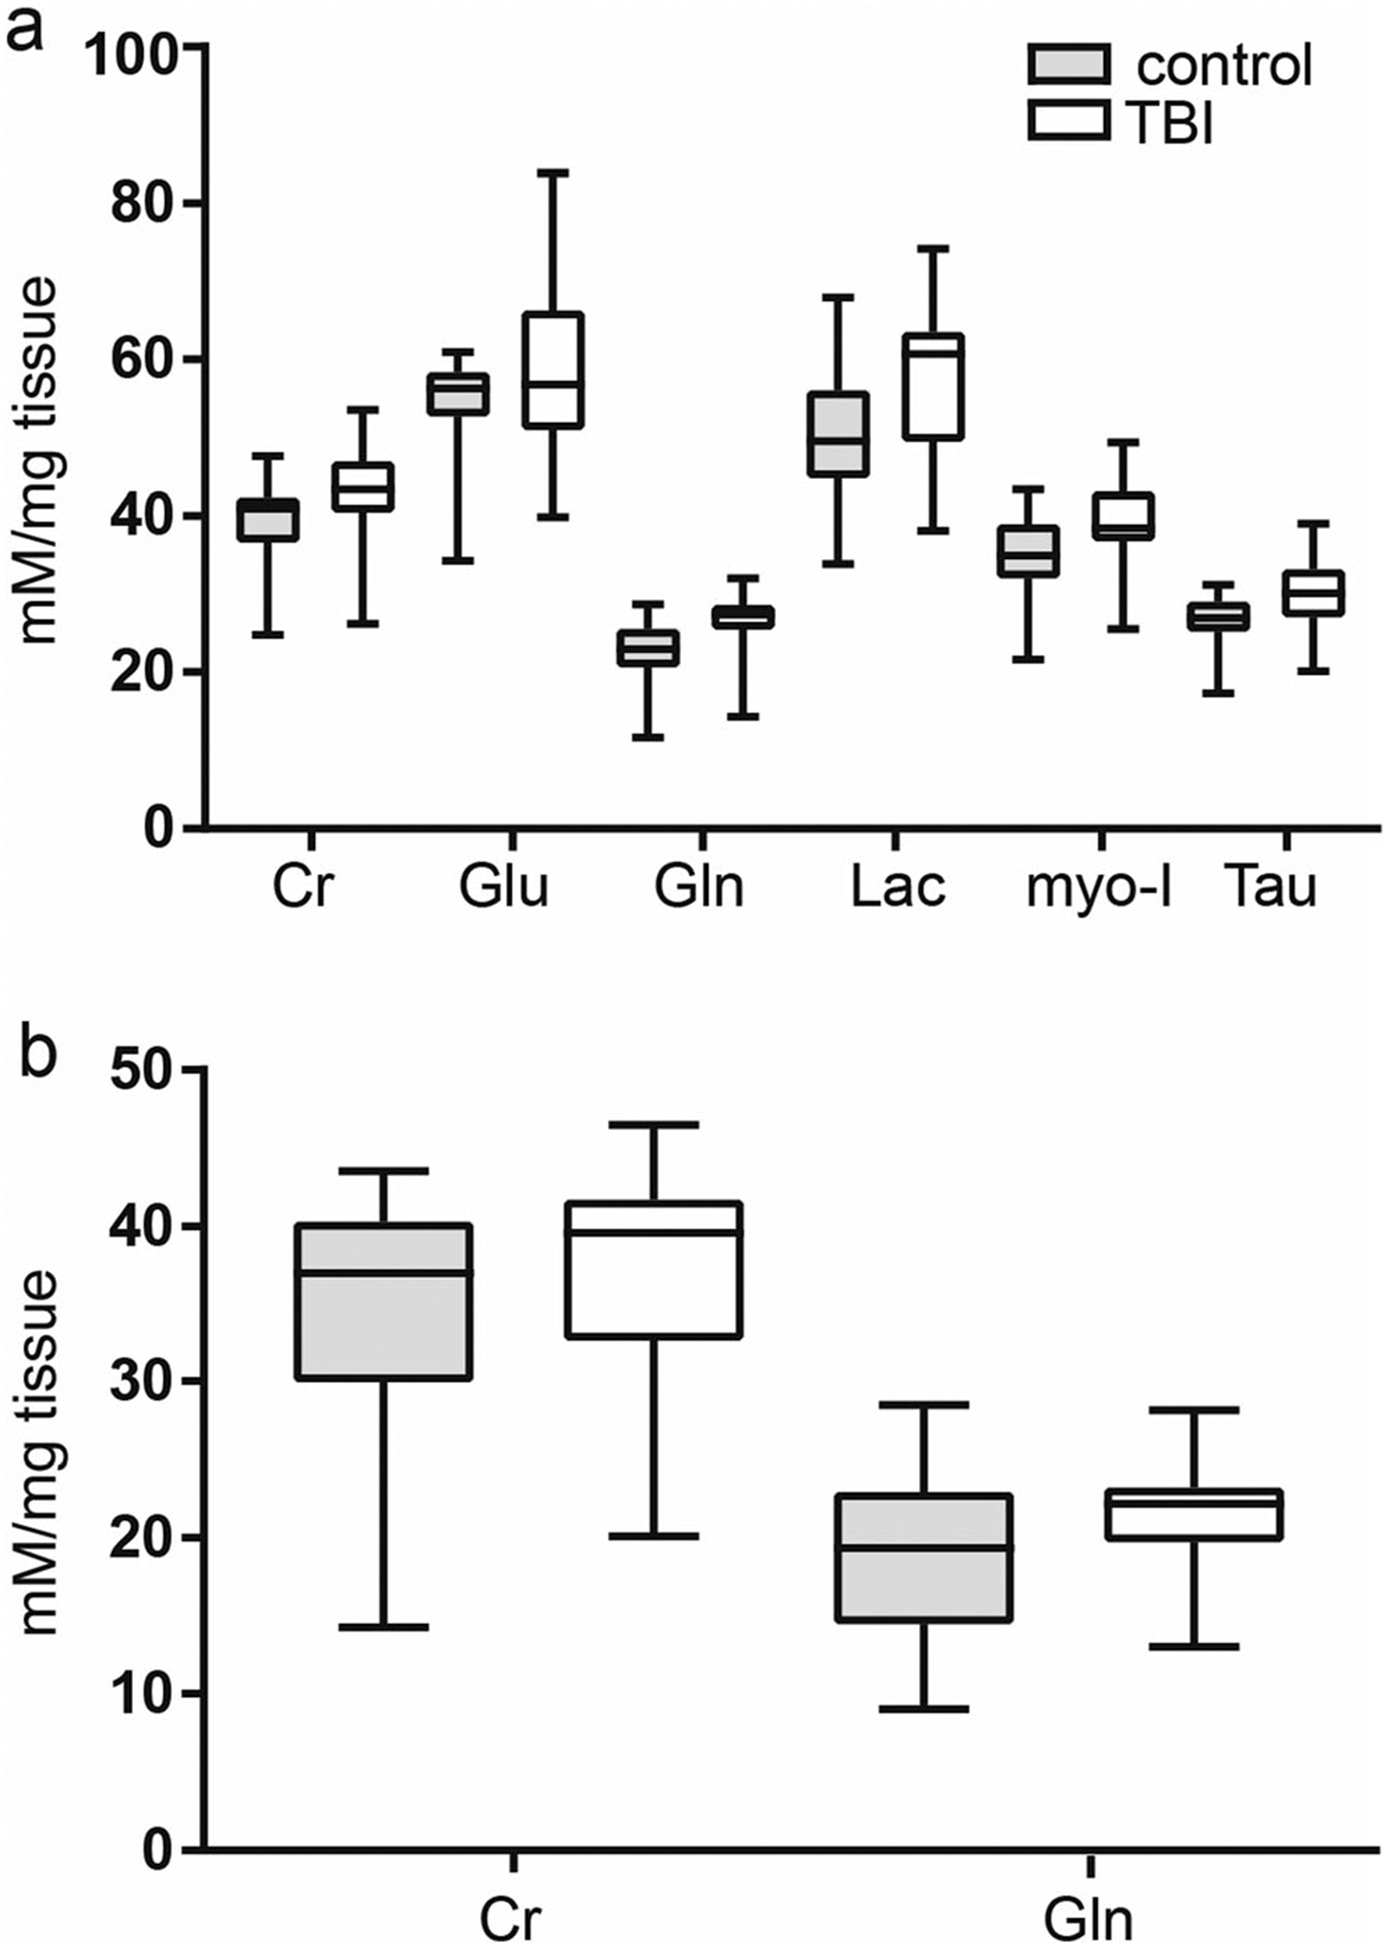
Altered tissue metabolite concentrations after TBI A. In hippocampus, six metabolites had corrected p values less than 0.05. B. In thalamus, two metabolites had corrected p values less than 0.05. In both hippocampus and thalamus, metabolite concentrations were increased over control. Data is median, 1st and 3rd interquartile range, and minimum and maximum values. Cr, creatine; gln, glutamine; glu, glutamate; lac, lactate; myo-I, myo-inositol; Tau, taurine. All data shown is significant corrected, p value < 0.05, two-way ANOVA with Holm-Sidak multiple comparison test. Control n = 15; TBI n = 15
Diffuse Changes in the Underlying Metabolic Network Structure After Chronic TBI
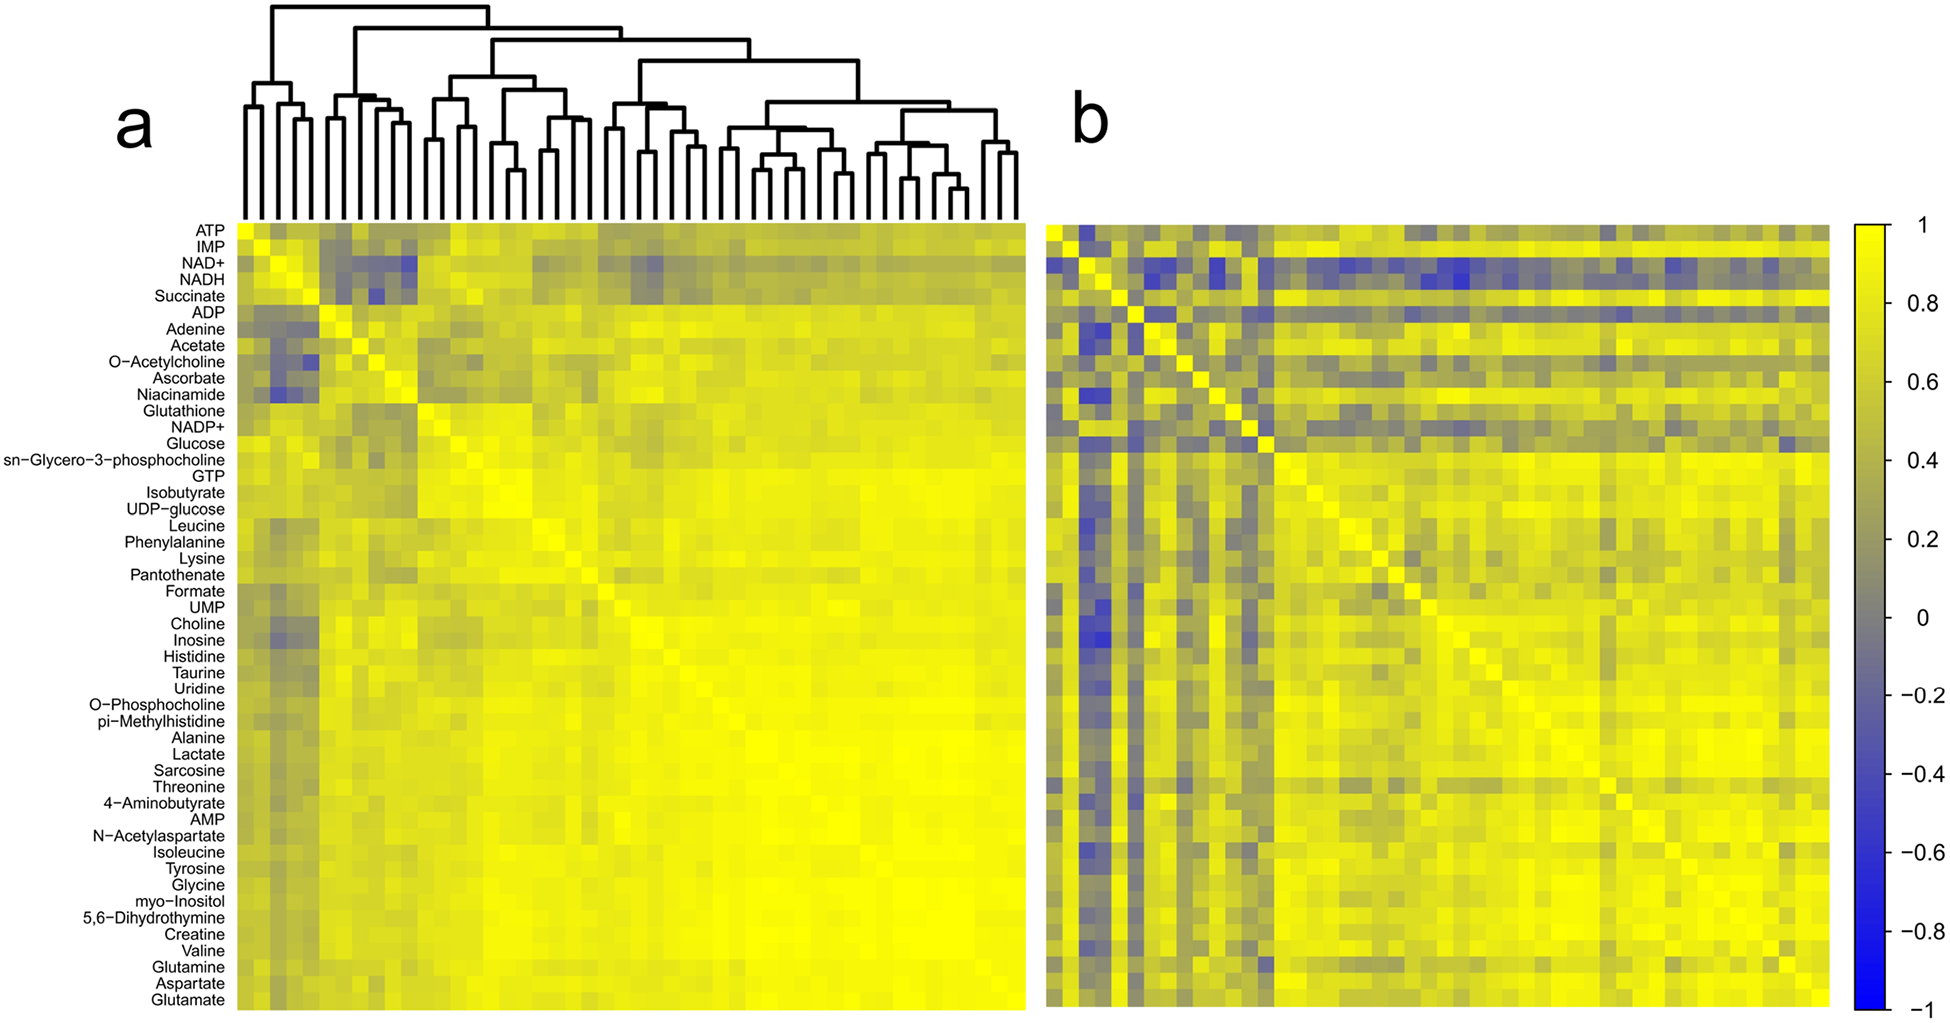
Forty metabolites were detected in striatum (Online resource 4). No metabolites correlated to collection time for the combined cohort of TBI and control animals or for TBI animals alone. Adenine (r = 0.79; adjusted p = 0.016) and myoinositol (r = 0.75; adjusted p = 0.047) were positively correlated to collection time in the control group only (data not shown). Pairwise correlations-based analysis of striatal metabolites identified 15 pairs that generated z scores of ± 2.5 or greater. Based on the number of discrete comparisons, up to five would be expected by chance. NAA had the most and most robust changes in its relationship to other metabolites. In all cases, where the correlation between NAA and other metabolites were altered, the strength of the correlation increased in the TBI group (Fig. 4a, b; Table 1).
Fig. 4.
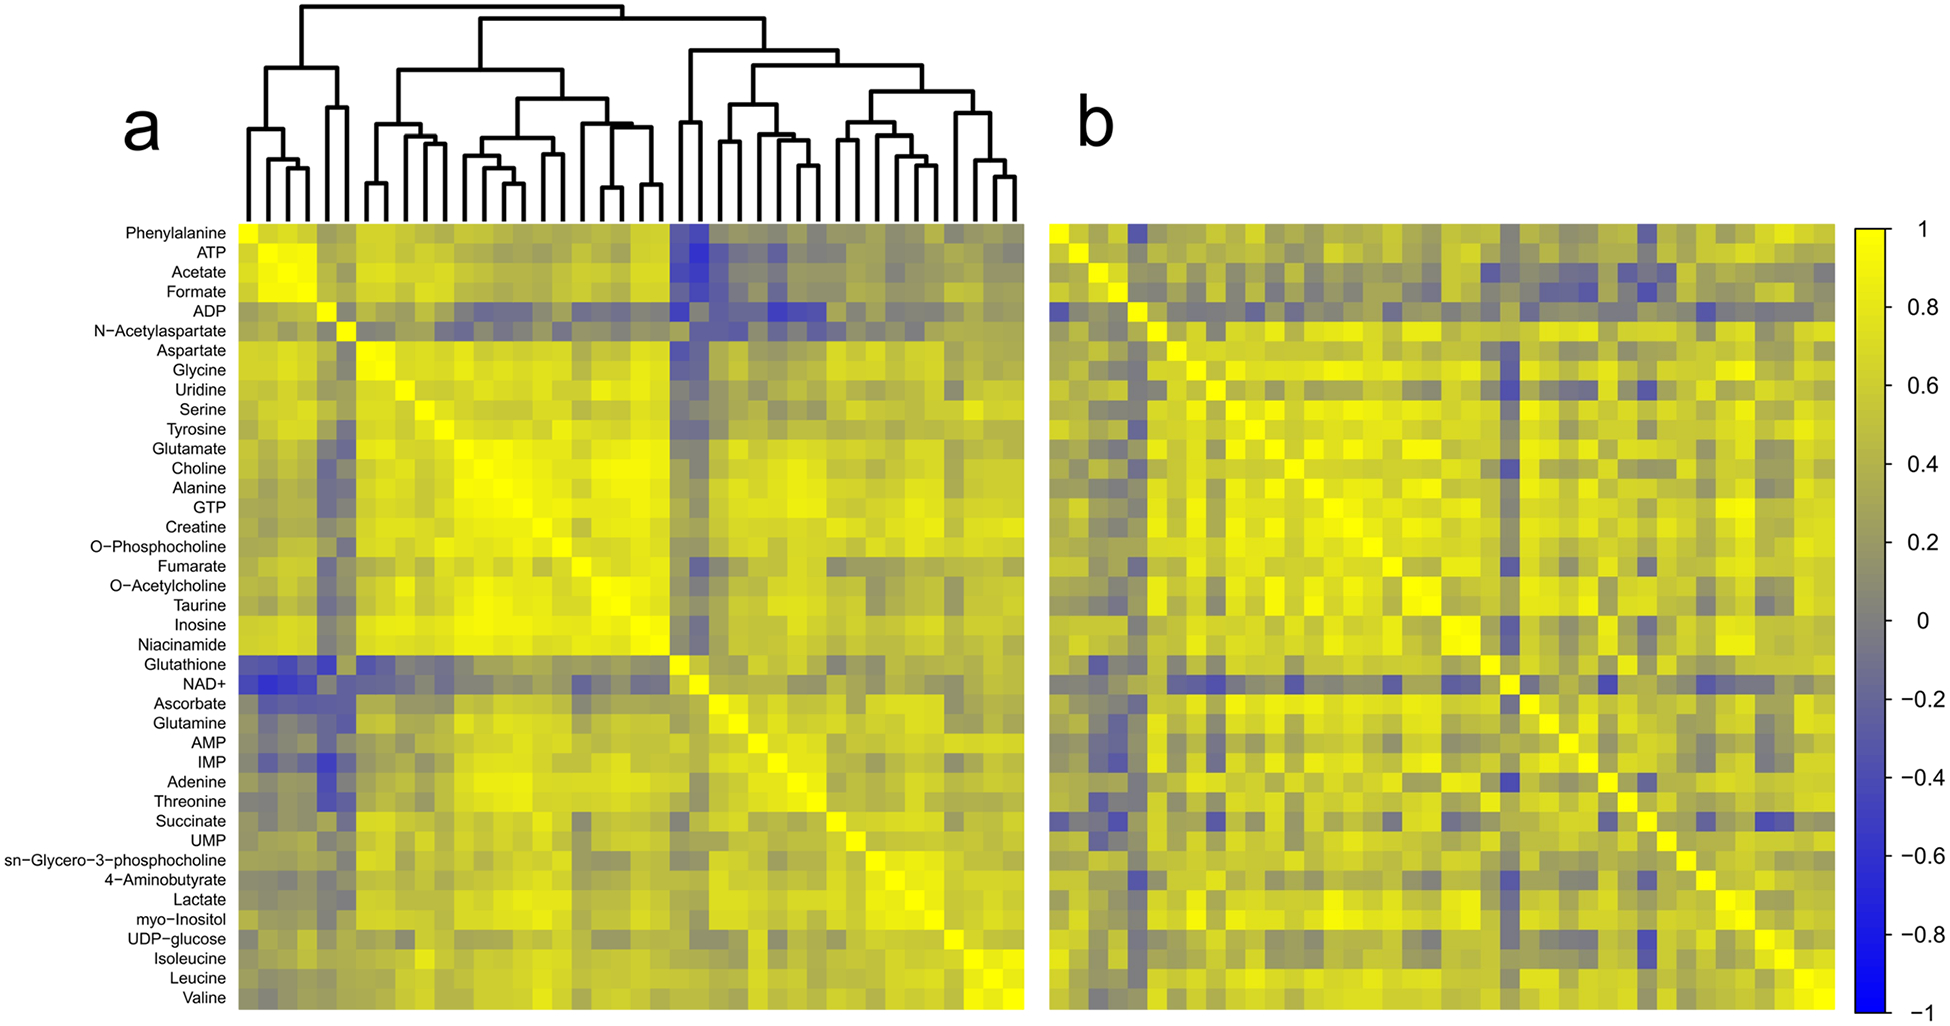
Correlation analysis of striatum. a Correlation matrix for control animals. b Correlation matrix for TBI animals. Metabolites are listed along the left side of the figure, and are in the same order across the top of each matrix. Each square of the matrix represents the Pearson correlation coefficient, r (indicated by the scale on the far right). A dendrogram representing the hierarchical clustering relationships between metabolites in the control condition is illustrated at the top of part (a); metabolites in part (b) follow the same order. Control n = 15; TBI n = 15
Table 1.
Metabolite pairs, control and TBI correlation coefficients, z scores ≥ 2.5
| Metabolite pair | r control | r TBI | z |
|---|---|---|---|
| Striatum | |||
| Glutamine/NAA | −0.266 | 0.786 | −3.267 |
| Glutamate/NAA | −0.144 | 0.821 | −3.195 |
| IMP/NAA | −0.161 | 0.811 | −3.167 |
| Serine/ascorbate | 0.186 | 0.900 | −3.144 |
| ATP/formate | 0.933 | 0.432 | 2.988 |
| Uridine/O-acetylcholine | 0.871 | 0.181 | 2.822 |
| Aspartate/glycine | 0.957 | 0.649 | 2.793 |
| Creatine/NAA | 0.204 | 0.871 | −2.771 |
| Taurine/NAA | 0.039 | 0.820 | −2.741 |
| GTP/NAA | 0.030 | 0.810 | −2.690 |
| Succinate/GABA | 0.700 | −0.217 | 2.666 |
| Acetate/ATP | 0.901 | 0.399 | 2.581 |
| Alanine/NAA | −0.067 | 0.755 | −2.574 |
| O-acetylcholine/NAA | 0.155 | 0.834 | −2.555 |
| Adenine/threonine | 0.868 | 0.282 | 2.532 |
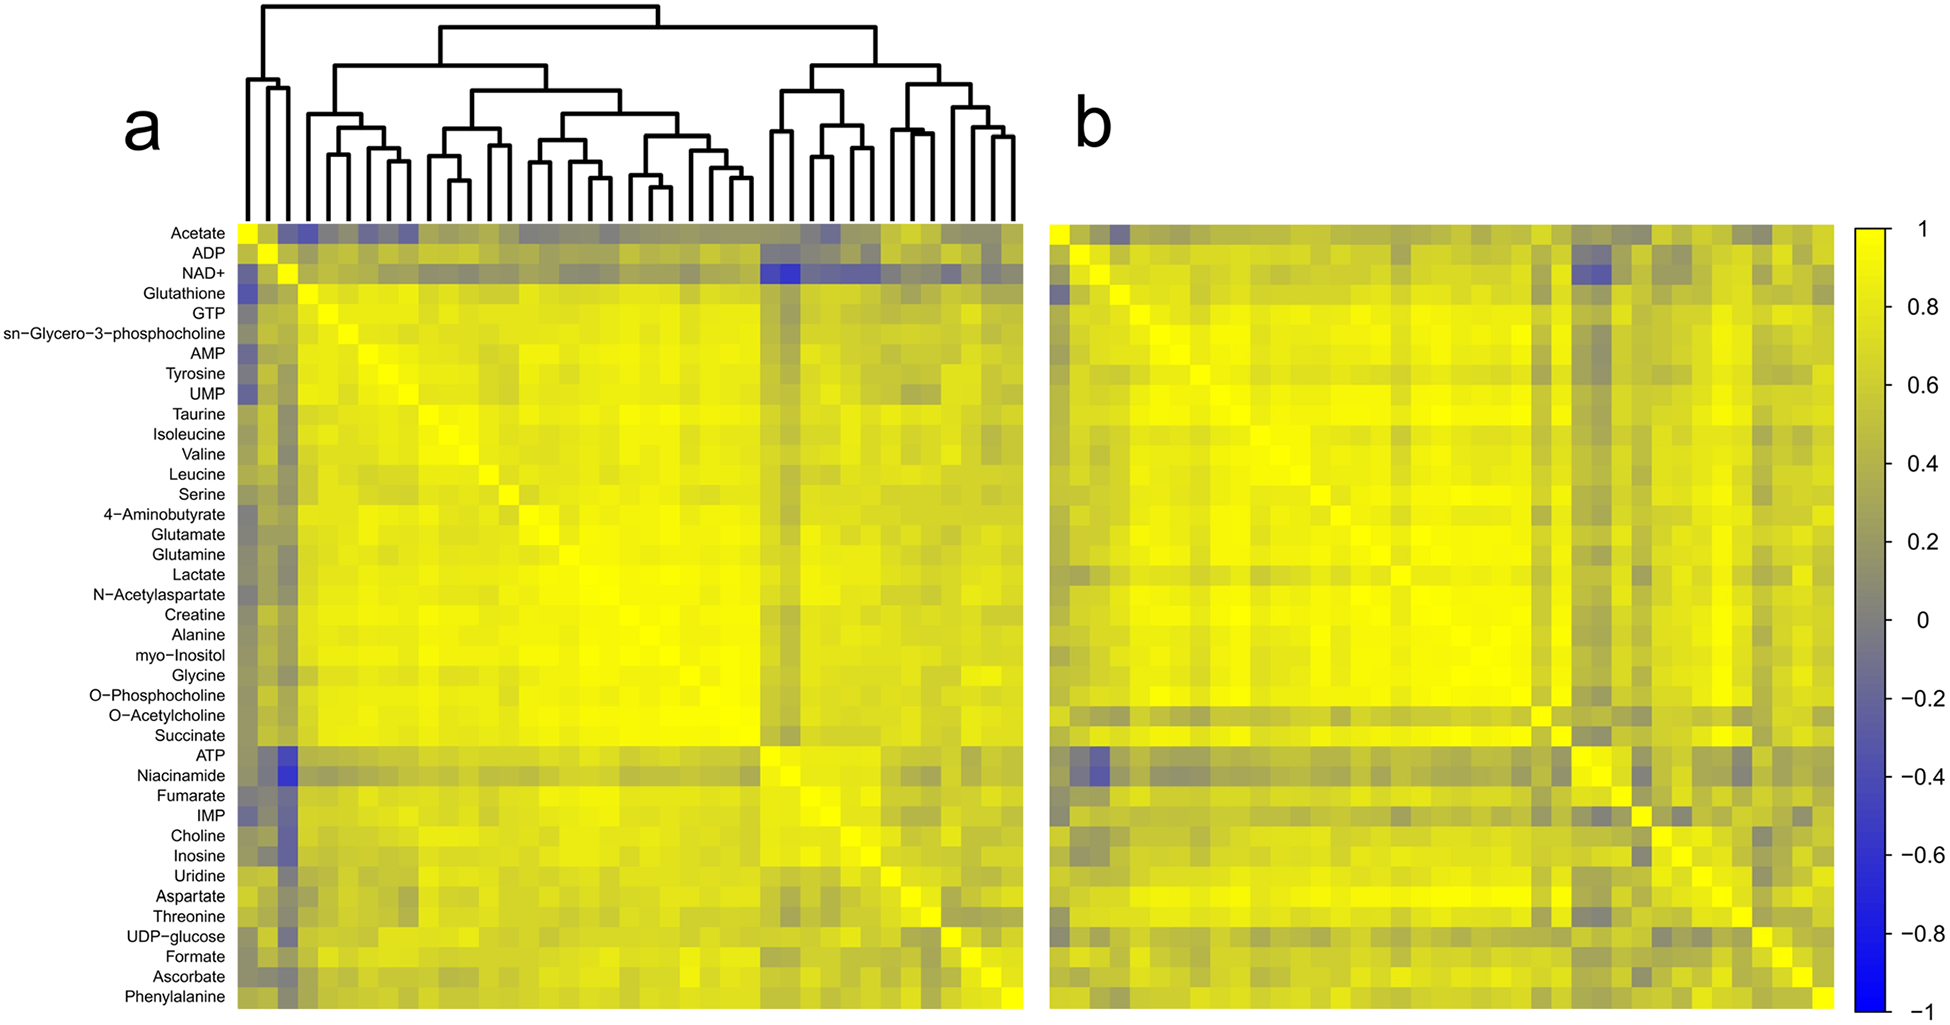
| Brainstem | |||
| Creatine/threonine | 0.986 | 0.723 | 3.802 |
| Valine/threonine | 0.968 | 0.476 | 3.795 |
| Taurine/threonine | 0.959 | 0.410 | 3.664 |
| Valine/myo-inositol | 0.984 | 0.724 | 3.628 |
| Threonine/alanine | 0.976 | 0.643 | 3.548 |
| Creatine/valine | 0.993 | 0.846 | 3.444 |
| Glucose/NADH | 0.822 | −0.219 | 3.396 |
| Glucose/GTP | 0.922 | 0.231 | 3.342 |
| Glucose/glutamine | 0.844 | −0.123 | 3.330 |
| ADP/adenine | 0.804 | −0.234 | 3.300 |
| Isobutyrate/NADP+ | 0.872 | 0.034 | 3.202 |
| Isoleucine/myo-inositol | 0.969 | 0.677 | 3.074 |
| 5–6-dihydrothymine/threonine | 0.967 | 0.675 | 3.011 |
| O-acetylcholine/adenine | 0.839 | −0.002 | 2.986 |
| Choline/threonine | 0.940 | 0.494 | 2.928 |
| Glutamine/isoleucine | 0.921 | 0.389 | 2.897 |
| UDP-glucose/NADP+ | 0.847 | 0.067 | 2.890 |
| Isoleucine/threonine | 0.936 | 0.490 | 2.863 |
| Glutamine/threonine | 0.943 | 0.540 | 2.844 |
| ADP/π-methylhistidine | 0.819 | 0.013 | 2.796 |
| Glutamine/valine | 0.936 | 0.513 | 2.792 |
| Glucose/NADP+ | 0.768 | −0.124 | 2.791 |
| Isoleucine/creatine | 0.974 | 0.786 | 2.723 |
| ADP/threonine | 0.765 | −0.099 | 2.714 |
| Uridine/threonine | 0.952 | 0.642 | 2.685 |
| Succinate/lactate | 0.450 | 0.917 | −2.665 |
| Sarcosine/threonine | 0.964 | 0.724 | 2.662 |
| IMP/NADH | 0.769 | −0.064 | 2.650 |
| O-acetylcholine/inosine | 0.821 | 0.079 | 2.649 |
| GABA/glutamate | 0.949 | 0.630 | 2.646 |
| ADP/GABA | 0.695 | −0.215 | 2.637 |
| ADP/inosine | 0.781 | −0.026 | 2.633 |
| Threonine/lactate | 0.972 | 0.781 | 2.627 |
| Valine/alanine | 0.986 | 0.886 | 2.624 |
| ADP/O-phosphocholine | 0.808 | 0.059 | 2.604 |
| Glucose/sn-glycero-3-phosphocholine | 0.852 | 0.198 | 2.603 |
| Valine/lactate | 0.973 | 0.796 | 2.599 |
| Glutathione/NADP+ | 0.854 | 0.215 | 2.577 |
| O-acetylcholine/threonine | 0.759 | −0.054 | 2.564 |
| Glycine/threonine | 0.959 | 0.713 | 2.563 |
| Glycine/myo-inositol | 0.990 | 0.922 | 2.553 |
| UDP-glucose/NADH | 0.685 | −0.192 | 2.533 |
| NADP+/isoleucine | 0.785 | 0.033 | 2.512 |
| UMP/NAA | 0.956 | 0.703 | 2.505 |
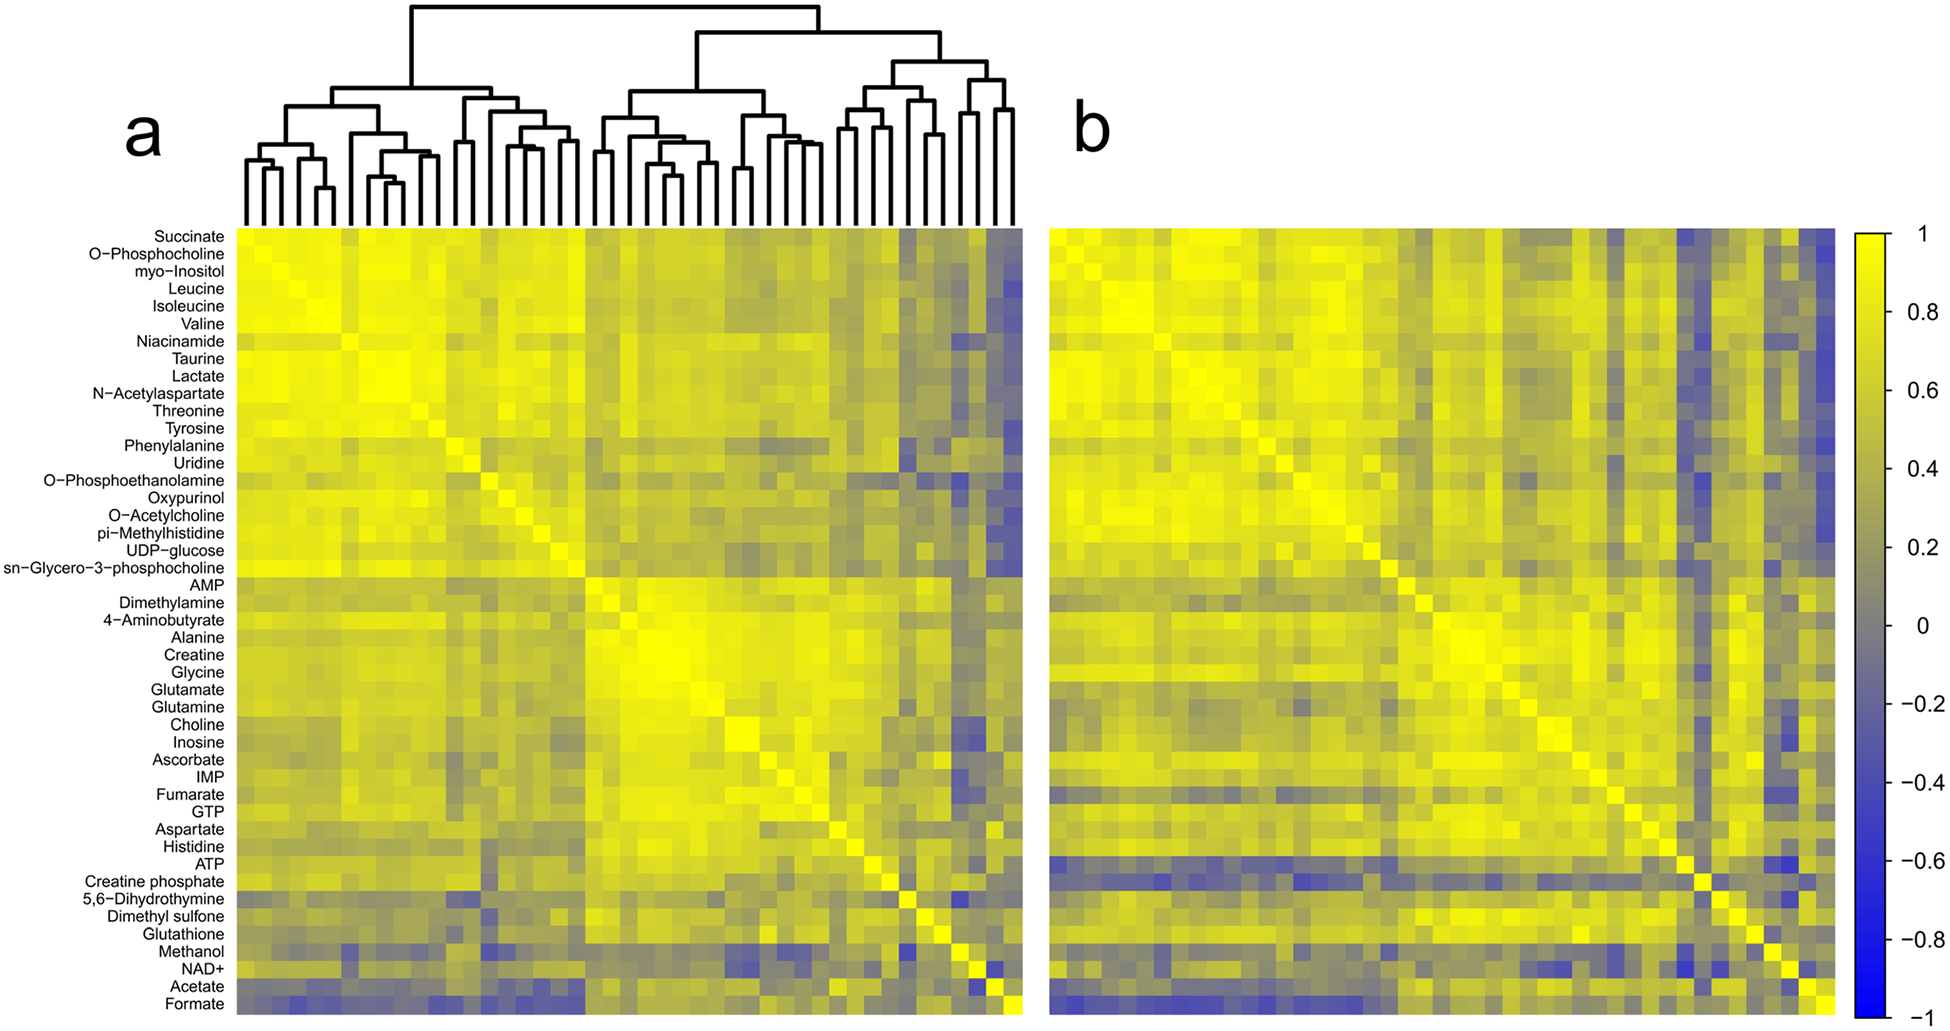
| Frontal cortex | |||
| O-acetylcholine/succinate | 0.977 | 0.523 | 4.050 |
| Fumarate/IMP | 0.928 | 0.250 | 3.401 |
| O-phosphocholine/O-acetylcholine | 0.962 | 0.564 | 3.278 |
| Alanine/aspartate | 0.719 | 0.977 | −3.214 |
| Myo-inositol/O-acetylcholine | 0.961 | 0.604 | 3.088 |
| O-acetylcholine/lactate | 0.947 | 0.525 | 2.976 |
| Glycine/O-acetylcholine | 0.964 | 0.675 | 2.901 |
| UMP/aspartate | 0.368 | 0.912 | −2.829 |
| Creatine/aspartate | 0.698 | 0.965 | −2.815 |
| IMP/niacinamide | 0.822 | 0.033 | 2.772 |
| O-phosphocholine/aspartate | 0.729 | 0.964 | −2.626 |
| IMP/lactate | 0.874 | 0.275 | 2.619 |
| Creatine/O-acetylcholine | 0.941 | 0.590 | 2.618 |
| IMP/ATP | 0.854 | 0.218 | 2.567 |
| GABA/O-acetylcholine | 0.903 | 0.426 | 2.531 |
| Thalamus | |||
| Aspartate/dimethyl sulfone | 0.246 | 0.854 | −2.501 |
| Hippocampus | |||
| AMP/glycine | 0.850 | 0.105 | 2.816 |
| Phenylalanine/glutathione | 0.054 | 0.819 | −2.693 |
| Methanol/dimethylamine | −0.041 | 0.785 | −2.690 |
| Histidine/UDP-glucose | −0.063 | 0.774 | −2.676 |
| Glycine/myo-inositol | 0.952 | 0.665 | 2.567 |
| AMP/myo-inositol | 0.923 | 0.517 | 2.538 |
ATP adenosine triphosphate, GABA 4-aminobutyrate, NAA N-acetylaspartate, GTP guanine triphosphate, IMP inosine monophosphate, ADP adenosine diphosphate, NADH nicotinamide adenine dinucleotide, NADP+ nicotinamide adenine dinucleotide phosphate, IMP inosine monophosphate, UMP uridine monophosphate, UDP-glucose uridine diphosphate glucose, AMP adenosine monophosphate
There were 48 detected metabolites in brainstem (Online resource 4). Metabolite concentrations did not correlate to collection times. Pairwise correlations-based analyses identified 44 metabolite pairs generating z scores ± 2.5 or greater (Fig. 5a, b; Table 1). Based on the number of discrete comparisons, up to seven z scores of equivalent or greater magnitude would be expected to occur by chance. Within these metabolite pairs, we found consistently weaker correlations in TBI between components of purine metabolism (adenosine diphosphate (ADP), inosine, creatine, and inosine monophosphate (IMP)) with other metabolites. Similar patterns of decreased correlation indicated altered regulation of carbohydrate and energy metabolism (glucose, uridine diphosphate glucose (UDP-glucose), ADP), and amino acid metabolism (threonine, valine, isoleucine, and glutamine). Notably, one metabolite pair, succinate and lactate, showed an increased interdependence in the brainstem chronic TBI samples.
Fig. 5.
Correlation analysis of brainstem. a Correlation matrix for control animals. b Correlation matrix for TBI animals. Metabolites are listed along the left side of the figure, and are in the same order across the top of each matrix. Each square of the matrix represents the Pearson correlation coefficient, r (indicated by the scale on the far right). A dendrogram representing the hierarchical clustering relationships between metabolites in the control condition is illustrated at the top of part (a); metabolites in part (b) follow the same order. Control n = 15; TBI n = 15
In frontal cortex, 39 polar metabolites were detected (Online resource 4). Of these, choline correlated to collection time in the TBI group only (r = 0.66; adjusted p = 0.012) (data not shown). However, there were no correlations to collection time in the control group, or in the experimental cohort as a whole. In the comparison between control and TBI frontal cortex, 15 metabolite pairs generated z scores ± 2.5 or greater. In this region, up to five z scores of equal or greater magnitude would be predicted by chance. Three patterns emerged in the correlations-based analyses of frontal cortex (Fig. 6a, b; Table 1). Tissue levels of IMP were more weakly correlated with adenosine triphosphate (ATP), the carbon substrates lactate and fumarate, and with niacinamide. Additionally, tissue levels of the transmitter O-acetylcholine were more weakly correlated with the neurotransmitters glutamate and GABA, and with energy substrates, such as creatine, lactate, and succinate. Finally, in frontal cortex, aspartate levels were more strongly correlated to amino acids serine, glycine, alanine, taurine, NAA, and glutamine.
Fig. 6.
Correlation analysis of frontal cortex. a Correlation matrix for control animals. b Correlation matrix for TBI animals. Metabolites are listed along the left side of the figure, and are in the same order across the top of each matrix. Each square of the matrix represents the Pearson correlation coefficient, r (indicated by the scale on the far right). A dendrogram representing the hierarchical clustering relationships between metabolites in the control condition is illustrated at the top of part (a); metabolites in part (b) follow the same order. Control n = 15; TBI n = 15
In thalamus, we identified one metabolite pair in which the correlation analysis produced a z score greater than ± 2.5 (Fig. 7a, b; Table 1). Based on the number of discrete comparisons, up to seven z scores of equal or greater magnitude are predicted to occur by chance. In hippocampus, six metabolite pairs generated z scores ± 2.5 or greater (Fig. 8a, b; Table 1); however, based on the number of comparisons, up to six z scores of that magnitude or greater are predicted to occur by chance.
Fig. 7.
Correlation analysis of thalamus. a Correlation matrix for control animals. b Correlation matrix for TBI animals. Metabolites are listed along the left side of the figure, and are in the same order across the top of each matrix. Each square of the matrix represents the Pearson correlation coefficient, r (indicated by the scale on the far right). A dendrogram representing the hierarchical clustering relationships between metabolites in the control condition is illustrated at the top of part (a); metabolites in part (b) follow the same order. Control n = 15; TBI n = 15
Fig. 8.
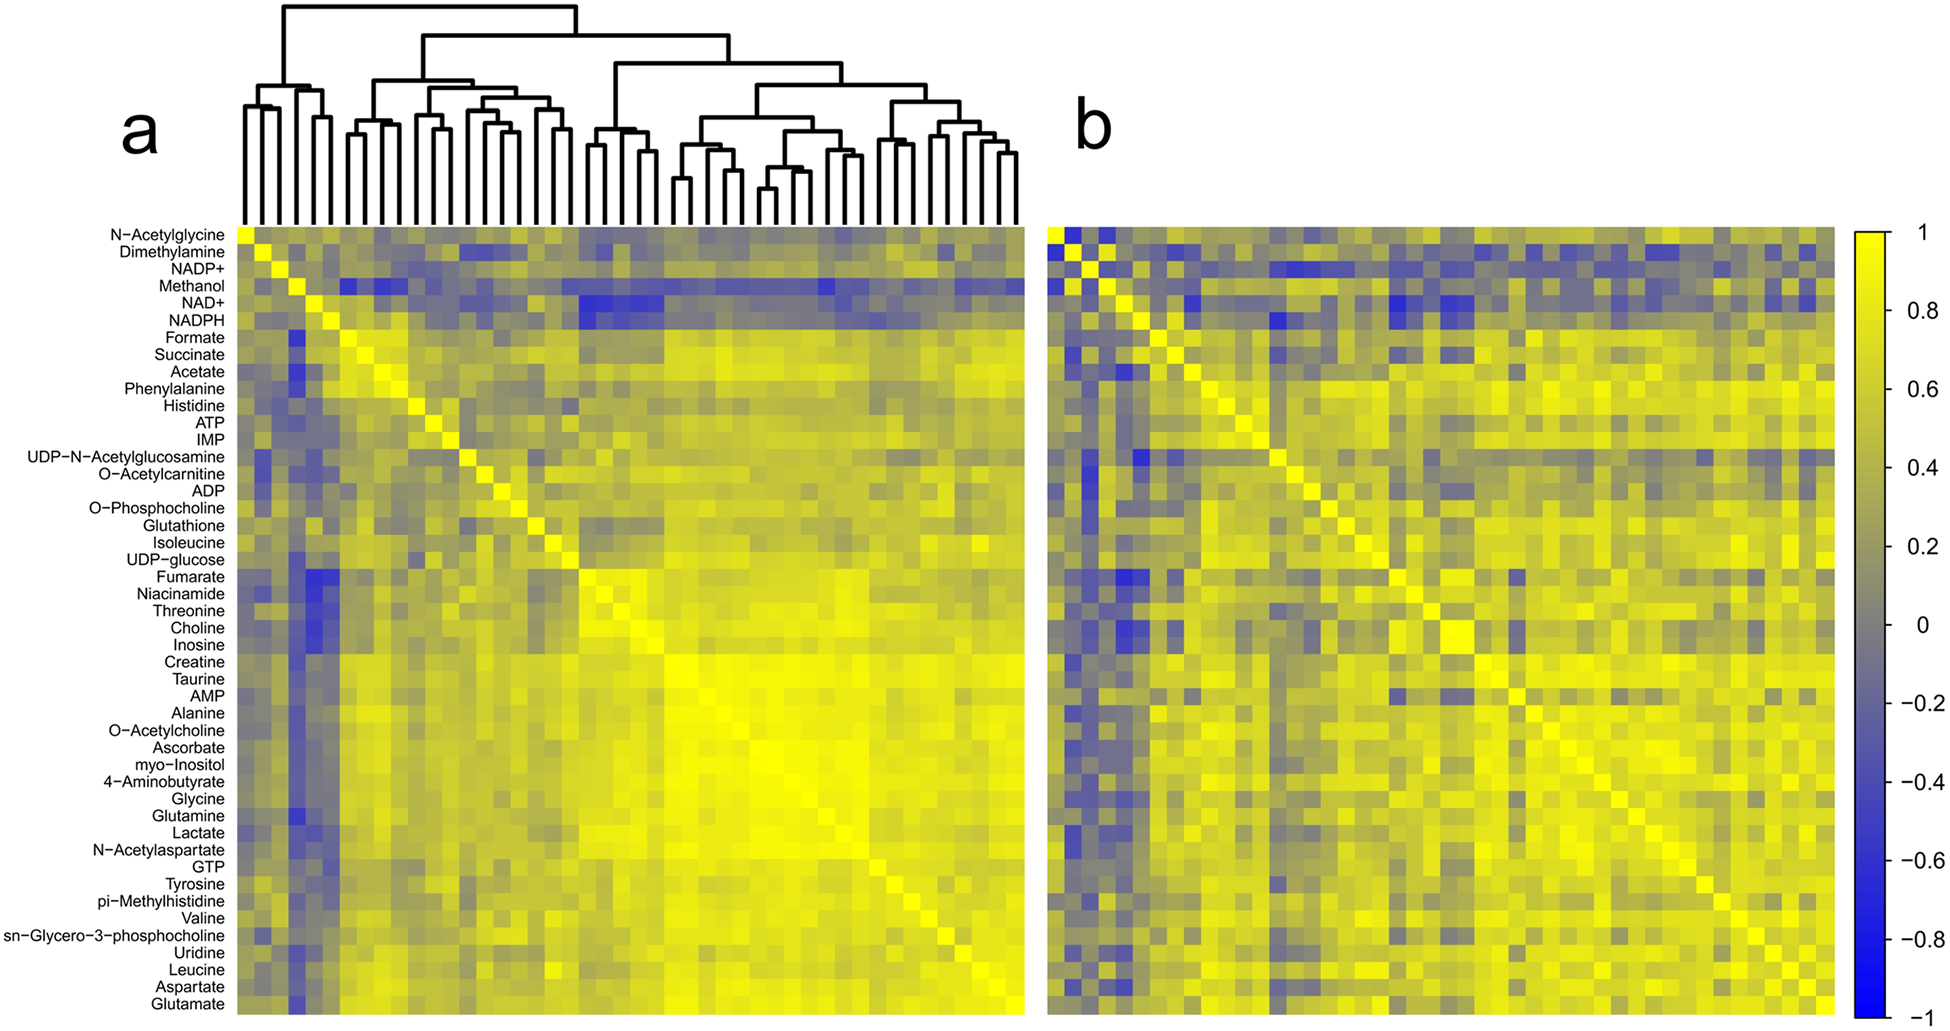
Correlation analysis of hippocampus. a Correlation matrix for control animals. b Correlation matrix for TBI animals. Metabolites are listed along the left side of the figure, and are in the same order across the top of each matrix. Each square of the matrix represents the Pearson correlation coefficient, r (indicated by the scale on the far right). A dendrogram representing the hierarchical clustering relationships between metabolites in the control condition is illustrated at the top of part (a); metabolites in part (b) follow the same order. Control n = 15; TBI n = 15
Discussion
Here, we examined resting brain metabolism in an experimental model of chronic injury. We found evidence of ongoing metabolic damage months after lateral fluid percussion in animals at rest. The effects of injury on brain metabolism were non-uniform. In thalamus and hippocampus, the regulatory structure was preserved at the expense of maintaining metabolite tissue concentrations. In the cortex, striatum, and brainstem, tissue metabolite concentrations were maintained, but there was evidence of reorganization in the underlying regulation and coordination of metabolic domains.
Altered Metabolite Concentrations in Hippocampus and Thalamus
Tissue concentrations of six metabolites were elevated in the hippocampus of TBI rats. Four of the metabolites increased in injured hippocampus (glutamine, glutamate, lactate, and creatine) are directly involved in energy balance and production [50, 51]. Potentially, these results reflect ongoing gliosis, a conclusion supported by the increase in myo-inositol, which is associated with astrocyte metabolism [52]. Additionally, four of the six metabolites also modulate excitatory transmission: glutamate, lactate, taurine, and glutamine [53–55]. Increases in glutamate, glutamine, and lactate suggest altered turnover of the neurotransmitter supply and availability of synaptic fuel for neurotransmission [56, 57] (which additionally helps calibrate neuronal excitability [58]). Additionally, both taurine and lactate act as modulators of long-term potentiation in the hippocampus [59–61]. Thalamic increases in glutamine but not glutamate suggest alterations in glutamate glutamine cycling, a key component of glutamate neurotransmission and synaptic energy supply [57, 62]. Notably, dysregulation of thalamic metabolism of glutamate-glutamine and creatine is implicated in seizure generation [63] and in migraines [64, 65] both of which are common sequelae of TBI.
Effects of Chronic Injury in Striatum
Correlations between the concentrations of metabolites in a biological sample help to describe the regulatory relationship between those molecules [36, 38]. Correlation differences between the control and chronic TBI matrices in striatum were primarily stronger correlations of NAA tissue concentration to other metabolites after TBI. Increased dependence of multiple other metabolites on NAA levels suggest that, at rest, the amount NAA being metabolized and turned over is much closer to the total supply of NAA in chronic TBI than in control. NAA is primarily localized in neurons, released during neural activity, and imported by oligodendrocytes and metabolized to acetate and aspartate [66]. NAA is a transportable source of acetyl-CoA and acetate, and maintains a pool of acetyl groups for protein acetylation [66, 67]. The weaker correlation of ATP and acetate in chronic TBI may reflect decreased significance or availability of acetate as an energy source, potentially due to re-prioritization of NAA-derived acetate to other pathways. Similarly, weaker correlation of succinate and GABA may reflect changes in GABA shunt activity and prioritization of succinate/GABA to other purposes. These altered relationships illustrate how metabolic networks may be reorganized after TBI.
Effects of Chronic Injury in Brainstem
In brainstem, the strength of correlations was decreased after TBI between multiple metabolites contributing to energy synthesis including glucose, UDP-glucose, ADP, branched chain amino acids, GTP, and NADH. The single exception to the pattern of diminished correlations after TBI in brainstem is an increased correlation of lactate with succinate. This suggests that lactate contributes more to the succinate pool after TBI than in the uninjured brain. The amino acid threonine showed the largest number differences in correlations with other metabolites between TBI and control. In every case, the correlations of threonine concentrations to those of other metabolites were weaker after TBI. One product of threonine catabolism is glycine and from there sarcosine, and creatine [68], and correlation of threonine levels to those of glycine, sarcosine, and creatine were all reduced after TBI. Interestingly, reduced correlations of threonine levels to those of creatine, alanine, glutamine, and lactate were mirrored by weaker correlations of valine concentrations to these same metabolites and of isoleucine concentrations to creatine and glutamine. The interactions of threonine, valine, alanine, glutamine, and lactate are particularly interesting given the roles of the lactate-alanine shuttle and branched chain amino acids in the shuttling of nitrogen between neurons and glia to help maintain nitrogen balance, sustain the glutamate-glutamine shuttle, and maintain the supplies of glutamate and GABA for neurotransmission [69].
Effects of Chronic Injury in Frontal Cortex
In the frontal cortex, consistent patterns of weaker correlation of O-acetylcholine and IMP with other metabolites, and of increased correlation of aspartate suggest critical nodes in the post-TBI metabolic network. IMP is primarily recognized as an intermediary in recycling of purine nucleosides [70]. However, IMP also helps regulate ATP levels through regulation of glucose bisphosphatase and disinhibition of hexokinase [71]. Weaker correlations with energy-related metabolites potentially reflect changes in IMP regulation of glycolysis [71]. Multiple diminished correlations of acetylcholine to other metabolites suggest molecules surrounding acetylcholine metabolism are also being routed away from some roles and functions to sustain others. Synthesis of acetylcholine depends on oxidative metabolism and several of the metabolites more weakly correlated with acetylcholine are substrates of oxidative energy metabolism and the TCA-cycle [72–74]. Additionally, the correlation between acetylcholine and the inhibitory transmitters GABA and glycine, both of which modulate acetylcholine release [75], is diminished in TBI. This may have direct consequences for cortical function, as co-release of transmitters, including GABA with acetylcho-line, helps fine-tune neural activity in cortex [76].
Stronger correlations of aspartate in the frontal cortex with multiple metabolites suggest that the availability of aspartate in some parts of the network may be restricted. A key role of aspartate is maintaining cellular redox balance via the malate-aspartate shuttle [77]. Inhibition of the aspartate-malate shuttle significantly impairs both oxidation of glucose and the rate of de novo acetylcholine synthesis in brain slices [78]. These data suggest that ongoing dysregulation of oxidative metabolism and glucose utilization in frontal cortex may be altering the availability of resources in other metabolic domains, such as neurotransmitter and amino acid synthesis.
Effects of Chronic Injury on Thalamus and Hippocampus
Although tissue concentrations of several metabolites in hippocampus and thalamus were higher in chronic TBI than control, the number of correlations between metabolite pairs in thalamus and hippocampus did not exceed what could be expected by chance. We interpret this to mean that relationships between metabolites, and by inference the regulatory structure governing those relationships, were preserved in these regions in chronic TBI. Maintaining network regulatory integrity may be paramount within these regions. Differences in specific metabolite concentrations in chronic TBI, as opposed to network changes, indicate that different brain regions have varying compensation methods for metabolic dysregulation or a different temporal course. Interestingly, regions that maintained regulatory structure at the expense of some tissue concentrations and regions that had more flexible regulatory structure but maintained tissue metabolite concentrations segregated between the hippocampal-thalamic circuit and the corticostriatal circuit. Further studies exploring the time course of changes in metabolic structure and regulation will help identify temporally dependent changes as healing continues and compensation strategies are engaged.
Brain Metabolism and Cognition
Our findings represent contributions of ongoing damage processes, but also compensation strategies to meet the demands of neurotransmission. This interpretation is supported by a recent study that ties brain activity to metabolic “cost” in neural activity [79]. Working under the assumption that the brain will work to optimize the balance between cost and transmission efficiency, Roy et al. determined that increased connectivity (hyper-connectivity) between brain regions that developed after TBI increased the physiological “cost” (calculated from connection number, strength, and distance) of transmission between those regions [79, 80]. Furthermore, although hyper-connectivity persisted, over time connectivity shifted to lower cost, shorter, and weaker connections, gradually reducing the overall cost of transmission [79]. Additionally, the cost metric calculated by Roy and colleagues negatively correlated to measures of processing speed and attention [79]. Under conditions of sustained activity, compensatory mechanisms preserved some aspects of performance (correct responses), but led to slower response times at higher physiological cost [23]. Thus, chronic metabolic damage may represent a mechanistic framework for symptoms of fatigue, slower processing speeds, and difficulties with concentration and attention commonly experienced after TBI [23]. Our results support altered metabolic regulation in chronic TBI in a resting state; thus, we predict that under cognitive load there will be further changes evident in metabolomics signatures.
Study Limitations
There are a number of limitations to the current study. Our data is generated from pieces of whole brain containing all cell types. By the current methods, we are unable to differentiate sources of metabolic dysregulation (i.e., glia vs. neurons); defects within an individual cell type, or in the transfer of molecules between cell types, may be masked by the accumulated signal [81]. This limitation of the current method indicates that other methods will be needed to more accurately define the nature of post-TBI metabolic lesions. Using 13C NMR after administration of 13C-labeled substrates, for example, may provide further detail about interactions between neuronal and glial metabolic compartments and flux of substrate through the metabolic network [82]. In addition, future studies will be needed to tease out the driving forces behind the changes in metabolism and metabolic regulation identified here.
Conclusions
In summary, we report evidence of altered resting brain metabolism in rats with chronic fluid percussion-induced TBI, using untargeted 1H NMR spectroscopy. Metabolic alteration is evident in altered metabolite levels in the hippocampus and thalamus, consistent with alterations in energy metabolism and excitatory neurotransmission. Furthermore, differential correlation analysis suggests metabolic consequences of injury are both persistent and widespread. Evidence of metabolic dysregulation was present in all brain regions investigated, but the patterns of changes evident in each brain region were regionally specific. These results indicate that there are persisting widespread alterations in resting metabolism throughout the brain after TBI.
Funding Information
These studies received financial support from Cincinnati Children’s Hospital Medical Center as a Shared Facilities Discovery Award to NKE and JLM.
Footnotes
Electronic supplementary material The online version of this article (https://doi.org/10.1007/s12035-018-1276-5) contains supplementary material, which is available to authorized users.
Conflict of Interest The authors declare that they have no conflict of interest.
References
- 1.Taylor CA et al. (2017) Traumatic brain injury–related emergency department visits, hospitalizations, and deaths — United States, 2007 and 2013. MMWR Surveill Summ 66(SS-9):1–16 [DOI] [PMC free article] [PubMed] [Google Scholar]
- 2.Faul M, Coronado V (2015) Chapter 1 - Epidemiology of traumatic brain injury In: Grafman J, Salazar AM (eds) Handbook of Clinical Neurology. Elsevier, New York, pp. 3–13 [DOI] [PubMed] [Google Scholar]
- 3.Finkelstein E, Corso PS, Miller TR (2006) The incidence and economic burden of injuries in the United States. Oxford University Press, Oxford: xiii, 187p [Google Scholar]
- 4.Whitnall L, McMillan T, Murray GD, Teasdale GM (2006) Disability in young people and adults after head injury: 5–7 year follow up of a prospective cohort study. J Neurol Neurosurg Psychiatry 77(5):640–645 [DOI] [PMC free article] [PubMed] [Google Scholar]
- 5.Zaloshnja E, Miller T, Langlois JA, Selassie AW (2008) Prevalence of long-term disability from traumatic brain injury in the civilian population of the United States, 2005. J Head Trauma Rehabil 23(6):394–400 [DOI] [PubMed] [Google Scholar]
- 6.Yoshino A, Hovda DA, Kawamata T, Katayama Y, Becker DP (1991) Dynamic changes in local cerebral glucose utilization following cerebral conclusion in rats: evidence of a hyper- and subsequent hypometabolic state. Brain Res 561(1):106–119 [DOI] [PubMed] [Google Scholar]
- 7.Faden AI et al. (1989) The role of excitatory amino acids and NMDA receptors in traumatic brain injury. Science 244(4906): 798–800 [DOI] [PubMed] [Google Scholar]
- 8.Barkhoudarian G, Hovda DA, Giza CC (2016) The molecular pathophysiology of concussive brain injury - an update. Phys Med Rehabil Clin N Am 27(2):373–393 [DOI] [PubMed] [Google Scholar]
- 9.Hovda DA (1996) Metabolic dysfunction In: Narayan RK, Wilberger JE, Povlishock JT (eds) Neurotrauma. McGraw-Hill, New York, pp. 1459–1478 [Google Scholar]
- 10.Garnett MR et al. (2000) Early proton magnetic resonance spectroscopy in normal-appearing brain correlates with outcome in patients following traumatic brain injury. Brain 123(Pt 10):2046–2054 [DOI] [PubMed] [Google Scholar]
- 11.Marino S et al. (2007) Acute metabolic brain changes following traumatic brain injury and their relevance to clinical severity and outcome. J Neurol Neurosurg Psychiatry 78(5):501–507 [DOI] [PMC free article] [PubMed] [Google Scholar]
- 12.Attwell D, Laughlin SB (2001) An energy budget for signaling in the grey matter of the brain. J Cereb Blood Flow Metab 21(10): 1133–1145 [DOI] [PubMed] [Google Scholar]
- 13.Shetty PK, Galeffi F, Turner DA (2012) Cellular links between neuronal activity and energy homeostasis. Front Pharmacol 3:43. [DOI] [PMC free article] [PubMed] [Google Scholar]
- 14.Sobieski C, Fitzpatrick MJ, Mennerick SJ (2017) Differential presynaptic ATP supply for basal and high-demand transmission. J Neurosci 37(7):1888–1899 [DOI] [PMC free article] [PubMed] [Google Scholar]
- 15.Stender J, Mortensen KN, Thibaut A, Darkner S, Laureys S, Gjedde A, Kupers R (2016) The minimal energetic requirement of sustained awareness after brain injury. Curr Biol 26(11):1494–1499 [DOI] [PubMed] [Google Scholar]
- 16.Patel AB, de Graaf RA, Mason GF, Kanamatsu T, Rothman DL, Shulman RG, Behar KL (2004) Glutamatergic neurotransmission and neuronal glucose oxidation are coupled during intense neuronal activation. J Cereb Blood Flow Metab 24(9):972–985 [DOI] [PubMed] [Google Scholar]
- 17.Ragan DK, McKinstry R, Benzinger T, Leonard JR, Pineda JA (2013) Alterations in cerebral oxygen metabolism after traumatic brain injury in children. J Cereb Blood Flow Metab 33(1):48–52 [DOI] [PMC free article] [PubMed] [Google Scholar]
- 18.Kato T, Nakayama N, Yasokawa Y, Okumura A, Shinoda J, Iwama T (2007) Statistical image analysis of cerebral glucose metabolism in patients with cognitive impairment following diffuse traumatic brain injury. J Neurotrauma 24(6):919–926 [DOI] [PubMed] [Google Scholar]
- 19.Ito K et al. (2016) Differences in brain metabolic impairment between chronic mild/moderate TBI patients with and without visible brain lesions based on MRI. Biomed Res Int 2016:3794029. [DOI] [PMC free article] [PubMed] [Google Scholar]
- 20.Fridman EA, Beattie BJ, Broft A, Laureys S, Schiff ND (2014) Regional cerebral metabolic patterns demonstrate the role of anterior forebrain mesocircuit dysfunction in the severely injured brain. Proc Natl Acad Sci USA 111(17):6473–6478 [DOI] [PMC free article] [PubMed] [Google Scholar]
- 21.Sibson NR, Dhankhar A, Mason GF, Rothman DL, Behar KL, Shulman RG (1998) Stoichiometric coupling of brain glucose metabolism and glutamatergic neuronal activity. Proc Natl Acad Sci 95(1):316–321 [DOI] [PMC free article] [PubMed] [Google Scholar]
- 22.Hall CN, Klein-Flugge MC, Howarth C, Attwell D (2012) Oxidative phosphorylation, not glycolysis, powers presynaptic and postsynaptic mechanisms underlying brain information processing. J Neurosci 32(26):8940–8951 [DOI] [PMC free article] [PubMed] [Google Scholar]
- 23.Kohl AD, Wylie GR, Genova HM, Hillary FG, DeLuca J (2009) The neural correlates of cognitive fatigue in traumatic brain injury using functional MRI. Brain Inj 23(5):420–432 [DOI] [PubMed] [Google Scholar]
- 24.Patti GJ, Yanes O, Siuzdak G (2012) Innovation: Metabolomics: the apogee of the omics trilogy. Nat Rev Mol Cell Biol 13(4):263–269 [DOI] [PMC free article] [PubMed] [Google Scholar]
- 25.Viant MR, Lyeth BG, Miller MG, Berman RF (2005) An NMR metabolomic investigation of early metabolic disturbances following traumatic brain injury in a mammalian model. NMR Biomed 18(8):507–516 [DOI] [PubMed] [Google Scholar]
- 26.Casey PA, McKenna MC, Fiskum G, Saraswati M, Robertson CL (2008) Early and sustained alterations in cerebral metabolism after traumatic brain injury in immature rats. J Neurotrauma 25(6):603–614 [DOI] [PMC free article] [PubMed] [Google Scholar]
- 27.Harris JL, Yeh HW, Choi IY, Lee P, Berman NE, Swerdlow RH, Craciunas SC, Brooks WM (2012) Altered neurochemical profile after traumatic brain injury: (1)H-MRS biomarkers of pathological mechanisms. J Cereb Blood Flow Metab 32(12):2122–2134 [DOI] [PMC free article] [PubMed] [Google Scholar]
- 28.Bartnik-Olson BL, Oyoyo U, Hovda DA, Sutton RL (2010) Astrocyte oxidative metabolism and metabolite trafficking after fluid percussion brain injury in adult rats. J Neurotrauma 27(12): 2191–2202 [DOI] [PMC free article] [PubMed] [Google Scholar]
- 29.Dunn WB, Broadhurst DI, Atherton HJ, Goodacre R, Griffin JL (2011) Systems level studies of mammalian metabolomes: the roles of mass spectrometry and nuclear magnetic resonance spectroscopy. Chem Soc Rev 40(1):387–426 [DOI] [PubMed] [Google Scholar]
- 30.Christensen CD, Hofmeyr J-HS, Rohwer JM (2015) Tracing regulatory routes in metabolism using generalised supply-demand analysis. BMC Syst Biol 9(1):89. [DOI] [PMC free article] [PubMed] [Google Scholar]
- 31.Morgenthal K, Weckwerth W, Steuer R (2006) Metabolomic networks in plants: transitions from pattern recognition to biological interpretation. Biosystems 83(2–3):108–117 [DOI] [PubMed] [Google Scholar]
- 32.Ishii N, Nakahigashi K, Baba T, Robert M, Soga T, Kanai A, Hirasawa T, Naba M et al. (2007) Multiple high-throughput analyses monitor the response of E. coli to perturbations. Science 316(5824):593–597 [DOI] [PubMed] [Google Scholar]
- 33.D’Haeseleer P, Liang S, Somogyi R (2000) Genetic network inference: from co-expression clustering to reverse engineering. Bioinformatics 16(8):707–726 [DOI] [PubMed] [Google Scholar]
- 34.Steuer R (2006) Review: on the analysis and interpretation of correlations in metabolomic data. Brief Bioinform 7(2):151–158 [DOI] [PubMed] [Google Scholar]
- 35.Steuer R, Kurths J, Fiehn O, Weckwerth W (2003) Observing and interpreting correlations in metabolomic networks. Bioinformatics 19(8):1019–1026 [DOI] [PubMed] [Google Scholar]
- 36.Camacho D, De La Fuente A, Mendes P (2005) The origin of correlations in metabolomics data. Metabolomics 1(1):53–63 [Google Scholar]
- 37.Weckwerth W (2003) Metabolomics in systems biology. Annu Rev Plant Biol 54:669–689 [DOI] [PubMed] [Google Scholar]
- 38.Kose F, Weckwerth W, Linke T, Fiehn O (2001) Visualizing plant metabolomic correlation networks using clique-metabolite matrices. Bioinformatics 17(12):1198–1208 [DOI] [PubMed] [Google Scholar]
- 39.Jaeger C, Glaab E, Michelucci A, Binz TM, Koeglsberger S, Garcia P, Trezzi JP, Ghelfi J et al. (2015) The mouse brain metabolome. Am J Pathol 185(6):1699–1712 [DOI] [PubMed] [Google Scholar]
- 40.Dorsett CR, McGuire JL, Niedzielko TL, DePasquale EAK, Meller J, Floyd CL, McCullumsmith RE (2017) Traumatic brain injury induces alterations in cortical glutamate uptake without a reduction in glutamate transporter-1 protein expression. J Neurotrauma 34(1): 220–234 [DOI] [PMC free article] [PubMed] [Google Scholar]
- 41.Mayeux J, Katz P, Edwards S, Middleton JW, Molina PE (2017) Inhibition of endocannabinoid degradation improves outcomes from mild traumatic brain injury: a mechanistic role for synaptic hyperexcitability. J Neurotrauma 34(2):436–443 [DOI] [PMC free article] [PubMed] [Google Scholar]
- 42.Wu H, Southam AD, Hines A, Viant MR (2008) High-throughput tissue extraction protocol for NMR- and MS-based metabolomics. Anal Biochem 372(2):204–212 [DOI] [PubMed] [Google Scholar]
- 43.Watanabe M, Meyer KA, Jackson TM, Schock TB, Johnson WE, Bearden DW (2015) Application of NMR-based metabolomics for environmental assessment in the Great Lakes using zebra mussel (Dreissena polymorpha). Metabolomics 11(5):1302–1315 [DOI] [PMC free article] [PubMed] [Google Scholar]
- 44.Wishart DS et al. (2013) HMDB 3.0–the human metabolome database in 2013. Nucleic Acids Res 41(Database issue):D801–D807 [DOI] [PMC free article] [PubMed] [Google Scholar]
- 45.Wishart DS, Knox C, Guo AC, Eisner R, Young N, Gautam B, Hau DD, Psychogios N et al. (2009) HMDB: a knowledgebase for the human metabolome. Nucleic Acids Res 37(Database issue):D603–D610 [DOI] [PMC free article] [PubMed] [Google Scholar]
- 46.Parsons HM, Ekman DR, Collette TW, Viant MR (2009) Spectral relative standard deviation: a practical benchmark in metabolomics. Analyst 134(3):478–485 [DOI] [PubMed] [Google Scholar]
- 47.Wei T, Simko V (2017) R package “corrplot”: visualization of a correlation matrix (version 0.84). Available from https://github.com/yaiyun/corrplot
- 48.Ward JH Jr (1963) Hierarchical grouping to optimize an objective function. J Am Stat Assoc 58(301):236–244 [Google Scholar]
- 49.Fukushima A (2013) DiffCorr: an R package to analyze and visualize differential correlations in biological networks. Gene 518(1): 209–214 [DOI] [PubMed] [Google Scholar]
- 50.Pellerin L, Magistretti PJ (1994) Glutamate uptake into astrocytes stimulates aerobic glycolysis: a mechanism coupling neuronal activity to glucose utilization. Proc Natl Acad Sci USA 91(22): 10625–10629 [DOI] [PMC free article] [PubMed] [Google Scholar]
- 51.Joncquel-Chevalier Curt M, Voicu PM, Fontaine M, Dessein AF, Porchet N, Mention-Mulliez K, Dobbelaere D, Soto-Ares G et al. (2015) Creatine biosynthesis and transport in health and disease. Biochimie 119:146–165 [DOI] [PubMed] [Google Scholar]
- 52.Mader I, Rauer S, Gall P, Klose U (2008) (1)H MR spectroscopy of inflammation, infection and ischemia of the brain. Eur J Radiol 67(2):250–257 [DOI] [PubMed] [Google Scholar]
- 53.Schurr A, Miller JJ, Payne RS, Rigor BM (1999) An increase in lactate output by brain tissue serves to meet the energy needs of glutamate-activated neurons. J Neurosci 19(1):34–39 [DOI] [PMC free article] [PubMed] [Google Scholar]
- 54.Palmada M, Centelles JJ (1998) Excitatory amino acid neurotransmission. Pathways for metabolism, storage and reuptake of glutamate in brain. Front Biosci 3:d701–d718 [DOI] [PubMed] [Google Scholar]
- 55.El Idrissi A, Trenkner E (2004) Taurine as a modulator of excitatory and inhibitory neurotransmission. Neurochem Res 29(1):189–197 [DOI] [PubMed] [Google Scholar]
- 56.Sonnay S, Duarte JMN, Just N, Gruetter R (2016) Compartmentalised energy metabolism supporting glutamatergic neurotransmission in response to increased activity in the rat cerebral cortex: a 13C MRS study in vivo at 14.1 T. J Cereb Blood Flow Metab 36(5):928–940 [DOI] [PMC free article] [PubMed] [Google Scholar]
- 57.Hertz L, Chen Y (2017) Integration between glycolysis and glutamate-glutamine cycle flux may explain preferential glycolytic increase during brain activation, requiring glutamate. Front Integr Neurosci 11:18. [DOI] [PMC free article] [PubMed] [Google Scholar]
- 58.Katsu-Jimenez Y, Alves RMP, Gimenez-Cassina A (2017) Food for thought: impact of metabolism on neuronal excitability. Exp Cell Res 360(1):41–46 [DOI] [PubMed] [Google Scholar]
- 59.Suarez LM et al. (2014) Cooperation of taurine uptake and dopa-mine D1 receptor activation facilitates the induction of protein synthesis-dependent late LTP. Neuropharmacology 79:101–111 [DOI] [PubMed] [Google Scholar]
- 60.del Olmo N, Suarez LM, Orensanz LM, Suarez F, Bustamante J, Duarte JM, del Rio RM, Solis JM (2004) Role of taurine uptake on the induction of long-term synaptic potentiation. Eur J Neurosci 19(7):1875–1886 [DOI] [PubMed] [Google Scholar]
- 61.Suzuki A, Stern SA, Bozdagi O, Huntley GW, Walker RH, Magistretti PJ, Alberini CM (2011) Astrocyte-neuron lactate transport is required for long-term memory formation. Cell 144(5):810–823 [DOI] [PMC free article] [PubMed] [Google Scholar]
- 62.Tani H, Dulla CG, Farzampour Z, Taylor-Weiner A, Huguenard JR, Reimer RJ (2014) A local glutamate-glutamine cycle sustains synaptic excitatory transmitter release. Neuron 81(4):888–900 [DOI] [PMC free article] [PubMed] [Google Scholar]
- 63.Bryant AS, Li B, Beenhakker MP, Huguenard JR (2009) Maintenance of thalamic epileptiform activity depends on the astrocytic glutamate-glutamine cycle. J Neurophysiol 102(5):2880–2888 [DOI] [PMC free article] [PubMed] [Google Scholar]
- 64.Ma Z, Wang SJ, Li CF, Ma XX, Gu T (2008) Increased metabolite concentration in migraine rat model by proton MR spectroscopy in vivo and ex vivo. Neurol Sci 29(5):337–342 [DOI] [PubMed] [Google Scholar]
- 65.Gu T, Ma XX, Xu YH, Xiu JJ, Li CF (2008) Metabolite concentration ratios in thalami of patients with migraine and trigeminal neuralgia measured with 1H-MRS. Neurol Res 30(3):229–233 [DOI] [PubMed] [Google Scholar]
- 66.Moffett JR et al. (2007) N-Acetylaspartate in the CNS: from neurodiagnostics to neurobiology. Prog Neurobiol 81(2):89–131 [DOI] [PMC free article] [PubMed] [Google Scholar]
- 67.Moffett JR et al. (2013) N-Acetylaspartate reductions in brain injury: impact on post-injury neuroenergetics, lipid synthesis, and protein acetylation. Front Neuroenerg 5:11. [DOI] [PMC free article] [PubMed] [Google Scholar]
- 68.Ballevre O, Buchan V, Rees WD, Fuller MF, Garlick PJ (1991) Sarcosine kinetics in pigs by infusion of [1–14C]sarcosine: use for refining estimates of glycine and threonine kinetics. Am J Physiol Endocrinol Metab 260(4):E662–E668 [DOI] [PubMed] [Google Scholar]
- 69.Somersalo E, Calvetti D (2013) Quantitative in silico analysis of neurotransmitter pathways under steady state conditions. Front Endocrinol 4:137. [DOI] [PMC free article] [PubMed] [Google Scholar]
- 70.Ipata PL, Balestri F, Camici M, Tozzi MG (2011) Molecular mechanisms of nucleoside recycling in the brain. Int J Biochem Cell Biol 43(1):140–145 [DOI] [PubMed] [Google Scholar]
- 71.Guha SK, Rose ZB (1982) Brain glucose bisphosphatase requires inosine monophosphate. J Biol Chem 257(12):6634–6637 [PubMed] [Google Scholar]
- 72.von Schwarzenfeld I, Fischer HD, Oelszner W (1975) Interaction between cellular metabolism and acetylcholine turnover of rat brain cortex slices in the presence of arecoline. Acta Biol Med Ger 34(9): 1525–1528 [PubMed] [Google Scholar]
- 73.Ksiezak HJ, Gibson GE (1981) Acetylcholine synthesis and CO2 production from variously labeled glucose in rat brain slices and synaptosomes. J Neurochem 37(1):88–94 [DOI] [PubMed] [Google Scholar]
- 74.Dolezal V, Tucek S (1981) Utilization of citrate, acetylcarnitine, acetate, pyruvate and glucose for the synthesis of acetylcholine in rat brain slices. J Neurochem 36(4):1323–1330 [DOI] [PubMed] [Google Scholar]
- 75.Beani L, Bianchi C, Siniscalchi A, Tanganelli S (1983) Glycine-induced changes in acetylcholine release from guinea-pig brain slices. Br J Pharmacol 79(2):623–628 [DOI] [PMC free article] [PubMed] [Google Scholar]
- 76.Granger AJ, Wallace ML, Sabatini BL (2017) Multi-transmitter neurons in the mammalian central nervous system. Curr Opin Neurobiol 45:85–91 [DOI] [PMC free article] [PubMed] [Google Scholar]
- 77.McKenna MC, Waagepetersen HS, Schousboe A, Sonnewald U (2006) Neuronal and astrocytic shuttle mechanisms for cytosolicmitochondrial transfer of reducing equivalents: current evidence and pharmacological tools. Biochem Pharmacol 71(4):399–407 [DOI] [PubMed] [Google Scholar]
- 78.Cheeseman AJ, Clark JB (1988) Influence of the malate-aspartate shuttle on oxidative metabolism in synaptosomes. J Neurochem 50(5):1559–1565 [DOI] [PubMed] [Google Scholar]
- 79.Roy A, Bernier RA, Wang J, Benson M, French JJ, Good DC, Hillary FG (2017) The evolution of cost-efficiency in neural networks during recovery from traumatic brain injury. PLoS One 12(4):e0170541. [DOI] [PMC free article] [PubMed] [Google Scholar]
- 80.Aiello GL, Bach-y-Rita P (2000) The cost of an action potential. J Neurosci Methods 103(2):145–149 [DOI] [PubMed] [Google Scholar]
- 81.Rothman DL, de Feyter HM, Graaf RA, Mason GF, Behar KL (2011) 13C MRS studies of neuroenergetics and neurotransmitter cycling in humans. NMR Biomed 24(8):943–957 [DOI] [PMC free article] [PubMed] [Google Scholar]
- 82.Bartnik-Olson BL et al. (2013) Insights into the metabolic response to traumatic brain injury as revealed by (13)C NMR spectroscopy. Front Neuroenerg 5:8. [DOI] [PMC free article] [PubMed] [Google Scholar]