Abstract
Direct targeting of the downstream MAPK pathway to suppress ERK activation in KRAS and BRAF mutant colorectal cancer (CRC) has proven clinically unsuccessful, but promising results have been obtained with combination therapies including EGFR-inhibition. To elucidate the interplay between EGF signaling and ERK activation in tumors, we used patient-derived organoids (PDOs) from KRAS and BRAF mutant CRCs. PDOs resemble in vivo tumors, model treatment response and are compatible with live-cell microscopy. We established real-time, quantitative drug response assessment in PDOs with single-cell resolution, using our improved FRET-based ERK biosensor EKAREN5. We reveal that oncogene-driven signaling is strikingly limited without EGFR activity and insufficient to sustain full proliferative potential. In PDOs and in vivo, upstream EGFR activity rigorously amplifies signal transduction efficiency in KRAS or BRAF mutant MAPK pathways. Our data provide a mechanistic understanding of the effectivity of EGFR inhibitors within combination therapies against KRAS and BRAF mutant CRC.
Keywords: Colorectal cancer, patient-derived organoids, FRET biosensors, cell-to-cell heterogeneity, ERK oscillations, oncogenic signaling, pan-HER inhibition, EGFR
Introduction
The MAPK pathway is among the most frequently deregulated signaling cascades in colorectal cancer, but effective therapeutic strategies to target KRAS- or BRAF-mutant CRC tumors have proven to be problematic1,2. Although oncogenic driver mutations prompt the constitutive activation of KRAS3 and BRAF4, most promising clinical results encompass inhibition of the MAPK pathway in combination with the upstream epidermal growth factor receptor (EGFR)5–9. The counter-intuitive necessity to include upstream EGFR inhibition is often explained by the side effect of MAPK pathway inhibition, i.e. the relief of ERK-induced negative feedback, resulting in hyperactivated EGF receptors10–12. Conceptually, however, it is not entirely understood why downstream MAPK inhibition is incapable of intercepting these intensified EGFR signals. Furthermore, it raises the question to what extent mutant KRAS and BRAF activate downstream ERK in a fully autonomous fashion. Indeed, the notion that mutant KRAS acts fully independently of upstream signals has been challenged by genetic mouse models for lung and pancreatic cancer, where elimination of EGFR prohibited growth of KRAS-mutant tumors13–15.
ERK signaling responses in 2D cell lines display a remarkable degree of cell-to-cell variability16, such that time course measurements at the population level overlook the dimension of cellular heterogeneity. Conversely, ‘snapshot’ approaches that collect single-cell data at fixed time points fail to capture dynamic behavior, while ERK signaling is oscillatory in nature16–19. Monitoring single-cell ERK dynamics responding to pharmacological regimens in tumor tissue would greatly improve our understanding of responses to targeted therapies, for instance by differentiating between scenarios of incomplete pathway suppression, cell-to-cell heterogeneities in drug response or subsequent ERK re-activation. However, ERK activity dynamics have not been studied with single-cell resolution in patient-derived tumor tissue.
Patient-derived organoids (PDOs) are robust 3D in vitro models that retain the histopathological features of in vivo tumors, including patient-specific drug responses20–22. Their scalability and reliability are of interest for the purpose of pre-clinical drug screenings, personalized medicine and drug development20–25. In particular, PDOs share the clinical relevance of PDX models and constitute the most representative in vitro proxies of human tumors that are compatible with live-cell imaging of immediate cellular drug responses26.
To understand the role of EGF signaling in KRAS and BRAF-mutant CRC, we aimed to monitor ERK activities in CRC organoids using a genetically encoded ERK biosensor. Although Kinase Translocation Reporters (KTRs) are popular single-channel sensors27, the compact, cell-dense architecture of PDOs argues against their use. Foremost, robust quantification of nuclear shuttling is hampered by minimal cytoplasmic volumes in PDOs. In contrast, the FRET-based EKAREV biosensor28 facilitates cell-specific readout in compact tissue thanks to its nuclear localization. EKAREV exploits the phosphorylation-dependent interaction between a CDC25C-derived sensor domain and a Pin1-derived ligand domain, thus translating ERK activity into FRET changes. Since the sensor domain is also subject to specialized phosphatases, EKAREV eventually reports the kinase-phosphatase equilibrium as sensed by downstream targets of ERK, and it is exactly this equilibrium that orchestrates cellular responses. Moreover, transgenic mice indicate that EKAREV is compatible with cellular health29.
Here, we applied FRET-imaging in compact 3D PDOs to understand clinical drug responses. We re-engineered the EKAREV FRET-sensor for ERK, generating so-called EKAREN5 (5 ENhancements). Most prominently, we resolved its undesired sensitivity to CDK1/cyclinB, increased its FRET range and broadened detection range. Next, we established unbiased quantification of single-cell ERK activities over time. In CRC PDOs, we employed EKAREN5 to reveal ERK dynamics with single-cell precision and monitored their responses to targeted inhibition of EGFR and/or downstream nodes in the MAPK pathway.
Our work uncovers the critical importance of EGFR activity as an amplifier of intrinsically weak oncogenic KRAS and BRAF signaling to promote cellular proliferation.
Results
EKAREV modifications improve donor fluorophore, biosensor transgenesis and ERK specificity
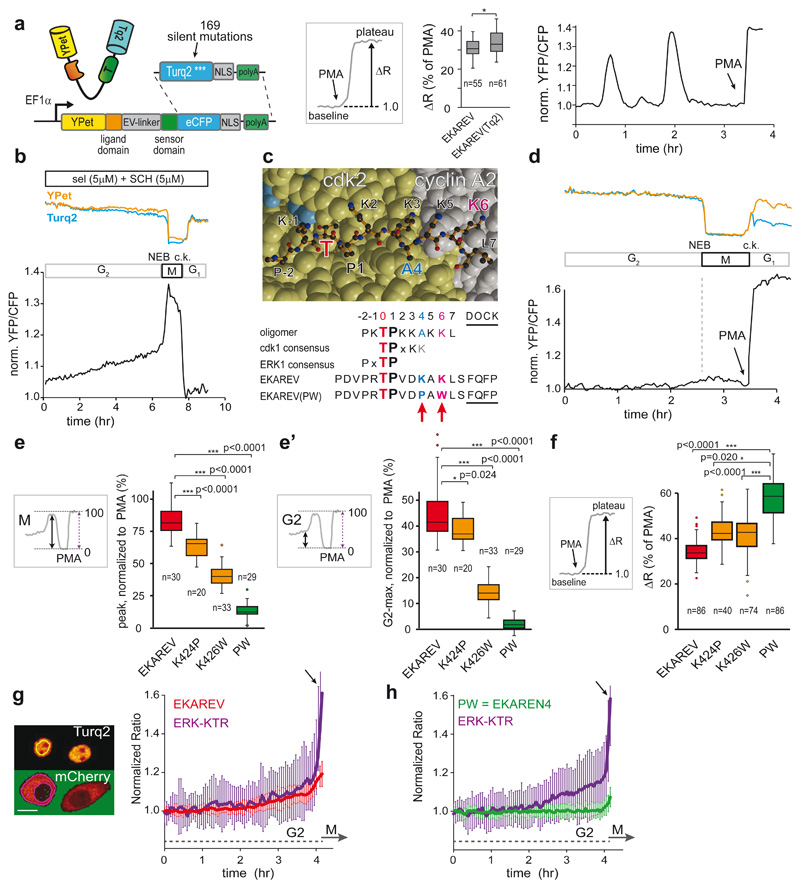
To serve long-term applications in 3D PDOs, we first set out to replace eCFP of EKAREV28 with the superior eCFP-variant Turquoise2 (Tq2)30, bearing 169 silent mutations (Extended Data Fig. 4a) to minimize sequence homology31. As in EKAREV, we designed Tq2 to contain the dimerization-prone mutation K206A and we introduced V224L32 to enhance affinity for YPet further. The resultant EKAREV(Tq) robustly registered ERK hyperactivation in HEK293 cells upon stimulation with Phorbol-12-Myristate-13-acetate (PMA), which activates RAF through PKC33, and dynamically monitored spontaneous fluctuations in HeLa cells16,17, establishing unaffected reversibility of the sensor (Fig. 1a).
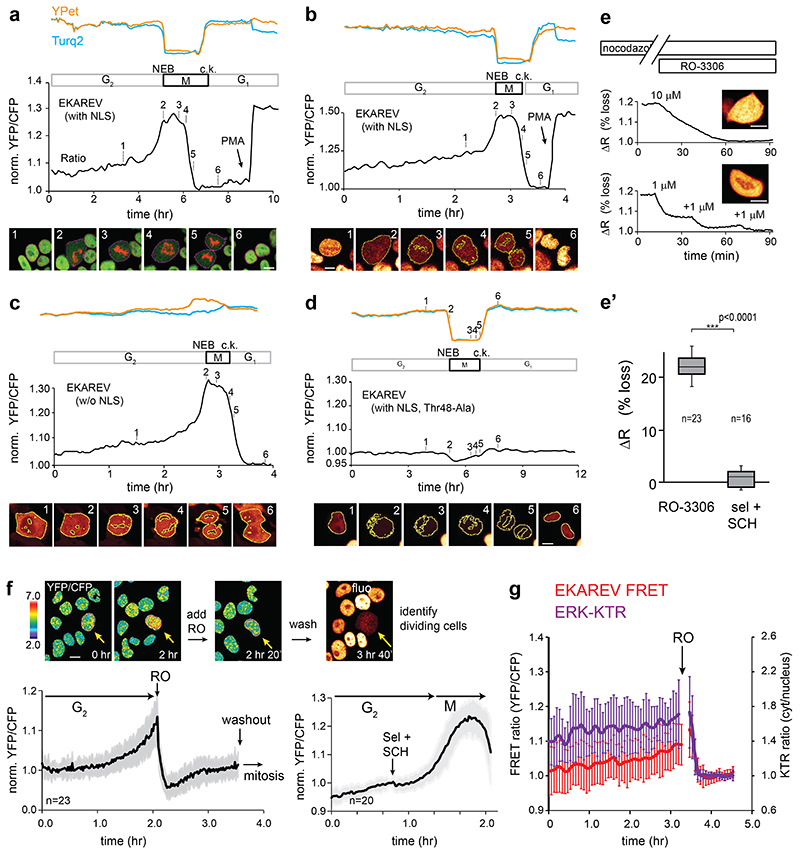
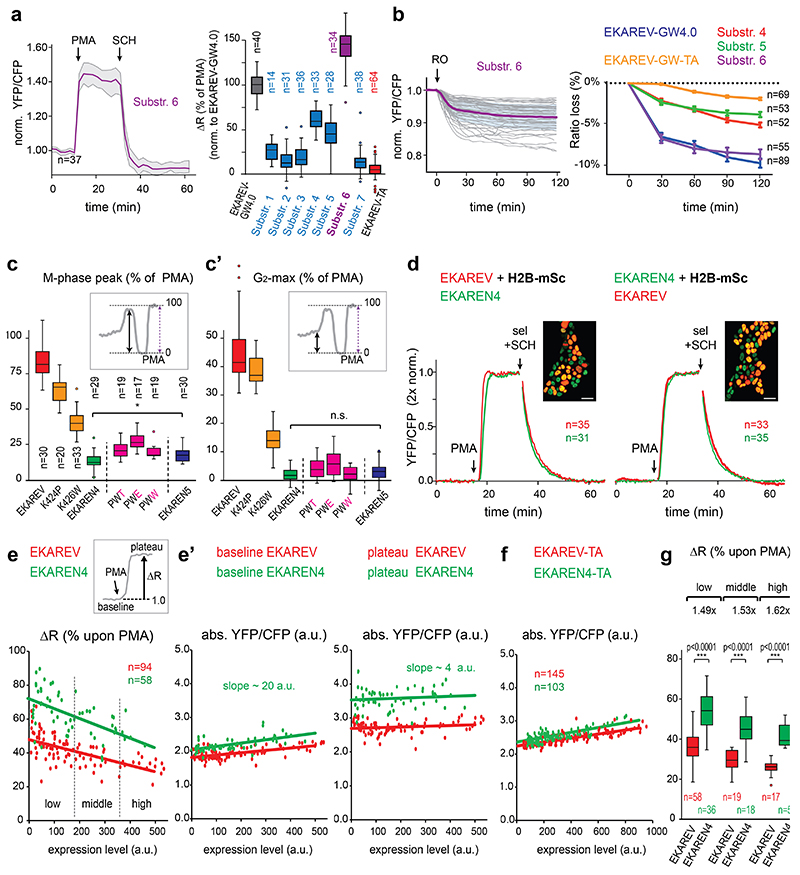
Fig. 1. Minimizing cell cycle-dependent influences on EKAREV(Tq)-FRET.
a, Insertion of Turquoise2 cDNA, including 169 silent mutations (Extended Data Fig. 4a), into EKAREV. FRET range of serum-starved HEK293 cells expressing parental EKAREV (n=55 cells) versus EKAREV(Tq) (n=61), approximated by PMA-induced sensor saturation (ΔR,%)), remained unaffected. 2 independent experiments. Right, EKAREV(Tq) reports spontaneous fluctuations in HeLa cells.
b, Typical mitotic EKAREV profile in HEK293 cells persists under selumetinib (MEKi) and SCH772984 (ERKi) (both 5μM). Blue and yellow traces, Turq2 and YPet fluorescence intensities. Black, ratio YPet/Turq2. Loss of fluorescence indicates Nuclear Envelope Breakdown (NEB). c.k., cytokinesis.
c, Top, crystal structure of CDK2•cyclinA2 complex. CDK2 (yellow) and cyclinA2 (grey), shown as space-filling model and substrate peptide PKTPKKAKKL (orange) in ball-and-stick representation. The structure contains the transition state mimic ADP•AlF3 resembling ATP (blue). Below, sequence comparison of substrate oligomer from the CDK2•cylcinA2 complex, CDK1 and ERK1 consensus, EKAREV sequence and the PW-mutations. Red, threonine for phosphorylation. Blue, mutated Lysine (EKAREV(K424)). Purple, mutated Lysine that interacts with cyclinA2 (EKAREV(K426)). Underlined, ERK-docking site.
d, Representative trace of EKAREV(PW) during G2 and M-phase in HEK293.
e, Quantification of M-phase peaks and e’, maximum FRET signal in late G2, measured in HEK293 cells stably expressing EKAREV or point mutant derivatives. Insets: values were normalized to PMA-induced sensor saturation. p-values calculated from denoted cell numbers (n). 3 independent experiments.
f, Assessing maximal FRET range (ΔR, %) of parental EKAREV(Tq), and mutant derivatives expressed at ‘medium’ levels. p-values calculated from denoted cell numbers (n).
g, Ratiometric traces for FRET and KTR output of monoclonal HeLa cells co-expressing EKAREV(Tq) and ERK-KTR-mCherry biosensors (n=25 cells). Traces were synchronized on mitotic entry and depicted as mean ratio±s.d. Y-axis ratios: FRET (YPF/CFP) and KTR (cytosol/nucleus). Arrow, mitotic entry. Scale bar, 10μm.
h, As in g, but HeLa cells co-expressing EKAREN4 and ERK-KTR-mCherry. p-values calculated from n=26 cells. Shown is mean±s.d.
Two-sided student’s T-tests: *, p<0.05; **, p<0.001; ***, p<0.0005. n.s., non-significant.
For all figures with box-and-whisker plots: boxes represent quartile 2 and 3, horizontal line represents median, whiskers represent minimum and maximum within 1,5x interquartile range. Dots are outliers.
Second, EKAREV28 may suffer undesired responsiveness to CDK1/cyclinB17, as its ERK substrate sequence from CDC25C also serves as a consensus site for CDK134,35. Indeed, HEK293 cells stably expressing EKAREV(Tq) revealed ratio changes during mitosis, amounting to ~80-85% relative to PMA-induced saturation (Extended Data Fig. 1a-c, Supplementary Movie 1), even in the presence of MEK-inhibitor selumetinib and ERK-inhibitor SCH772984 (sel+SCH, both 5μM) (Fig. 1b). Conversely, the CDK1-inhibitor RO-3363 induced substantial FRET loss in cells that were in M-phase or G2-phase (Extended Data Fig. 1e,f).
To resolve this undesired CDK1-sensitivity of EKAREV, we initially replaced its CDC25C-derived substrate sequence with alternative ERK substrate domains, anticipating these may be refractory to CDK1 (Extended Data Fig. 4b). While three of the seven tested substrates resulted in functional ERK biosensors, all variants retained undesired sensitivity to CDK1 (Extended Data Fig. 2a,b). Of note, also ERK-KTR, which comprises an ELK1-derived sensor core, shows gradual signal increase during G2 in HeLa cells (Fig. 1g). As for EKAREV(Tq), this rising slope predominantly reflects CDK1 activity (Extended Data Fig. 1g).
Next, we switched to targeting CDK1-sensitivity by re-engineering the CDC25C-derived substrate sequence in EKAREV(Tq). This sequence displays high homology to a substrate peptide used in crystallographic studies of the CDK2•cyclinA complex36. In this complex, the lysine at position+6 is deeply engaged in the interaction with cyclinA (Fig. 1c). This is specific for CDKs as no cyclins are bound to ERK. To disrupt this interaction and disfavor phosphorylation by CDKs, we replaced this lysine with a bulky tryptophan (K426W). Furthermore, the lysine at position+4 was replaced by a proline (K424P), given that CDK1 favors basic residues C-terminal to the threonine37, while ERK favors hydrophobic residues including prolines (www.phosphosite.org).
HEK293 cells stably expressing single-mutant EKAREV(Tq) variants revealed diminished levels of FRET during G2- and M-phase relative to PMA-induced saturation (Fig. 1e). Especially their combination substantially reduced the M-phase peak (from 80% to 11% of PMA-induced levels) and almost completely eliminated the rising slope during G2-phase (from 45% to 2%) (Fig. 1d,e’). Only RO-3306, and not sel+SCH, could further suppress EKAREV(PW) FRET in M-phase cells, indicating that its responsiveness to CDK1 during M-phase is strongly reduced, but not fully eliminated. Attempts to further reduce CDK1 responsiveness with a third mutation (Extended Data Fig 4c) were ineffective (Extended Data Fig. 2c). We will refer to EKAREV(PW) as EKAREN4. Finally, HeLa cells co-expressing ERK-KTR and EKAREN4 unambiguously illustrate that EKAREN4 is devoid of CDK1-sensitivity during G2 (Fig. 1h), eliminating all false-positive signals in morphologically indistinguishable G2-cells.
EKAREN4 displays enhanced FRET range
While the response kinetics of ERK activation (PMA) and subsequent inactivation (sel+SCH) were unaffected in EKAREN4 (Extended Data Fig. 2d), we noticed a beneficial ~1.5-fold enhanced ratio change upon saturating ERK activation (Fig. 1f). At extreme expression levels, the use of dimerization-prone fluorophores potentially creates a negative effect on FRET range by elevating baseline ratios, due to intermolecular FRET (Extended Data Fig. 2e,e’,f and Supplementary Discussion)38. Importantly, we verified that sensor kinetics remained unaffected despite >30-fold differences in expression levels (Extended Data Fig. 3d). Thus, to secure comparability within and across datasets, we measure FRET at standardized expression levels, preferably in the ‘medium’ range (Extended Data Fig. 2g).
EKAREN5: the optimal FRET biosensor for measuring dynamic ERK activities
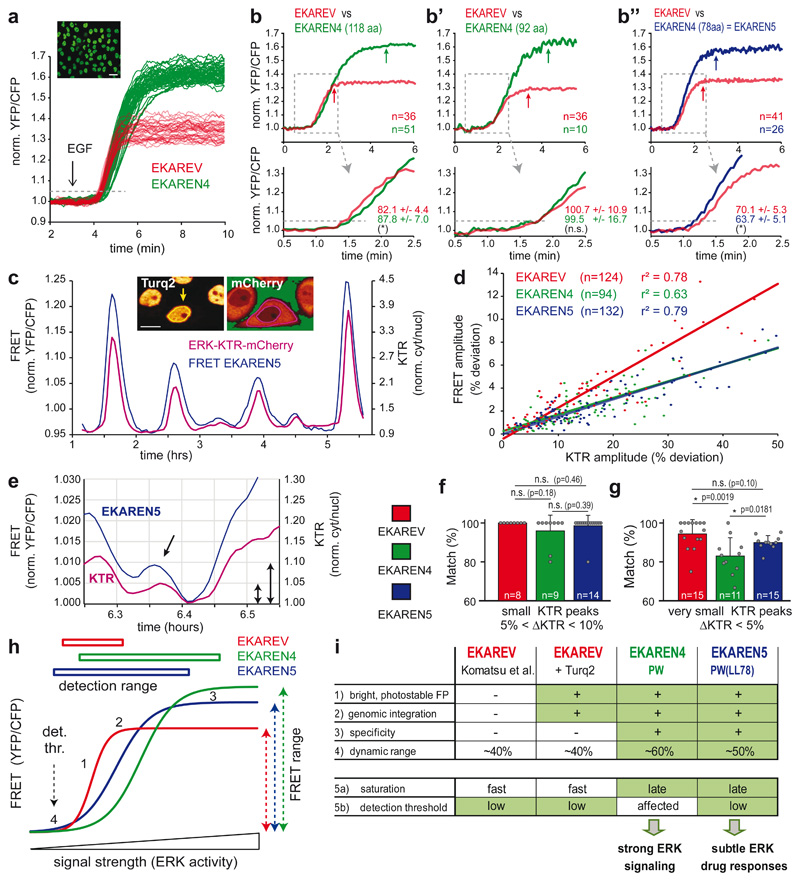
Detection range is defined as the window of activities that are dynamically and truthfully reported, from the lower detection limit (detection threshold) to the upper detection limit (saturation). Since we aim for detailed examination of drug-induced ERK suppression in CRC PDOs, low detection threshold is key. As a proxy for detection threshold, we determined the onset of EGF-responses in serum-starved HeLa cells. To exclude variabilities in culture conditions or timing of stimulation, we co-cultured clonal HeLa-EKAREV(Tq) and HeLa-EKAREN4 cells and unmixed single-cell analyses in retrospect, based on FRET amplitude (Fig. 2a). Compared to EKAREV(Tq), EKAREN4 showed ~5.5 seconds delay in the time needed to exceed 5% ratio change (Fig. 2b), suggesting increased detection threshold. Meanwhile, the saturation plateau was strongly delayed, indicating an extended detection range towards high ERK activities.
Fig. 2. Comparative analyses of EKAREV, EKAREN4 and EKAREN5.
a, EGF responses of >100 co-seeded (1:1), serum-starved monoclonal HeLa cells expressing EKAREV or EKAREN4 (<2 sec intervals). Clustered response amplitudes of EKAREV and EKAREN4 allowed post-analysis unmixing. Dashed line: 5% threshold as proxy for response onset time. Scale bar, 25μm. Experiment performed twice with identical results.
b, As a, comparing response onset of parental EKAREV (red) versus (green) EKAREN4 linker length variants (number of amino acids denoted). Shown are averages of multiple single-cell analyses (n represents cells, denoted in graph) and zoomed-in rising phases. Response times in corresponding colors: time to exceed 5% ratio change (dashed line). Experiments b and b” were performed twice. n represents cells, denoted in graph.
c, Fluctuations in HeLa cell are simultaneously detected by EKAREN5 and ERK-KTR-mCherry. Representative example from n>100. Inset: clonal HeLa cell expressing nuclear FRET sensor and KTR biosensor. Scale bar, 10μm.
d, Scatter plot represents ERK fluctuations in low-density HeLa cells by their amplitudes in FRET and KTR signals. r2-values from linear regression analyses. n represents analyzed peaks, denoted in graph.
e, Example of small fluctuation in KTR signal (purple), mirrored by EKAREN5 (blue) in high-density HeLa cell. Arrows, 5% KTR change; 0.5% FRET change.
f, Matching scores (mean ratio ± s.d.) for co-detection of ‘small’ fluctuations (defined as 5-10% KTR-ratio changes) with FRET biosensors, scrutinized from single-cell recordings (18hr). p-values calculated from n single-cell traces : EKAREV, 67 events/n=8 traces; EKAREN4, 75 events/n=9 traces; EKAREN5, 116 events/n=14 traces.
g, As f. Co-detecting ‘very small’ fluctuations (defined as 0-5% KTR-ratio changes), scrutinized from same recordings. p-values calculated from n single-cell traces : EKAREV, 197 events/n=15 traces; EKAREN4, 195 events/n=11 traces; EKAREN5, 549 events/n=15 traces.
f,g, Two-sided student’s T-test: *, p<0.05. n.s., non-significant.
h, 1) EKAREV shows steepest relationship (ERK activity versus FRET), with 2) fastest sensor saturation. 3) EKAREN4 shows latest sensor saturation towards high ERK. 4) EKAREN5 shows lowest detection threshold with optimal detection range. EKAREN4/5 have enhanced dynamic FRET ranges.
i, Overview of biosensor characteristics. EKAREN5 is the sensor-of-choice, in particular at low (e.g. drug-inhibited) ERK dynamics.
Detection threshold and saturation limit can be modulated by varying the linker length between sensor domain and ligand domain28. To correct the altered threshold of EKAREN4, we deleted 26 or 40 residues from the original linker (118 residues), generating linker length (LL) variants EKAREN4(LL92) and EKAREN4(LL78). Indeed, linker shortening resulted in faster onset times (Fig. 2b’, 2b”), reflecting lowered detection thresholds. Linker shortening also lowered the upper detection limit. Still, EKAREN4(LL78) outperformed the parental EKAREV(Tq) at both extremes of the detection range. Furthermore, this variant, to which we will refer as EKAREN5, still displayed the beneficial characteristics previously documented for EKAREN4, i.e. 1) minimized ratio change during G2 and mitosis (Extended Data Fig. 2c), 2) enlarged FRET range (Extended Data Fig. 3a,b) and 3) unaltered dephosphorylation kinetics (Extended Data Fig. 3c).
We generated three clonal HeLa lines combining either EKAREV(Tq), EKAREN4 or EKAREN5 with ERK-KTR-mCherry, the latter serving as unbiased reference sensor to identify, quantify and subsequently cross-compare their detection of small physiological ERK activity fluctuations39–41 (Supplementary Movie 2), known to spontaneously occur in HeLa cells16,17. Generally, the relationship between KTR- and FRET-deviations remained proportional over a wide range of amplitudes (Fig. 2c,d), with EKAREV(Tq) displaying the steepest relationship.
‘Small’ ERK fluctuations (KTR ratio changes between 5% and 10%) were reliably detected by all three FRET sensor variants (Fig. 2e,f). However, ‘very small’ fluctuations (KTR changes <5%) were most accurately detected by EKAREV(Tq) and EKAREN5 (Fig. 2g), in agreement with the assessed detection thresholds (Fig. 2b). These outcomes were validated by various automated analyses on these double-sensor datasets (Extended Data Fig. 3e-h). Finally, we validated EKAREN5 performance by pairing FRET acquisition with conventional pERK immunostainings, showing a strong correlation at the single-cell level (r2: 0,87) (Extended Data Fig. 3i).
In conclusion, the name ‘EKAREN’ pays tribute to the parental variants EKAR42 and EKAREV28. EKAREN5 (5x ENhanced) is the sensor-of-choice for general applications, in particular for detecting low (e.g. drug-inhibited) ERK levels, while EKAREN4 suits studies on high ERK activities (Fig. 2h,i; see Supplementary Discussion for elaborate discussion on biosensor characteristics).
Establishing quantitative single-cell readout of ERK dynamics in CRC PDOs using EKAREN5
PDOs recapitulate histopathological features of in vivo tumors and are compatible with live-cell microscopy, creating unique opportunities for the live readout of signaling activities at the cellular level. To examine the effects of targeted therapies against EGFR and/or the downstream MAPK pathway in KRAS- and BRAF-mutant CRCs, we stably introduced EKAREN5 into PDOs harboring oncogenic MAPK pathways, i.e. PDO-KRASG12C, PDO-KRASG12V, PDO-KRASG12D, PDO-NRASQ61H, PDO-BRAFV600E(#1-4) as well as PDOs without mutations in the MAPK pathway, i.e. PDO-WT(#1) and PDO-WT(#2) (Supplementary Table 1).
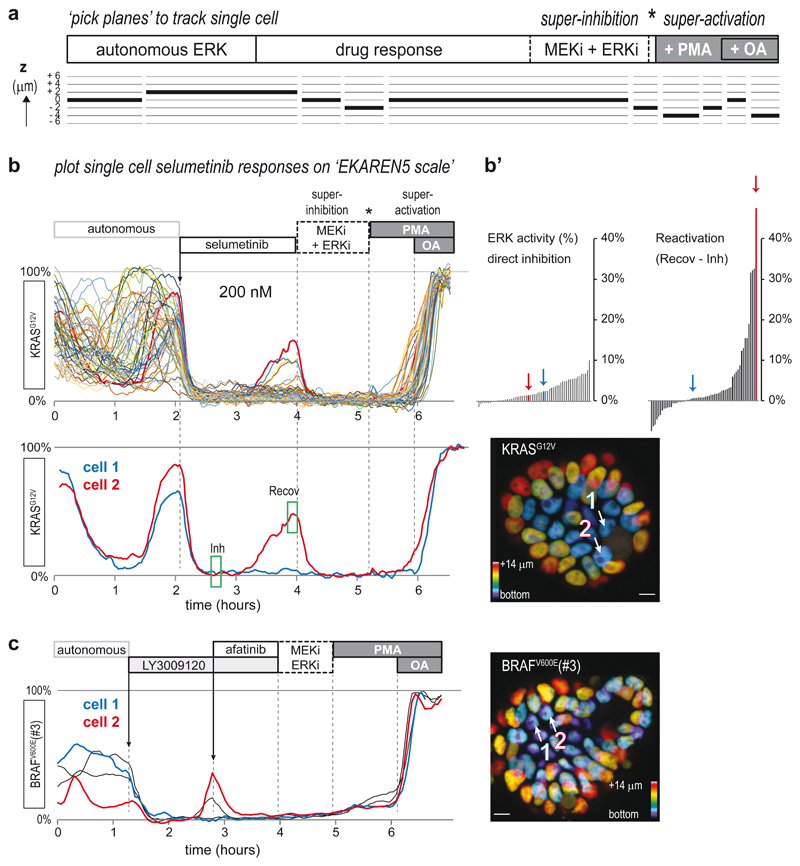
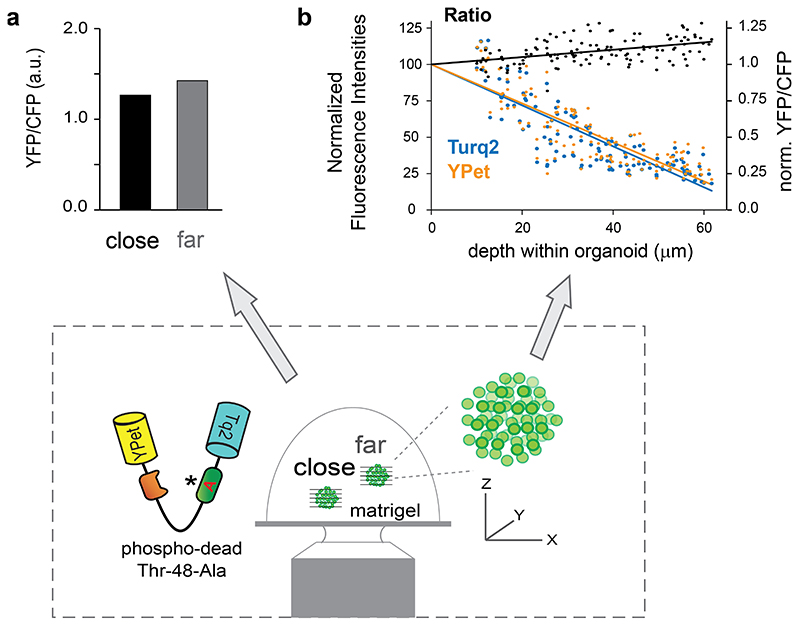
To allow quantitative and comparative FRET analyses among these PDO lines, we systematically finalized time-lapse recordings with ‘super-inhibition’ of the pathway by combined application of MEK and ERK inhibitors (sel+SCH) and subsequent ‘super-activation’ with PMA and okadaic acid (OA), effectively assessing the minimal (0%) and maximal (100%) sensor output for each cell (Fig. 3a). Using this approach, normalized single-cell ERK activities can be interpreted free from arbitrary parameters that may affect absolute ratios, e.g. sensor expression level (Extended Data Fig. 2e), distance from the objective or depth within organoids (Extended Data Fig. 5). Furthermore, we developed a ‘pick planes’ tool to seamlessly follow 3D trajectories of individual cells-of-interest over time with optimal cross-sectioning of sensor-filled nuclei (Fig. 3a).
Fig. 3. Single-cell ERK dynamics in CRC PDOs expose cell-to-cell heterogeneity in response to MAPK pathway inhibitors.
a, CRC PDOs expressing the EKAREN5 ERK biosensor were imaged (XYZT) during 8-20 hours with 2-4 minute intervals. At the end of each experiment, minimum and maximum FRET signals were enforced by ‘super-inhibition’ (MEK-inh selumetinib (5μM) and ERK-inh SCH772984 (5μM)) and subsequent ‘super-activation’ (PMA (150nM) and subsequent okadaic acid (OA, 1μM)). Inhibitors were washed out prior to super-activation (asterisk). For bona fide analysis of single-cells moving in 3D, we developed a tool to ‘pick planes’, ensuring that resulting 2D (XYT) excerpts seamlessly follow trajectories of individual cells-of-interest over time, with optimal cross-sectioning of the sensor-filled nuclei (see Methods).
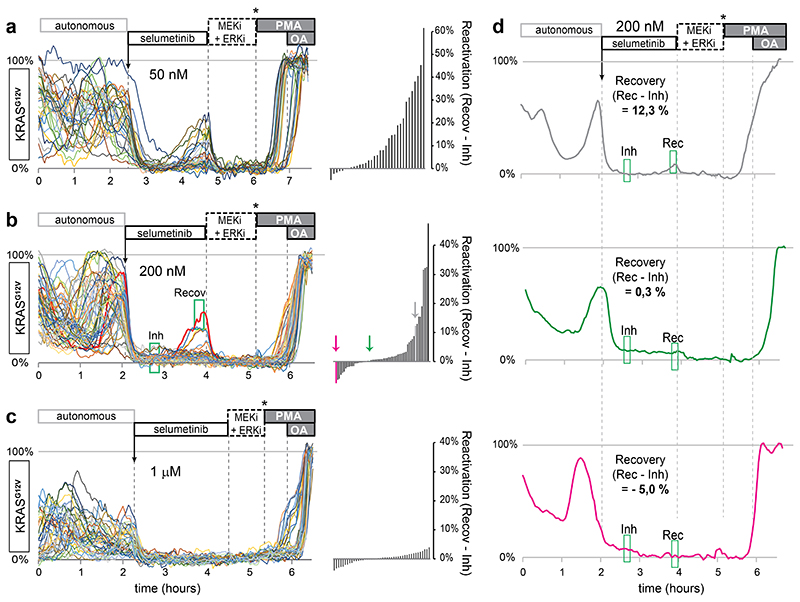
b, Single-cell ERK responses to MEK inhibitor selumetinib (200nM, approximating clinical plasma concentrations43) in EKAREN5-expressing PDO-KRASG12V, imaged and analyzed as outlined in a. Shown are single-cell responses from 59 cells in 3 simultaneously imaged PDOs. Below, exemplary responses of two neighboring cells displaying distinct recovery from ERK inhibition in the course of 2 hours. Corresponding cell 1 and cell 2 are indicated in depth-coded organoid image. See also Supplementary Movie 3. Experiment performed twice.
b’, Waterfall plots summarizing the direct inhibition effect of selumetinib (green box, ‘Inh’) and the recovery effect (difference between green box ‘Inh’ and green box ‘Recov’). Colored bars (arrows) represent cell 1 and cell 2.
c, PDO-BRAFV600E(#3) organoids were subjected to pan-HER inhibitor LY3009120 (1μM). Most cells showed full inhibition (blue), but a subset of cells (red) showed rapid ERK reactivation, sensitive to afatinib (1μM).
Scale bars, 10μm. Experiment performed once.
To demonstrate that we can monitor single-cell ERK activity levels during drug response, we treated PDO-KRASG12V with the clinical MEK-inhibitor selumetinib43. Before treatment, virtually all cells showed extensive autonomous ERK fluctuations, similar to those observed in healthy mouse small intestinal organoids18. In response to selumetinib, cells showed immediate and near-complete ERK suppression at 1000nM, 200nM and even 50nM concentrations (Fig. 3b and Extended Data Fig. 6a-c). Underscoring the quantitative and sensitive nature of the procedure, we noticed few cells showing ERK reactivation within 2 hours after start treatment (Extended Data Fig. 4d), substantially faster than previously reported ERK reactivation in selumetinib-treated 2D cell cultures40. With higher selumetinib concentrations, reactivation events declined in frequency and in amplitude. Interestingly, ERK reactivation occurs heterogeneously, with marked differences even between neighboring cells (Fig. 3b and Supplementary Movie 3).
Next, we treated PDO-BRAFV600(#3) with pan-RAF inhibitor LY3009120 and observed similar heterogeneity in drug response, with a subset of cells showing rapid ERK reactivation44. Reminiscent of the reported interplay between MAPK inhibition and upstream EGFR activity10,12, we could fully suppress reactivation by subsequent administration of the pan-HER inhibitor afatinib (Fig. 3c).
pan-HER inhibitor afatinib eliminates ERK activity oscillations in PDOs mutant for KRAS, NRAS or BRAF
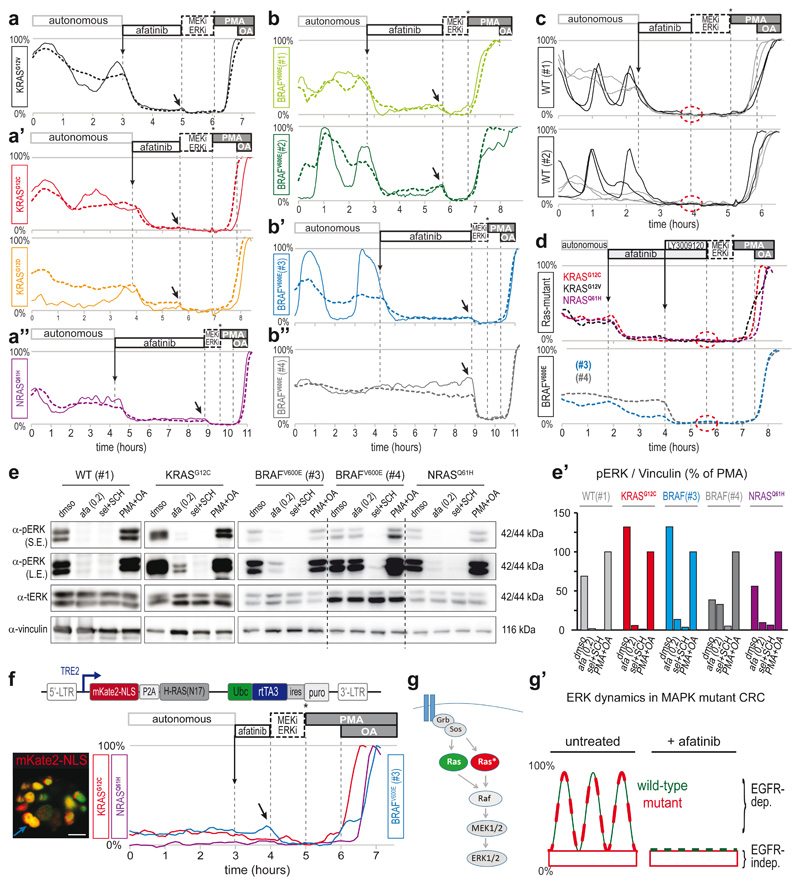
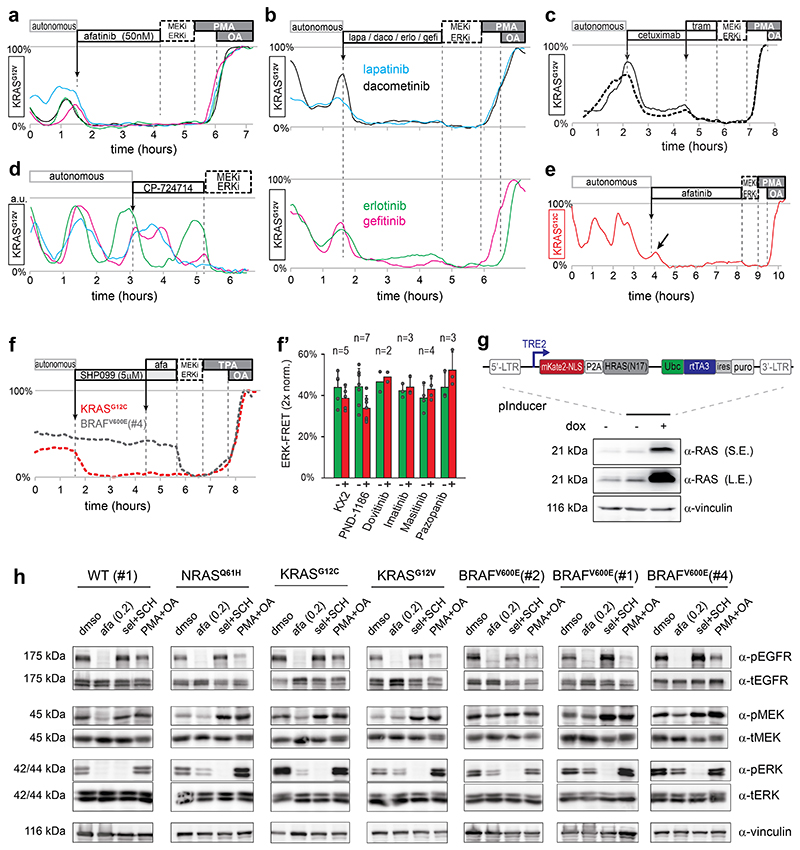
Niche factor-independent tumor growth is progressively associated with the adenoma-carcinoma transition in CRC24. Oncogenic KRAS mutations are generally assumed to render tumor cells independent of growth factor EGF. However, this contradicts the defining role for EGFR in KRAS-mutant lung13 and pancreatic14,15 tumorigenesis. To better understand the interplay between EGFR and downstream MAPK pathway mutations, we monitored ERK activity dynamics upon inhibition of upstream EGFR in PDO-KRASG12V. Despite the presence of downstream mutant KRAS, fluctuating ERK activity was instantly and substantially suppressed by afatinib treatment (Fig. 4a), even at 50nM (Extended Data Fig. 7a). Alternative pan-HER inhibitors lapatinib and dacometinib, as well as EGFR-specific inhibitors gefitinib, erlotinib and cetuximab antibody, similarly inhibited oscillatory ERK activity, while the HER2-specific inhibitor CP-724714 did not (Extended Data Fig. 7b-d).
Fig. 4. pan-HER inhibitor afatinib eliminates ERK activity oscillations in KRAS, NRAS or BRAF mutant PDOs.
a-b, EKAREN5 reveals ERK activity in CRC PDOs before and after afatinib administration (200nM). After afatinib-induced ERK suppression, basal ERK level is revealed by further FRET decrease upon super-inhibition (arrow). Unlike other PDOs, BRAFV600E(#4) does not respond to afatinib. Dashed traces, z-plane analyses comprising multiple cells. Solid line, representative single-cell analysis from corresponding z-plane. BRAFV600E(#3) (blue) also as Supplementary Movie 4.
c, As in a. Drug response to afatinib (200nM) in PDO-WT(#1) and (#2). Unlike RAS/BRAF mutant PDOs, afatinib-induced ERK suppression leaves no residual basal levels (dashed circle). Characteristically, dynamics in WT PDOs showed either high-amplitude fluctuations (black) or relatively constant dynamics (grey).
d, Following afatinib-treatment, pan-RAF inhibitor LY3009120 (1μM) abolishes basal ERK activity in KRAS-mutant (top) and BRAF-mutant (bottom) PDOs (dashed circle; no further reduction upon super-inhibition). Shown are z-plane analyses.
e, Western blot analyses on indicated PDO-lines recapitulate above described EKAREN5 observations. In particular, afatinib abolished pERK in PDO-WT(#1), while in mutant PDOs pERK was largely affected, but not abolished. Afatinib (200nM), super-inhibition (sel+SCH, 5μM), super-activation (PMA+OA). S.E., short exposure; L.E., long exposure. Vinculin was used as loading control. Experiment performed twice. Blots for PDO-WT(#1) and PDO-KRASG12C were from experiment also depicted in Extended Data Fig. 7h. e’) Quantification of Western blots in e. pERK signal was normalized to Vinculin signal (relative to maximal induction (PMA+OA)).
f, Doxycyclin-inducible expression of mKate2-NLS-P2A-HRASN17 (top) was generated in PDO-KRASG12C, PDO-NRASQ61H and PDO-BRAFV600E(#3) via lentiviral infection. FRET-acquisition after 20hr of doxycyclin incubation. Analysis on HRASN17-positive cells (marked by mKate2-NLS), reveal loss of oscillatory ERK behavior. Super-inhibition (arrow), but not afatinib could further suppress basal ERK levels. Traces are single-cell analyses. Inset: mKate2-NLS (red) merged with EKAREN5 (green) in BRAFV600E(#3) organoid; blue trace derived from cell indicated by blue arrow. Scale bar, 10μm. Experiment performed once.
g, EGFR employs linear MAPK pathway to induce pulsatile ERK activation, involving both wild-type and mutant KRAS. g’) Model depicting ERK activity patterns in KRASG12X or BRAFV600E mutant PDOs as composites of basal ‘oncogenic’ signaling and EGFR-mediated ERK activity oscillations.
Afatinib-induced elimination of oscillatory ERK activity was also observed in PDO-KRASG12C, PDO-KRASG12D and PDO-NRASQ61H (Fig. 4a), as well as in the PDO-BRAFV600E #1, #2 and #3 (Fig. 4b and Supplementary Movie 4) and PDO-WT #1 and #2 (Fig. 4c). These data indicate that EGFR remains a significant driver of ERK activity in tumor cells of human CRCs despite oncogenic mutations in KRAS or BRAF.
Of note, residual ERK activity levels, becoming apparent upon afatinib-induced elimination of upstream signaling input, were of minor level, devoid of oscillatory behavior and likely reflect constitutive oncogenic signaling by mutant RAS or RAF (Fig. 4a,b). Indeed, such residual ERK activity was not observed in PDO-WT #1 or #2 (Fig. 4c). Interestingly, PDO-BRAFV600E(#4), the only PDO without obvious ERK activity oscillations, appeared refractory to afatinib treatment (Fig. 4b”), suggesting that its high ERK levels arise independent of EGFR signaling. Inhibition of the adaptor protein Shp2 (SHP099, 5μM), which couples a broad range of RTKs to downstream RAS, was also without effect, as were inhibitors for Src, FAK, cKit or PDGF (Extended Data Fig. 7f,f’). Thus, MAPK activity in PDO-BRAFV600E(#4), as an exception in our PDO panel, is independent of upstream input.
In agreement with previous data underpinning the central role of EGFR in orchestrating ERK oscillations in 2D cell-lines39, our single-cell derivations from CRC PDOs display instant deflections when afatinib is administered during the rising phase of an ERK activity oscillation (e.g. Extended Data Fig. 7e), further establishing EGFR as the critical driver of ERK oscillations. We confirmed the effects of afatinib using Western blot analysis, showing near-absent pERK levels in PDO-WT(#1), while afatinib could substantially reduce, but not eliminate pERK signal in mutant PDOs (Fig. 4e).
Next, we aimed to identify the signaling components responsible for the EGFR-driven ERK activity oscillations and EGFR-independent residual ERK levels. The latter likely follows from constitutive oncogenic signaling, given the mutational status of the examined CRC organoids. In line with this assumption, EGFR-independent oncogenic signaling was completely suppressed by pan-RAF inhibitor LY3009120, lowering FRET ratios to levels indiscernible from those enforced by MAPK pathway super-inhibition (Fig. 4d). These data indicate that neither of the signaling inputs feeding into ERK involve pathways circumventing the RAF RAF-module. To test that EGFR activity establishes ERK oscillations via the linear RAS-RAF-MEK cascade, we enabled doxycyclin-induced overexpression45 of HRASN17, which impedes signaling of all RAS-isoforms through dominant negative sequestering of upstream GEFs46. HRASN17-induced cells, marked by nuclear mKate2-NLS (Extended Data Fig. 7g), failed to generate ERK activity oscillations, but showed minor levels of steady-state ERK activity that were insensitive to afatinib (Fig. 4f). Taken together, EGFR drives ERK activity oscillations via the linear RAS-MAPK pathway (Fig. 4g). These observations are in accordance with integral biochemical analyses on EGFR-MAPK-pathway components (Extended Data Fig. 7h).
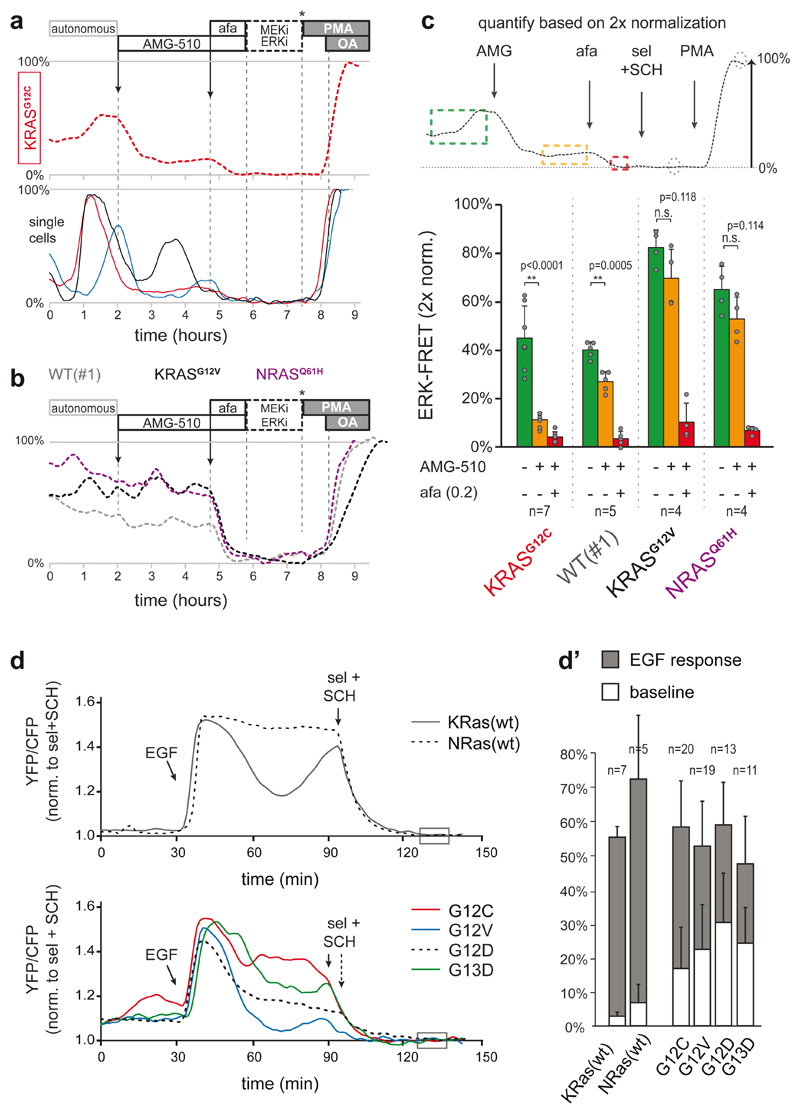
We next wondered whether EGFR signaling engages mutant MAPK signaling components themselves. AMG-510, a drug that specifically targets the cysteine of KRASG12C, 47, substantially reduced ERK activity in PDO-KRASG12C (>50%) (Fig. 5a), which is at odds with the limited intrinsic activity of KRASG12C (few %) in situations without upstream signaling input. Moreover, sustained pulsatile dynamics of the residual ERK activity indicates ongoing EGFR-mediated signaling through the non-inhibited wild-type RAS-isoforms (Fig. 5a-c). Finally, expression of EKAREN5 in RASless MEFs, wherein reconstituted KRAS-mutants (G12C, G12D, G12V or G13D) replace all deleted endogenous RAS isoforms48, revealed substantially boosted ERK activity upon EGF stimulation (Fig. 5d). While mutant KRAS-isoforms established higher basal ERK levels (Fig. 5d’), their signal transduction effectivity is enhanced upon EGFR activation, similar to their wild-type counterparts.
Fig. 5. Mutant KRAS molecules engage in EGFR-mediated ERK activation.
a, KRASG12C was specifically targeted by AMG-510 (250nM) in PDO-KRASG12C, inducing substantial suppression of ERK activity. Top, plane-analysis; bottom, single cells from same organoid. Unlike in afatinib responses (e.g. Fig. 4a), residual ERK activity remains characterized by pulsatile dynamics (of various amplitude), likely representing EGFR activity relayed by the unhindered wild-type RAS proteins.
b, Three CRC PDOs containing either wild-type or different RAS mutants were scanned in parallel, excluding non-specific effects of AMG-510 (250nM) on ERK signaling. Shown are plane-analyses.
c, Top, scheme for the analysis of EKAREN5 dynamics before and after drug administration on a double calibrated scale. Bottom, bar graph summarizes PDO responses before (green), to AMG-510 (orange) and to AMG-510 + afatinib (200nM) (red). Data presented as mean values ± s.d. N numbers represent individual PDOs (see individual data points) and are stated in the graph for each group.
Representative traces in a and b. Experiment performed twice. Two-sided student’s T-test: *, p<0.05. n.s., non-significant.
d, EKAREN5 was introduced into RASless MEFs harbouring RAS reconstitutions, being wild-type (top) or either of four mutants (bottom). The MEFs sister lines were serum-starved 24 hours prior to EGF stimulation, clearly indicating amplified signal transduction by mutant RAS upon EGFR activity. FRET-signal is normalized to super-inhibition (box). d’, Quantification of all single cell analyses. n numbers represent cells and are denoted in the graph for each group. Data presented as mean values ± s.d.
Differential adaptation to long-term growth conditions without EGF
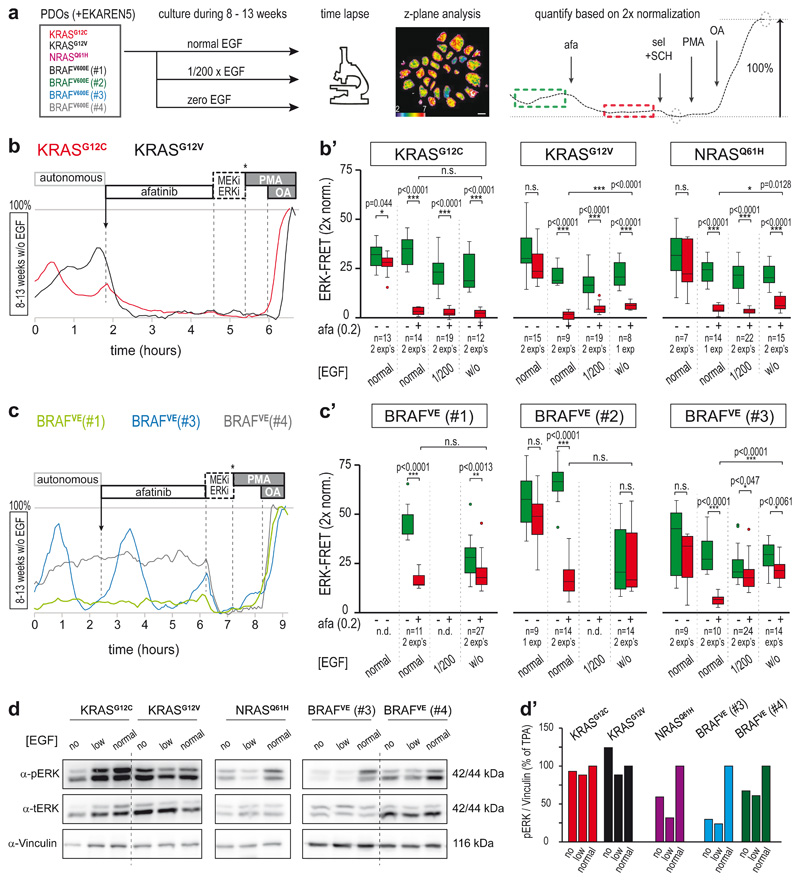
Given the significant contribution of EGFR-mediated oscillations to total ERK activity, we wondered to what extent this is controlled by external supply of EGF-ligands via culture conditions. We therefore derived PDO sister lines through long-term culturing (8-13 weeks) under either minimal (200x diluted) or zero EGF (Fig. 6a). All RAS-mutant PDOs appeared largely unchanged in their autonomous pulsatile ERK profiles, with only a mild reduction in overall ERK phosphorylation status in PDOs cultured without EGF (Fig. 6d). Pulsatile ERK dynamics were similarly sensitive to afatinib (Fig. 6b), suggesting that these PDOs established autocrine and/or paracrine EGFR stimulation. Of note, in PDO-KRASG12V and PDO-NRASQ61H, these challenging growth conditions provoked adaptive enhancement of ERK activation by oncogenic RAS (Fig. 6’), hinting either at direct signaling rewiring or at clonal selection over the course of weeks.
Fig. 6. Differential adaptation to long-term growth conditions without EGF.
a, Culturing scheme to assess the role of EGF supplementation to the PDO culture medium. PDOs were cultured in medium containing standard EGF (50 ng/ml), 200x diluted EGF (0.25 ng/ml) or no EGF. After 8-13 weeks, PDOs were FRET-imaged during afatinib treatment (200nM) and z-plane analysis was performed (example FRET image shows ROI definition in purple). Right, example trace (representative for n>10): green dashed box, mean ERK before treatment; red dashed box, mean ERK after treatment. Afatinib-induced ERK suppression was quantified according to double calibration (circles: ERKmin and ERKmax). Scale bar, 10μm.
b, After 8-13 weeks of culturing without EGF supplementation, the persistent ERK activity oscillations in PDO-KRASG12C (red) and PDO-KRASG12V (black) showed sensitivity to afatinib. Shown are representative single-cell analyses. b’) Effects of pan-HER inhibition on ERK activity levels, quantification as outlined in a. Green, before afatinib; red, after mock or afatinib (200nM) inhibition Indicated are PDO numbers (n), pooled from one or two experiments (exp).
c, As in b, single-cell ERK traces from three PDO-BRAFV600E mutant PDOs cultured without EGF. ERK dynamics in BRAFV600E(#1) are now without oscillations. While BRAFV600E(#3) (blue) still shows oscillatory ERK dynamics, the majority of cells has become unresponsive to afatinib. BRAFV600E(#4) (grey) remains insensitive to afatinib. c’) Effects of pan-HER inhibition on ERK activity levels, quantification as outlined in a. Green, before afatinib; red, after mock or afatinib (200nM) inhibition. PDO numbers (n) as indicated. Experiment was performed at least twice (each comprising 10-25 organoids).
b’,c’, boxes represent quartile 2 and 3, horizontal line represents median, whiskers represent minimum and maximum within 1,5x interquartile range. Dots are outliers. Two-sided student’s T-tests: *, p<0.05; **, p<0.005; ***, p<0.0005. n.s., non-significant.
d, Western blot analysis of ERK activity status in PDO lines. ‘Low’, 200x reduced EGF (0.25 ng/ml) supplementation. ‘No’, without EGF supplementation. Vinculin was used as a loading control. Left, RAS mutant PDO lines; right, BRAFV600E mutant PDO lines. Experiment performed once. d’), Quantifications of d.
Unlike the RAS-mutants, EGF-deprived PDO-BRAFV600E(#1) and (#2) appeared less inclined to restore EGF signaling. Compared to their EGF-stimulated parental lines, they showed loss of pulsatile dynamics (Fig. 6c), reduction in mean ERK activity levels and no impact of afatinib treatment (Fig. 6c’). Interestingly, PDO-BRAFV600E(#3), which displayed the lowest basal ERK level among the BRAFV600E-mutant PDOs (Fig. 4), was the only one to restore its high-amplitude ERK oscillations, but these were now largely insensitive to afatinib (Fig. 6c, c’), suggesting that an alternative signal replaced EGFR to maintain ERK oscillations.
Thus, most CRC PDOs maintain oscillatory ERK activity patterns despite limiting EGF conditions, possibly through production of growth factors that activate EGFR or other ERK-coupled RTKs.
EGFR-mediated amplification of ERK signaling promotes tumor growth in vitro and in vivo
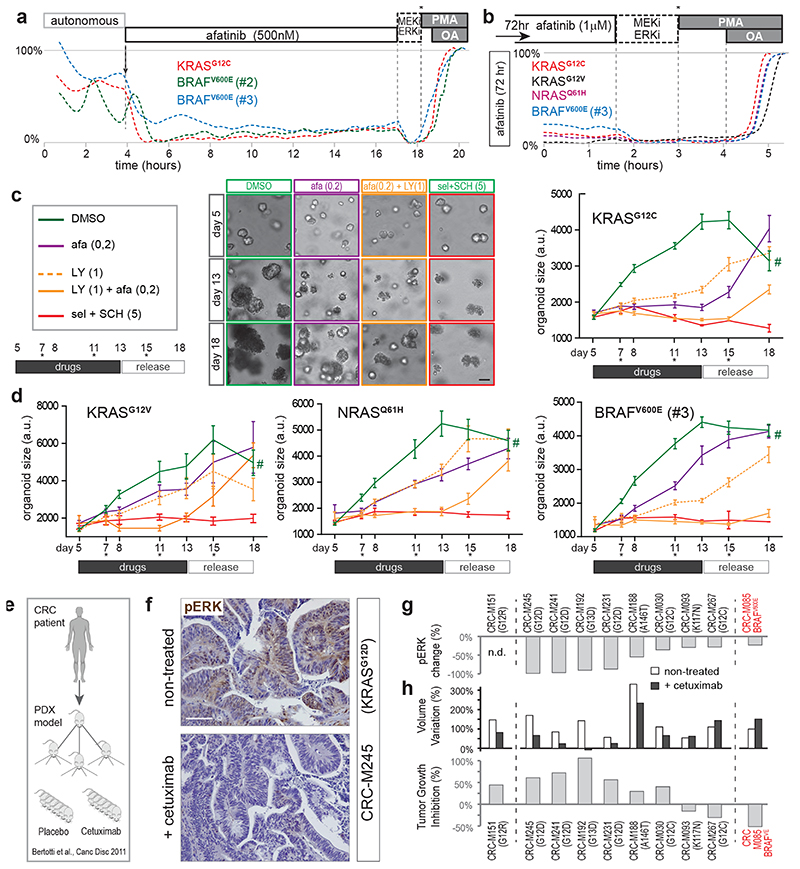
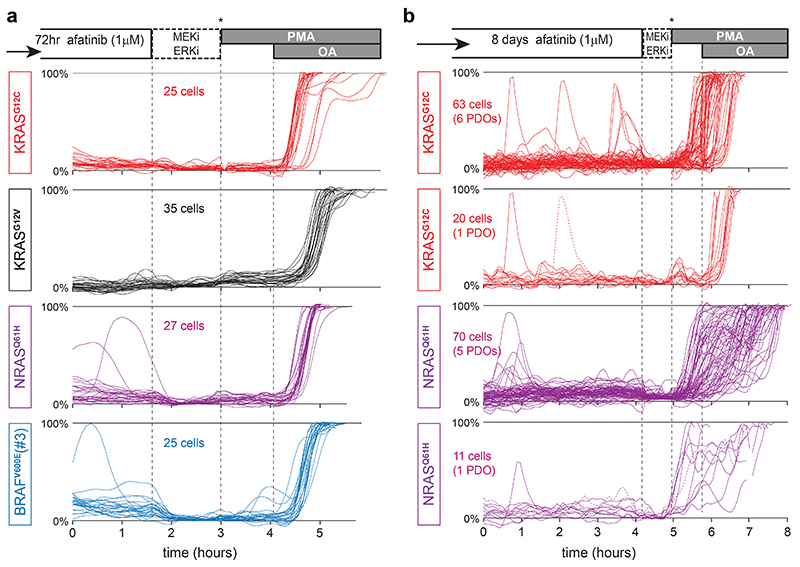
We set out to assign functional importance to oncogene-mediated basal signaling versus additional signal amplification by upstream EGFR, with regard to survival and/or proliferation of tumor cells. For this, we studied the long-term effects of EGFR-inhibition on KRASG12X and BRAFV600E mutant organoids. First, we confirmed sustained ERK suppression by afatinib over long intervals (20 hr, Fig. 7a). Also after 3 or 8 days of incubation, we observed similarly low basal ERK levels, devoid of EGFR-driven oscillatory amplification (Fig. 7b and Extended Data Fig. 7a,b). Intriguingly, long-term inhibition of these continuous oscillatory dynamics unmasked a hidden pattern of extremely rare, isolated spikes in few cells (incidence, 1 per ~30hrs; Extended Data Fig. 7b), indicative of alternative signaling input.
Fig. 7. EGFR-mediated amplification of ERK signaling promotes tumor growth in vitro and in vivo .
a, Representative FRET-traces (z-plane analyses) of EKAREN5 post afatinib treatment in KRASG12C, BRAFV600E(#2) and BRAFV600E(#3) shows sustained absence of EGFR-mediated amplification.
b, As in a, but FRET-imaging initiated 72hr post afatinib treatment. Basal ERK levels remain unaltered during long-term drug response.
c, Monitoring organoid growth of 5-day old PDO-KRASG12C during 8 days drug treatment, followed by 5 days without drugs to test growth re-initiation of viable organoids (asterisks, medium refreshments). Drug concentrations (μM) denoted. Representative brightfield images at days 5, 13 and 18. Right, EKAREN5 YPet fluorescence was used for object segmentation for size measurement (~103 PDOs per data point), depicted in corresponding graphs (mean ± s.e.m.). Experiment performed twice. Scale bar, 50μm. #, unreliable measurement (overgrowth) of 18 day-old DMSO-treated PDOs.
d, As c, graphs depicting mean organoid size (+/-s.e.m.) during drug treatment on KRASG12V, NRASQ61H and BRAFV600E(#3) PDOs. Experiment performed twice. Mean number of objects (PDOs) per time point: KRASG12V, 59; NRASQ61H, 84; BRAFV600E(#3), 107.
c,d, for exact n-numbers per presented data point, see Source Data.
e-h, Frozen sections were taken from experiments performed for Bertotti et al.50.
e, Schematic of PDX model generation from metastatic CRC samples50 for prospective examination of cetuximab response.
f, Changes in pERK levels were scored through immunohistochemistry on paraffin-embedded tumor sections after 2 weeks of cetuximab or placebo treatment in three independent mice bearing PDX from same tumor. Shown are representative sections from KRASG12D-mutant PDX model M245, illustrating strong reduction in pERK levels following cetuximab-treatment. Scale bar, 100 μm.
g, Graph depicting quantified changes in pERK levels for 9 out of 10 PDX models of CRC (oncogenic mutations denoted). Changes in pERK levels were scored through immunohistochemistry as the average of 10 optical fields (40X), randomly chosen from each tumor (n=30). Minimally 2 mice per group were analyzed.
h, Comparative re-analysis of tumor growth data per PDX model upon treatment with cetuximab (n=6 mice) or placebo (6 mice)50. Top, bar graph representing tumor size variation from baseline of untreated and cetuximab-treated animals. Bottom, bar graph representing tumor growth inhibition (%,treated/untreated) calculated from size variation.
Next, we scored organoid growth in conditions with or without EGFR-induced signal amplification. PDO-KRASG12C showed near-complete growth suppression under afatinib treatment but limited cell death, as assessed by growth recovery after drug release (Fig. 7c). These observations suggest that the minimal signaling from oncogenic KRASG12C (Fig. 6b’) suffices to maintain cell survival, while signal amplification by EGFR promotes proliferation. Interestingly, combining afatinib with pan-RAF inhibitor LY3009120, which eliminates residual oncogene-driven ERK activity (Fig. 4d), induced increased mortality in PDO-KRASG12C.
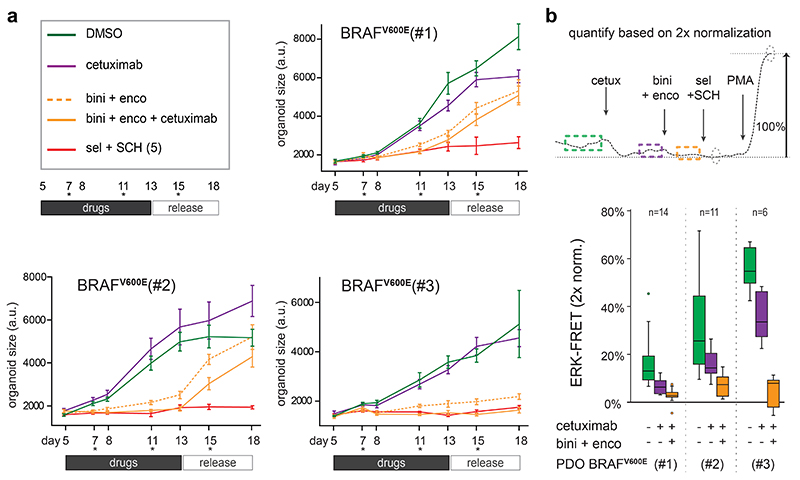
In contrast, in PDO-KRASG12V, PDO-NRASQ61H and PDO-BRAFV600E(#3), afatinib alone could reduce but not stop proliferation. However, the combination of afatinib and LY3009120 halted proliferation in all PDO lines (Fig. 7c,d). As expected, this drug combination induced substantial mortality in PDO-BRAFV600E(#3), while the growth-arrested PDO-KRASG12V and PDO-NRASQ61H showed signs of survival. Differential effects on viability in the absence of any ERK activity may result from additional cancer mutations, e.g. the oncogenic PIK3CA mutation in PDO-KRASG12V, 49. Of note, LY3009120 alone could not halt proliferation, underscoring that effective inhibition of oncogenic MAPK signaling benefits from silenced EGFR-signaling. Also when applying the clinically applied EGFR/RAF/MEK triple combination for BRAF-mutant CRC7, we observed optimal growth suppression and ERK inactivation when downstream RAF+MEK inhibition (encorafinib + binimetinib) was complemented with upstream EGFR inhibition (cetuximab) (Extended Data Fig. 9).
To validate the impact of upstream EGFR activity on oncogenic MAPK signaling in vivo, we analyzed the biochemical and therapeutic effects of EGFR blockade using a series of CRC PDX models with mutant KRAS or BRAF, that had been annotated for response to the clinically approved anti-EGFR antibody cetuximab in an independent study50 (Fig. 7e). While we have not shown oscillatory signaling in vivo 18,51, we here do confirm reduced pERK levels upon cetuximab-treatment in all models examined (9/9) (Fig. 7f,g). Analogous to clinical observations, response to cetuximab of most of these models was originally categorized as progressive disease50. Nevertheless, closer examination of tumor growth data between cetuximab-treated and placebo-treated animals illustrated that reduced pERK levels in tumors were frequently accompanied by reduced growth kinetics (~40% over all 10 PDX models, Fig. 7h). Thus, also in vivo, EGFR activity amplifies downstream signaling activity of an oncogenic MAPK pathway.
Discussion
To understand drug responses in human tumors with mutated MAPK pathways, we captured the dynamic nature of single-cell ERK profiles in CRC PDOs. For this, we re-engineered the pre-existing ERK biosensor into EKAREN5. The enhancements regard specificity, FRET range, detection range, fluorophore properties and genomic integration (see Supplementary Discussion for extensive considerations on EKAREN5 and FRET measurement in 3D organoids). Subsequently, our standardized double-normalization procedure proved essential for quantitative analyses to reveal cell-to-cell variabilities and low-amplitude ERK levels in the response to clinical inhibitors.
In the current study, we reveal extensive ERK activity oscillations in CRC PDOs with either wild-type or mutant MAPK signaling (e.g. KRASG12X, NRASQ61H or BRAFV600E). These oscillatory dynamics were eliminated by pan-HER as well as more EGFR-specific inhibitors, confirming the central role of EGFR18,39. Upon EGFR-inhibition, we observed surprisingly low levels of basal, non-oscillatory ERK activity remaining, which we attribute to intrinsic activity of oncogenic KRASG12X, NRASQ61H or BRAFV600E. Thus, ERK patterns are composites of limited basal signaling from oncogenes plus a much larger EGFR-driven pulsatile component. Importantly, even without EGF supplementation all RAS-mutants showed EGFR-induced oscillations, likely explained by autonomous production of EGF(-like) ligands establishing autocrine/paracrine signaling. Unlike the RAS mutants, PDO-BRAFV600E(#3) re-established ERK oscillations through an EGFR-independent mechanism, while PDOs BRAFV600E(#1) and (#2) showed no signs of evolutionary pressure to elevate their already significant basal ERK activity.
EGFR-driven ERK activity oscillations employ the linear MAPK pathway, given that they disappear upon overexpression of d.n.HRASN17 or incubation with pan-RAF inhibitor. In physiological MAPK signaling, EGFR functions as a switch by initiating a cascade of events, including activation of RAS-GEFs, clustering of activated RAS, recruitment and dimerization of RAF and subsequent assembly of the RAS-RAF-MEK complex with scaffold KSR52. These events catalyze signaling efficiency by local enrichment of the involved signaling molecules. Based on our quantitative assessments, KRASG12X, NRASQ61H and BRAFV600E possess limited intrinsic signaling activity3,4, but with EGFR activated, their transduction efficiency is maximized, presumably by such complex formation. Indeed, it has been reported that activity of mutant KRAS can benefit from upstream GEF activity53–57. This notion is substantiated by our observations in RASless MEFs harboring reconstituted RAS mutants and in our KRASG12C organoids, in which ERK activity was substantially impacted by the G12C-specific drug AMG-510. BRAFV600E, well-known for its capacity to signal independently as a monomer, is also expected to benefit from upstream signals, as it can heterodimerize with wild-type CRAF under the influence of active RAS4,58.
In line with the essential role of ERK unveiled in mouse tumor models59, complete elimination of ERK activity through co-inhibition of MEK and ERK, successfully induced cytotoxicity in all studied PDOs. pan-HER inhibition reduced growth kinetics in all mutant lines, albeit to variable degrees. Most notably, minimal basal ERK levels, as in PDO-KRASG12C, suffice to survive treatment. Overall, fundamental fate decisions towards apoptosis, survival or proliferation, seem to be driven by minimal differences in ERK activity levels in the lower range of the spectrum (from 0 to 5 to >10%, resp.).
Upon long-term EGF-deprivation, RAS-mutant PDOs maintained oscillatory ERK activity via autonomous production of EGF(-like) ligands, exemplifying the concept that EGF-independent tumor growth is not automatically secured with the sole presence of RAS oncogenes. Paracrine or microenvironment-derived EGFR stimuli, can provide essential amplification of oncogenic MAPK signaling to promote tumor growth, as we also deduced from multiple PDX models of CRC cancer (Fig. 7). Accordingly, transcriptome analysis of human CRCs identified increased levels of paracrine EGFR stimuli in tumor tissue60. Autocrine production of EGFR-activating ligands has been demonstrated to predict response to EGFR inhibition61–63.
Importantly, in all studied PDOs, combined pan-HER and pan-RAF inhibition successfully imposed growth arrest, as opposed to single treatments. This also accounted for complementing MEK+RAF inhibition with cetuximab in BRAFV600E mutants, in analogy to recent clinical evaluations7. The fact that ERK inactivation by MAPK pathway inhibitors benefits instantly from silenced EGFR activity, underscores the clinical relevance of EGFR as a major amplifier of oncogenic MAPK signaling. This mechanistic insight is in accordance with the recently reported efficacy of G12C-inhibitor AMG-510 when combined with cetuximab8. On a similar note, EGFR activity was shown to be a prerequisite for KRAS-driven tumorigenesis of pancreatic ductal adenocarcinoma (PDA)14,15 and non–small cell lung cancer (NSCLC)13.
Most pharmacological strategies to treat KRAS or BRAF-mutant CRC patients involve ‘vertical targeting’ of multiple MAPK effectors including upstream EGFR5,7, of which the feedback activation became a known resistance mechanism following downstream MAPK pathway inhibition8,10–12. Our data provide mechanistic significance to this notion by revealing that EGFR signaling actively amplifies the signaling output of oncogenic MAPK effectors. Suppressing this amplification by pharmacological targeting of EGFR is an indispensable component of combinatorial treatments against MAPK mutant CRC.
Methods
Reagents
EGF was from Invitrogen; selumetinib, afatinib, lapatinib, lapatinib, gefitinib, erlotinib, SHP099 and LY3009120 were from SelleckChem; SCH772984 was from MedChem Express; PMA, nocodazol and CP-724714 were from Sigma-Aldrich; RO-3306 was from Tocris Bioscience; AMG-510 was from MedChemExpress.
Plasmids and cell line construction
Cloning was performed using In-Fusion HD Cloning Kit (Clontech Laboratories). The EKAREV biosensor28 was kindly provided by Matsuda lab and subsequently transferred to miniTol2 vector, including an EF1a promoter and PGK-puromycin-resistance cassette. To substitute eCFP, we inserted gBlock (IDTDNA) encoding Turquoise2 cDNA including dimerization-prone residues and 169 silent mutations (detailed in Extended Data Fig. 4a). For point mutagenesis, including ERK-insensitive control variant T48A, we performed whole-vector PCRs starting with mutation-bearing primers. Linker length variants emerged from low-frequency errors in PCR reactions on repetitive repeats in the Eevee-linker of EKAREV.
EKAREV-GW4.0 was developed starting from EKAREV using four-fragment Multisite Gateway Pro Plus system (Life Technologies). This system allows four separate ‘bricks’ of the FRET biosensor to be simultaneously transferred to a Destination vector using Gateway BP and LR recombination reaction. The extended method is described in Sipieter & Cappe et al. (manuscript in revision). Alternative ERK1/2 substrates (Alt_ERK_Sub; see Extended Data Fig 4b) were extracted from literature using Kinexus website (www.phosphonet.ca/default.aspx) and www.kinasenet.ca. Alternative substrates were further optimized for WW-domain recognition as previously described64.
To prepare for organoid transgenesis, EKAREV- or EKAREN-variants were inserted into lentiviral vector, containing either ires-Puro or ires-Blast resistance cassette.
ERK-KTR, originally from Regot et al.27, was first transferred to miniTol2-vector, including an EF1a-promoter and blasticidin-resistance cassette. Thereafter, its fluorophore was substituted with mCherry through In-Fusion cloning.
For doxycycline-inducible expression of dominant-negative HRas(N17), pInducer2045 was adapted by insertion (In-Fusion cloning) of HRas(N17), replacing attR1-ORF-attR2 (PCR primers: FW-AgcctactagtccagACGCGTCTCGAGGTCGACaGCTAGCATGgaggagccgcagtc, REV-tcgagcggccgccacGGTAcccgggTCAgtctgagtcaggccC), and subsequent insertion (2-PCR-In-Fusion cloning) of mKate2-NLS (mKate2-FW-cctactagtccagACGCGTTTCcaccATGGTGAGCG, mKate2-REV-gtacagctcAGCGCTAACTTTTCGCT, NLS-FW-GTTAGCGCTCCAAAaAAGAAaaggAAAGTcAGCatGTTAACggagctgtacaaggctagagatat, NLS-REV-gcggctcctccaTGCTAGCAGGTCCAGGGTTCTCTTCAAC).
Cloning primers
PCR primers for In-Fusion cloning:
-EKAREV to miniTol2 empty vector : FW-TCTAGCTAGAGGATCCGCCACCATGGTGAGCAAGGGCGAG and REV-TCACTATAGTTCTAGaccgtcgacTTACACCTTACGC.
-mCherry into ERK-KTR : FW-ATTCCCATCCaccggtGTGAGCAAGGGCGAGGAG and REV-ATGGCACTAGGCTAGcTCTAGACTTACTTGTACAGCTCGTCCATGC.
Mutagenesis forward primers (used with reverse complementary counterparts):
K424P (on EKAREV): GATGTCCCTAGAACTCCAGTGGATCCAgcaaagctgtcaTTCCAATTTCC
K426W (on EKAREV): GATGTCCCTAGAACTCCAGTGGATAAAgcaTGGctgtcaTTCCAATTTCCGggcg
K424P+ K426W (on EKAREV): GATGTCCCTAGAACTCCAGTGGATCCAgcaTGGctgtcaTTCCAATTTCCGggcg
PWE (on PW): ACTCACCATgcggccgccCGGAAATTGGAAtgactcCCAtgctggATCCACTGGAG
PWW (on PW): ACTCACCATgcggccgccCGGAAATTGGAAtgaccaCCAtgctggATCCACTGGAG
PWT (on PW): ACTCACCATgcggccgccCGGAAATTGGAAtgacagCCAtgctggATCggtTGGAGTTCTAGGGACATCTGGtcc
TA (on EKAREV): ccggaCCAGATGTCCCTAGAgCTCCAGTGGATAAAgcaa
TA (on PW): ccggaCCAGATGTCCCTAGAgCTCCAGTGGATccagcaTG
All constructs were sequenced prior to use.
Cell culture and transfection
RASless MEFs48 were kindly provided by the Voest Lab, NKI, Amsterdam, Netherlands. Cells were cultured in Dulbecco’s modified Eagle’s medium (DMEM), supplemented with 10% fetal calf serum and Penicillin/Streptomycin (P/S, Lonza). To generate stable lines, RASless MEFs, HEK293 or HeLa cells were co-transfected (using XtremeGENE transfection reagent, Merck) with miniTol vectors encoding FRET sensor variants, together with a vector encoding Transposase. Cells were selected using Puromycin (0.5 μg/ml) or Blasticidin (10 μg/ml). Monoclonal lines were generated by picking islands from 10-cm dishes, ~2 weeks after seeding at ultra-low density. For microscopical experiments, cells, either transiently transfected with or stably expressing biosensor variants, were seeded in glass-bottom dishes (Willco Wells BV) or 4x-segmented glass-bottom dishes (Greiner Bio-one GmbH).
Patient-derived organoid culture, mutagenesis and maintenance
The collection of colorectal tissue for the generation of CRC organoids has been performed according to the guidelines of the European Network of Research Ethics Committees (EUREC) following European, national, and local law. In all cases, patients signed informed consent after ethical committees approved the study protocols. Organoids identified by the HUB codes HUB-02-B2-040 (BRAFV600E(#3)), HUB-02-B2-096 (BRAFV600E (#4)), HUB-02-B2-113 (KRasG12D) and HUB-02-B2-074 (WT(#2)) are catalogued at http://huborganoids.eu and can be requested at info@huborganoids.eu. Distribution to third (academic or commercial) parties will have to be authorised by the Biobank Research Ethics Committee of the University Medical Center Utrecht (TCBio) at request of Hubrecht Organoid Technology (HUB).
CRC PDOs with identifiers p6T (KRasG12C), p9T (KRasG12V), p25T (NRasQ61H), p19bT (BRafV600E(#2)) and p18T (WT #1) were obtained from a previous study (van de Wetering and colleagues23). p1T4 (BRafV600E(#1)) was obtained from a previous study (Roerink and colleagues65). These PDOs are not catalogued in the HUB Biobank. We refer to Supplementary Table 1 for extensive description of organoid lines nomenclature, catalogue numbers and recurrent cancer mutations.
Human CRC organoids were cultured as previously described23. In short, organoids were cultured in drops of Matrigel (Corning); medium was refreshed every two days. CRC culture medium contained advanced DMEM/F12 (Invitrogen) with 1% Penicillin/Streptomycin (P/S, Lonza), 1% Hepes buffer (Invitrogen) and 1% Glutamax (Invitrogen), 10% R-spondin conditioned medium, 10% Noggin conditioned medium, B27 (Invitrogen), 1.25 mM n-Acetyl Cysteine (Sigma-Aldrich), 10μM Nicotinamide (Sigma-Aldrich), 500nM A83-01 (Tocris), 10μM SB202190 (ApexBio) and medium was supplemented with 50 ng/ml EGF (Invitrogen) unless indicated otherwise. Organoids were splitted through shear-stress (pipetting) and/or Trypsin-EDTA (Sigma-Aldrich) treatment. Directly after trypsinisation, culture medium was supplemented with 10μM Y-27632-dihydrochloride to prevent anoikis. Organoids were infected with lentivirus encoding EKAREN variants linked to puromycin- or blasticidin-resistance (e.g. pLV-EKAREN5-ires-Puro). Infected organoids were selected using 2μg/ml puromycin or 30μg/ml blasticidin and grown out as polyclonal populations.
Cell line/PDO line identification
Identity Rasless MEFs were verified through PCR amplification of cDNA followed by Sanger sequencing. KRAS-variants : FW-GACTGAATATAAACTTGTGGTAGTTGGAGCT, REV-TGTTTTCGAATTTCTCGAACTAATGTATAGAAGGC; Nested-SEQ-TGCTGATGTTTCAATAAAAGGAATTCCATAACTTCTTG. NRAS : FW-GAGTACAAACTGGTGGTGGTTGGAG, REV-CATCACCACACATGGCAATCCC; Nested-SEQ-CCCTGTCTGGTCTTGGCTG.
Identity PDO’s were Sanger sequence verified per point mutations in either TP53 (amplicon1: ACAACCAGGAGCCATTGTCTT and CCTCCCCTGCTTGCCAC; amplicon 2: CTGTGCAATAGTTAAACCCATTT and CAGCAGCTCCTACACCG), KRAS amplicon: CCGCAGAACAGCAGTCTG and TGATGTCACAATACCAAG; sequence primer CACCGATACACGTCTGCAGTCAAC), NRAS amplicon: GCAATTTGAGGGACAAACC and CCTCTCTGAAATTCCTTCG; sequence primer GTCATTCCCAGTAGCAAG) and BRAF amplicon: CTTCATAATGCTTGCTCTG and GCCTCAATTCTTACCATC; sequence primer CCTGCCTTAAATTGCATAC)
Western blot assay
Prior to cell lysis, organoids were incubated with 1 mg/ml dispase II (Invitrogen) for 10 minutes at 37° C to digest Matrigel. Western blot samples for phosphorylated ERK and MEK were lysed using RIPA buffer (50 mM Tris-HCL pH 8.0, 150 mM NaCl, 0.1% SDS, 0.5% Na-Deoxycholate, 1% NP-40) containing complete protease inhibitors (Roche). Protein content was quantified using a BCA protein assay kit (Pierce™) and analyzed by Western blot analysis. Membranes were blocked and probed with 1:1000 diluted antibodies directed against pEGFR(Y1068) (Cell Signaling, #2234), EGFR (Cell Signaling, #4267), Ras (BD Biosciences, RRID:AB_397425), pMEK1/2 (Ser217/221) (Cell Signaling, #9121, RRID:AB_331648), MEK1/2 (Cell Signaling, #9122, RRID:AB_823567), ERK1/2 (Cell Signaling, #4695, RRID:AB_390779), pERK1/2(Thr202/Tyr204) (Cell Signaling, #4370, RRID:AB_2315112), and Vinculin (Sigma-Aldrich, V9131, RRID:AB_477629).
3D Chrystollographic analysis
Fig. 1c was generated based on the pdb entry 3qhw using the programs Molscript66 and Raster3D67.
2D (FRET) microscopy on cell lines
For 2D microscopy experiments, cells were seeded on 35-mm diameter glass bottom wells and placed on a Leica SP8X inverted laser scanning confocal microscope, equipped with a 63x oil immersion objective (N.A. 1.4) or 40x water immersion objective (N.A. 1.10) and HyD avalanche detectors. The microscope was continuously held at 37C and sample was provided with humidified air, containing 6% CO2. To perform FRET time lapse imaging, cells were excited with 458nm Argon laser line and donor and acceptor emissions detected at 462-505nm and 508-550nm, respectively. ERK-KTR-mCherry was excited by the tunable white light laser (WLL), tuned at 585nm, with detection at 592-700nm. The Leica Automated Focus Control (AFC) was applied to ensure that cells were cross-sectioned at constant height, also during drug administration through pipetting. For direct comparison of different cell lines at identical experimental conditions, cells were seeded in separate compartments of (4-times) segmented glass-bottom wells (Greiner Bio-one, GmbH).
In search for alternative ERK1/2 substrates (Extended Data Fig. 2a,b), cells were positioned on microscope 30’ before experimentation. The first 10 min of imaging provided basal activity levels. Upon pathway activation, images were acquired for 20 min plus 40 min if inhibitors were subsequently added. Images were acquired at 2 min intervals for characterization of the biosensors performances and each 4 min to monitor biosensor behavior during mitosis. For FRET ratiometric measurements of EKAR-GW4.0 biosensor and its derivatives, widefield images were captured with a Nikon TiE inverted microscope with a 20x objective (N.A. 0.5), a DS-Qi2 CMOS camera and NIS-Elements acquisition software using JOBS module (Nikon). Ratio imaging used a 440/30 nm excitation filter, a t440/510/575rpc multi-band dichroic mirror and two emission filters (ET480/40 M (CFP) and AT545/30 M (YFP)). Lumencor provided excitation filters and all dichroic mirrors and emission filters were from Chroma Technology. Automated emission filter wheel Lambda 10-B Smart Shutter was from Sutter Instrument. YFP/CFP ratio was calculated per pixel on background-subtracted images, using custom routines (MatLab or NIS Element)
Correlated FRET acquisition and immunofluorescence staining
To ‘benchmark’ detection range of EKAREN5 to conventional ppERK staining, HeLa cells stably expressing EKAREN5 were seeded on cover slips with 500μm grid (Ibidi) 2 days before and serum-starved 1 day before the experiment. Cells were FRET time-lapsed as described above (1 frame/min). Fixation (paraformaldehyde, 4%, 20 min at RT) was performed instantly after acquisition. After permeabilization and immunostaining using primary antibody against ppERK1/2 (Thr202/Tyr204; Cell Signaling Technology, 4370S (RRID:AB_2315112); overnight 1:250 at RT; blocking solution 2% bovine serum albumin, 10% normal goat serum, and 50mM ammonium chloride in PBS) and secondary anti-rabbit antibody, conjugated to AlexaFluor568. Grid coordinates were used to (retro)-identify cells and imaged using Leica SP8 CLSM. Segmentation of nuclei was performed based on sensor (YPet) fluorescence. Signal (FRET and IF) was quantified from individual cells unless discarded (if unhealthy, multi-nucleated, mitotic, suboptimally trans-sectioned).
3D FRET microscopy in patient derived organoids
PDOs were trypsinized and deposited in 15μl drops of matrigel on glass-bottom dishes (Willco Wells BV). 7 days later, these were placed on aforementioned Leica SP8X microscope (40x-water-N.A.1.1, 37C, 6%CO2) using resonant scanning (8000 Hz), thereby drastically reducing phototoxic burden on the sample68. Short dwell times were compensated by frame averaging (50x). Excitation/emission settings as described for 2D FRET imaging. ~10-20 organoids with medium EKAREN5 expression were analyzed using multiple-position mode, z-stacks of ~8 x 2μm steps, and 2 and 4 minutes time interval. All in all, overnight PDO imaging was performed without signs of photobleaching.
To analyze drug responses, PDOs were seeded in 4x-segmented glass-bottom dishes. Alternatively, to compare drug responses between different PDO lines, each was deposited in clearly separated drops of matrigel on a glass-bottom dish, to ensure identical treatment conditions.
For calibration, full pathway inhibition was enforced by selumetinib (5μM) and SCH772984 (5μM). After multiple washing steps, full pathway activation was enforced by PMA (150nM) and, subsequently, phosphatase inhibitor okadaic acid (OA, 1μM). Single-cell max-FRET ratios (at saturation/plateau) could consistently be derived before cell death. Prior to the administration of PMA and OA, inhibitors were washed out manually using two simple syringes and tubing (BioRad), one to remove inhibitor and the other to replenish, thereby reducing inhibitor concentrations to negligable amounts within 1 minute. Leica’s ‘Best Focus’-function based on glass reflection was employed to correct movements in z-direction. Double normalization of final FRET traces was performed only if super-activation induced a plateau level reflecting sensor saturation.
FRET ratios are designated “YFP/CFP” at y-axes, referring to the classical fluorophore couple (rather than YPet/Turquoise2).
Multimodal FRET analysis macro
A custom-made FRET analysis macro in ImageJ/Fiji was generated. The basic architecture requires loading of imaging data, background subtraction, optional cropping (in XY and/or time), optional de-jittering, optional pixel shift correction, and user-guided thresholding to set background pixels to NaN. Next, scripted loops enable multiple analyses from these pre-processed channels ad infinitum, e.g. for consecutive analysis of single cells. Analyses are defined by ROIs, manually generated through either automated cell-tracking, manual drawing, intensity-based thresholding or combinations thereof. Automated cell-tracking includes watershedding for particle separation. Manual drawing includes ImageJ’s ‘ROI interpolation’ function; a minimum of drawn ROIs are ‘morphed’ to cover all time points. Drawing can be performed loosely, since undesired pixels from neighboring cells/nuclei can be automatically cleared. Intensity-based thresholding can be performed based on any channel and can be varied over the time course. Finally, defined ROI sets can be ‘shrinked’ to exclude artefact-prone pixels bordering the nuclei, possibly resulting from out-of-focus emission light.
Output ratio traces are calculated as [ROI-mean-acceptor-fluo]/[ROI-mean-donor-fluo] per time point. By default, saved outputs are : 1) movie (avi-format) combining fluorescence image, FRET image, generated ROIs and traces, thus allowing to associate features of the FRET trace to cellular behavior and/or pharmacological interferences (e.g. Supplementary Movies), 2) snapshots (same design, jpeg) for efficient archiving, 3) excel document, containing all raw readout data, e.g. absolute FRET ratios, baseline-normalized and double-normalized ratios. For the latter, user can indicate time intervals as reference values for normalization, e.g. intervals representing fully inhibited ERK pathway and fully activated ERK pathway.
To ensure optimal cross-sectioning of single cells through time in 3D EKAREN5-PDOs (XYZT), we generated the ‘plane-picking’ tool. In short : by simultaneous visualization of consecutive confocal z-planes (zoomed around cell-of-choice), it allows precise picking of optimal z-planes over consecutive time intervals. Extraction of ‘picked planes’ from the XYZT dataset yields an XYT time-lapse, ready for all above-mentioned analyses. Cells with significant movement in z (>8μm) were rare, but excluded when encountered. Although our ImageJ/Fiji-based script may not compete with professional software packages in terms of automated segmentation, calculation power and speed, in our hands it appeared the safest and best-controlled method to derive single-cell traces, free of artefact.
Besides single-cell analyses, we also performed ‘plane-analyses’, i.e. determination of overall FRET activity level per organoid. Pooling signal from all cells in such organoid trans-sections favors high signal-to-noise, suitable for quantitative determinations.
Recording and analysis of ERK fluctuations in double-sensor HeLa cells (KTR+FRET)
Clonal HeLa cell lines were generated with comparable ERK-KTR-mCherry and FRET sensor expression (see Extended Data Fig. 2e). Cells were seeded in identical densities on fibronectin-coated 4x-segmented glass bottom dishes (Greiner Bio-one, GmbH) and imaged under serum for 18 hours. KTR and FRET signals were simultaneously recorded in three cell lines (KTR + either EKAREV or EKAREN4 or EKAREN5) under identical experimental conditions.
Single-cell FRET-ratio plots were derived as described above. Image-analysis was extended to ERK-KTR-mCherry sensor. Nuclear ROIs, determined by nuclear EKAREV, were used to discriminate nucleus from cytosol. Output ratio values are calculated as [mean-fluo-in-cytosol]/[mean-fluo-in-nucleus] per time point.
Traces were normalized to baseline values and subjected to sliding averaging procedure in Excel prior to visual inspection. To focus on fluctuations within a defined amplitude range, traces were plotted at invariable scaling, i.e. within raster size of constant units (KTR, units of 0.05; FRET, units of 0.005; see Fig. 2e). Traces were scrutinized for KTR-deviations of pre-determined amplitude and subsequently evaluated whether these ERK fluctuations were mirrored by FRET signal. Scores represent the percentage of KTR-peaks co-recognized by FRET signal per single-cell recording (recordings containing <3 KTR-peaks were excluded).
Various automated analyses were performed to corroborate visually scored results. Peak numbers were counted by freely available MatLab script (MathWorks, Signal Processing Toolbox, R2018a) and for comparability, scores were normalized to peak numbers counted in ERK-KTR-traces (Extended Data Fig. 3e). To compare upward and downward movements of signal changes, we studied first derivatives of all traces (Excel) and assessed the percentage of time frames wherein both signal changes were positive (Extended Data Fig. 3f) or negative (Extended Data Fig. 3g). Finally, we studied signal versatility by counting ‘inflection’ points (Excel), which we defined as frames where second derivative crosses zero. (Extended Data Fig. 3h)All scores were normalized to ERK-KTR-traces.
Long-term growth assessment in CRC PDOs
5-day old EKAREN5-PDOs were dissociated from matrigel using dispase, size filtered (40μm pore) and replated in glass-bottom 96 well plates (Ibidi, Cat. 89646). XYZ-imaging at indicated time points with aforementioned SP8X Leica CSLM (10x-dry-N.A.0.4), resonant scanning (8000Hz), 514nm (Argon laser) excitation. Each pharmacological condition was repeated in 3 wells, with 4 z-stack (15x 12μm) acquisitions (positions) per well (thus, 12 z-stacks per condition). Per time point, same positions were scanned. Organoid number per time point (frequently >100) as indicated in figure (legend).
For analysis, 3D-stacks were maximum-projected and subjected to heavy gaussian blurring (ImageJ/Fiji script) before automated detection and size measurement of individual organoids (Columbus, Perkin-Elmer).
Immunohistochemistry (IHC) in PDX-derived tumor tissue
Formalin-fixed, paraffin-embedded tumor material from NOD (nonobese diabetic)/SCID (severe combined immunodeficient) mice (in compliance with all relevant ethical regulations) were used from a previous study50, and subjected to immunoperoxidase staining with rabbit anti-phospho-ERK (Thr202/Tyr204)(D13.14.4E) (Cell Signaling #4370).
After incubation with DakoEnVision+ System-HRP Labelled Polymer Anti-Rabbit secondary antibody (Dako #K4002), immunoreactivity was revealed by incubation in DAB chromogen (Dako) and sections were counterstained with Hematoxylin. Images were captured with the Leica LAS EZ software using a Leica DM LB microscope. Morphometric quantitation was performed by ImageJ software using spectral image segmentation. Software outputs were manually verified by visual inspection of digital images.
Statistics and Reproducibility
The results presented are representative of two or three independent experiments, unless otherwise indicated. Student’s t-tests were carried out using Microsoft Excel to calculate significance. *, differences were considered significant at p<0.05; or **, p<0.005; or ***, p<0.0005. Regression coefficients were calculated in Microsoft Excel. Results are expressed as mean ± standard deviation (s.d.) unless indicated otherwise.
In exceptional cases, biological replicate experiments yielded results of subtle variation, without affecting the general interpretation of the aimed research question. First, the dampening effect of selumetinib on autonomous ERK activity oscillations (Fig. 3b) was consistently observed, but formally the individual experiments were intentionally performed at variable selumetinib concentrations (Extended Data Fig. 6), resulting in alternative frequencies of ERK-reactivation. Second, comparison of EKAREN4 versus EKAREN5 (Extended Data Fig. 3a) consistently showed subtle decrease in FRET span (n=2), while the regression coefficients describing the effects of expression level were no exact copies.
Extended Data
Extended Data Fig. 1. CDK1/cyclinB phosphorylates EKAREV(Tq) during G2- and M-phase.
a, Typical mitotic EKAREV-FRET profile in HEK293 cells, including rising phase, steep increase at nuclear envelope breakdown (NEB) and sharp decline at anaphase (Supplementary Movie 1.) Corresponding snapshots of above cells with H2B-mScarlet support cell-cycle phases (20 cells; 1 experiment). 1, G2; 2, NEB; 3, metaphase; 4, anaphase; 5, cytokinesis (c.k.); 6, G1. FRET-signal relative to PMA saturation (150nM). Black, FRET-ratio of YPet(yellow)/Turq2(blue) intensities.
b, As a, with cell-cycle stages recognized by EKAREV(Tq) biosensor exclusion from condensed chromosomes; consistently observed (53 cells, 4 experiments).
c, As a, but EKAREV(Tq) biosensor lacking nuclear localization. Observed in 28 cells, 2 experiments.
d, As a, but EKAREV(TA) control biosensor that cannot be phosphorylated. Observed in 5 cells, 1 experiment.
e, EKAREV(Tq) FRET signal in mitotic arrested HEK293 cells (nocodazol, 0.83μM; 2hrs) is sensitive to CDK1 inhibitor RO-3306. In mitotic cells, recognized by absence of nuclear localization (NEB) of NLS-tagged biosensor (insert images), FRET decreased upon 10μM RO-3306 (9 cells; 2 experiments with similar results), or 3x 1μM (1 cell). e’, Loss of normalized FRET signal (ΔR, %) upon RO-3306 (10μM) or MAPK pathway inhibitors (sel+SCH, 5μM each). Box-and-whisker plots: boxes represent quartile 2 and 3, horizontal line represents median, whiskers represent minimum and maximum within 1,5x interquartile range. RO-3306: n=23 cells, sel+SCH n=16 cells.
f, EKAREV(Tq) FRET signal is sensitive to CDK1-inhibition in G2-phase. Synchronized cells were imaged before, during and after incubation with RO-3306 (10μM) and retrospectively analyzed if mitotic entry was observed <15 minutes after drug washout (n=23 cells). Right, similar experiment, here inhibiting MEK and ERK (n=20 cells). Graph shows mean±s.d. of baseline-normalized traces.
g, As f, monitoring G2-phase in HeLa cells (n=19) co-expressing ERK-KTR-mCherry and EKAREV(Tq). ERK-KTR biosensor suffers from same undesired CDK1-sensitivity.
***, two-sided student’s T-test, p<0.0005. Scale bar, 10μm.
Extended Data Fig. 2. Improving ERK specificity, generating EKAREN4.
a, HeLa cells expressing EKAREV substrate variants Alt_ERK_Substr_1-6 (Extended Data Fig. 4b). PMA, 500nM; SCH, 10μM. Right, responses (mean±s.d.), normalized to EKAREV-GW4.0.
b, HeLa cells expressing EKAREV-GW variants were arrested in mitosis (Extended Data Fig. 1e) to test CDK1/cyclinB sensitivity (RO-3306). Purple, mean of individual traces. Right, overview for several variants, mean ratio loss ± s.e.m. Best responder EKAREV-GW(Alt_substr._6) is compromised by RO-sensitivity.
c, Repeat of Fig. 1e, quantifying FRET in G2- and M-phase HEK293 cells (mean ± s.d), complemented with results from third-residue-substitution variants (purple). No improvements compared to EKAREN4/EKAREN5.
d, Sensor dephosphorylation kinetics, assessed by instant ERK inactivation (sel+SCH, 5μM) after initial sensor saturation (PMA). For identical experimental conditions, HEK293 stably expressing EKAREV(Tq) or EKAREN4 were mixed. H2B-mScarlet selectively marked EKAREV(Tq) (left) or EKAREN4 cells (right) (insets: scale, 25μm). Cells analyzed individually and averaged after double normalization (baseline and PMA-plateau).
e, Maximum FRET range (ΔR(%), approximated through saturation (PMA) in serum-starved HEK293 cells of widely variable expression levels. e’, Baseline and plateau ratios corresponding to cells in e. Increased FRET range of EKAREN4 likely results from elevated plateau ratios. Expression levels affect FRET range by differentially affecting baseline ratios (see slopes in a.u.). Experiment performed twice.
f, As e, differential effect of expression level on FRET range is similar for ERK-insensitive control sensors EKAREV(TA) and EKAREN4(TA).
g, Mean (± s.d.) ΔR per expression level category (see e). For panels a-g the n numbers represent cells and are indicated in the graph for each group. Box-and-whiskers: boxes represent quartile 2 and 3, horizontal line represents median, whiskers represent minimum and maximum within 1,5x interquartile range. Dots are outliers. P values in all relevant panels were calculated using a two-sided student’s T-test, * p<0.05; ***, p<0.0005. n.s., non-significant.
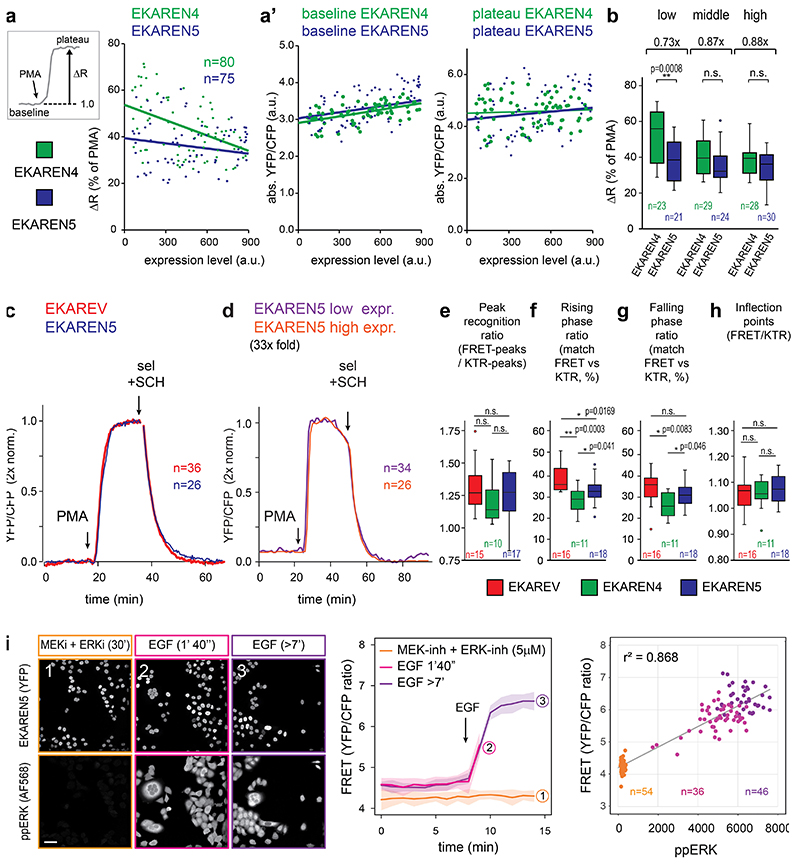
Extended Data Fig. 3. Multi-dimensional analyses comparing EKAREV, EKAREN4 and EKAREN5.
a, FRET-range versus sensor expression level, as in Extended Data Fig. 2e (EKAREN4, n=80 cells; EKAREN5, n=75 cells). a’, baseline and plateau ratios corresponding to cells plotted in a.
b, Means (± s.d.) of ΔR from a, calculated in three expression level categories (as in Extended Data Fig. 2g).
c, Dephosphorylation kinetics of EKAREN5 were directly compared with EKAREV(Tq) (as Extended Data Fig. 2d). Retrospective unmixing was based on clustering plateau amplitudes (PMA) (see Fig. 2a). Experiment performed once.
d, As in c, comparing phosphorylation and dephosphorylation kinetics of EKAREN5 with ~33-fold expression level difference. Co-seeded high and low expressors were simultaneously monitored. Experiment performed three times.
e-h, Various automated analyses on autonomous ERK fluctuations of HeLa cells (dataset of Fig. 2f,g), registered simultaneously by ERK-KTR-mCherry and either of EKAREV/EKAREN FRET sensors. EKAREV, n=15 single-cell traces; EKAREN4, n=10 single-cell traces; EKAREN5, n=17 single-cell traces.
e, Automated peak counting per individual cell.
f, Temporal matching of rising phases in KTR versus FRET signals.
g, Temporal matching of falling phases in KTR versus FRET signals.
h, Counted ‘inflection’ points per trace, i.e. points where ERK changes accelerate or decelerate(see Methods).
i, Correlation between EKAREN5-FRET and ppERK staining (mean nuclear signal). After various ERK manipulations, HeLa-EKAREN5 cells were FRET-imaged and fixed instantly after acquisition, yielding various ERK activity states between complete inhibition (MEKi+ERKi) and pathway saturation (>7 min EGF). Grey line, regression analysis (y=ax+b). Traces are mean ratios ± s.d.
For panels a-i the n numbers represent cells and are indicated in the graph for each group. Box-and-whisker plots: boxes represent quartile 2 and 3, horizontal line represents median, whiskers represent minimum and maximum within 1,5x interquartile range. Dots, outliers.
Scale bar, 50μm. Two-sided student’s T-tests: *, p<0.05; **, p<0.005; n.s., non-significant.
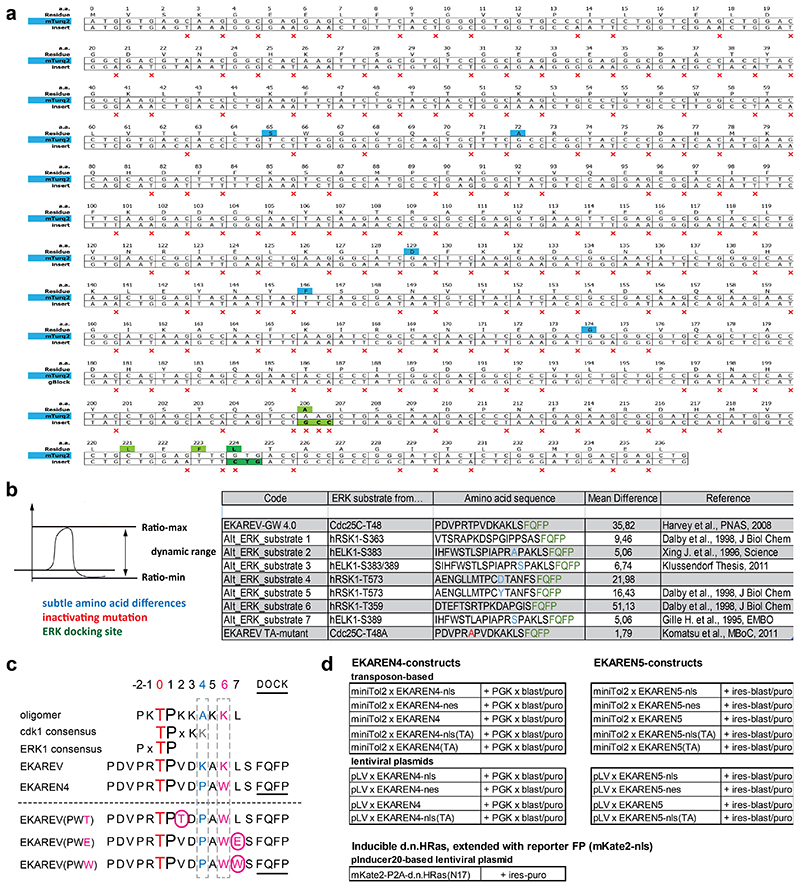
Extended Data Fig. 4. Biosensor sequences.
a, Silent mutations introduced into Turquoise2 (insert) to minimize sequence homology with the YPet fluorophore in the same construct. Red ‘x’ marks silent mutations. Blue, residues discriminating Turquoise2 from parental eCFP (Goedhart et al., 2012). Green, residues rendering Turquoise2 prone to dimerize with YPet, in analogy to EKAREV design (Komatsu et al., 201128). Dark green, the V224L mutation was added to further enhance dimerization and, hence, FRET efficiency in ON-state (Vinkenborg et al., 200732).
b, Alternative ERK substrate sequences were derived from ERK targets RSK1 (human) and ELK1 (human) using the Kinexus website and compared to parental EKAREV-GW-4.0 (GW = GateWay) with CDC25C substrate sequence.
c, Overview of generated and tested point mutant variants of EKAREV. Red, central Threonine, target of ERK phosphorylation. Blue, the Lysine at position +4 mimics the general CDK1-consensus site, mutated to Proline (K->P). Purple, the Lysine at position +6 mimics the CDK1-consensus site and mutated to bulky Trp (K->W) to create steric hindrance with cyclinB. Underlined, ERK docking domain FQFP. Purple boxed characters, rational attempts to further eliminate CDK1-sensitivity with third amino acid replacements. V422T was aimed at favoring ERK over CDK1 consensus site; L427W was aimed at further augmenting sterical hinderance of cyclinB interaction; L427E was aimed at impeding cyclinB interaction through electrostatic repulsion. The Asp (D) at position+3 was left unchanged for its reported importance for the Pin1 affinity (Komatsu et al., 201128).
d, Summary of available EKAREN4 and EKAREN5 plasmid constructs (including variable targeting motifs and Thr-Ala control versions), as well as adapted version of pInducer20 (Meerbrey et al., 201145) to initiate expression of HRASN17 and P2A-coupled reporter fluorophore mKate2-NLS.
Extended Data Fig. 5. Geometric effects on raw FRET signals in 3D organoid models.
a, PDO model expressing the non-phosphorylatable (hence ERK-insensitive) control sensor EKAREV(TA) was FRET-imaged to assess non-biological geometry effects on raw signals in 3D organoid FRET microscopy. YFP/CFP ratios can differ between organoids situated either far away or close to the objective (distance difference ~150 μm). Experiment performed once, this direct comparison representing general observations.
b, Performing FRET acquisition, Turq2 and YPet emissions were determined from all cells of a bulky organoid (>200 cells) and plotted against their z-coordinates. YFP/CFP ratios increase subtly with increasing depth within the organoid, likely due to differential scattering-induced loss of fluorescence between the two fluorophores. Experiment performed twice with same outcome.
Extended Data Fig. 6. Single-cell ERK responses in organoids to various doses of selumetinib.
a, As in Fig. 3b, here using selumetinib at 50nM concentration. Shown are 33 single-cell analyses from two p9T organoids. Right, waterfall plot summarizing cellular recovery from ERK inhibition (see also Fig. 3b).
b, Exact copy of Fig. 3b, using selumetinib at 200nM concentration. Shown are 59 single-cell analyses from three p9T organoids. Right, waterfall plot summarizing the cellular recovery from ERK inhibition.
c, As in Fig. 3b, here using selumetinib at 1μM concentration. Shown are 42 single-cell analyses from three p9T organoids. Right, waterfall plot summarizing the recovery from ERK inhibition.
d, Three example FRET traces to illustrate the power of time-resolved signal transduction analysis. Trace colours correspond to bars indicated with coloured arrows in waterfall plot of c. Top, cell displaying onset of recovery, interrupted by super-inhibition. Middle, selumetinib-induced inhibition is followed by a sustained phase without apparent recovery. Bottom, inhibitory effect is more prolonged, explaining negative outcome for Recovery (= ‘Recov’ – ‘Inh’). Grey, green and purple colours correspond with bars in waterfall plot of Extended Data Fig. 6b.
Extended Data Fig. 7. EGFR plays a central role in generating pulsatile ERK dynamics in PDO-KRASG12V .
a, Fluctuating ERK dynamics in PDO-KRASG12V, abolished by afatinib at 50nM concentration. Shown traces are representative for 14 single-cell analyses from 3 PDOs. Experiment performed twice.
b, As a, loss of ERK activity oscillations, observed in PDO-KRASG12V upon administration of pan-HER inhibitors lapatinib (1μM, 21 cells), dacometinib (500nM, 12 cells), or EGFR-specific inhibitors erlotinib (500nM, 17 cells) and gefinitib (500nM, 18 cells). Two independent experiments performed. ~5 organoids per condition.
c, As a, loss of ERK oscillations, observed in PDO-KRASG12V upon anti-EGFR antibody cetuximab (500 ng/ml). Residual ERK activity was sensitive to trametinib (MEKi). Experiment performed once; 30 cells analyzed.
d, Oscillating ERK dynamics persist in PDO-KRASG12V despite HER2-inhibitor CP-724714 (5μM). Three traces representative for 24 single-cell analyses, from one experiment with 4 organoids.
e, FRET-trace demonstrating that afatinib (200nM) instantly interrupts rising phase of pulsatile ERK (arrow). Representative for >20 observations in various PDO-lines.
f, Shp2-inhibitor SHP099 (5μM) abrogates autonomous ERK activity in PDO-KRASG12C, but not BRAFV600E(#4). Shown are representative multi-cellular z-plane analyses. Experiment performed once; 3 organoids. f’ BRAFV600E(#4) is similarly unresponsive to drugs targeting Src (KX2, 500nM), FAK (PND-1186, 500nM) and cKit/PDGFR/Bcr-Abl (dovitinib, 100nM; imatinib, 1.0 μM; masitinib, 100nM; pazopanib, 250nM). Shown are 2x-normalized ratios (mean±s.d.). n numbers represent PDOs and are indicated in the graph per group. Experiment performed once.
g, Adapted pInducer20 for doxycyclin-inducible expression of HRASN17 and P2A-coupled reporter mKate2-NLS (TRE2, Tet-Responsive Element). Western blot demonstrating doxycyclin-mediated induction of HRASN17 expression (general anti-RAS antibody) in BRAFV600E(#3)(EKAREN5+pInducer). S.E., short exposure; L.E., long exposure. Vinculin as loading control. Experiment performed once.
h, Western blot analyses on indicated PDOs illustrating pan-HER inhibition on components of the linear EGFR-MAPK-pathway. Pharmacological treatments as in Fig. 4e. Experiment performed once.
Extended Data Fig. 8. Single-cell drug response upon long-term exposure to EGFR inhibitors.
a, Single-cell analyses from data set presented in Fig 7b. After 72 hrs afatinib (1μM), EKAREN5 showed constant, non-oscillatory basal ERK signal. Rare activity spikes in few cells were observed in PDO-NRASQ61H and BRAFV600E(#3).
b, Single-cell drug response analysis after 8 days of afatinib treatment (1μM). ERK dynamics in EGFR-inhibited PDO-KRASG12C (63 cells in 6 organoids) and PDO-NRASQ61H (70 cells in 5 organoids) are constant, non-oscillatory in nature. Depletion of the continuous oscillatory dynamics unmasked a hidden pattern of (EGFR-independent) rare activity spikes in few cells (one per ~30 hr (19 pulses observed in 571 hours of single-cell signaling evaluation). Never were two pulses observed in one single-cell derivation. Plots show all single cell analyses from multiple organoids or from a single representative organoid. Dotted line: to indicate that the two pulses are from separate cells.
Extended Data Fig. 9. Examining clinical relevant drug therapy on BRAF mutant PDO.
a, Growth assay performed as in Fig. 7c,d, here monitoring the BRAFV600E mutant PDOs #1, #2 and #3 under treatment with drugs from clinical trial by Kopetz et al. (NEJM, 20197). Cetuximab, 1000 ng/ml; binimetinib (MEK-inh), 100nM; encorafenib (BRAF-inh), 300nM. Mean number of objects per time point: BRAFV600E(#1), n=84; BRAFV600E(#2), n=62; BRAFV600E(#3), n=78. For the exact n-numbers of all presented points, see Source Data file. Data are represented as mean size ± s.e.m. Growth medium was supplemented with 200x reduced EGF concentration (0.25 ng/ml) to minimize competition between cetuximab and EGF ligand. Experiment performed once.
b, In same PDO lines, ERK responses were recorded using EKAREN5-FRET. Data are represented as mean value ± s.d. Q uantification scheme based on double calibrated multi-cellular z-plane analyses (n numbers represent PDOs and are indicated in the graph for each group). ERK levels were maximally reduced in presence of triple combination.
Box-and-whisker plots: boxes represent quartile 2 and 3, horizontal line represents median, whiskers represent minimum and maximum within 1,5x interquartile range. Dots are outliers.
Supplementary Material
Supplementary Discussion of the characterization and applications of ERK biosensors. This discussion summarizes and analyses observations made during the optimization of this ERK biosensor.
Overview of driver mutations present in the panel of KRASG12X and BRAFV600E mutant CRC organoids used in this study. Left, CRC PDOs drawn from23. Right, CRC PDOs drawn from Foundation Hubrecht Organoid Technology (HUB).
Analysis of EKAREV(Tq) FRET in HEK293 cell during G2- and M-phase. The time-lapse movie corresponds to Extended Data Fig. 1a. From left to right: co-expressed H2B-mScarlet marks the mitotic stages, sensor fluorescence (Turquoise2), FRET ratio movie, normalized ratio curve (YFP/CFP) corresponding to the drawn ROIs. PMA was added to induce sensor saturation (time point t127).
Top, EKAREN5-FRET. From left to right: sensor fluorescence, FRET ratio, normalized ratio curve (YFP/CFP) corresponding to the drawn ROIs. Bottom, KTR analysis in same cell. From left to right: FRET sensor (used to demarcate the nucleus), KTR sensor (shown ROI defines cytosolic compartment), normalized ratio curve (cytosol/nucleus). Note the variety of peak amplitudes.
Single-cell analyis of one of the two neighbor cells shown in Fig. 3b. From left to right: sensor fluorescence (Turquoise2), FRET ratio movie, normalized ratio curve (YFP/CFP) corresponding to the drawn ROIs.
Single-cell analyis shown in Fig. 4b’. From left to right: sensor fluorescence (Turquoise2), FRET ratio movie, normalized ratio curve (YFP/CFP) corresponding to the drawn ROIs. Before addition of afatinib (200nM), all cells show oscillatory ERK activity behavior.
Acknowledgements
We thank members of Snippert, Riquet and Trusolino laboratories for reagents, suggestions and discussions. We thank M. Gloerich for careful reading of the manuscript. This work is part of the Oncode Institute, which is partly financed by the Dutch Cancer Society and was funded by the Gravitation Program CancerGenomics.nl from the Netherlands Organisation for Scientific Research (NWO), by a grant from the Dutch Cancer Society (KWF/UU2013-6070 to H.J.G.S.), ERC starting grant (IntratumoralNiche, to H.J.G.S.), a ‘Sta op tegen Kanker’ International Translational Cancer Research grant (JLB). Stand Up to Cancer is a program administered by the AACR.
Research was further supported by EOS MODEL-IDI (FWO Grant 30826052), iBOF ATLANTIS (BOF20/IBF/039), FWO research grants (G.0E04.16N, G.0C76.18N, G.0B71.18N, G.0B96.20N), Methusalem (BOF16/MET_V/007), Foundation against Cancer (F/2016/865, F/2020/1505), CRIG and GIGG consortia, and VIB to PV. This research was supported by the Agence Nationale pour la Recherche (ANR) via the G2Progress program (ANR-13-BSV2-0016-02) to FR. FR acknowledges Nikon BELUX partnership and funding from Oseo - Ministère de l’enseignement supérieur et de la recherche via the national contest 2013 d’aide à la création d’entreprise de technologies innovantes catégorie émergence in the context of the KiBioS spin-off project. This collaborative work was encouraged by the CNRS Groupement de recherche (GDR) 2588 “Microscopie et Imagerie du Vivant” scientific community via the biosensor workgroup initiative and especially during IMOB2018.
Additional funding was provided by AIRC, Associazione Italiana per la Ricerca sul Cancro, Investigator Grants 20697 (to AB) and 22802 (to LT); AIRC 5x1000 grant 21091 (to AB and LT); AIRC/CRUK/FC AECC Accelerator Award 22795 (to LT); European Research Council Consolidator Grant 724748 – BEAT (to AB); H2020 grant agreement no. 754923 COLOSSUS (to LT); H2020 INFRAIA grant agreement no. 731105 EDIReX (to AB); and Fondazione Piemontese per la Ricerca sul Cancro-ONLUS, 5x1000 Ministero della Salute 2014, 2015 and 2016 (to LT). AB and LT are members of the EurOPDX Consortium.
Footnotes
Author Contributions
BP and HJGS conceived and oversaw the project.
BP, JBd’A, HR, FR, JLB and HJGS wrote the manuscript.
FR and PV provided grant support and oversaw experiments.
BP, JBP, JLB, LT, FR and HJGS designed experiments.
BP, RLvI, SK, JBd’A, DL, FS (F. Sipieter) and BC performed FRET microscopy.
JBP and SM performed Western blots.
HR analyzed chrystallography data.
AB and FS (F. Sassi) performed and analyzed in vivo experiments
IVK assisted with organoid culture.
RV and SFB provided PDO material.
Competing Interests
The authors declare no competing interests.
Code Availability
Custom-written ImageJ/Fiji-scripts that were used to analyze 2D and 3D FRET data are available from the corresponding author upon request.
Data Availability
All data supporting the findings of this study are available from the corresponding author on reasonable request.
References
- 1.Ryan MB, Corcoran RB. Therapeutic strategies to target RAS-mutant cancers. Nat Rev Clin Oncol. 2018;15:709–720. doi: 10.1038/s41571-018-0105-0. [DOI] [PubMed] [Google Scholar]
- 2.Yaeger R, Corcoran RB. Targeting Alterations in the RAF-MEK Pathway. Cancer Discov. 2019;9:329–341. doi: 10.1158/2159-8290.CD-18-1321. [DOI] [PMC free article] [PubMed] [Google Scholar]
- 3.Karnoub AE, Weinberg RA. Ras oncogenes: split personalities. Nat Rev Mol Cell Biol. 2008;9:517–531. doi: 10.1038/nrm2438. [DOI] [PMC free article] [PubMed] [Google Scholar]
- 4.Yao Z, et al. BRAF Mutants Evade ERK-Dependent Feedback by Different Mechanisms that Determine Their Sensitivity to Pharmacologic Inhibition. Cancer Cell. 2015;28:370–383. doi: 10.1016/j.ccell.2015.08.001. [DOI] [PMC free article] [PubMed] [Google Scholar]
- 5.Corcoran RB, et al. Combined BRAF, EGFR, and MEK Inhibition in Patients with BRAF(V600E)-Mutant Colorectal Cancer. Cancer Discov. 2018;8:428–443. doi: 10.1158/2159-8290.CD-17-1226. [DOI] [PMC free article] [PubMed] [Google Scholar]
- 6.van Geel R, et al. A Phase Ib Dose-Escalation Study of Encorafenib and Cetuximab with or without Alpelisib in Metastatic BRAF-Mutant Colorectal Cancer. Cancer Discov. 2017;7:610–619. doi: 10.1158/2159-8290.CD-16-0795. [DOI] [PMC free article] [PubMed] [Google Scholar]
- 7.Kopetz S, et al. Encorafenib, Binimetinib, and Cetuximab in BRAF V600E-Mutated Colorectal Cancer. N Engl J Med. 2019;381:1632–1643. doi: 10.1056/NEJMoa1908075. [DOI] [PubMed] [Google Scholar]
- 8.Amodio V, et al. EGFR Blockade Reverts Resistance to KRAS(G12C) Inhibition in Colorectal Cancer. Cancer Discov. 2020;10:1129–1139. doi: 10.1158/2159-8290.CD-20-0187. [DOI] [PMC free article] [PubMed] [Google Scholar]
- 9.Huijberts S, et al. Phase I study of lapatinib plus trametinib in patients with KRAS-mutant colorectal, non-small cell lung, and pancreatic cancer. Cancer Chemother Pharmacol. 2020;85:917–930. doi: 10.1007/s00280-020-04066-4. [DOI] [PubMed] [Google Scholar]
- 10.Prahallad A, et al. Unresponsiveness of colon cancer to BRAF(V600E) inhibition through feedback activation of EGFR. Nature. 2012;483:100–103. doi: 10.1038/nature10868. [DOI] [PubMed] [Google Scholar]
- 11.Sun C, et al. Intrinsic resistance to MEK inhibition in KRAS mutant lung and colon cancer through transcriptional induction of ERBB3. Cell Rep. 2014;7:86–93. doi: 10.1016/j.celrep.2014.02.045. [DOI] [PubMed] [Google Scholar]
- 12.Corcoran RB, et al. EGFR-mediated re-activation of MAPK signaling contributes to insensitivity of BRAF mutant colorectal cancers to RAF inhibition with vemurafenib. Cancer Discov. 2012;2:227–235. doi: 10.1158/2159-8290.CD-11-0341. [DOI] [PMC free article] [PubMed] [Google Scholar]
- 13.Moll HP, et al. Afatinib restrains K-RAS-driven lung tumorigenesis. Sci Transl Med. 2018;10 doi: 10.1126/scitranslmed.aao2301. [DOI] [PMC free article] [PubMed] [Google Scholar]
- 14.Ardito CM, et al. EGF receptor is required for KRAS-induced pancreatic tumorigenesis. Cancer Cell. 2012;22:304–317. doi: 10.1016/j.ccr.2012.07.024. [DOI] [PMC free article] [PubMed] [Google Scholar]
- 15.Navas C, et al. EGF receptor signaling is essential for k-ras oncogene-driven pancreatic ductal adenocarcinoma. Cancer Cell. 2012;22:318–330. doi: 10.1016/j.ccr.2012.08.001. [DOI] [PMC free article] [PubMed] [Google Scholar]
- 16.Albeck JG, Mills GB, Brugge JS. Frequency-modulated pulses of ERK activity transmit quantitative proliferation signals. Mol Cell. 2013;49:249–261. doi: 10.1016/j.molcel.2012.11.002. [DOI] [PMC free article] [PubMed] [Google Scholar]
- 17.Aoki K, et al. Stochastic ERK activation induced by noise and cell-to-cell propagation regulates cell density-dependent proliferation. Mol Cell. 2013;52:529–540. doi: 10.1016/j.molcel.2013.09.015. [DOI] [PubMed] [Google Scholar]
- 18.Muta Y, et al. Composite regulation of ERK activity dynamics underlying tumour-specific traits in the intestine. Nat Commun. 2018;9:2174. doi: 10.1038/s41467-018-04527-8. [DOI] [PMC free article] [PubMed] [Google Scholar]
- 19.Bugaj LJ, et al. Cancer mutations and targeted drugs can disrupt dynamic signal encoding by the Ras-Erk pathway. Science. 2018;361 doi: 10.1126/science.aao3048. [DOI] [PMC free article] [PubMed] [Google Scholar]
- 20.Vlachogiannis G, et al. Patient-derived organoids model treatment response of metastatic gastrointestinal cancers. Science. 2018;359:920–926. doi: 10.1126/science.aao2774. [DOI] [PMC free article] [PubMed] [Google Scholar]
- 21.Ganesh K, et al. A rectal cancer organoid platform to study individual responses to chemoradiation. Nat Med. 2019;25:1607–1614. doi: 10.1038/s41591-019-0584-2. [DOI] [PMC free article] [PubMed] [Google Scholar]
- 22.Yao Y, et al. Patient-Derived Organoids Predict Chemoradiation Responses of Locally Advanced Rectal Cancer. Cell Stem Cell. 2020;26:17–26 e16. doi: 10.1016/j.stem.2019.10.010. [DOI] [PubMed] [Google Scholar]
- 23.van de Wetering M, et al. Prospective derivation of a living organoid biobank of colorectal cancer patients. Cell. 2015;161:933–945. doi: 10.1016/j.cell.2015.03.053. [DOI] [PMC free article] [PubMed] [Google Scholar]
- 24.Fujii M, et al. A Colorectal Tumor Organoid Library Demonstrates Progressive Loss of Niche Factor Requirements during Tumorigenesis. Cell Stem Cell. 2016;18:827–838. doi: 10.1016/j.stem.2016.04.003. [DOI] [PubMed] [Google Scholar]
- 25.Pauli C, et al. Personalized In Vitro and In Vivo Cancer Models to Guide Precision Medicine. Cancer Discov. 2017;7:462–477. doi: 10.1158/2159-8290.CD-16-1154. [DOI] [PMC free article] [PubMed] [Google Scholar]
- 26.Verissimo CS, et al. Targeting mutant RAS in patient-derived colorectal cancer organoids by combinatorial drug screening. Elife. 2016;5 doi: 10.7554/eLife.18489. [DOI] [PMC free article] [PubMed] [Google Scholar]
- 27.Regot S, Hughey JJ, Bajar BT, Carrasco S, Covert MW. High-sensitivity measurements of multiple kinase activities in live single cells. Cell. 2014;157:1724–1734. doi: 10.1016/j.cell.2014.04.039. [DOI] [PMC free article] [PubMed] [Google Scholar]
- 28.Komatsu N, et al. Development of an optimized backbone of FRET biosensors for kinases and GTPases. Mol Biol Cell. 2011;22:4647–4656. doi: 10.1091/mbc.E11-01-0072. [DOI] [PMC free article] [PubMed] [Google Scholar]
- 29.Kamioka Y, et al. Live imaging of protein kinase activities in transgenic mice expressing FRET biosensors. Cell Struct Funct. 2012;37:65–73. doi: 10.1247/csf.11045. [DOI] [PubMed] [Google Scholar]
- 30.Goedhart J, et al. Structure-guided evolution of cyan fluorescent proteins towards a quantum yield of 93% Nat Commun. 2012;3:751. doi: 10.1038/ncomms1738. [DOI] [PMC free article] [PubMed] [Google Scholar]
- 31.Komatsubara AT, Matsuda M, Aoki K. Quantitative analysis of recombination between YFP and CFP genes of FRET biosensors introduced by lentiviral or retroviral gene transfer. Sci Rep. 2015;5 doi: 10.1038/srep13283. 13283. [DOI] [PMC free article] [PubMed] [Google Scholar]
- 32.Vinkenborg JL, Evers TH, Reulen SW, Meijer EW, Merkx M. Enhanced sensitivity of FRET-based protease sensors by redesign of the GFP dimerization interface. Chembiochem. 2007;8:1119–1121. doi: 10.1002/cbic.200700109. [DOI] [PubMed] [Google Scholar]
- 33.Cost H, Barreau P, Basset M, Le Peuch C, Geny B. Phorbol myristate acetate inhibits phosphoinositol lipid-specific phospholipase C activity via protein kinase C activation in conditions inducing differentiation in HL-60 cells. Cell Biochem Funct. 1991;9:263–273. doi: 10.1002/cbf.290090408. [DOI] [PubMed] [Google Scholar]
- 34.Bonnet J, Mayonove P, Morris MC. Differential phosphorylation of Cdc25C phosphatase in mitosis. Biochem Biophys Res Commun. 2008;370:483–488. doi: 10.1016/j.bbrc.2008.03.117. [DOI] [PubMed] [Google Scholar]
- 35.Franckhauser C, Mamaeva D, Heron-Milhavet L, Fernandez A, Lamb NJ. Distinct pools of cdc25C are phosphorylated on specific TP sites and differentially localized in human mitotic cells. PLoS One. 2010;5:e11798. doi: 10.1371/journal.pone.0011798. [DOI] [PMC free article] [PubMed] [Google Scholar]
- 36.Bao ZQ, Jacobsen DM, Young MA. Briefly bound to activate: transient binding of a second catalytic magnesium activates the structure and dynamics of CDK2 kinase for catalysis. Structure. 2011;19:675–690. doi: 10.1016/j.str.2011.02.016. [DOI] [PMC free article] [PubMed] [Google Scholar]
- 37.Holt LJ, et al. Global analysis of Cdk1 substrate phosphorylation sites provides insights into evolution. Science. 2009;325:1682–1686. doi: 10.1126/science.1172867. [DOI] [PMC free article] [PubMed] [Google Scholar]
- 38.King C, Sarabipour S, Byrne P, Leahy DJ, Hristova K. The FRET signatures of noninteracting proteins in membranes: simulations and experiments. Biophys J. 2014;106:1309–1317. doi: 10.1016/j.bpj.2014.01.039. [DOI] [PMC free article] [PubMed] [Google Scholar]
- 39.Sparta B, et al. Receptor Level Mechanisms Are Required for Epidermal Growth Factor (EGF)-stimulated Extracellular Signal-regulated Kinase (ERK) Activity Pulses. J Biol Chem. 2015;290:24784–24792. doi: 10.1074/jbc.M115.662247. [DOI] [PMC free article] [PubMed] [Google Scholar]
- 40.Gillies TE, Pargett M, Minguet M, Davies AE, Albeck JG. Linear Integration of ERK Activity Predominates over Persistence Detection in Fra-1 Regulation. Cell Syst. 2017;5:549–563 e545. doi: 10.1016/j.cels.2017.10.019. [DOI] [PMC free article] [PubMed] [Google Scholar]
- 41.Aoki K, et al. Propagating Wave of ERK Activation Orients Collective Cell Migration. Dev Cell. 2017;43:305–317 e305. doi: 10.1016/j.devcel.2017.10.016. [DOI] [PubMed] [Google Scholar]
- 42.Harvey CD, et al. A genetically encoded fluorescent sensor of ERK activity. Proc Natl Acad Sci U S A. 2008;105:19264–19269. doi: 10.1073/pnas.0804598105. [DOI] [PMC free article] [PubMed] [Google Scholar]
- 43.Dymond AW, et al. Metabolism, Excretion, and Pharmacokinetics of Selumetinib, an MEK1/2 inhibitor, in Healthy Adult Male Subjects. Clin Ther. 2016;38:2447–2458. doi: 10.1016/j.clinthera.2016.09.002. [DOI] [PubMed] [Google Scholar]
- 44.Gerosa L, Chidley C, Froehlich F, Sanchez G, Lim SK, Muhlich J, Chen JY, Baker GJ, Schapiro D, Shi T, Yi L, et al. Sporadic ERK pulses drive non-genetic resistance in drug-adapted BRAFV600E melanoma cells. BioRxiv. 2019 doi: 10.1101/762294. [DOI] [Google Scholar]
- 45.Meerbrey KL, et al. The pINDUCER lentiviral toolkit for inducible RNA interference in vitro and in vivo. Proc Natl Acad Sci U S A. 2011;108:3665–3670. doi: 10.1073/pnas.1019736108. [DOI] [PMC free article] [PubMed] [Google Scholar]
- 46.de Vries-Smits AM, Burgering BM, Leevers SJ, Marshall CJ, Bos JL. Involvement of p21ras in activation of extracellular signal-regulated kinase 2. Nature. 1992;357:602–604. doi: 10.1038/357602a0. [DOI] [PubMed] [Google Scholar]
- 47.Canon J, et al. The clinical KRAS(G12C) inhibitor AMG 510 drives anti-tumour immunity. Nature. 2019;575:217–223. doi: 10.1038/s41586-019-1694-1. [DOI] [PubMed] [Google Scholar]
- 48.Waters AM, et al. Evaluation of the selectivity and sensitivity of isoform- and mutation-specific RAS antibodies. Sci Signal. 2017;10 doi: 10.1126/scisignal.aao3332. [DOI] [PMC free article] [PubMed] [Google Scholar]
- 49.Matano M, et al. Modeling colorectal cancer using CRISPR-Cas9-mediated engineering of human intestinal organoids. Nat Med. 2015;21:256–262. doi: 10.1038/nm.3802. [DOI] [PubMed] [Google Scholar]
- 50.Bertotti A, et al. A molecularly annotated platform of patient-derived xenografts (“xenopatients”) identifies HER2 as an effective therapeutic target in cetuximab-resistant colorectal cancer. Cancer Discov. 2011;1:508–523. doi: 10.1158/2159-8290.CD-11-0109. [DOI] [PubMed] [Google Scholar]
- 51.Hiratsuka T, et al. Intercellular propagation of extracellular signal-regulated kinase activation revealed by in vivo imaging of mouse skin. Elife. 2015;4:e05178. doi: 10.7554/eLife.05178. [DOI] [PMC free article] [PubMed] [Google Scholar]
- 52.Lavoie H, Therrien M. Regulation of RAF protein kinases in ERK signalling. Nat Rev Mol Cell Biol. 2015;16:281–298. doi: 10.1038/nrm3979. [DOI] [PubMed] [Google Scholar]
- 53.Ambrogio C, et al. KRAS Dimerization Impacts MEK Inhibitor Sensitivity and Oncogenic Activity of Mutant KRAS. Cell. 2018;172:857–868 e815. doi: 10.1016/j.cell.2017.12.020. [DOI] [PubMed] [Google Scholar]
- 54.Hunter JC, et al. Biochemical and Structural Analysis of Common Cancer-Associated KRAS Mutations. Mol Cancer Res. 2015;13:1325–1335. doi: 10.1158/1541-7786.MCR-15-0203. [DOI] [PubMed] [Google Scholar]
- 55.Sheffels E, Sealover NE, Theard PL, Kortum RL. Anchorage-independent growth conditions reveal a differential SOS2 dependence for transformation and survival in RAS-mutant cancer cells. Small GTPases. 2019:1–12. doi: 10.1080/21541248.2019.1611168. [DOI] [PMC free article] [PubMed] [Google Scholar]
- 56.Nichols RJ, et al. RAS nucleotide cycling underlies the SHP2 phosphatase dependence of mutant BRAF-, NF1- and RAS-driven cancers. Nat Cell Biol. 2018;20:1064–1073. doi: 10.1038/s41556-018-0169-1. [DOI] [PMC free article] [PubMed] [Google Scholar]
- 57.Mainardi S, et al. SHP2 is required for growth of KRAS-mutant non-small-cell lung cancer in vivo. Nat Med. 2018;24:961–967. doi: 10.1038/s41591-018-0023-9. [DOI] [PubMed] [Google Scholar]
- 58.Durrant DE, Morrison DK. Targeting the Raf kinases in human cancer: the Raf dimer dilemma. Br J Cancer. 2018;118:3–8. doi: 10.1038/bjc.2017.399. [DOI] [PMC free article] [PubMed] [Google Scholar]
- 59.Blasco RB, et al. c-Raf, but not B-Raf, is essential for development of K-Ras oncogene-driven non-small cell lung carcinoma. Cancer Cell. 2011;19:652–663. doi: 10.1016/j.ccr.2011.04.002. [DOI] [PMC free article] [PubMed] [Google Scholar]
- 60.Uhlitz F, Bischoff P, Sieber A, Obermayer B, Blanc E, Lüthen M, Sawitzki B, Kamphues C, Beule D, Sers C, Horst D, et al. A census of cell types and paracrine interactions in colorectal cancer. BioRxiv. 2020 doi: 10.1101/2020.01.10.901579. [DOI] [Google Scholar]
- 61.Lupo B, et al. Colorectal cancer residual disease at maximal response to EGFR blockade displays a druggable Paneth cell-like phenotype. Sci Transl Med. 2020;12 doi: 10.1126/scitranslmed.aax8313. [DOI] [PMC free article] [PubMed] [Google Scholar]
- 62.Zanella ER, et al. IGF2 is an actionable target that identifies a distinct subpopulation of colorectal cancer patients with marginal response to anti-EGFR therapies. Sci Transl Med. 2015;7 doi: 10.1126/scitranslmed.3010445. 272ra212. [DOI] [PubMed] [Google Scholar]
- 63.Khambata-Ford S, et al. Expression of epiregulin and amphiregulin and K-ras mutation status predict disease control in metastatic colorectal cancer patients treated with cetuximab. J Clin Oncol. 2007;25:3230–3237. doi: 10.1200/JCO.2006.10.5437. [DOI] [PubMed] [Google Scholar]
- 64.Huang YM, Chang CE. Mechanism of PhosphoThreonine/Serine Recognition and Specificity for Modular Domains from All-atom Molecular Dynamics. BMC Biophys. 2011;4:12. doi: 10.1186/2046-1682-4-12. [DOI] [PMC free article] [PubMed] [Google Scholar]
- 65.Roerink SF, et al. Intra-tumour diversification in colorectal cancer at the single-cell level. Nature. 2018;556:457–462. doi: 10.1038/s41586-018-0024-3. [DOI] [PubMed] [Google Scholar]
- 66.Kraulis PJ. Similarity of protein G and ubiquitin. Science. 1991;254:581–582. doi: 10.1126/science.1658931. [DOI] [PubMed] [Google Scholar]
- 67.Merritt EA, Murphy ME. Raster3D Version 2.0. A program for photorealistic molecular graphics. Acta Crystallogr D Biol Crystallogr. 1994;50:869–873. doi: 10.1107/S0907444994006396. [DOI] [PubMed] [Google Scholar]
- 68.Borlinghaus RT. MRT letter: high speed scanning has the potential to increase fluorescence yield and to reduce photobleaching. Microsc Res Tech. 2006;69:689–692. doi: 10.1002/jemt.20363. [DOI] [PubMed] [Google Scholar]
Associated Data
This section collects any data citations, data availability statements, or supplementary materials included in this article.
Supplementary Materials
Supplementary Discussion of the characterization and applications of ERK biosensors. This discussion summarizes and analyses observations made during the optimization of this ERK biosensor.
Overview of driver mutations present in the panel of KRASG12X and BRAFV600E mutant CRC organoids used in this study. Left, CRC PDOs drawn from23. Right, CRC PDOs drawn from Foundation Hubrecht Organoid Technology (HUB).
Analysis of EKAREV(Tq) FRET in HEK293 cell during G2- and M-phase. The time-lapse movie corresponds to Extended Data Fig. 1a. From left to right: co-expressed H2B-mScarlet marks the mitotic stages, sensor fluorescence (Turquoise2), FRET ratio movie, normalized ratio curve (YFP/CFP) corresponding to the drawn ROIs. PMA was added to induce sensor saturation (time point t127).
Top, EKAREN5-FRET. From left to right: sensor fluorescence, FRET ratio, normalized ratio curve (YFP/CFP) corresponding to the drawn ROIs. Bottom, KTR analysis in same cell. From left to right: FRET sensor (used to demarcate the nucleus), KTR sensor (shown ROI defines cytosolic compartment), normalized ratio curve (cytosol/nucleus). Note the variety of peak amplitudes.
Single-cell analyis of one of the two neighbor cells shown in Fig. 3b. From left to right: sensor fluorescence (Turquoise2), FRET ratio movie, normalized ratio curve (YFP/CFP) corresponding to the drawn ROIs.
Single-cell analyis shown in Fig. 4b’. From left to right: sensor fluorescence (Turquoise2), FRET ratio movie, normalized ratio curve (YFP/CFP) corresponding to the drawn ROIs. Before addition of afatinib (200nM), all cells show oscillatory ERK activity behavior.
Data Availability Statement
Custom-written ImageJ/Fiji-scripts that were used to analyze 2D and 3D FRET data are available from the corresponding author upon request.
All data supporting the findings of this study are available from the corresponding author on reasonable request.


