Abstract
Hypoxia-inducible transcription factors (HIFs) are fundamental to the cellular adaptation to low oxygen levels but it is unclear how they interact with chromatin and activate their target genes. Here we use genome-wide mutagenesis to identify genes involved in HIF transcriptional activity, and define a requirement for the histone H3 lysine 4 (H3K4) methyltransferase SET1B. SET1B loss leads to a selective reduction in transcriptional activation of HIF target genes, resulting in impaired cell growth, angiogenesis, and tumor establishment in SET1B-deficient xenografts. Mechanistically, we show that SET1B accumulates on chromatin in hypoxia, and is recruited to HIF target genes by the HIF complex. The selective induction of H3K4 trimethylation at HIF target loci is both HIF- and SET1B-dependent, and when impaired correlates with decreased promoter acetylation and gene expression. Together, these findings reveal SET1B as a determinant of site-specific histone methylation and provide insight into how HIF target genes are differentially regulated.
Introduction
Hypoxia-inducible transcription factors (HIFs) control cellular responses to oxygen availability by activating a myriad of genes involved in angiogenesis, pH regulation, glycolysis and cell growth to promote cell survival when oxygen is scarce1,2. Aside from this essential physiological response, HIFs are involved in diverse processes, including cell development, inflammation and immune regulation, and tumor growth. There is therefore an ongoing need to understand how HIFs are regulated, with the potential for new therapies.
HIF regulation predominantly relies on post-translational oxygen-dependent degradation of the HIF-α subunit. The two main HIF-α isoforms (HIF-1α and HIF-2α) undergo prolyl hydroxylation by prolyl hydroxylase enzymes (PHDs) when oxygen is present, facilitating recognition and ubiquitination by the Von Hippel-Lindau (VHL) E3 ligase, and subsequent proteasome-mediated degradation3–7. Degradation of HIF-α prevents the formation of an active HIF heterodimeric transcription factor with HIF1β. In hypoxia, when oxygen levels are decreased, PHD activity is reduced, which leads to HIF-α stabilization, dimerization with HIF1β, translocation of the HIF complex to the nucleus, and interaction with chromatin to activate gene transcription.
While the post-translational control of HIFs is well understood, factors that regulate HIF activity at the level of individual target genes are less clear, but are likely controlled through chromatin accessibility and post-translational modifications of histone tails. Early studies demonstrated the importance of histone marks, with the involvement of the p300/CBP lysine acetyltransferase complex in HIF target gene expression8. More recently, siRNA screens in Drosophila and studies of human cancers identified a role for a further acetyltransferase, TIP60, along with CDK8-mediator complex as co-activators of HIF-1α9–11. The role of other histone marks, including methylation is less clear, but histone demethylation can be regulated in an oxygen-dependent manner by lysine demethylases (KDMs). These histone-mark erasers belong to the same enzymatic superfamily as the PHDs and require oxygen as a co-substrate, with recent studies demonstrating increased levels of H3K4me3, H3K27me3 and H3K36me3 during hypoxia12,13.
To date, there is little information concerning two questions. First, whether specific chromatin writer or eraser complexes can be recruited by HIFs and second, whether deposition of histone lysine modifications is dependent on the presence of the HIF complex or the promoter region of individual genes. By using a flow-cytometry-based CRISPR/Cas9 mutagenesis screen in human cells we identify SET1B (also termed SETD1B)14,15 as an H3K4 methyltransferase that is selectively recruited by HIF to facilitate rapid activation of HIF target genes. SET1B regulates a subset of hypoxia-induced transcripts, favoring those involved in angiogenesis, with loss of SET1B decreasing cell survival in cancer cells during hypoxia, and decreasing tumor establishment in xenografts. These findings establish the ability of HIFs to selectively recruit chromatin writers to regulate gene transcription, and provide evidence that targeted H3K4 methylation by SET1B is linked to tuning the response to hypoxia.
Results
CRISPR screen identifies genes required to activate a HIF response
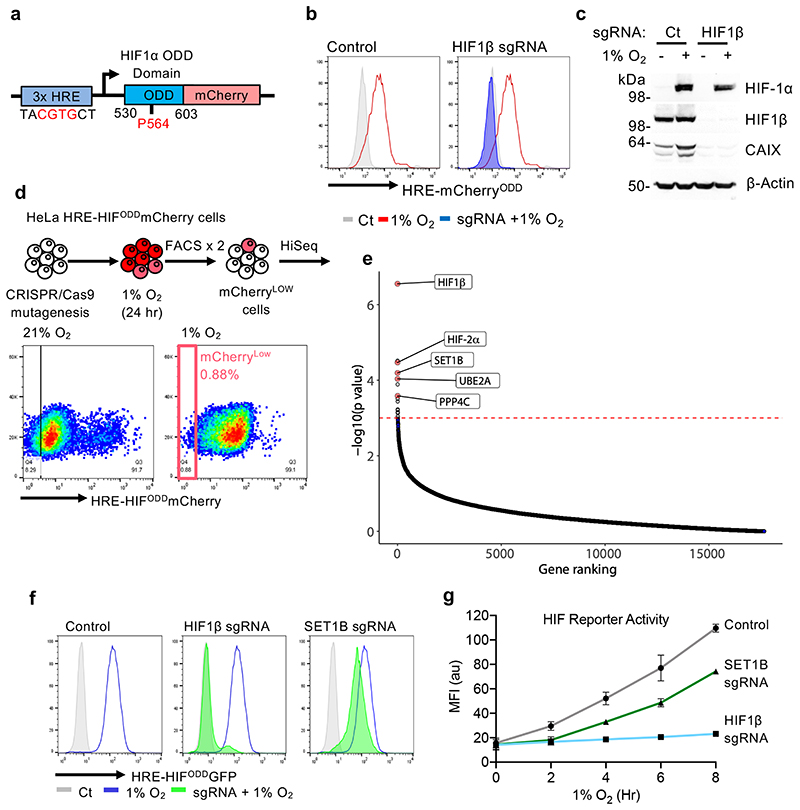
To identify genes required to activate HIF target loci, we used a dynamic HIF-mCherry reporter16,17. This reporter requires endogenous HIF binding to a triplicate consensus hypoxia responsive element (HRE) for activation, and reversibly accumulates in hypoxia through a fused oxygen-dependent degradation domain (ODD) (Fig. 1a-c). The mutagenesis screen was performed by transducing Cas9-expressing HeLa reporter cells with the Toronto human knockout (TKO) genome-wide sgRNA library18, incubating the cells in 1% oxygen for 24 h, and undertaking iterative flow-activated cell sorting (FACS) for those cells that failed to activate the reporter (Fig. 1d, e). SgRNAs enriched in the sorted population that failed to activate the reporter were identified by high-throughput deep sequencing in comparison to sgRNAs from cells that had only been exposed to 21% oxygen (-log10 P > 3) (Fig. 1d, e, Supplementary Table 1 and Supplementary Data 1). HIF1β (ARNT) and HIF-2α(EPAS1) were highly enriched in the mutagenesis screen, validating our approach (Fig. 1e). Most top candidate genes identified were implicated in DNA binding, but some other genes were putatively involved in apoptosis or cell signaling pathways (Supplementary Table 1). We focused on genes highly enriched in the screen and implicated in transcriptional regulation by histone modifications: SET1B, UBE2A (RAD6) and PPP4C (Fig. 1e).
Fig. 1. CRISPR screen identifies genes required to activate a HIF response.
(a) Schematic of the HRE-ODDmCherryODD reporter construct. HeLa HRE-ODDmCherry reporter cells stably expressing Cas9 were transduced with a sgRNA against HIF1β and treated with 21% or 1% O2 for 24 h. Samples were analyzed using flow cytometry (b) or by immunoblotting (c) using the indicated antibodies. Immunoblot representative of 3 biological replicates. (d) HeLa HRE-ODDmCherry cells were transduced and mutagenized with genome-wide sgRNA library (Toronto KO library). After 8 days, mCherryLOW cells were incubated for 24 h at 1% O2 and selected by FACS. Cells were grown for a further 8 or 12 days, and sgRNAs identified by Illumina HiSeq. (e) Comparative bubble plot. Unadjusted P value calculated using MaGECK robust rank aggregation (RRA); FDR = Benjamini-Hochberg false discovery rate (multiple hypothesis adjustment of RRA P value). (f, g) Validation of SET1B loss on HIF reporter activity. HeLa HRE-ODDGFP cells stably expressing Cas9 were transduced with sgRNAs targeting HIF1β or SET1B. After 7-10 days, HeLa HRE-ODDGFP cells were incubated in 1% oxygen for 24 h (f) or for 0 to 8 h (g), and GFP intensity was measured using flow cytometry following different incubations at 1% O2 (n = 3 biologically independent transductions, mean ± SD).
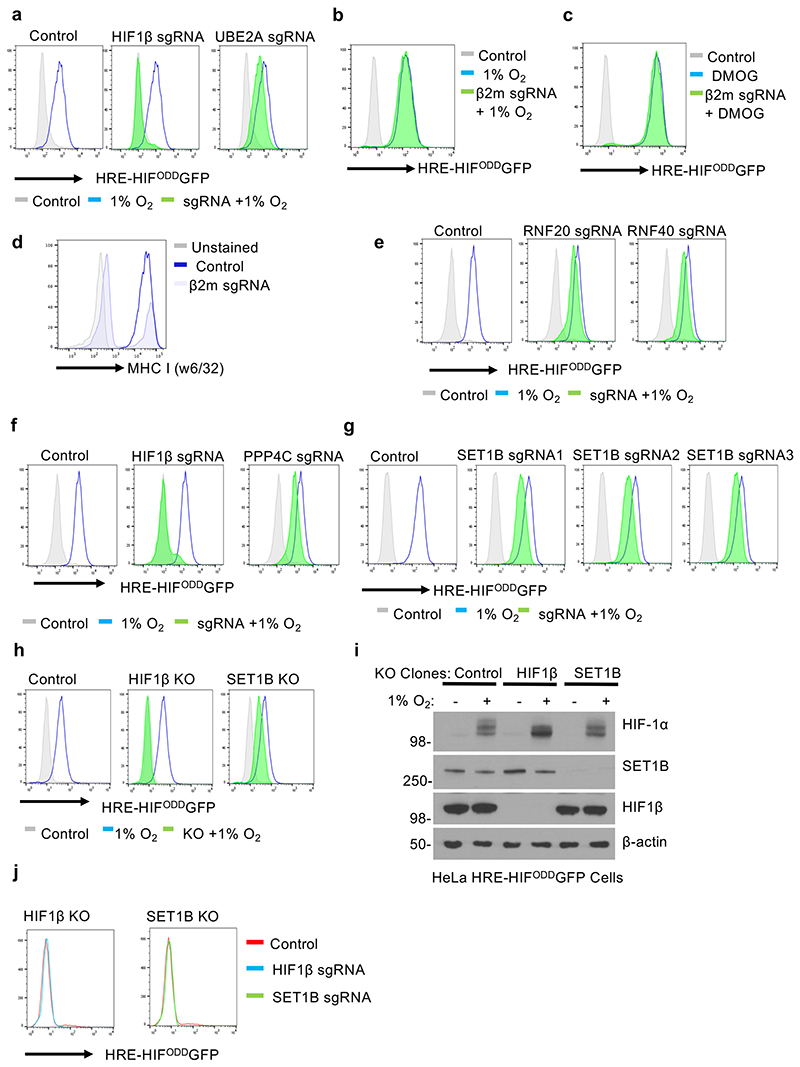
SET1B, UBE2A and PPP4C all validated in mixed CRISPR knockout (KO) population of HeLa reporter cells, using the MHC Class I component, β-2-microglobulin (β2m), as a control (Fig. 1f, Extended Data Fig. 1a-g). UBE2A, an E2 conjugating enzyme involved in global H2B ubiquitination, decreased activation of the HIF reporter (Extended Data Fig. 1a), as did depletion of the RNF20 and RNF40 E3 ligases, consistent with their involvement in recruiting UBE2A for ubiquitination19,20 (Extended Data Fig. 1a, e). Decreased activation of the reporter with PPP4C depletion, a phosphatase that controls histone deacetylation (HDAC3)21, was also observed (Extended Data Fig. 1f).
SET1B was of particular interest as it suggested the involvement of histone methylation in activation of HIF target genes. We observed decreased activation of the HIF reporter in hypoxia using mixed SET1B knockout populations, multiple sgRNAs and in isolated clones (Fig. 1f, Extended Data Fig. 1g-i), with no alteration in reporter levels in 21% oxygen (Extended Data Fig. 1j), confirming the involvement of SET1B. While SET1B depletion did not prevent the HIF reporter activity to the same extent as HIF1β loss, it delayed its activation and decreased total GFP levels (Fig. 1g).
SET1B depletion impairs the HIF transcriptional response
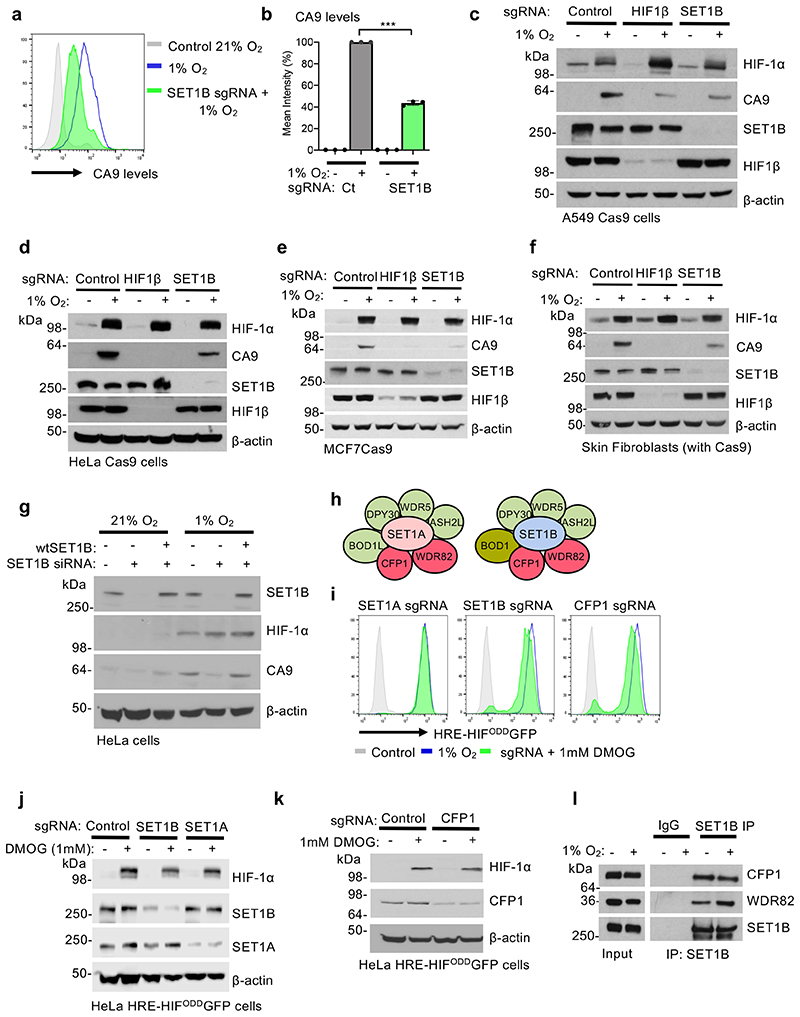
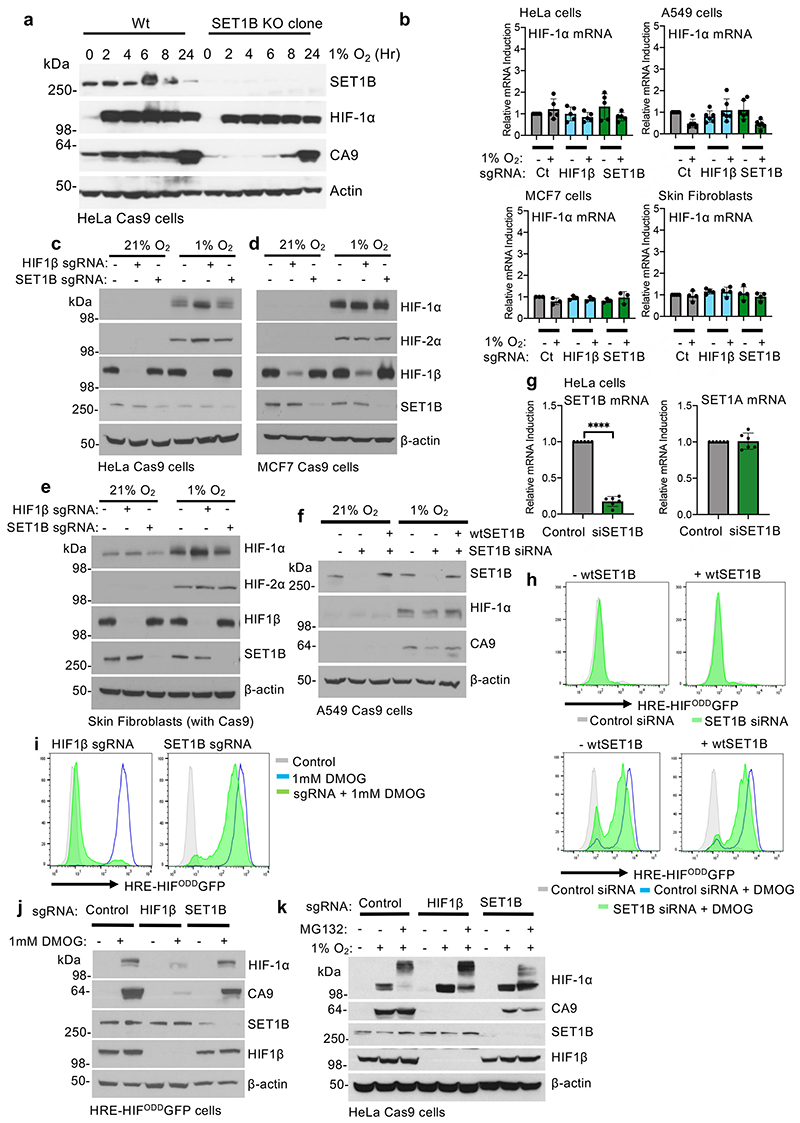
We examined whether SET1B depletion altered the activation of the endogenous HIF target genes, and if this was applicable to other cell types. Using the well-validated HIF-1α target, Carbonic Anhydrase 9 (CA9), we confirmed that CA9 levels decreased in HeLa HIF reporter cells following SET1B loss (Fig. 2a, b). Similar findings were observed in other cancer cell lines (A549 lung adenocarcinoma and MCF7 breast cancer cells), and skin fibroblasts (Fig. 2c-f), with a temporal decrease in CA9 levels (Extended Data Fig. 2a), as observed with the HIF reporter (Fig. 1g). Decreased reporter activation was not due to changes in HIF-α or HIF1β levels, as SET1B loss did not alter HIF-1α mRNA expression or the protein abundance of HIF-2α or HIF1β (Extended Data Fig. 2b-e). Reconstituting SET1B following its siRNA-mediated depletion restored HIF reporter activity, and increased CA9 levels (Fig. 2g, Extended Data Fig. 2f-h), confirming the involvement of SET1B in transcriptional activation of a HIF target.
Fig. 2. SET1B depletion impairs the HIF transcriptional response.
(a, b) Cell surface CA9 was measured and quantified in HeLa cells depleted of SET1B by sgRNA after 7-10 days, and then incubated in 21% or 1% overnight. Quantification of geometric mean of cell surface CA9 staining (b). n = 3 biologically independent samples, mean ± SD, *** P ≤ 0.0001, two-way ANOVA. (c-f) A549 (c), HeLa (d), MCF7 (e), and skin fibroblasts (f) stably expressing Cas9 were transduced with an sgRNA against HIF1β or SET1B and after 7-10 days treated with 21% or 1% O2 for 24 h. Immunoblots representative of 3 biological replicates. (g) Reconstitution of SET1B siRNA depleted cells with overexpressed SET1B. HeLa cells were transfected with a control or a SET1B siRNA, with and without a SET1B overexpression plasmid for 48 h. Cells were then incubated at 21% or 1% O2 for a further 24 h before lysis. Endogenous SET1B, HIF1α and CA9 levels were detected by immunoblot (representative of 3 biological replicates) (h) Schematic of the SET1A and SET1B containing complexes highlighting core histone methyltransferase complex members (green) and proteins specific for SET1A and SET1B containing complexes (red). (i-k) CRISPR/Cas9-mediated depletion of SET1 complex proteins in HeLa HRE-ODDGFP Cas9 cells. Cells were transduced with sgRNA targeting SET1A, SET1B, and CFP1. After 7-10 days cells were treated with or without 1 mM DMOG 24 h, and activation of the HIF GFP reporter measured using flow cytometry (i). sgRNA-mediated depletion of SET1 complex proteins was measured by immunoblotting (j, k) (representative of 3 biological replicates). (l) Endogenous SET1B was immunoprecipitated in HeLa cells grown at 21% or 1% O2 for 6 h. Samples were immunoblotted for SET1 complex members CFP1 and WDR82 (representative of 3 biological replicates).
We next asked whether SET1B loss altered activation of HIF targets following PHD inhibition with dimethyloxalylglycine (DMOG), independently of hypoxia. DMOG treatment stabilized HIF-1α and activated the HIF reporter, but HIF reporter levels and endogenous CA9 were still decreased following SET1B depletion (Extended Data Fig. 2i, j). Moreover, proteasome inhibition (MG132 treatment) did not rescue CA9 levels following SET1B depletion (Extended Data Fig. 2k), consistent with SET1B enhancing transcriptional activation of a HIF target rather than altering the stability of HIF-1α or HIF targets.
Six H3K4 methyltransferases have been identified in humans: SET1A, SET1B and 4 mixed lineage leukemia (MLL) genes, which together comprise the SET/COMPASS family15. SET1 and SET1B are closely related, and all COMPASS member complexes share a number of subunits, aside from CFP1 and WDR82, which only associate with SET1A and SET1B15 (Fig. 2h). Therefore, we tested if depletion of SET1A, CFP1 or WDR82 altered activation of the HIF reporter following DMOG treatment. SET1A depletion had no effect on HIF reporter activation (Fig. 2i, j). Toxicity was observed with WDR82 depletion, preventing meaningful interpretation, but depletion of CFP1, which associated with either SET1A or SET1B, partially decreased activation of the reporter (Fig. 2i, k, l). Together, these findings support the involvement of the SET1B but not SET1A complex in the HIF response.
SET1B selectively drives mRNA expression of HIF target genes
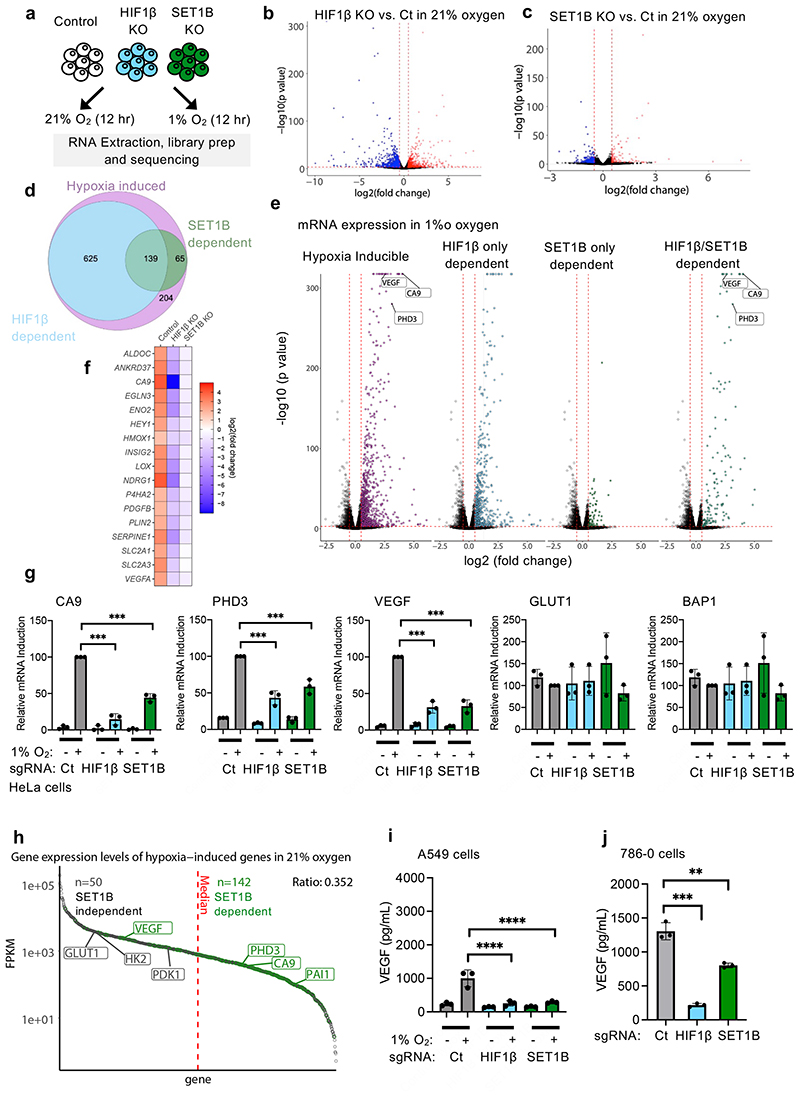
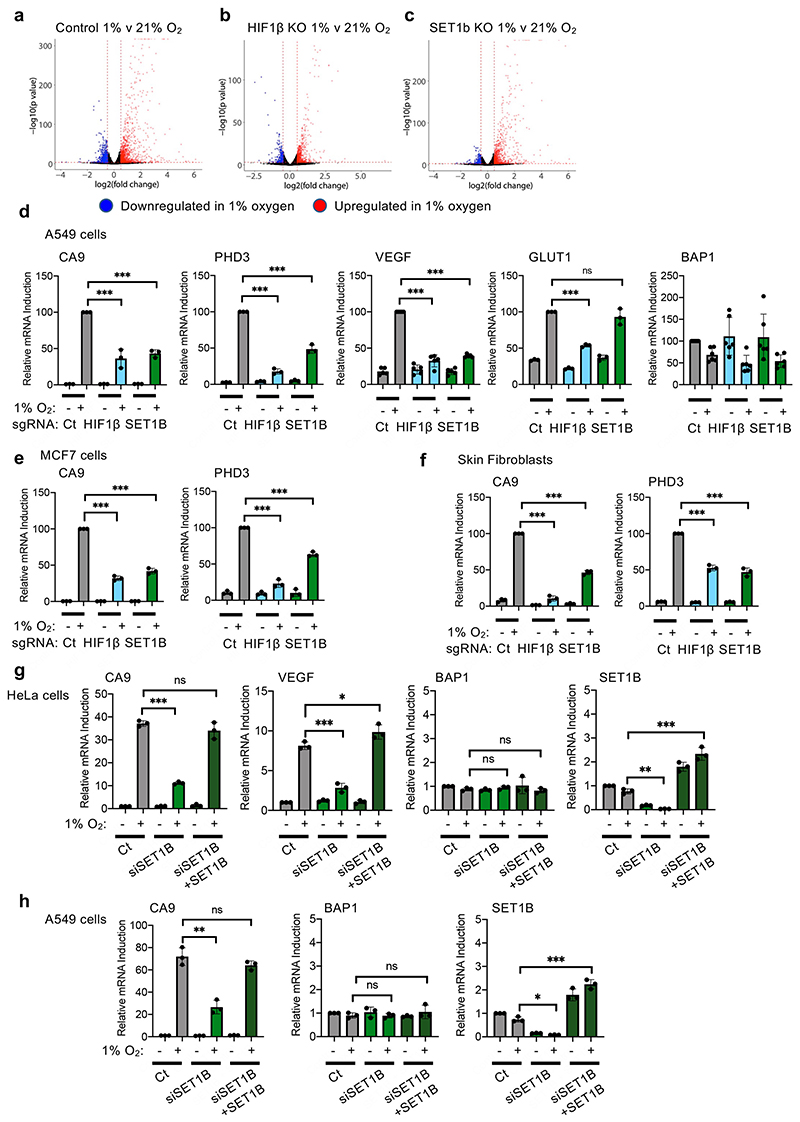
To determine the global effect of SET1B on gene expression in hypoxia we used RNA-seq. Mixed populations of SET1B knockout, HIF-1β knockout or wildtype HeLa cells were exposed to 21% or 1% oxygen for 12 h (Fig. 3a). SET1B depletion had a minimal effect on global gene transcription in 21% oxygen, and these changes were less than observed with HIF1β depletion alone (Fig. 3b, c). In hypoxia, 1,033 genes were significantly induced, of which 764 (74%) were decreased following HIF-1β loss (Fig. 3d, e, Extended Data Fig. 3a, b). SET1B loss significantly decreased the expression of ~20% of these hypoxia-dependent genes (Fig. 3d, e, Extended Data Fig. 3a, c), favoring those that were highly upregulated in the hypoxic control HeLa cells (CA9, VEGF and PHD3) (Fig. 3e, f). Quantitative PCR confirmed these findings in several cell types, with reduced expression of CA9, PHD3 and VEGF but not a control gene, BAP1, or the HIF-1α target GLUT1 (Fig. 3g, Extended Data Fig. 3d-f). Moreover, reconstituting SET1B following siRNA-mediated depletion of SET1B restored HIF activation of CA9 and VEGF (Extended Data Fig. 3g, h).
Fig. 3. SET1B selectively drives mRNA expression of HIF target genes.
(a) RNA-seq: HeLa cells were transduced with sgRNA targeting HIF1β or SET1B, and control or mixed KO populations were treated at 21% or 1% O2 for 12 h before RNA was extracted and sequenced using HiSeq (n = 2 biologically independent samples). (b, c) Volcano plots of differential mRNA expression in control vs. HIF1β (b) or SET1B (c) at 21% O2. Significantly up or downregulated genes were selected based on a log2(fold-change) of >0.5 or <-0.5. Genes significantly upregulated (red) and downregulated (blue) are shown. (d) Venn diagram highlighting hypoxia inducible genes (purple), HIF1β-dependent (blue) and SET1B-dependent (green) genes. (e) RNA-seq HIF1β- and/or SET1B-dependent mRNA expression in 1% oxygen. Volcano plot of log2(fold-change) against –log10 P value for all genes in 21% and 1% O2. Hypoxia inducible (purple), HIF1β-dependent genes (blue), SET1B-dependent genes (light green) and combined HIF1β- and SET1B-dependent genes (dark green) are shown. (f) Heat map displaying log2(fold-change) in mRNA expression in control, HIF1β or SET1B mixed KO cells of validated HIF target genes. (g) Quantitative PCR (qPCR) of HIF targets (CA9, PHD3, VEGF and GLUT1) and a non-HIF target (BAP1) in HeLa and A549 cells incubation in 1% or 21% oxygen for 24 h (n = 3 biologically independent samples, mean ± SD, *** P ≤ 0.0001, two-way ANOVA). (h) Gene expression levels of all hypoxia induced transcripts ranked from high expression to low by Fragments Per Kilobase of transcript per Million mapped reads (FPKM). SET1B dependent (green) and independent (grey) genes are shown. (i, j) VEGF ELISA from control, HIF1β- or SET1B-depleted A549 (i) or 786-0 cells (j) (n = 3 biologically independent samples). Cells were grown in 21% or 1% O2 before supernatants were collected. (i) Control vs. HIF1β P ≤ 0.0001, control vs. SET1B P ≤ 0.0001; two-way ANOVA. (j) Control vs. HIF1β P <0.0002, control vs. SET1B P = 0.003; two-way ANOVA. Ct = control. Graphs show mean ± SD, ** P < 0.01, *** P < 0.001, **** P < 0.0001.
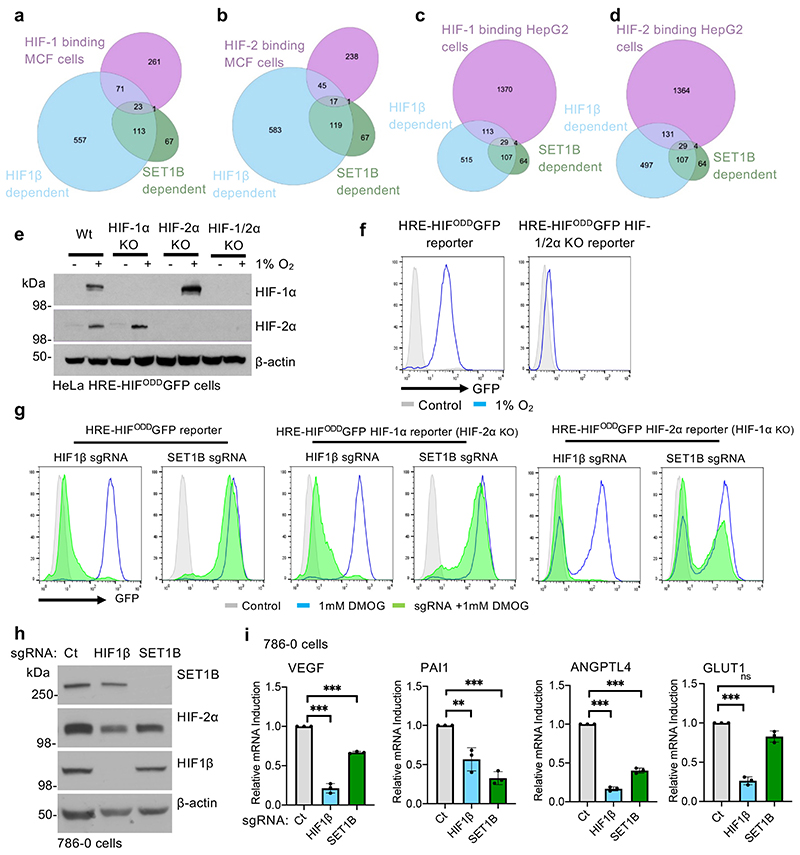
Differential activation of the HIF-α isoforms did not appear to account for the subset of genes altered by SET1B loss. Analyses of available HIF-1α and HIF-2α binding sites from MCF7 or HepG2 cells showed no clear bias towards one isoform (Extended Data Fig. 4a-d). To test HIF-α selectivity further, we generated isoform-specific fluorescent reporter lines by clonal knockout of HIF-1α, HIF-2α or both together (Extended Data Fig. 4e, f). HeLa HIF-1α KO (HIF-2 reporter) or HIF-2α KO (HIF-1 reporter) HRE-GFPODD cells, depleted of SET1B, both showed decreased GFP levels following PHD inhibition (DMOG), although this was more pronounced with the HIF-1α reporter, as HIF-2α is present at lower levels in HeLa cells (Extended Data Fig. 4f, g). To clarify the involvement of SET1B in the activation of HIF-2α target genes, we used 786-0 cells, a VHL-deficient renal cell carcinoma cell line that does not express HIF-1α (Extended Data Fig. 4h). SET1B depletion prevented activation of several HIF target genes in these cells, but not GLUT1 (Extended Data Fig. 4i). Thus, HIF-α isoform specificity could not account for the involvement of SET1B in a subset of hypoxia inducible genes.
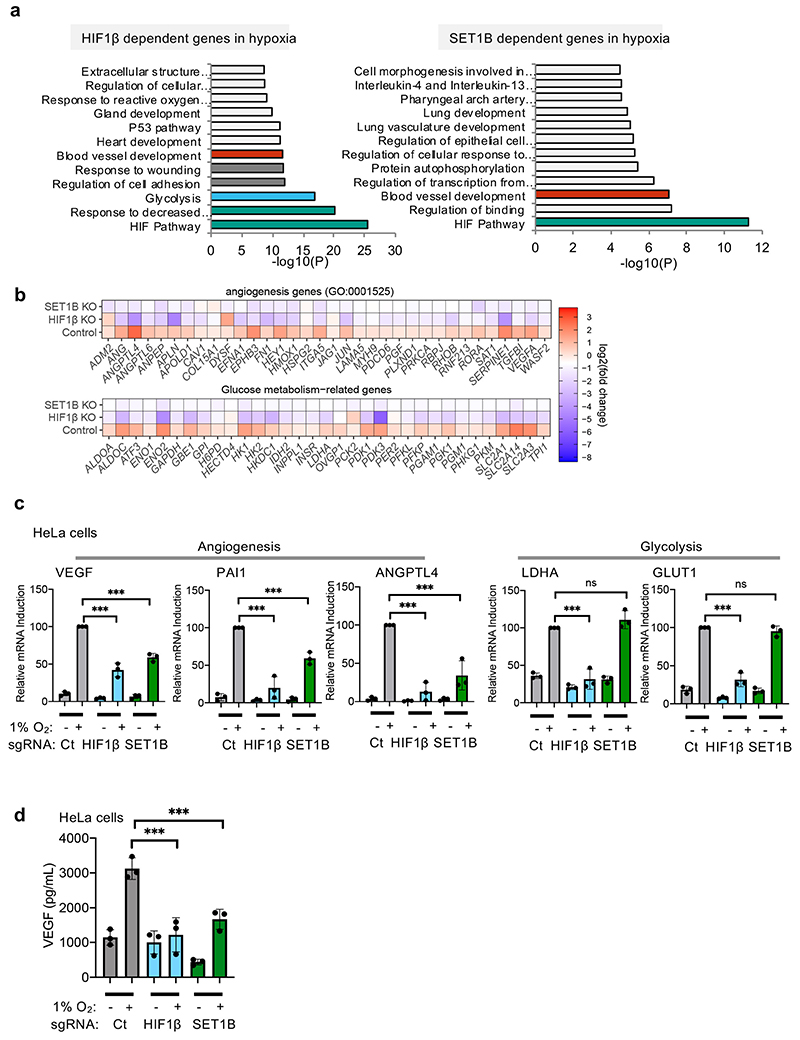
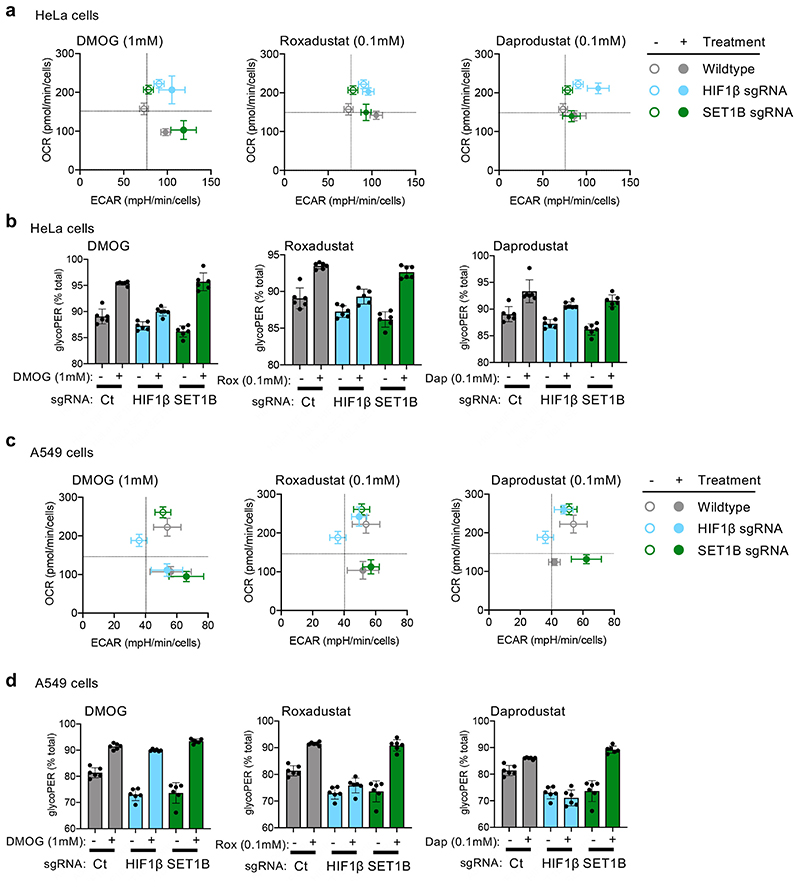
GLUT1 expression was not altered by SET1B loss in multiple cell lines, suggesting that some HIF target genes may be differentially regulated. We also noted that SET1B tended to alter the HIF-dependent upregulation of genes that were at low levels of expression in 21% oxygen (Fig. 3h). This differential effect suggested that SET1B may be involved in distinct biological processes, which was supported by gene ontology analysis, where SET1B loss preferentially altered expression of genes involved in angiogenesis, with less effect on glycolysis (Extended Data Fig. 5a, b). These findings were further supported by qPCR of individual genes (Extended Data Fig. 5c), and the decreased secretion of VEGF (Fig. 3i, j, Extended Data Fig. 5d). In contrast, SET1B loss had a minimal effect on the HIF-dependent shift to glycolysis using bioenergetic profiling (Extended Data Fig. 6a-d).
Functional consequences of SET1B loss in hypoxia
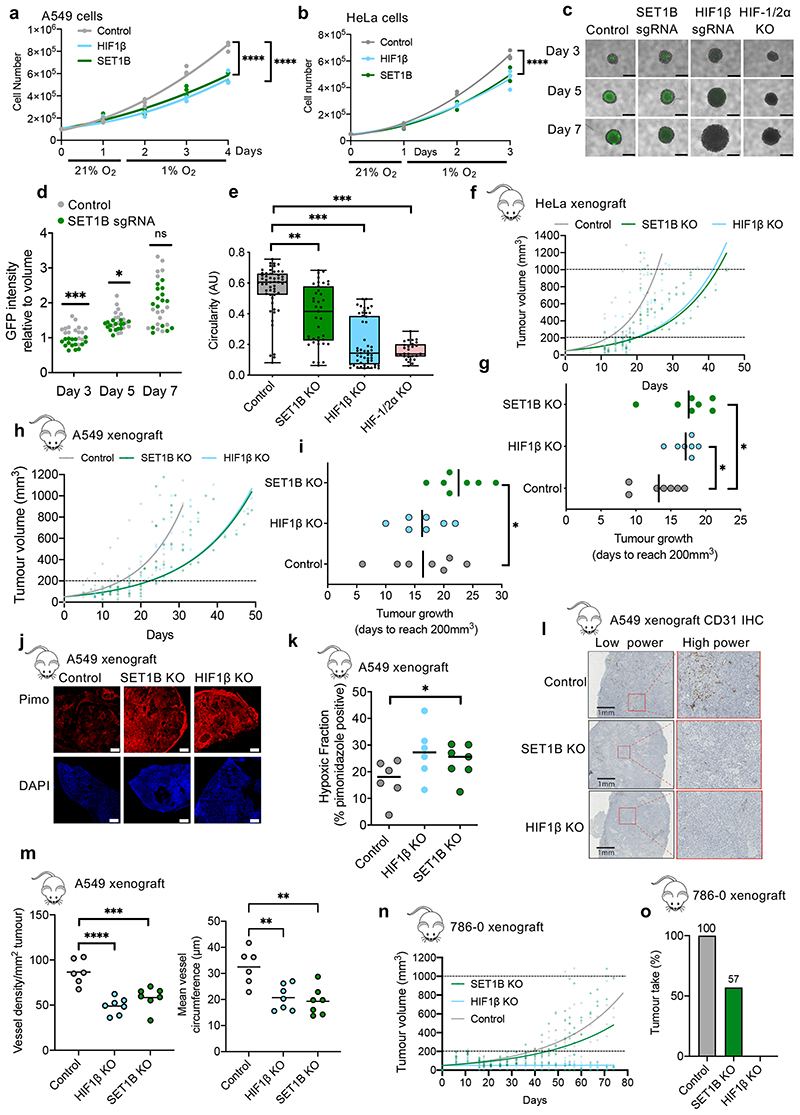
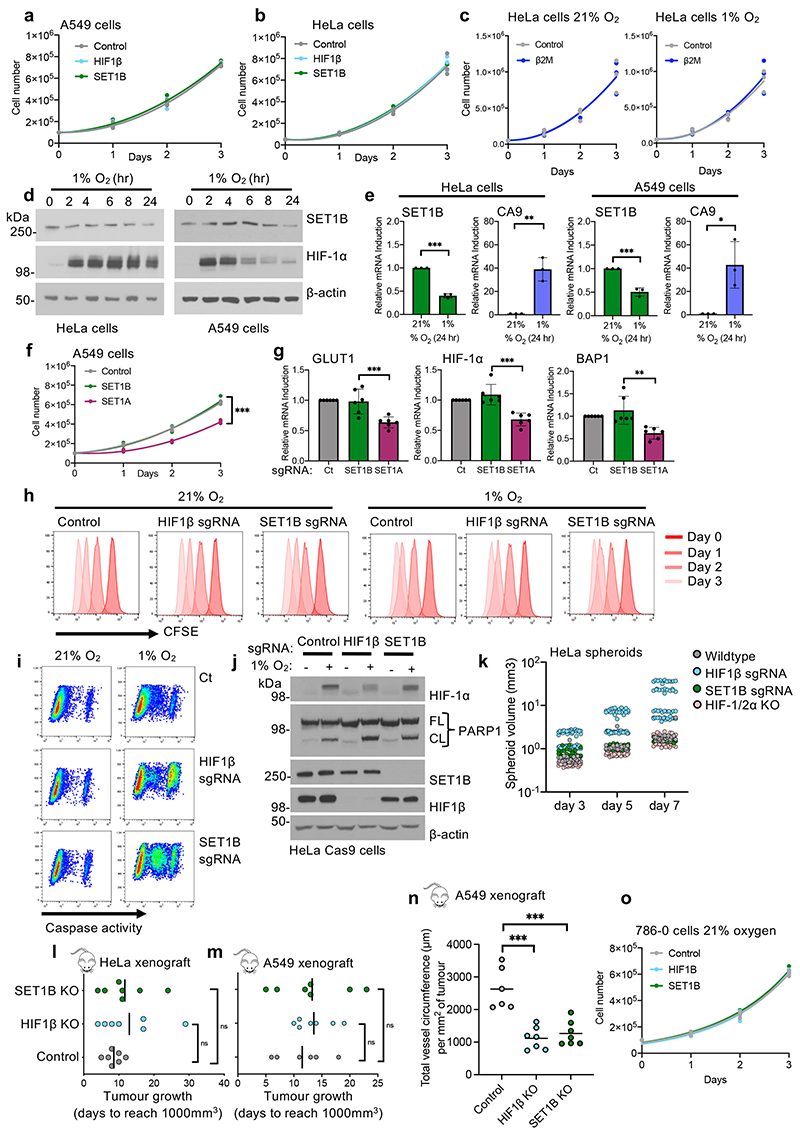
To further understand the requirement for SET1B in the HIF response, we examined the effect of SET1B loss on cell growth in hypoxia using HeLa or A549 mixed SET1B knockout populations, with HIF1β or β2m depletion as controls. HeLa or A549 cells grew at similar rates at 21% O2, irrespective of SET1B, HIF1β or β2m depletion (Extended Data Fig. 7a–c), but we observed a decrease in the total cell number of SET1B- or HIF1β-deficient cells after 24-72 h of hypoxia (Fig. 4a, b). These findings were consistent with the HIF response promoting cell survival in hypoxia, as demonstrated in certain cancers22,23. We also observed that hypoxia altered the levels of SET1B itself, with a transcriptional downregulation and decrease in protein levels after 24 h in both HeLa and A549 cells (Extended Data Fig. 7d, e), suggesting that hypoxic reduction of SET1B expression provides a negative feedback loop. Importantly, the hypoxic-specific growth defect in the SET1B-deficient cells was distinct from SET1A loss, which reduced cell numbers even when incubated in 21% oxygen, and decreased mRNA of both HIF target and control genes (Extended Data Fig. 7f, g), indicating a more global involvement in transcriptional regulation.
Fig. 4. Functional consequences of SET1B loss in hypoxia.
(a, b) Proliferation assays of HeLa (a) or A549 (b) depleted of HIF1B or SET1B grown in 21% or 1% oxygen for indicated number of days (n = 3 biologically independent samples, mean, P ≤ 0.0001, twoway ANOVA at 3 or 4 days). (c-e) HeLa control, SET1B-depleted, HIF-1β-depleted or HIF-1/2α clonal KO spheroids generated in HIF reporter cells. n = 54 (control), 39 (SET1B KO), 51 (HIF1β KO), 28 (HIF-1/2α KO) spheroids. Representative images (c) and GFP intensity (d) shown; control relative to SET1B depletion; P = 0.000003 day 3, P = 0.027 day 5,unpaired t-test. Scale bar 1.25 mm. (e) Circularity. Box and whisker plots show all points, min. to max., with 25th to 75th interquartile range box. Control vs. SET1B KO, P = 0.0037, control vs. HIF1β or HIF-1/2α KO P < 0.0001; Kruskal-Wallis for nonparametric data. (f-i) HeLa and A549 tumor xenograft models. (f, h) Tumor volumes measured (SET1B vs. control, P ≤ 0.0001, nonlinear regression F test). (g, i) Tumor establishment determined by time to reach 200 mm3 (n = 7 mice per condition, mean ± SD, P = 0.04 HeLa control vs. SET1B KO, P = 0.015 HeLa control vs. HIF1β KO, P = 0.048 A549 control vs. SET1B KO; unpaired two-tailed t-test). (j) Representative images of A549 tumor sections, harvested at > 1,000 mm3, stained with pimonidazole (red) and DAPI (blue). Scale bar 500 μm, n = 7 mice per condition. (k) Hypoxic tumor fraction in SET1B depletion vs. control, P = 0.035, unpaired t-test. n = 6 (control and HIF1β), 7 SET1B. (l) Representative IHC images of A549 tumor sections stained for blood vessels (CD31) (n = 7 mice per condition). (m) Vessel density (left) and mean vessel circumference (right) in A549 tumor sections. SET1B vs control density (P = 0.0009), and circumference (P = 0.001). HIF1β vs. control density (P ≤ 0.0001), and circumference (P = 0.003). n = 6 (control and HIF1β), 7 SET1B. mean ± SD, one-way ANOVA). (n, o) 786-0 tumor xenograft model. Tumor volume (SET1B vs. control, P ≤ 0.0001, nonlinear regression F test) (n) and the percentage of tumors that established (tumor take) are shown (o). Graphs show mean ± SD. * P < 0.05, ** P < 0.01, *** P < 0.001.
We next examined whether the decrease in cell numbers in the SET1B-depleted cells was due to decreased proliferation or increased cell death. Cell tracing with CFSE staining showed proliferation rates were not altered in HIF1β- or SET1B-deficient cells, irrespective of oxygen availability (Extended Data Fig. 7h). However, there was an increase in PARP1 cleavage and caspase 3 activity (Extended Data Fig. 7i, j), consistent with increased apoptosis during hypoxia following HIF1β or SET1B depletion. To further substantiate these findings, we established spheroid cultures in HeLa HIF-reporter cells following depletion of SET1B or HIF components, and measured circularity as an index of spheroid integrity and apoptosis. GFP fluorescence confirmed that central regions of the spheroids became hypoxic and activated HIFs. Mixed KO populations of HIF1β or combined clonal HIF-1/2α depletion completely impaired activation of the HIF reporter in these hypoxic centers (Fig. 4c, d), while SET1B showed a mild reduction in GFP activation (Fig. 4c, d), consistent with earlier findings (Fig. 1f). Spheroid volumes varied considerably in the HIF-deficient spheroids, but there was a marked decrease in circularity and loss of spheroid integrity (Fig. 4e, Extended Data Fig. 7k). SET1B-deficient spheroids also demonstrated loss of circularity (Fig. 4e), supporting the involvement of SET1B in HIF-regulated growth and apoptosis.
To explore the biological role of SET1B in vivo and its involvement in angiogenesis, we turned to tumor xenograft models, as microenvironmental activation of HIF can increase vascularization and growth22,24,25. Control, SET1B-deficient or HIF1β-deficient HeLa or A549 cells were subcutaneously injected into the backs of nude mice, and the time to tumor establishment (200 mm3) or to reach a volume of 1,000 mm3 was measured. HIF1β or SET1B depletion in the HeLa xenografts delayed tumor growth, which resulted from delayed establishment rather than subsequent growth of the tumor (Fig. 4f, g, Extended Data Fig. 7l). A549 SET1B-deficient tumors also showed a marked delay in the initial tumor growth (Fig. 4h, i, Extended Data Fig. 7m). Excised SET1B-deficient A549 tumors had increased hypoxic regions compared to the control tumors, similarly to HIF1β loss (Fig. 4j, k). Macroscopic analysis of these tumors showed predominantly sheet-like architecture, with some areas showing more well-defined acinar and glandular structures but no cystic components (Fig. 4l). Immunohistochemical staining for blood vessels showed decreased vessel density in the SET1B- and HIF1β-deficient tumors compared to the controls, with smaller vessel size (Fig. 4l, m, Extended Data Fig. 7n), consistent with decreased angiogenesis.
We used the 786-0 renal cell carcinoma xenografts as a further model for the involvement of HIFs in tumor formation, as these tumors are highly reliant on HIF-2α for establishment. We verified that SET1B or HIF-1β depletion did not alter 786-0 cell growth in 21% oxygen (Extended Data Fig. 7o), and subcutaneously injected these cells into the backs of nude mice. HIF-1β depletion completely prevented the tumors forming (Fig. 4n, o). SET1B delayed tumor growth to an intermediate level between the control 786-0 cells and HIF1β loss, with tumors failing to establish in 3 out of the 7 mice (Fig. 4m, n). Together, these findings support a functional role for SET1B in the HIF response, and HIF-mediated activation of angiogenesis.
Recruitment of SET1B to chromatin in hypoxia
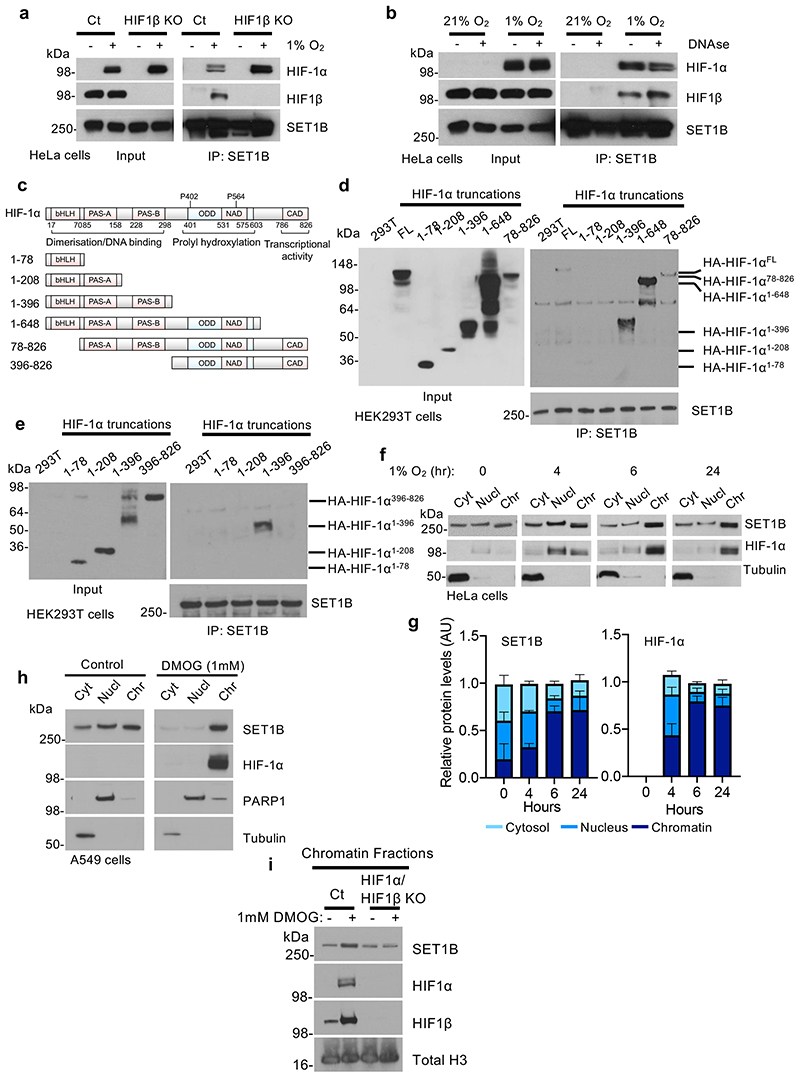
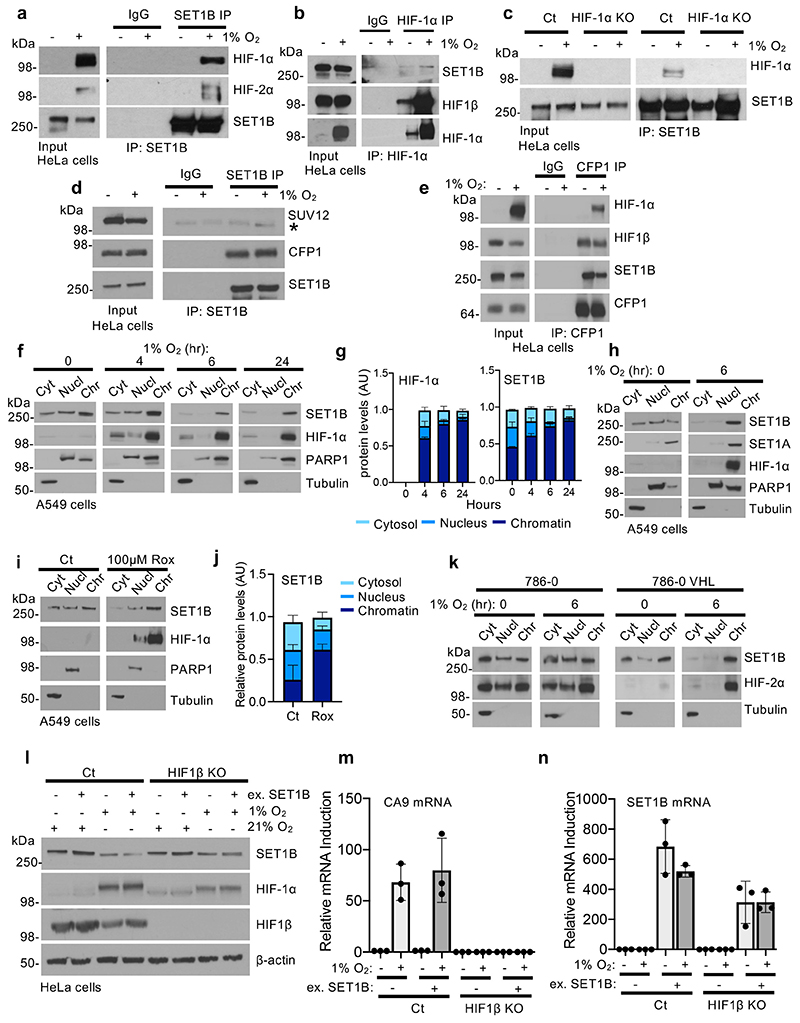
To understand how SET1B was mechanistically involved in activating HIF target genes, we first examined the interaction of SET1B with the HIF heterodimer. Endogenous SET1B associated with both HIF-α isoforms and HIF1β, but not with a component of another DNA bound complex (polycomb repressive complex 2, PRC2) (Fig. 5a, Extended Data Fig. 8a-d). The formation of the mature heterodimeric HIF complex was not required, as SET1B still associated with HIF-1α in HIF1β null cells, (Fig. 5a). The interaction was independent of HIF chromatin binding, as treatment with DNase did not prevent the association of HIF-1α with SET1B (Fig. 5b), but did involve the CFP1 component of the SET1B complex (Extended Data Fig. 8e).
Fig. 5. SET1B associates with HIF-1α and accumulates on chromatin in hypoxia.
(a, b) The interaction of SET1B with the HIF complex is not dependent on HIF1β or DNA. SET1B was immunoprecipitated from wildtype and HIF1β mixed KO HeLa cells incubated in 21% O2 or 6 h of 1% O2 (a). Endogenous SET1B was immunoprecipitated from cells in 21% O2 or 6 h at 1% O2, with or without DNase treatment (Benzonase, 5 μl/mg). Samples were analyzed by immunoblotting using indicated antibodies. (c-e) Mapping the interaction domain of HIF-1α with SET1B. (c) Schematic of full-length HIF-1α and truncation mutants. Characterized functional domains are highlighted: basic helix-loop-helix (bHLH), Per-Arnt-Sim (PAS) domain, oxygen dependent degradation (ODD) domain, N-terminal (NAD) and C-terminal (CAD) transactivation domain. (d, e) HEK293T cells were transfected with 4 μg of the indicated expression constructs for 48 h prior to treatment with 1% O2 for 6 h. Endogenous SET1B was immunoprecipitated and immunoblotted. (f, g) Cell fractionation was performed on HeLa cells treated at 21% or 1% O2 for indicated times. Samples were immunoblotted and the ratio of SET1B in different cellular compartments was quantified using ImageJ (g) (n = 3 biologically independent experiments, mean ± SD). (h, i) Cell fractionation was performed on HeLa cells treated with and without 1 mM DMOG for 24 h (h), or HeLa cells and HIF-1α/HIF1β null HeLa cells with 1 mM DMOG 24 h. All immunoblots representative of 3 biological replicates. Ct = control, Cyt = cytosol, Nucl = nucleus, Chr = chromatin.
To map the interaction domain of HIF-1α with the SET1B complex, we generated HIF-1α truncation mutants in HEK293T cells and examined their association with immunoprecipitated SET1B (Fig. 5c). SET1B associated with HIF-1α constructs containing the PAS domains, which are involved in heterodimerization with HIF-β, but did not require the presence of the ODD or the C-terminal transactivating domain (Fig. 5d). Subsequent studies confirmed that SET1B associated with a HIF-1α truncation construct containing both PAS-A and PAS-B domains, but not PAS-A only (Fig. 5e). Thus, recruitment of SET1B requires both PAS domains on HIF-1α, and PAS-A alone is not sufficient.
SET1B has been observed to localize to the cytosol and nucleus in 21% oxygen26, suggesting that its differential localization may affect its function. We therefore determined if hypoxia altered SET1B localization, and if HIF-1α recruited SET1B to chromatin. Subcellular fractionation studies in HeLa and A549 cells showed that SET1B was evenly distributed between the cytosol, nucleoplasm and chromatin fractions in 21% oxygen, as previously reported26, but following incubation in hypoxia, increased levels of SET1B were found in the chromatin fraction after 4 h, with nearly all SET1B present on chromatin after 24 h (Fig. 5f, g, Extended Data Fig. 8f, g). This translocation of SET1B closely coincided with the movement of HIF-1α to the nucleus, was not observed with SET1A, and could also be initiated with prolyl-hydroxylase inhibition (DMOG or Roxadustat) (Fig. 5h, Extended Data Fig. 8h-j). Therefore, to determine if the HIF complex was responsible for the nuclear accumulation of SET1B, we examined SET1B localization following combined HIF-1α and HIF1β depletion in HeLa cells. SET1B accumulated on chromatin after 6 h in hypoxia, but this increase was prevented in the HIF-1 deficient cells (Fig. 5i). HIF-2α may still be partially involved in recruiting SET1B, as we observed an accumulation on chromatin in VHL reconstituted 786-0 cells in hypoxia, but not in the VHL null cells (Extended Data Fig. 8k).
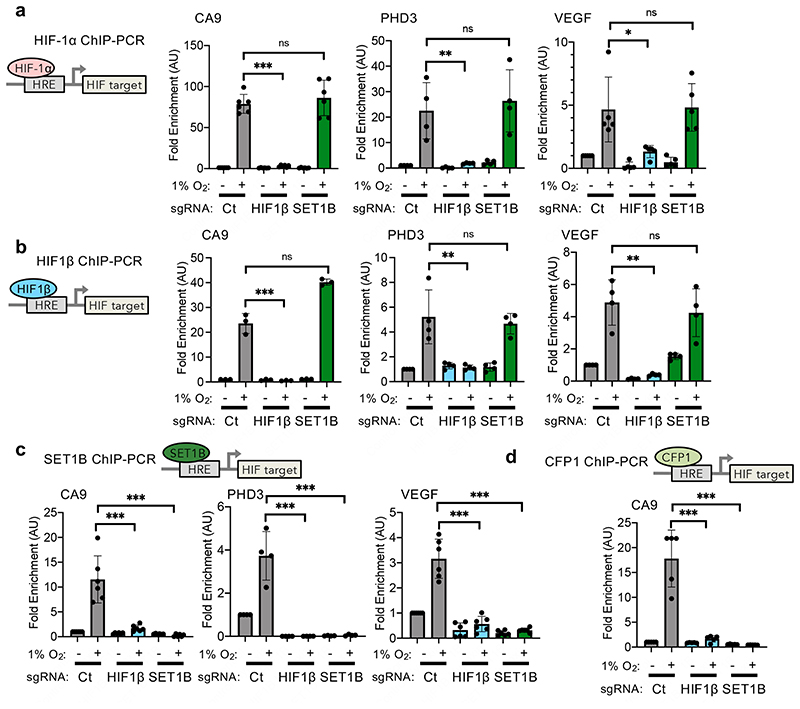
To further understand the recruitment of SET1B by HIF, we used HIF-1α, HIF1β and SET1B ChIP-PCR at validated HIF target genes (CA9, PHD3 and VEGF). In all cases SET1B was only recruited to HIF target sites following binding of the HIF complex (Fig. 6a, b), with no binding of SET1B or the CFP1 component of the complex at HIF-1 target loci in HIF1β null cells (Fig. 6c, d). SET1B overexpression was also not able to restore activation of HIF target genes in HIF1β null cells (Extended Data Fig. 8l-n). Thus, while SET1B accumulates in the nucleus during hypoxia, its association with and recruitment by HIF-1α is required to activate the expression of selected HIF target genes.
Fig. 6. HIF-1α selectively recruits SET1B to HIF target genes.
(a-d) ChIP-PCR in control, HIF1β or SET1B sgRNA depleted HeLa cells incubated in 21% or 1% O2 for 6 h for HIF-1α (a), HIF1β (b), SET1B (c) or CFP1 (d). ChIP-PCR was performed using primers targeting hypoxia responsive elements (HRE) within the promoters of selected HIF target genes. (a) CA9, control vs. HIF1β sgRNA P ≤ 0.0001 (n = 6 biological replicates); PHD3, control vs. HIF1β sgRNA P = 0.002 (n = 4 biological replicates); VEGF, control vs. HIF1β sgRNA P = 0.013 (n = 5 biological replicates); two way ANOVA (b) CA9, control vs. HIF1β sgRNA P ≤ 0.0001 (n = 3 biological replicates); PHD3, control vs. HIF1β sgRNA P = 0.0005 (n = 4 biological replicates); VEGF, control vs. HIF1β sgRNA P = 0.011 (n = 6 biological replicates); two-way ANOVA. (c) CA9, control vs. HIF1β sgRNA P ≤ 0.0001 (n = 6 biological replicates); PHD3, control vs. HIF1β or SET1B sgRNA P ≤ 0.0001 (n = 4 biological replicates); VEGF, control vs. HIF1β or SET1B sgRNA P ≤ 0.0001 (n = 6 biological replicates); two-way ANOVA. (d) CA9, control vs. HIF1β or SET1B sgRNA P ≤ 0.0001 (n = 5 biological replicates). Ct = control. Graphs show mean ± SD, ** P < 0.01, *** P < 0.0001.
SET1B-dependent H3K4me3 in hypoxia
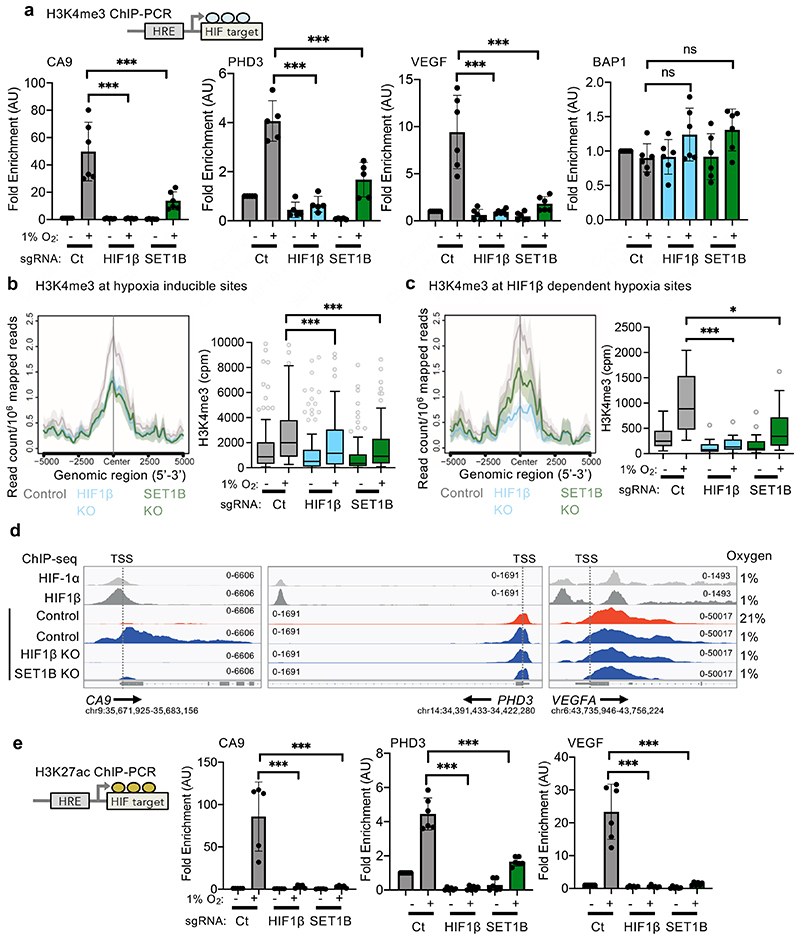
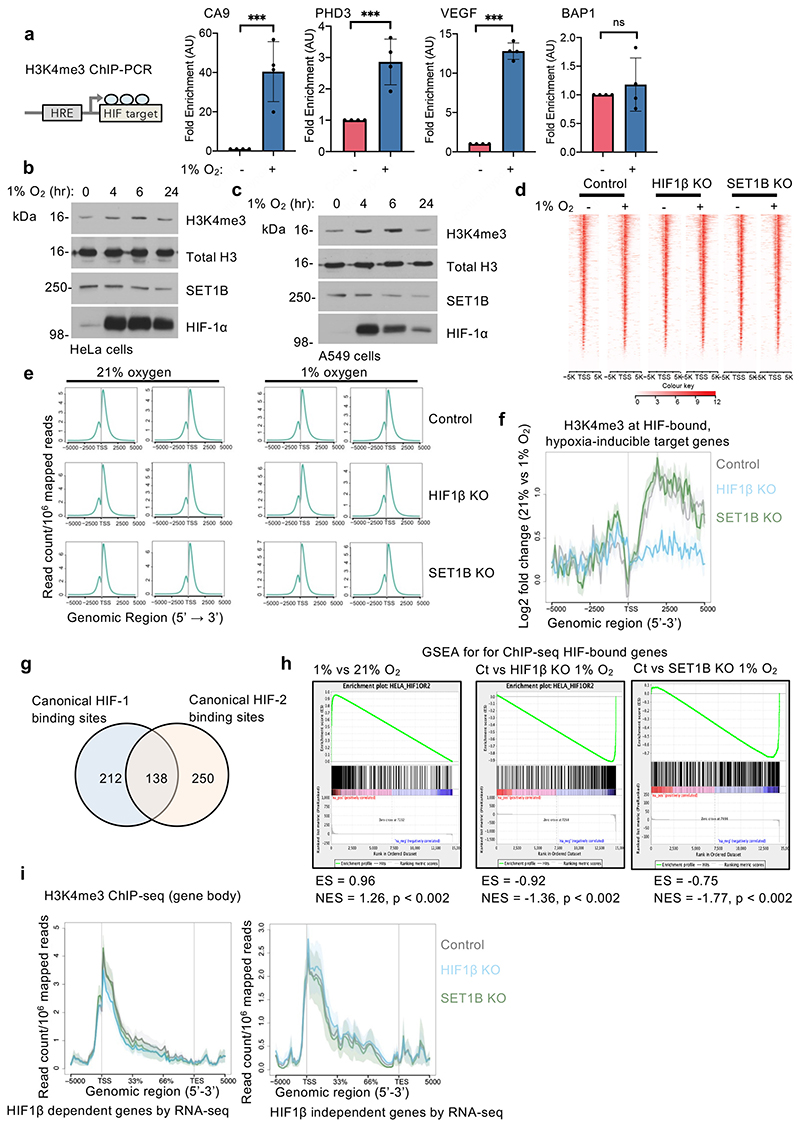
We next determined whether SET1B altered H3K4me3 in hypoxia, and if this occurred at hypoxic or HIF gene loci. HeLa or A549 cells exposed to hypoxia showed a transient increase in total levels of H3K4me3 (Extended Data Fig. 9a-c), as previously reported and attributed to hypoxic inhibition of lysine demethylase activity12,13. ChIP-PCR for H3K4me3 at selected HIF targets also confirmed that this mark increased in hypoxia at promoter regions (Fig. 7a). However, H3K4me3 deposition was clearly HIF dependent, as we observed a substantial decrease in H3K4me3 levels at CA9, PHD3 and VEGF promoter regions in HIF1β null cells, without altering H3K4me3 levels at the promoter of the non-HIF target BAP1 (Fig. 7a).
Fig. 7. SET1B-dependent H3K4me3 in hypoxia.
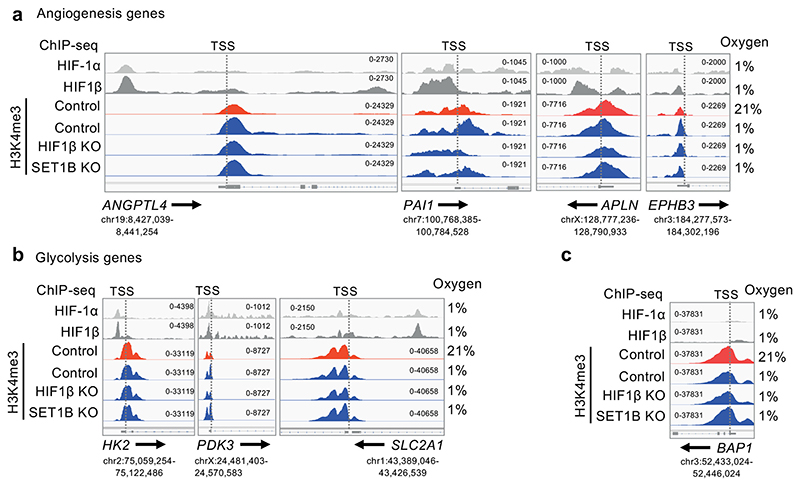
(a) H3K4me3 ChIP-PCR in control, HIF1β- and SET1B-depleted HeLa cells treated with 21% or 1% O2 for 6 h. CA9, control vs. HIF1β or SET1B sgRNA P ≤ 0.0001 (n = 6 biological replicates); PHD3, control vs. HIF1β or SET1B sgRNA P ≤ 0.0001 (n = 5 biological replicates); VEGF, control vs. HIF1β or SET1B sgRNA P ≤ 0.0001 (n = 6 biological replicates); BAP1 (n = 6 biological replicates); two-way ANOVA. (b, c) HIF1β and SET1B loss attenuate hypoxic induction of H3K4me3 signal at hypoxia-inducible sites (n = 2 biological H3K4me3 ChIP-seq replicates of control, HIF1β- or SET1B-depleted HeLa cells). (b) Metagene and box-and-whisker plots showing H3K4me3 signal at 111 hypoxia-inducible sites (FDR < 10-5), identified in control cells using DiffBind. Control vs. HIF1β or SET1B sgRNA P ≤ 0.0001; one-way Friedman test for nonparametric multiple comparisons (c) Metagene and box-and-whisker plots showing changes in H3K4me3 signal at 57 hypoxia-inducible sites that are HIF1β-dependent (i.e. suppressed by HIF1β KO in hypoxic cells). Control vs. HIF1β, P ≤ 0.0001, control vs. SET1B, P = 0.012; one way Friedman test for nonparametric multiple comparisons. (d) Analysis of HIF-1α, HIF1β and H3K4me3 ChIP-seq peaks using the IGV genome browser. Representative HIF-1α, HIF1β and H3K4me3 ChIP-seq normalized reads at CA9, PHD3 and VEGF (VEGFA) genomic regions in wildtype, HIF1β and SET1B mixed population knockout HeLa cells treated with 21% or 1% O2 for 6 h. Arrows indicate the directionality of the gene of interest. Both ChIP-seq replicates showed similar findings. TSS = transcriptional start site. (e) H3K27ac ChIP-PCR in control, HIF1β- and SET1B-depleted HeLa cells treated with 21% or 1% O2 for 6 h. CA9, control vs. HIF1β or SET1B sgRNA P ≤ 0.0001 (n = 5 biological replicates); PHD3, control vs. HIF1β or SET1B sgRNA P ≤ 0.0001 (n = 6 biological replicates); VEGF, control vs. HIF1β or SET1B sgRNA P ≤ 0.0001 (n = 6 biological replicates); two-way ANOVA. Ct = control. Graphs show mean ± SD, * P < 0.05, *** P < 0.0001.
To further explore the association of SET1B with H3K4 methylation in hypoxia, we used ChIP-seq to determine genome-wide H3K4me3 levels and map HIF binding sites (HIF-1α, HIF-2α and HIF1β ChIP-seq). Control, HIF1β or SET1B deficient HeLa cells were incubated in 21% or 1% oxygen for 6 h, and in each dataset, the overall distribution of H3K4me3 was similar (Extended Data Fig. 9d, e). In control HeLa cells, hypoxia increased H3K4me3 levels immediately downstream of the transcriptional start site (TSS) at HIF-bound, hypoxia-induced genes, and this increase was markedly attenuated following HIF1β loss (Extended Data Fig. 9f). However, SET1B loss did not alter overall levels of H3K4me3 at these HIF target genes, consistent with the selective involvement of SET1B in the HIF response. We therefore focused on those sites at which H3K4me3 was most induced by hypoxia (false discovery rate - FDR < 0.00001), and examined the effect of HIF-1β or SET1B depletion (Fig. 7b, c). The observed hypoxia-associated increase in H3K4me3 was reduced in both HIF1β- and SET1B-deficient cells (Fig. 7b, c), and the effect of SET1B depletion was more marked at the subset of hypoxia-dependent sites that were regulated by HIF (i.e. also downregulated by HIF1β depletion in hypoxia, FDR < 0.00001) (Fig. 7b, c).
We integrated the HIF ChIP-seq with the RNA-seq analysis using gene set enrichment analysis (GSEA). High-confidence HIF binding sites (present in at least 4 of the 6 datasets) were identified, along with the neighboring genes, and we observed a strong correlation between HIF bound genes and hypoxic gene induction (Extended Data Fig. 9g, h). Conversely, in hypoxia, these HIF-bound genes were strongly downregulated by HIF1β loss, confirming their HIF-dependence. SET1B loss phenocopied the effect of HIF1β loss, supporting its involvement in HIF-dependent gene induction in hypoxia (Extended Data Fig. 9h). Interestingly, while HIF1β loss decreased H3K4me3 levels at the TSS and across the gene body, SET1B depletion altered H3K4me3 predominantly across the gene body, and the decrease in H3K4me3 at these genes was not seen at hypoxia-induced genes that were independent of HIF1β (Fig. 7d, Extended Data Fig. 9i). Analysis of individual HIF target genes showing a transcriptional dependence on SET1B demonstrated decreased deposition of H3K4me3, with loss of H3K4me3 spreading from the promoter region to the gene body in SET1B KO cells (Fig. 7d, Extended Data Fig. 10a). These findings were apparent in genes identified by the RNA-seq as SET1B-dependent, were not HIF-α-isoform-specific, and tended to involve genes related to angiogenesis rather than glycolysis (Extended Data Fig. 10a-c). However, global H3K4me3 deposition did not clearly segregate according to these biological pathways or on levels of gene expression in 21% oxygen (Fig. 3h).
Lastly, we explored the relationship between H3K4me3 and histone acetylation as several studies have highlighted crosstalk between promoter methylation and acetylation in the control of gene transcription27–29. We measured the levels of H3K27ac at HIF target gene promoter regions by ChIP-PCR, with or without SET1B depletion (Fig. 7e). H3K27ac increased at selected HIF target gene promoter regions in hypoxia, consistent with active gene transcription30, but this H3K27ac accumulation was prevented by either HIF1β or SET1B depletion (Fig. 7e), providing further evidence for SET1B recruitment promoting gene transcription in hypoxia. Together, our findings demonstrate that histone methylation of a subset of HIF target loci is mediated by SET1B, and that HIFs direct this epigenetic regulation through recruitment of the SET1B complex, shedding insights into selective transcriptional regulation of the HIF response (Fig. 8).
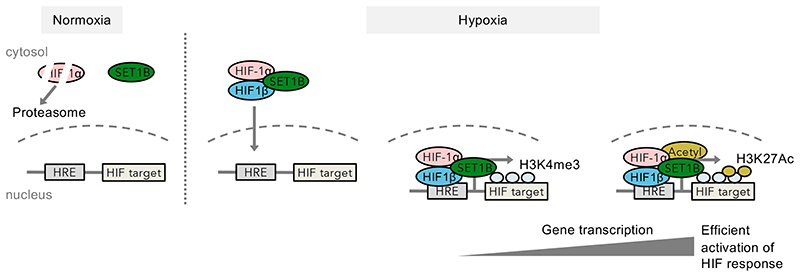
Fig. 8. SET1B is recruited by HIF to facilitate activation of the HIF response.
Model of recruitment of SET1B by HIFs to facilitate expression of specific HIF target genes in hypoxia. In 21% oxygen, HIF1α is degraded via oxygen-dependent proteasomal degradation, and SET1B is predominantly present within the cytosol. In hypoxia, HIF-1α is stabilized, dimerizes with HIF1β and interacts with SET1B. SET1B accumulates in chromatin in hypoxia, and the HIF complex directs SET1B to specific HIF target genes where it deposits H3K4me3 at promoter regions. H3K4me3 deposition may recruit other transcriptional regulators, such as acetyltransferases (Acetyl), which promote activation of HIF target gene expression.
Discussion
Our approach of combining genome-wide mutagenesis with a dynamic HIF fluorescent reporter allowed us to dissect the genetic determinants involved in HIF activation. The identification of canonical HIF complex members (HIF-1β/ARNT and HIF-2α/EPAS1) validated our screen, as did the identification of UBE2A (RAD6), an E2 ubiquitin conjugating enzyme involved in histone ubiquitination31,32. Increasing H2B monoubiquitination is associated with increased H3K4me333, suggesting that this step may be upstream of SET1B recruitment by HIFs. Several other genes involved in DNA binding were significantly enriched for sgRNAs, including a number of Zinc finger/LIM motif proteins (Supplementary Table 1), and while these candidates have not been further validated, they may represent additional mechanisms to tune the HIF response. The identification of PPP4C implicated the involvement of histone acetylation in the HIF response, via HDAC321, but other genes involved in histone acetylation were not significantly enriched in the screen. This may in part be due to the methodology of the screen, whereby cells underwent several days of reoxygenation after the selection to allow growth and for adequate DNA extraction. Loss of some genes involved in HIF activation may have led to cell death, potentially also explaining why HIF-1α was not enriched. Alternatively, histone acetyltransferases may compensate for each other, as CBP/p3008, TIP609 and ZMYND834 are all involved in activation of HIF target genes.
Loss of SET1B led to a reduced and delayed HIF transcriptional response in hypoxia in cancer cells and immortalized skin fibroblasts, demonstrating that SET1B is involved in the normal biological response to oxygen availability, and not just in tumors. Moreover, this effect was specific to SET1B, and not the closely related SET1A that had more general effects on gene expression and impaired cell growth in 21% oxygen. Functional distinction between SET1 genes is consistent with prior studies demonstrating that mutations in either SET1A or SET1B are embryonic lethal at different stages of development35, and that loss of either SET1B or SET1A cannot be rescued by the other36.
In hypoxia, the normal diffuse subcellular localization of SET1B26 alters, with SET1B accumulating on chromatin, with kinetics similar to the accumulation of HIF-1α on chromatin. This relocalization is impaired in combined HIF-1α/HIF1β deficient cells but HIF-2α may still be involved, as we observe some chromatin accumulation of SET1B in 786-0 VHL-proficient cells in hypoxia. These findings lead us to speculate that there may be several mechanisms for SET1B recruitment to HIF target loci, including direct recruitment by HIF-1α, or prolyl hydroxylation of SET1B to provide the stimulus for its cytosolic and nuclear accumulation. Irrespective of this initial recruitment, SET1B is only present at HIF target loci when HIF is bound, and SET1B levels are transcriptionally regulated by hypoxia, providing a potentially elegant feedback mechanism to modulate activation of HIF target genes.
In contrast to HIF1β loss, which completely ablates the expression of HIF target genes, SET1B loss primarily affected a subset of HIF target genes, including genes involved in angiogenesis but with little effect on those involved in glycolysis. The basis for this selectivity is unlikely due to the HIF-α isoforms, as SET1B modulated both HIF-1 and HIF-2 activity in the reporter cell lines. Moreover, although HIF-2 specificity may vary between cell types, HIF-2 target genes (PLIN2, VEGF, and NDRG1; Fig. 3f)37–39 are regulated by SET1B, and SET1B-dependent H3K4 methylation does not show isoform specificity.
Selective activation of HIF targets has been observed with other transcriptional coactivators involved in acetylation, such as CDK8, TIP60 and p3008,9,11,40, which preferentially alter genes involved in glycolysis. SET1B is distinct from these coactivators, targeting a different subset of HIF target genes. The mechanism for this selective gene activation remains to be fully understood, but may relate to local recruitment of coactivators allowing a layered and nuanced response to hypoxia, or be driven by the specific gene promoters. Total H3K4me3 levels at HIF target loci cannot be the full explanation of our findings, as H3K4me3 varies in amplitude and extent across promoter regions (Fig. 7d, Extended Data Fig. 10). An alternative hypothesis is that SET1B is recruited by HIFs to boost the expression of genes that are repressed, or only expressed at low levels at 21% oxygen, such as CA9. H3K4 methylation by the related COMPASS/MLL2 has recently been observed to repel repression by PRC241, and SET1B may function in a similar manner at HIF target gene promoters. There may also be some contribution by SET1A at these non-SET1B targets, as suggested by SET1A depletion decreasing GLUT1 expression (Extended Data Fig. 6g). Lastly, non-histone methylation by SET1B may be involved, as observed with SET1A regulation of YAP transcriptional activity through its monomethylation42.
We show that SET1B-dependent deposition of H3K4me3 is directed by the presence of the HIF complex, and strikingly we observe a complete or near absence of H3K4me3 at HIF targets when HIF1β is depleted (Fig. 7b-d). Recent studies demonstrate that hypoxic inhibition of KDMs increases activating or repressing histone methylation marks12,13, and in the case of H3K4me3, this is dependent on KDM5A activity. HIF-1 has also been shown to recruit JMJD2C (KDM4C), removing the repressive mark H3K9me343. Therefore, in addition to hypoxic regulation of KDMs, H3K4me3 deposition is directed by HIF in a predominantly SET1B-dependent manner. A synergistic relationship between SET1B-mediated methylation and hypoxic inhibition of KDM5A may occur, allowing the recruitment of the HIF complex and rapid activation of HIF target genes.
There remains active debate about whether H3K4me3 is a cause or consequence of active transcription. While we did not test the possibility that SET1B may have non-catalytic or histone-independent functions, our data show that loss of SET1B leads to reduced H3K4me3, decreased H3K27ac and a reduction in HIF target gene transcription, even though the HIF complex remained bound at promoter regions (Fig. 6a, b). This apparent interdependence between H3K4me3 and H3K27ac regulated by SET1B is consistent with a report showing that the binding of SET1A to p53 leads to methylation-dependent recruitment of p30027. It is possible that SET1B may interact with acetyltransferases involved in activation of HIF target genes, which will be an important area of further study.
A primary purpose for the cellular response to hypoxia is to promote cellular survival and restore oxygen homeostasis. We demonstrate a requirement for SET1B in the HIF response, and show SET1B loss leads to reduced tumor establishment, increased tumor hypoxia and reduced blood vessel density. This role of SET1B in tumor growth may offer a potential therapeutic approach to modulating the HIF response. HIF-2α inhibitors, which block the dimerization of the HIF-2α PAS-B domain with HIF1β44,45 are showing promising results in clear cell renal cell carcinoma46. If SET1B is confirmed to also associate with HIF-α isoforms through their PAS-B domains, targeting this interaction may be an adjunct to current strategies, and will be an important area to explore, particularly as acquired resistance to HIF-2α inhibitors has been observed47. Furthermore, our findings highlight that targeting SET1B may allow an approach to switch off specific arms of the HIF pathway, which would be of benefit in angiogenic tumors but would not alter other important metabolic consequences of HIF activation, such as those observed in inflammatory responses.
Methods
Cell culture and reagents
HeLa, HEK293T, MCF7, A549 cells and skin fibroblasts cells (gift from the Larrieu laboratory, Cambridge Institute for Medical Research) were maintained in Dulbecco’s Modified Eagle’s Medium (DMEM, Sigma) and supplemented with 10% fetal calf serum (FCS). 786-0 cells and 786-0 VHL reconstituted cells48 were maintained in RPMI-1640 (Sigma) supplemented with 10% FCS. Hypoxic cell culture was performed in a Whitley H35 Hypoxystation (Don Whitley Scientific) at 37°C, 5% CO2, 1% O2 and 94% N2. Cells were confirmed mycoplasma negative (Lonza, MycoAltert), and authenticated by STR profiling (Eurofins Genomics). Full details of reagents and antibodies used as shown in Supplementary Table 2.
Plasmids
Plasmids used: pKLV-U6gRNA-EF(BbsI)-PGKpuro2ABFP (Addgene plasmid #62348), LentiCRISPR v2 (sgRNA/Cas9, F. Zhang Addgene #52961), pHRSIN-pSFFV-HA-pPGK-Puro, pHRSIN-pSFFV-pPGK-Puro, pMD.G (Lentiviral VSVG), pMD.GagPol (Lentiviral Gag/Pol)49. HIF1α-ODDGFP and HIF1α-ODDmCherry reporters generated as previously described16,17. HIF constructs were generated from pCDNA3 HIF-1α and cloned into the pHRSIN pSFFV backbone with puromycin resistance using NEBuilder HiFi (NEB). The SET1B construct was a gift from David Skalnik’s laboratory. SET1B was cloned into pHRSIN pSFFV backbone with puromycin resistance using NEBuilder HiFi (NEB). Primers for HIF-1α and SET1B cloning are shown in Supplementary Table 2.
Lentiviral production and transduction
Lentivirus was produced by transfection of HEK293T cells (Trans-IT 293 reagent (Mirus) or Fugene (Promega) at 70-80% confluency in 6-well plates, with the appropriate pHRSIN vector and the packaging vectors pCMVR8.91 (gag/pol) and pMD.G (VSVG). Viral supernatant was harvested at 48 h, filtered (0.45 μm filter), and stored at -80° C. For transduction, cells were seeded on 24-well plates in 500 μl media, 500 μl viral supernatant added, and plates centrifuged at 1,800 rpm, 37° C for 1 h. Antibiotic selection was applied from 48 h.
Flow cytometry
2 × 10⁵ cells per sample were washed in ice-cold PBS in 5 ml FACS tubes and resuspended in 500 μl PBS/formaldehyde prior to analysis on a FACScalibur (GFP, AF488, AF647) or BD Fortessa (GFP, mCherry). For cell-surface staining, cells were washed in ice-cold PBS, incubated at 4° C for 30 min with the primary antibody, washed with PBS, and incubated with the appropriate secondary antibody at 4° C for 30 min. Gating strategy shown in Supplementary Figure 1.
Genome-wide CRISPR-Cas9 forward genetic screen
The Toronto human knockout library (TKO) Version 1 (Addgene 1000000069)18 was a gift from Jason Moffat. Clonal HeLa HRE-ODDmCherry cells were transduced with Streptococcus pyrogenes Cas9 (pHRSIN-FLAG-NLS-Cas9-NLS-pGK-Hygro) and selected for Cas9 expression using hygromycin. 1 × 10⁸ HeLa HRE-ODDmCherry cells were transduced with pooled sgRNA virus (multiplicity of infection (MOI) of approximately 0.3), maintaining a 170-fold sgRNA coverage. After 30 h, cells were treated with puromycin 1 μg/ml for 5 days. Representation was maintained throughout the screen at a minimum of 5 × 10⁷ cells. The library was pooled before any selection event. After 8 days, FACS was performed by harvesting and sorting 108 cells after 24 h of 1% O2, washing the cells in PBS, and resuspending in PBS with 2% fetal calf serum and 10 mM HEPES (Sigma H0887). Cells were sorted using an Influx cell sorter (BD) and kept on ice through this process to maintain stability of the reporter. mCherry-Low cells were chosen in a gate set at one log10 unit below the mode of the 1% O2 treated control population. Cells were grown in culture for a further 8 or 12 days (17 or 21 days after initial transduction) and then harvested for DNA extraction. Genomic DNA was extracted using a Gentra Puregene Core kit (Qiagen). Lentiviral sgRNA inserts were amplified in a two-step PCR (with Illumina adapters added on the second PCR)50, (Supplementary Table 2). Sequencing analysis was performed by extracting the raw sequence reads, trimming the first 20 bp, and aligning against the appropriate sgRNA library using Bowtie40. Read counts for each sgRNA were compared between conditions, and Benjamini-Hochberg false discovery rates for each gene calculated, using MAGeCK41 (Supplementary Dataset 1). The analysis presented compares DNA extracted following the second sort to an unsorted DNA library taken at the same time point.
CRISPR-Cas9 targeted deletions
Gene-specific CRISPR sgRNA sequences were taken from the TKO library or designed using ECRISP (http://www.e-crisp.org/E-CRISP/), with 5’CACC and 3’CAAA overhangs respectively. SgRNAs were ligated into the LentiCRISPRv2 or pKLV-U6gRNA(BbsI)-PGKpuro2ABFP vector, and lentivirus produced as described. Transduced cells were selected with puromycin, and were generally cultured for 9-10 days prior to subsequent experiments to allow sufficient times for depletion of the target protein. KO clones were isolated from the sgRNA-targeted populations by serial dilution or FACS. SgRNAs used are shown in Supplementary Table 2.
Immunoblotting
Cells were lysed in an SDS lysis buffer (1% SDS, 50 mM Tris (pH 7.4), 150 mM NaCl, 10% glycerol and 5 μl/ml Benzonase (Sigma)) for 10 min before heating at 90° C for 5 min. Proteins were separated by SDS-PAGE, transferred to PVDF membranes, probed with appropriate primary and secondary antibodies, and developed using ECL or Supersignal West Pico Plus Chemiluminescent (Thermo Scientific).
qPCR
Total RNA was extracted using the RNeasy Plus minikit (QIAGEN) following the manufacturer’s instructions and then reversed transcribed using Protoscript II Reverse Transcriptase (NEB). 20 ng of template cDNA was amplified using the ABI 7900HT Real-Time PCR system (Applied Biotechnology or Quantstudio 7 (Thermo Scientific). Reactions Transcript levels of genes were normalized to a reference index of housekeeping gene (β-actin). The primers sequences in Supplementary Table 2.
RNA-seq analysis
Total RNA was extracted from HeLa cells using the RNeasy Plus minikit (QIAGEN). Library preparation and sequencing (HiSeq, Illumina) were undertaken by Genewiz. Analysis was undertaken by Genewiz and our laboratory. After investigating the quality of the raw data, sequence reads were trimmed to remove possible adapter sequences and nucleotides with poor quality using Trimmomatic v.0.36. The trimmed reads were mapped to the Homo sapiens reference genome available on ENSEMBL using the STAR aligner v.2.5.2b. and BAM files generated. Unique gene hit counts were calculated by using feature Counts from the Subread package v.1.5.2. Only unique reads that fell within exon regions were counted. Since a strand-specific library preparation was performed, the reads were strand-specifically counted. The gene hit counts table was used for downstream differential expression analysis (DESeq2). The Wald test was used to generate P values and log2 fold-changes. Genes with adjusted P values < 0.05 and absolute log2 fold-changes > 0.5 were called as differentially expressed genes for each comparison. A gene ontology analysis was performed on the statistically significant set of genes by implementing the software GeneSCF. The mgi GO list was used to cluster the set of genes based on their biological process and determine their statistical significance.
Immunoprecipitation
HeLa cells were lysed in 1% Triton TBS, with 1× Roche cOmplete EDTA-free protease inhibitor cocktail for 30 min at 4° C. Lysates were centrifuged at 14,000 rpm for 10 min, supernatants collected and then diluted to 0.1% detergent for pre-clearing with Protein G magnetic beads (Thermo Scientific) for 2 h at 4° C. Supernatants were then incubated with primary antibody overnight (rotation at 4° C). Protein G magnetic beads were then added for 2 h, and samples were then washed 3 times. Bound proteins were eluted in 2× SDS loading buffer, separated by SDS-PAGE, and immunoblotted.
Subcellular fractionation
10 × 106 HeLa or A549 cells were washed in PBS and lysed in Buffer A (10 mM HEPES, 1.5 mM MgCl2, 10 mM KCl, 0.5 mM DTT, EDTA-free protease inhibitor cocktail tablet (Roche)), and incubated with rotation at 4°C for 10 min. Supernatant containing cytosolic fractions were collected by centrifugation (1,400g for 4 min at 4° C). The nuclear pellet was resuspended in Buffer B (20 mM HEPES, 1.5 mM MgCl2, 300 mM NaCl, 0.5 mM DTT, 25% glycerol, 0.2 mM EDTA, EDTA-free protease inhibitor cocktail tablet) for 10 min on ice to separate nucleoplasmic and chromatin fractions. Samples were centrifuged at 1,700g for 4 min at 4° C, separating the soluble nucleoplasm from the insoluble chromatin fraction. The chromatin fraction was solubilized in 2× SDS loading buffer containing 1:500 Benzonase (Sigma).
VEGF ELISA
Cells were plated in 6-well plates and treated with 1% or 21% O2 for 24 h. Culture supernatants were collected and centrifuged at 1,500 rpm for 10 min at 4° C, and analyzed using the Human VEGF Quantikine ELISA kit (R&D Systems) according to the manufacturer’s instructions.
Bioenergetic Analyses
Extracellular acidification rates (ECAR) and oxygen consumption rate (OCR) of cells were measured as indicators of glycolysis and oxidative phosphorylation respectively, using a Seahorse XF analyzer (Agilent Technologies, Santa Clara, USA). The Glycolytic Rate Assay was performed according to the manufacturer’s instructions using Seahorse XF FluxPak consumables (Agilent Technologies). Briefly, HeLa or A549 cells were depleted of HIF1β or SET1B by sgRNA. Cells were plated in FluxPak 96 well plates in DMEM (Sigma Aldrich) plus 10% FBS at a cell density of 1 × 10⁴ (HeLa) or 2 × 10⁴ (A549) with or without 1 mM DMOG (Cayman Chemical), 100 μM Roxadustat (Cayman Chemical) or 100 μM Daprodustat (Cayman Chemical), and incubated at 37°C for 24 h. The medium was replaced with XF DMEM, pH 7.4 (Agilent Technologies) supplemented with 1 mM sodium pyruvate (Life Technologies), 2 mM L-glutamine (Life Technologies), 10 mM glucose (Sigma Aldrich) and incubated at 37°C in a non-CO2 incubator for 1 h before replacing with the same medium prior to measuring in the analyzer. Program settings: mix 3 min, measure 3 min × 3; inject 0.5 μM rotenone (Sigma Aldrich) and 0.5 μM antimycin A (Sigma Aldrich); mix 3 min measure 3 min x3; inject 50 mM 2-deoxyglucose (Alfa Aesar); mix 3 min, measure 3 min × 5. Medium was then removed and the plate was stored at -80°C for relative cell quantification using the CyQUANT Cell Proliferation Assay kit (Life Technologies). Results were normalized and analyzed using WAVE version 2.6.1, and data exported to the Agilent Seahorse XF Glycolytic Rate Assay Report Generator. Graphs were prepared using GraphPad Prism version 8.
ChIP qPCR
HeLa cells grown on 15-cm dishes up a 2 × 10⁶ density, and treated with 1% formaldehyde for 10 min to crosslink proteins to chromatin. The reaction was quenched with glycine (0.125 M for 10 min at room temperature). Cells were then washed in ice cold PBS twice, scraped in tubes, and centrifuged at 800 rpm for 10 min, before lysis in 500 μl of ChIP lysis buffer (50 mM Tris-HCl (pH 8.1), 1% SDS, 10 mM EDTA, Complete Mini EDTA-free protease inhibitor). Samples were incubated on ice for 10 min and diluted 1:1 with ChIP dilution buffer (20 mM Tris-HCl (pH 8.1), 1% (v/v) Triton X-100, 2 mM EDTA and 150 mM NaCl). Samples were then sonicated in tubes and beads for 20 cycles of 15 s on and 30 s off in a Biorupter (Diagenode), followed by centrifugation for 10 min at 13,000 rpm at 4°C. Supernatants were collected and 20 μl stored at -20°C as the input sample. 200 μl of the remaining sample was diluted with ChIP dilution buffer to 1 ml, and precleared using 25 μl Protein G magnetic beads (4° C, 2 h, rotating). 1 ml of sample was immunoprecipitated with the appropriate primary antibody (4° C, overnight, rotating). 25 μl Protein G magnetic beads were added and incubated for a further 2 h at 4° C. The beads were washed sequentially for 5 min each with Wash Buffer 1 (20 mM Tris-HCl (pH 8.1), 0.1% (w/v) SDS, 1% (v/v) Triton X-100, 2 mM EDTA, 150 mM NaCl), Wash Buffer 2 (Wash Buffer 1 with 500 mM NaCl), Wash Buffer 3 (10 mM Tris-HCl (pH 8.1), 0.25 M LiCl, 7 1% (v/v) NP-40, 1% (w/v) Na-deoxycholate, 1 mM EDTA), and 2× with TE buffer (10 mM Tris-HCl (pH 8.0) and 1 mM EDTA). Bound complexes were eluted with 120 μl Elution Buffer (1% (w/v) SDS and 0.1 M Na-bicarbonate), and crosslinking reversed by addition of 0.2 M NaCl, and incubation at 65° C overnight with agitation (300 rpm). Protein was digested with 20 μg proteinase K (Thermo Scientific) for 4 h at 45°C. RNase H (Thermo Scientific) was added for 30 min at 37°C and DNA purified using the DNA minielute kit (QIAGEN). DNA underwent qPCR analysis, and results expressed relative to input material. Primers sequences shown in Supplementary Table 2.
ChIP-seq and data analysis
H3K4me3 ChIP was performed as described but upscaled by five-fold, and the beads and antibody were 2×. HIF-1α, HIF-2α and HIF-1β ChIP were performed as previously described51. The following ChIP-seq datasets were generated: HIF-1α, HIF-2α and HIF1β in HeLa control cells in 1% oxygen, H3K4me3 in 21% and 1% oxygen in HeLa control, SET1B mixed KO, or HIF1β mixed KO cells. Experiments were performed in duplicate and sample quality control and fragmentation was measured using the Bioanalyzer (Agilent). 10 ng of each ChIP sample and corresponding input were used in single-end DNA library construction and 75-bp paired-end sequencing was performed using the HiSeq 4000 platform (Illumina). ChIP-seq data were processed as previously described52 and mapped to the RefSeq hg19 (GRCh37) build of the human genome. Heat maps of H3K4me3 signal in relation to transcription start sites (TSS ± 5 kb), ranked according to gene expression in the RNA-seq analysis, and line graphs showing the average (mean) signal across these regions were generated using ngsplot 2.6.153. Signal intensities at specific gene loci were displayed using IGV Genome Browser54 v 2.7.2.
ChIP-seq peaks were identified using both the T-PIC (Tree shape Peak Identification for ChIP-Seq)55 and MACS (Model-based analysis of ChIP-Seq) and only peaks identified with both peak callers were considered. Differentially bound peaks (FDR < 10-5) were identified using DiffBind v2.16.056. Overlapping peaks were identified using BEDTools v2.17.057 and normalized read counts for each peak were determined using samtools v0.1.1958.
HIF-1α, HIF-2α and HIF-1β ChIP-seq data were used to identify high-confidence canonical HIF binding sites (i.e. present in both HIF-1α and HIF1β replicates, and/or both HIF-2α and HIF1β replicates). 600 binding sites were identified, but when annotated to the nearest gene resulted in 550 HIF-bound gene loci. These HIF ChIP-seq data were combined with the RNA-seq using Gene Set Enrichment Analysis59,60.
siRNA-mediated depletion
siRNA SMARTpools for SET1B (Dharmacon) or MISSION siRNA Universal Negative Control were transfected into HeLa or A549 cells using Lipofectamine RNAi MAX (Thermo Fisher). Cells were harvested after 48 h for further analysis by flow cytometry, qPCR, or immunoblot.
Cell proliferation and death assays
Cells were plated on six-well plates at a density of 5 × 10⁴ for HeLa or 1 × 10⁵ for A549 cells, and counted every 24 h for three days when grown either at 21% or 1% O2. Cells were counted using a hemocytometer in triplicate. Cell division was also assessed using both CFSE assay (CellTrace CFSE Proliferation kit, Thermo Scientific). Cell death via apoptosis was measured using a caspase 3 activity kit (CellEvent Caspase 3/7, Thermo Fischer), according to manufacturer’s instructions.
Generation and measurement of spheroids
2.5 × 10³ HeLa cells were seeded in 96-well Clear Round Bottom Ultra-Low Attachment Microplates (7007, Corning®) in a final volume of 200 μl. Cells were centrifuged at 2,000 rpm for 10 min to encourage the formation of a single spheroid per well. 12 replicates of each condition were plated in each biological replicate. Every three days, 100 μl cell culture medium was replaced, and every two days spheroids were photographed in an EVOS™ M500 (Thermo Fisher Scientific™) at 4× magnification. Spheroids were cultured for 7 days. Fiji Image J Software was used to measure the volume and circularity of spheroids. Spheroid area was calculated as previously reported61, and used to determine spheroid radius (R = √(area/π)), from which the volume (V = (4/3) πR3) was calculated. Each spheroid’s GFP levels were quantified using Fiji Image J Software and the intensity relative to spheroid volume was depicted.
Tumor xenografts
HeLa, A549 and 786-0 cells were resuspended in chilled matrigel and PBS (mixed 1:1) and implanted subcutaneously (0.1 ml (HELA, A549) or 0.2 ml (786-0) of 5 × 10⁷ cells/ml) into female (HeLa) or male and female (A549, 786-0) athymic nude mice Crl: NU(NCr)-Foxn1nu (Charles River Laboratories, Inc.), aged 8-9 weeks. Mice were randomly assigned into groups (using a randomization function =RAND(); excel) that received wildtype, HIF1β- or SET1B-depleted tumor cells. Tumor length (L), width (W) and height (H) were measured with calipers, and tumor volume was calculated with the formula (L × W × H)= volume (mm3). Tumor establishment was defined as a palpable tumor mass of 200 mm3. Tumors were excised at maximum burden (1,000 mm3) and snap-frozen in compliance with our ethical approval. Investigators were blinded to the tumor group status during tumor measurement. Two hours prior to sacrifice and tumor excision, mice received pimonidazole (60 mg/kg dosed in 0.1 ml/10 g body weight, intra-peritoneal injection). All mice were housed in specific pathogen-free animal facilities (at 20-23°C, with 40–60% humidity, 12 h light/12 h dark cycle). Sample size was calculated using the Resource Equation. Procedures were ethically approved by the University of Cambridge Animal Welfare and Ethical Review Body (AWERB) and complied with the Animals (Scientific Procedures) Act 1986 Amendment Regulations 2012, under the authority of a UK Home Office License. The ARRIVE (Animal Research: Reporting In Vivo Experiments) guidelines (https://www.nc3rs.org.uk/arriveguidelines) were used for planning, conducting and reporting of experiments.
Immunofluorescence
Frozen tumor sections (8 μm) were fixed in acetone at -20 °C (10 min) and blocked with 10% horse serum, PBS (15 min). Sections were incubated with anti-mouse CD31 (BD Pharmingen, UK, #553370), or Pimonidazole (Hydroxyprobe 1 clone 4.3.11.3, Natural Pharmacia International Inc., USA), both diluted 1:50, in a humidified container for 18 h (4°C). Sections were then washed with PBS, incubated with secondary Alexa Fluor-labelled antibodies (1:500), washed with PBS, and counterstained with 4’,6-diamidino-2-phenylindole (DAPI, (5 mg/ml diluted 1:5000), Sections were mounted in fluorescent mounting media (DAKO UK Ltd., UK).
Visualization of tumor sections and quantitation of hypoxic fraction
Immunofluorescently labelled tumor sections were digitized on Axioimager Z2 Upright Microscope (Zeiss) using Zen Blue Pro 202 software (version 1.1.2.0; Zeiss). At least two independent sections were analyzed per tumor and analyses were performed using ImageJ software (version 1.52a). For quantification of pimonidazole-positive regions, a positive staining threshold was determined against background staining of tumor sections stained with secondary Alexa Fluor-labelled antibodies (1:500) only. Values above this threshold were deemed positive. Regions giving false positive staining (tumor edges that had lifted slightly and regions of necrotic cells, which bind secondary antibodies non-specifically) were excluded from the analyses. Hypoxic fraction was determined by analyzing the area of pimonidazole positive staining within the tumor section area. The image analysis was performed blinded.
Tumor necrosis was identified by DAPI staining and defined as regions with fragmentation and/or disappearance of nuclear labelling as previously described62, with tumor cells visible to variable extent. Percentage tumor necrosis was determined by analyzing the area of necrotic regions within the tumor section area.
Immunohistochemically labelled tumor sections were digitized on an Aperio AT2 digital pathology slide scanner (Leica). Images were visualized using QuPath software63. A grid comprising 450 × 450 μm squares was overlaid onto the tumor sections and ten squares were randomly selected using a randomization function on Excel software. These ten squares (total area of analysis: 2.025 mm2) were exported in TIFF format for analysis of vessel density, total vessel circumference and mean vessel circumference in AngioQuant64. The image analysis was performed blinded.
Statistical Analyses
Quantification and data analysis of experiments are expressed as mean ± SD and P values were calculated using ANOVA or two-tailed Student’s t-test for pairwise comparisons, and were calculated using Graphpad Prism version 8. Qualitative experiments were repeated independently to confirm accuracy. Statistical analysis of the screen was performed using MAGeCK version 0.5.565, testing the sgRNA read counts obtained following the second sort against sgRNA read counts obtained from unsorted cells lysed at the same time point. Statistical analyses for the xenograft experiments, RNA-seq, and ChIP-seq are described within the relevant sections.
1. Extended Data
Extended Data Fig. 1. Genome-wide mutagenesis screen identifies genes required to activate a HIF response.
(a-g) Screen validation using CRISPR-Cas9 targeted depletion in mixed KO populations. HeLa HRE-ODDGFP reporter cells were transduced with sgRNAs against (a) HIF1β or UBE2A; (b-d)β2m; (e) RNF20 or RNF40; (f) HIF1β or PPP4C; (g) SET1B. Cells were treated with 21% or 1% O2 for 24 h or DMOG 1 mM for 24 h, and GFP levels measured by flow cytometry. (h, i) KO clones of HIF1β and SET1B were generated in HeLa HRE-GFPODD reporter cells by serial dilution and validated by immunoblot (representative of 3 experiments) (i). (h) Control or KO clones were incubated at 21% or 1% O2 for 24 h and the GFP levels were measured by flow cytometry (n=3 biologically independent samples). (j) Loss of SET1B or HIF1β does not alter basal reporter activity. HIF1β and SET1B mixed KO populations of HeLa HRE-ODDGFP reporter cells were generated using CRISPR-Cas9 targeted depletion, and GFP levels were measured with flow cytometry.
Extended Data Fig. 2. SET1B depletion decreases HIF-1α activation of CA9.
(a) Wildtype HeLa or SET1B clonal KO cells were incubated at 1% O2, and analysed by immunoblot (representative of 3 biological replicates). (b) HIF-1α mRNA expression in different cell types following HIF1β or SET1B loss after 24 h hypoxia. n= 5 (HeLa), 6 (A549), 3 (MCF7), 4 (skin fibroblasts) biological replicates. (c-e) Immunoblots for the HIF complex in HeLa (c), MCF7 (d) and skin fibroblast cells (e) depleted of HIF1β or SET1B (n= 3 biological replicates). (f) Reconstitution of mixed KO populations of SET1B in A549 cells transfected with control or SET1B siRNA, with and without SET1B overexpression (representative of 3 biological replicates). (g) HeLa cells were transfected with a control or SET1B siRNA for 48 h, mRNA extracted and SET1A or SET1B expression measured by qPCR. Control vs. SET1B siRNA, P ≤ 0.0001; two-way ANOVA. n=6 biological replicates. (h) Reconstitution of SET1B depleted HeLa HRE-GFPODD reporter cells by transfecting control or SET1B siRNA, with or without SET1B overexpression for 48 h. Cells were treated with 1 mM DMOG for 24 h and GFP levels measured by flow cytometry. (i, j) SET1B loss decreases HIF activity in response to hypoxia mimetics. HIF1β and SET1B depleted HeLa HRE-GFPODD reporter cells were analysed by flow cytometry (i) or immunoblotting (j) following 24 h with and without 1 mM DMOG (representative of 3 biological replicates). (k) Proteasome inhibition does not increase CA9 levels following SET1B or HIF-1β depletion. HeLa cells stably expressing Cas9 were transduced with sgRNAs against either HIF1β or SET1B. Following 7-10 days cells were treated at 21% or 1% O2 for 24 h and where indicated were treated with 20 μM MG132 for 3 h (representative of 3 biological replicates). wt=wildtype. Graphs show mean ± SD. **** p < 0.0001.
Extended Data Fig. 3. SET1B loss impairs mRNA expression of a subset of HIF target genes.
(a-c) Volcano plots of fold change in mRNA expression in wildtype (b), HIF1β depleted (c) or SET1B depleted (d) HeLa cells incubated in 21% or 1% O2 for 12 h. Significantly up (red) or downregulated (blue) genes shown (log2(fold change) of > 0.5 or < -0.5). (d-f) Expression of HIF target genes in mixed KO populations of HIF1β or SET1B cells in A549 (d), MCF7 (e) or skin fibroblasts (f), following incubation in 21% O2 or 1% O2for 24 h. (d) CA9, control vs. HIF1β or SET1B sgRNA P ≤ 0.0001 (n=3 biological replicates); PHD3, control vs. HIF1β or SET1B sgRNA P ≤ 0.0001 (n=3 biological replicates); VEGF, control vs. HIF1β or SET1B sgRNA P ≤ 0.0001 (n=5 biological replicates); GLUT1, control vs. HIF1β, P ≤ 0.0001 (n=3 biological replicates); BAP1 (n=6 biological replicates); two-way ANOVA. (e) CA9, control vs. HIF1β or SET1B sgRNA P ≤ 0.0001 (n=3 biological replicates); PHD3, control vs. HIF1β or SET1B sgRNA P ≤ 0.0001 (n=3 biological replicates); two-way ANOVA. (f) CA9, control vs. HIF1β or SET1B sgRNA P ≤ 0.0001 (n=3 biological replicates); PHD3, control vs. HIF1β or SET1B sgRNA P ≤ 0.0001 (n=3 biological replicates); two-way ANOVA. (g, h) mRNA expression of HIF target genes following reconstitution of SET1B depletion and incubation in 21% or 1% O2 for 24 h. (g) HeLa cells: CA9, control vs. siSET1B P = 0.0006 (n=3 biological replicates); VEGF, control vs. siSET1B P = 0.0005; VEGF, control vs. siSET1B+SET1B P = 0.029 (n=3 biological replicates); SET1B, control vs siSET1B+SET1B P = 0.0064; SET1B, control vs. siSET1B+SET1B P ≤ 0.0001; BAP1 (n=3 biological replicates); twoway ANOVA. (h) A549 cells: CA9, control vs. siSET1B P = 0.002 (n=3 biological replicates); SET1B, control vs siSET1B+SET1B P = 0.014; SET1B, control vs. siSET1B+SET1B P = 0.0002; BAP1 (n=3 biological replicates); two-way ANOVA. Ct=control. Graphs show mean ± SD, * P < 0.05, ** P < 0.01, *** P < 0.001.
Extended Data Fig. 4. Gene expression changes following SET1B loss are not dependent on HIF-α isoforms.
(a-d) Venn diagrams of identified HIF and SET1B dependent genes in the HeLa RNA-seq analysis with previously reported datasets of identified HIF-1 and HIF-2 binding sites63 in MCF7 (a, b) or HepG2 (c, d) cells. (e-g) Characterisation of HeLa HRE-HIFODDGFP HIF KO cell lines. (e) HeLa wildtype (Wt), HIF-1α KO, HIF-2α or HIF-1/2α KO HeLa clones were generated by sgRNA depletion and dilution cloning. Representative immunoblot of 3 independent experiments confirming HIF-1α or HIF-2α depletion is shown following incubation at 21% or 1% O2 for 24 h (e). (f) Combined HIF-1α and HIF-2α loss prevents activation of the GFP reporter (representative null clone). (g) HeLa wildtype, HIF-1α KO and HIF-2α KO clones stably expressing Cas9 were transduced with a sgRNA against HIF1βor SET1B. Cells were treated with and without 1 mM DMOG and GFP reporter levels were measured using flow cytometry. (h, i) qPCR of selected HIF target genes following SET1B depletion in 786-0 cells. (h) Representative immunoblot of SET1B and HIF1β depletion in 786-0 cells (3 biological replicates). (i) mRNA expression of selected HIF-2α target genes. CA9, control vs. HIF1β sgRNA P ≤ 0.0001; CA9, control vs SET1B sgRNA P = 0.0006; PAI, control vs. HIF1β P ≤ 0.0001; PAI, control vs SET1B sgRNA P = 0.001; ANGPTL4, control vs. HIF1β or SET1B sgRNA P ≤ 0.0001; GLUT1, control vs HIF1β sgRNA P ≤ 0.0001; two-way ANOVA. Ct=control. Graphs show mean ± SD, ** P < 0.01, *** P < 0.001.
Extended Data Fig. 5. SET1B regulates the expression of a subset of HIF-target genes.
(a) Pathway analysis of enriched genes dependent on HIF1β or SET1B in hypoxia. HIF1β and SET1B dependent genes identified from the RNA Seq were run through Metascape analysis to identify the pathways which were enriched. (b) Heat map comparing the log2(fold change) between control, HIF1β and SET1B depleted cells focussing on genes involved in angiogenesis and glycolysis. (c) qPCR of selected angiogenesis (left) or glycolysis genes (right) in mixed KO populations of HIF1β or SET1B HeLa cells. VEGF, control vs. HIF1β or SET1B sgRNA P ≤ 0.0001; PAI, control vs. HIF1β or SET1B sgRNA P ≤ 0.0001; ANGPTL4, control vs. HIF1β or SET1B sgRNA P ≤ 0.0001; LDHA, control vs. HIF1β sgRNA P ≤ 0.0001; GLUT1, control vs HIF1β sgRNA P ≤ 0.0001; two-way ANOVA, n= 3 biological replicates. (d) VEGF ELISA in control, HIF1β or SET1B depleted HeLa cells. Cells were grown in 21% or 1% O2 before supernatants were collected. VEGF control vs. HIF1β or SET1B sgRNA P ≤ 0.0001; two-way ANOVA, n= 3 biological replicates. Ct=control. Graphs show mean ± SD, *** P < 0.001.
Extended Data Fig. 6. Bioenergetic analyses of glycolysis following SET1B depletion.
(a, b) Wildtype, HIF1β depleted or SET1B depleted HeLa cells were generated as described, and incubated with or without DMOG (1 mM), Roxadustat (0.1 mM), or Daprodustat (0.1 mM) for 24 h. Cells were analysed using a Seahorse XF analyzer by performing a Glycolytic Rate Assay. Oxygen consumption rates (OCR), extracellular acidification rates (ECAR) and the protein efflux rate derived from glycolysis (glycoPER) as a percentage of total were calculated using WAVE version 2.6.1. (c, d) Bioenergetic analyses for wildtype, HIF1β depleted or SET1B depleted A549 cells, as described for HeLa cells. In A549 cells DMOG altered OCR in a HIF1β independent manner. n=3 for HeLa, n=2 for A549 for biological replicates. Representative data from one experiment shown with mean ± SD of 6 technical replicates.
Extended Data Fig. 7. Increased apoptosis and impaired angiogenesis following SET1B loss in hypoxia.
(a-c) Proliferation assays of control, HIF1β or SET1B depleted A549 (a) or HeLa cells (b, c) in 21% O2 (n=3 biological replicates). (d) Time course of SET1B and HIF-1α protein levels in 1% O2 (representative of 3 biological replicates). (e) qPCR analysis of SET1B and CA9 expression following 21% or 1% O2 for 24 h. HeLa SET1B 21% vs. 1% O2 P ≤ 0.0001, HeLa CA9 21% vs. 1% O2 P = 0.0028, A549 SET1B 21% vs. 1% O2 P = 0.0006, HeLa CA9 21% vs. 1% O2 P = 0.022; 3 biological replicates, unpaired two-tail t test. (f) Proliferation assay of SET1B or SET1A deficient A549 cells in 21% O2. Control vs. SET1A depletion at 3 days, P ≤ 0.0001; 3 biological replicates, two-way ANOVA. (g) qPCR analysis for GLUT1, HIF-1α and BAP1 in SET1A or SET1B depleted A549 cells. GLUT1 levels SET1B vs. SET1A depletion P = 0.0006, HIF-1 α levels SET1B vs. SET1A depletion P = 0.0003, BAP1 levels SET1B vs. SET1A depletion P = 0.004; 6 biological replicates, two-way ANOVA. (h) CFSE assay in HIF1β or SET1B depleted HeLa cells. (i) Caspase activity assay in control, HIF1β and SET1B sgRNA depleted cells (21% or 1% O2 for 24 h). (j) PARP1 cleavage in control, HIF1β and SET1B depleted cells (21% or 1% for 24 h). Representative of 3 biological replicates. (k) HeLa spheroid volume in control, HIF or SET1B depleted HeLa cells. n = 54 (control), 39 (SET1B KO), 51 (HIF1β KO), 28 (HIF-1/2α KO) spheroids. (l, m) SET1B or HIF-1β deficient HeLa (l) or A549 (m) tumour xenograft growth (n=7 mice each condition). (n) Total vessel circumference (μm) in A549 tumour xenografts. Control vs. HIF1β or SET1B depletion P ≤ 0.0001; n= 6 (control and HIF1β), 7 SET1B, one-way ANOVA). (o) Cell growth in control, HIF1β or SET1B depleted 786-0 cells grown in 21% O2 (n=3 biological replicates). Ct=control. Graphs show mean ± SD, * P < 0.05, ** P < 0.01, *** P < 0.0001.
Extended Data Fig. 8. Association of SET1B with chromatin and HIF-1α.
(a) Endogenous SET1B was immunoprecipitated from HeLa cells incubated at 21% or 1% O2 for 6 h, and immunoblotted for SET1B, HIF-1α or HIF-2α. (b) Endogenous HIF-1α was immunoprecipitated from HeLa cells incubated at 21% or 1% O2 for 6 h, and samples immunoblotted for HIF-1α, HIF1β or SET1B. (c) Immunoprecipitated SET1B from wildtype and HIF-1α clonal knockout HeLa cells incubated at 21% or 1% O2 for 6 h, and immunoblotted for HIF-1α or SET1B. (d) SET1B does not associate with the SUV12 component of PRC2. Immunoprecipitated SET1B from HeLa cells incubated at 21% or 1% O2 for 6 h, and immunoblotted for SET1B, CFP1 and SUV12. *background band. (e) Endogenous CFP1 was immunoprecipitated from HeLa cells treated with 21% or 1% O2 for 6 h, and immunoblotted for HIF-1α, HIF1β, SET1B and CFP1. Representative immunoblots from 3 independent biological replicates shown in (ag). (f-j) Cell fractionation studies in A549 and 786-0 cells (representative of 3 biological replicates). (f, g) Cell fractionation in A549 cells treated at 21% or 1% O2 for 6 h and immublotted for HIF-α or SET1B. Tubulin used as cytoplasmic marker; PARP1 used as a nuclear marker) (f) Quantified using ImageJ (n=3 biological replicates) (g). (h) Cell fractionation for SET1B and SET1A in A549 cells treated with 1% O2 for 6 h. (i, j) Cell fractionation in A549 cells treated with Roxadustat 100 μM for 24 hr quantified using ImageJ (n = 3 biological replicates) (j) (k) Cell fractionation in 786-0 cells treated at 21% or 1% O2 for indicated times (representative of 3 biological replicates). (l-n) SET1B overexpression in control or HIF1β null cells does not restore HIF-1α signalling. HIF-1α, SET1B and CA9 levels were measured by immunoblot (l) or qPCR (m, n) (n=3 biological replicates).
Extended Data Fig. 9. H3K4me3 ChIP-seq analysis in hypoxia, or following HIF or SET1B depletion.
(a-c) H3K4me3 increases at HIF target gene promoters in hypoxia. (a) H3K4me3 ChIP-PCR in HeLa cells incubated at 21% or 1% O2 for 6 h. CA9, PHD3, or VEGF 21% vs. 1% hypoxia P ≤ 0.0001 (4 biological replicates), BAP1 (4 biological replicates); two-way ANOVA (mean ± SD, *** P < 0.0001). (b, c) Total H3K4me3 levels in HeLa and A549 cells (1% O2 for indicated times). Representative of 3 biolgical replicates. (d, e) H3K4me3 ChIP-seq analysis. (d) Heatmaps of H3K4me3 ChIP-seq signal ± 5-kb from TSS. Genes ranked according to expression in the RNA-seq analysis (highest at top). Representative data shown for one replicate in control, HIF1β and SET1B depleted cells incubated at 21% and 1% O2 for 6 h. (e) H3K4me3 signal at gene promoters. Plots showing mean H3K4me3 ChIPseq signal (counts per million – cpm) ± 5-kb from TSS of all gene promoters in control, HIF1β and SET1B depleted cells incubated at 21% and 1% O2 for 6 h. (f) H3K4me3 at the promoters of the top hypoxia-inducible, HIF-bound genes, defined in the RNA-seq and HIF-1α, HIF-2α, and HIF1β ChIP-seq analyses. (g) Venn Diagram of high stringency canonical HIF-1 and HIF-2 binding sites (present in both HIF-1α and HIF1β replicates, and/or both HIF-2α and HIF1β replicates). 600 separate binding sites were identified, at 550 gene loci. (h) Combined analysis of the 550 HIF-bound gene set and RNA-seq datasets using Gene Set Enrichment Analysis. Comparisons of HIF bound genes in 21% vs 1% O2, control HeLa vs HIF1β KO, and control HeLa vs SET1B KO shown. ES = enrichment score, NES = normalized enrichment score (P value threshold define by 1/number of permutations). (i) Metagene plot of H3K4me3 ChIP-seq at the TSS and gene body of HIF1β dependent or independent genes identified in the RNA-seq analyses (Fig. 3d, e).
Extended Data Fig. 10. HIF-1 and H3K4me3 ChIP-seq examples.
(a-c) HIF-1α, HIF1β, and H3K4me3 ChIPsequencing in wildtype, HIF1β and SET1B mixed population knockout HeLa cells treated with 21% or 1% O2 for 6 h. Analysis of H3K4me3 peaks using the IGV genome browser for normalised reads at specific genomic regions. Selected HIF target angiogenesis genes (a), HIF target glycolysis genes (b), and the non-HIF target BAP1 (c) are shown. Arrows indicate the directionality of the gene of interest, black box highlights region where H3K4me3 varies.
Supplementary Material
Acknowledgements
We thank the Nathan laboratory for their helpful discussions. We also thank Brian Huntly and Eshwar Meduri for initial help with the RNA-seq analysis. This work was supported by a Wellcome Senior Clinical Research Fellowship to J.A.N. (215477/Z/19/Z), and a Lister Institute Research Fellowship to J.A.N. This work was also supported by the NIHR Cambridge Biomedical Research Centre and the Addenbrooke’s Charitable Trust. P.H.M. is supported by a Wellcome Senior Investigator Award (096956/Z/11/Z). D.R.M. is supported by the National Institute for Health Research (D.R.M.; NIHR-RP-2016-06-004) and the Deanship of Scientific Research, King Abdulaziz University, Ministry of High Education for Saudi Arabia. P.J.R. is supported by the Ludwig Institute for Cancer Research, the Wellcome Trust (106241/Z/14/Z) and the Francis Crick Institute, which receives its core funding from Cancer Research UK (FC001501, the Medical Research Council (FC001501), and the Wellcome Trust (FC001501). We thank the Oxford Genomics Centre at the Wellcome Centre for Human Genetics (funded by Wellcome Trust grant reference 203141/Z/16/Z) for the generation and initial processing of sequencing data. Computational facilities included the Oxford Biomedical Research Computing (BMRC) facility, a joint development between the Wellcome Centre for Human Genetics and the Big Data Institute supported by Health Data Research UK and the NIHR Oxford Biomedical Research Centre. The views expressed are those of the author(s) and not necessarily those of the NHS, the NIHR or the Department of Health.
Footnotes
Author Contributions
Conceptualization, B.M.O. and J.A.N.; Methodology, B.M.O., N.B., P.S.J.B., E.A., I.T.L., D.R.M., P.H.M. and J.A.N.; Investigation, B.M.O., N.B., E.A., P.S.J.B., B.M.O., I.T.L., A.P., L.H.J., O.L., J.M., R.S., D.R.M., and J.A.N.; Writing – original draft, B.M.O. and J.A.N.; Writing – reviewing and editing, B.M.O., N.B., D.R.M., P.H.M., P.J.R. and J.A.N.; Funding acquisition, J.A.N.; Resources, D.R.M., P.J.R., P.H.M. and J.A.N.; Supervision, J.A.N.
Competing Interests
Peter J. Ratcliffe is a scientific co-founder of ReOx Ltd., a company that is developing inhibitors of the HIF hydroxylase enzymes. Patrick H. Maxwell is a scientific co-founder and equity holder of ReOx and has received speaker honoraria from Fibrogen, which both aim to develop PHD inhibitors as therapies. The other authors declare no competing interests.
Data Availability
SgRNA read count tables from the CRISPR/Cas9 genetic screen are shown in Supplementary Data 1. RNA-seq (GSE169087) and ChIP-seq (GSE159128, GSE169040, and together under SuperSeries GSE169041) data deposited at Gene Expression Omnibus (https://www.ncbi.nlm.nih.gov/geo/).
References
- 1.Kaelin WG, Jr, Ratcliffe PJ. Oxygen sensing by metazoans: the central role of the HIF hydroxylase pathway. Mol Cell. 2008;30:393–402. doi: 10.1016/j.molcel.2008.04.009. [DOI] [PubMed] [Google Scholar]
- 2.Semenza GL. Hypoxia-inducible factor 1 (HIF-1) pathway. Sci STKE. 2007;2007:cm8. doi: 10.1126/stke.4072007cm8. [DOI] [PubMed] [Google Scholar]
- 3.Epstein AC, et al. C. elegans EGL-9 and mammalian homologs define a family of dioxygenases that regulate HIF by prolyl hydroxylation. Cell. 2001;107:43–54. doi: 10.1016/s0092-8674(01)00507-4. [DOI] [PubMed] [Google Scholar]
- 4.Maxwell PH, et al. The tumour suppressor protein VHL targets hypoxia-inducible factors for oxygen-dependent proteolysis. Nature. 1999;399:271–5. doi: 10.1038/20459. [DOI] [PubMed] [Google Scholar]
- 5.Ivan M, et al. HIFalpha targeted for VHL-mediated destruction by proline hydroxylation: implications for O2 sensing. Science. 2001;292:464–8. doi: 10.1126/science.1059817. [DOI] [PubMed] [Google Scholar]
- 6.Bruick RK, McKnight SL. A conserved family of prolyl-4-hydroxylases that modify HIF. Science. 2001;294:1337–40. doi: 10.1126/science.1066373. [DOI] [PubMed] [Google Scholar]
- 7.Jaakkola P, et al. Targeting of HIF-alpha to the von Hippel-Lindau ubiquitylation complex by O2-regulated prolyl hydroxylation. Science. 2001;292:468–72. doi: 10.1126/science.1059796. [DOI] [PubMed] [Google Scholar]
- 8.Arany Z, et al. An essential role for p300/CBP in the cellular response to hypoxia. Proc Natl Acad Sci U S A. 1996;93:12969–73. doi: 10.1073/pnas.93.23.12969. [DOI] [PMC free article] [PubMed] [Google Scholar]
- 9.Perez-Perri JI, et al. The TIP60 Complex Is a Conserved Coactivator of HIF1A. Cell Rep. 2016;16:37–47. doi: 10.1016/j.celrep.2016.05.082. [DOI] [PMC free article] [PubMed] [Google Scholar]
- 10.Dekanty A, et al. Drosophila genome-wide RNAi screen identifies multiple regulators of HIF-dependent transcription in hypoxia. PLoS Genet. 2010;6:e1000994. doi: 10.1371/journal.pgen.1000994. [DOI] [PMC free article] [PubMed] [Google Scholar]
- 11.Galbraith MD, et al. HIF1A employs CDK8-mediator to stimulate RNAPII elongation in response to hypoxia. Cell. 2013;153:1327–39. doi: 10.1016/j.cell.2013.04.048. [DOI] [PMC free article] [PubMed] [Google Scholar]
- 12.Batie M, et al. Hypoxia induces rapid changes to histone methylation and reprograms chromatin. Science. 2019;363:1222–1226. doi: 10.1126/science.aau5870. [DOI] [PubMed] [Google Scholar]
- 13.Chakraborty AA, et al. Histone demethylase KDM6A directly senses oxygen to control chromatin and cell fate. Science. 2019;363:1217–1222. doi: 10.1126/science.aaw1026. [DOI] [PMC free article] [PubMed] [Google Scholar]
- 14.Lee JH, Tate CM, You JS, Skalnik DG. Identification and characterization of the human Set1B histone H3-Lys4 methyltransferase complex. J Biol Chem. 2007;282:13419–28. doi: 10.1074/jbc.M609809200. [DOI] [PubMed] [Google Scholar]
- 15.Shilatifard A. The COMPASS family of histone H3K4 methylases: mechanisms of regulation in development and disease pathogenesis. Annual review of biochemistry. 2012;81:65–95. doi: 10.1146/annurev-biochem-051710-134100. [DOI] [PMC free article] [PubMed] [Google Scholar]
- 16.Burr SP, et al. Mitochondrial Protein Lipoylation and the 2-Oxoglutarate Dehydrogenase Complex Controls HIF1alpha Stability in Aerobic Conditions. Cell Metab. 2016;24:740–752. doi: 10.1016/j.cmet.2016.09.015. [DOI] [PMC free article] [PubMed] [Google Scholar]
- 17.Miles AL, Burr SP, Grice GL, Nathan JA. The vacuolar-ATPase complex and assembly factors, TMEM199 and CCDC115, control HIF1alpha prolyl hydroxylation by regulating cellular iron levels. Elife. 2017;6 doi: 10.7554/eLife.22693. [DOI] [PMC free article] [PubMed] [Google Scholar]
- 18.Hart T, et al. High-Resolution CRISPR Screens Reveal Fitness Genes and Genotype-Specific Cancer Liabilities. Cell. 2015;163:1515–26. doi: 10.1016/j.cell.2015.11.015. [DOI] [PubMed] [Google Scholar]
- 19.Kim J, Hake SB, Roeder RG. The human homolog of yeast BRE1 functions as a transcriptional coactivator through direct activator interactions. Mol Cell. 2005;20:759–70. doi: 10.1016/j.molcel.2005.11.012. [DOI] [PubMed] [Google Scholar]
- 20.Prenzel T, et al. Estrogen-dependent gene transcription in human breast cancer cells relies upon proteasome-dependent monoubiquitination of histone H2B. Cancer Res. 2011;71:5739–53. doi: 10.1158/0008-5472.CAN-11-1896. [DOI] [PubMed] [Google Scholar]
- 21.Zhang X, et al. Histone deacetylase 3 (HDAC3) activity is regulated by interaction with protein serine/threonine phosphatase 4. Genes and Development. 2005;19:827–839. doi: 10.1101/gad.1286005. [DOI] [PMC free article] [PubMed] [Google Scholar]
- 22.Maxwell PH, et al. Hypoxia-inducible factor-1 modulates gene expression in solid tumors and influences both angiogenesis and tumor growth. Proc Natl Acad Sci U S A. 1997;94:8104–9. doi: 10.1073/pnas.94.15.8104. [DOI] [PMC free article] [PubMed] [Google Scholar]
- 23.Ryan HE, et al. Hypoxia-inducible factor-1alpha is a positive factor in solid tumor growth. Cancer Res. 2000;60:4010–5. [PubMed] [Google Scholar]
- 24.Bertout JA, Patel SA, Simon MC. The impact of O2 availability on human cancer. Nature Reviews Cancer. 2008;8:967–975. doi: 10.1038/nrc2540. [DOI] [PMC free article] [PubMed] [Google Scholar]
- 25.Kung AL, Wang S, Klco JM, Kaelin WG, Livingston DM. Suppression of tumor growth through disruption of hypoxia-inducible transcription. Nat Med. 2000;6:1335–40. doi: 10.1038/82146. [DOI] [PubMed] [Google Scholar]
- 26.Wang L, et al. A cytoplasmic COMPASS is necessary for cell survival and triple-negative breast cancer pathogenesis by regulating metabolism. Genes Dev. 2017;31:2056–2066. doi: 10.1101/gad.306092.117. [DOI] [PMC free article] [PubMed] [Google Scholar]
- 27.Tang Z, et al. SET1 and p300 Act Synergistically, through Coupled Histone Modifications, in Transcriptional Activation by p53. Cell. 2013;154:297–310. doi: 10.1016/j.cell.2013.06.027. [DOI] [PMC free article] [PubMed] [Google Scholar]
- 28.Wang Z, et al. Genome-wide mapping of HATs and HDACs reveals distinct functions in active and inactive genes. Cell. 2009;138:1019–31. doi: 10.1016/j.cell.2009.06.049. [DOI] [PMC free article] [PubMed] [Google Scholar]
- 29.Crump NT, et al. Dynamic acetylation of all lysine-4 trimethylated histone H3 is evolutionarily conserved and mediated by p300/CBP. Proceedings of the National Academy of Sciences of the United States of America. 2011;108:7814–7819. doi: 10.1073/pnas.1100099108. [DOI] [PMC free article] [PubMed] [Google Scholar]
- 30.Zhang T, Cooper S, Brockdorff N. The interplay of histone modifications - writers that read. EMBO reports. 2015;16:1467–1481. doi: 10.15252/embr.201540945. [DOI] [PMC free article] [PubMed] [Google Scholar]
- 31.Sun ZW, Allis CD. Ubiquitination of histone H2B regulates H3 methylation and gene silencing in yeast. Nature. 2002;418:104–8. doi: 10.1038/nature00883. [DOI] [PubMed] [Google Scholar]
- 32.Pavri R, et al. Histone H2B monoubiquitination functions cooperatively with FACT to regulate elongation by RNA polymerase II. Cell. 2006;125:703–17. doi: 10.1016/j.cell.2006.04.029. [DOI] [PubMed] [Google Scholar]
- 33.Zhu B, et al. Monoubiquitination of human histone H2B: the factors involved and their roles in HOX gene regulation. Mol Cell. 2005;20:601–11. doi: 10.1016/j.molcel.2005.09.025. [DOI] [PubMed] [Google Scholar]
- 34.Chen Y, et al. ZMYND8 acetylation mediates HIF-dependent breast cancer progression and metastasis. J Clin Invest. 2018;128:1937–1955. doi: 10.1172/JCI95089. [DOI] [PMC free article] [PubMed] [Google Scholar]
- 35.Brici D, et al. Setd1b, encoding a histone 3 lysine 4 methyltransferase, is a maternal effect gene required for the oogenic gene expression program. Development. 2017;144:2606–2617. doi: 10.1242/dev.143347. [DOI] [PubMed] [Google Scholar]
- 36.Schmidt K, et al. The H3K4 methyltransferase Setd1b is essential for hematopoietic stem and progenitor cell homeostasis in mice. Elife. 2018;7 doi: 10.7554/eLife.27157. [DOI] [PMC free article] [PubMed] [Google Scholar]
- 37.Schodel J, et al. High-resolution genome-wide mapping of HIF-binding sites by ChIP-seq. Blood. 2011;117:e207–17. doi: 10.1182/blood-2010-10-314427. [DOI] [PMC free article] [PubMed] [Google Scholar]
- 38.Smythies JA, et al. Inherent DNA-binding specificities of the HIF-1α and HIF-2α transcription factors in chromatin. EMBO Rep. 2019;20 doi: 10.15252/embr.201846401. [DOI] [PMC free article] [PubMed] [Google Scholar]
- 39.Qiu B, et al. HIF2α-Dependent Lipid Storage Promotes Endoplasmic Reticulum Homeostasis in Clear-Cell Renal Cell Carcinoma. Cancer Discov. 2015;5:652–67. doi: 10.1158/2159-8290.CD-14-1507. [DOI] [PMC free article] [PubMed] [Google Scholar]
- 40.Semenza GL. Physiology meets biophysics: visualizing the interaction of hypoxia-inducible factor 1 alpha with p300 and CBP. Proceedings of the National Academy of Sciences of the United States of America. 2002;99:11570–11572. doi: 10.1073/pnas.192442299. [DOI] [PMC free article] [PubMed] [Google Scholar]
- 41.Douillet D, et al. Uncoupling histone H3K4 trimethylation from developmental gene expression via an equilibrium of COMPASS, Polycomb and DNA methylation. Nature Genetics. 2020;52:615–625. doi: 10.1038/s41588-020-0618-1. [DOI] [PMC free article] [PubMed] [Google Scholar]
- 42.Fang L, et al. SET1A-Mediated Mono-Methylation at K342 Regulates YAP Activation by Blocking Its Nuclear Export and Promotes Tumorigenesis. Cancer Cell. 2018;34:103–118.:e9. doi: 10.1016/j.ccell.2018.06.002. [DOI] [PubMed] [Google Scholar]
- 43.Luo W, Chang R, Zhong J, Pandey A, Semenza GL. Histone demethylase JMJD2C is a coactivator for hypoxia-inducible factor 1 that is required for breast cancer progression. Proceedings of the National Academy of Sciences. 2012;109:E3367–E3376. doi: 10.1073/pnas.1217394109. [DOI] [PMC free article] [PubMed] [Google Scholar]
- 44.Chen W, et al. Targeting renal cell carcinoma with a HIF-2 antagonist. Nature. 2016;539:112–117. doi: 10.1038/nature19796. [DOI] [PMC free article] [PubMed] [Google Scholar]
- 45.Scheuermann TH, et al. Allosteric inhibition of hypoxia inducible factor-2 with small molecules. Nature chemical biology. 2013;9:271–276. doi: 10.1038/nchembio.1185. [DOI] [PMC free article] [PubMed] [Google Scholar]
- 46.Cho H, et al. On-target efficacy of a HIF-2α antagonist in preclinical kidney cancer models. Nature. 2016;539:107–111. doi: 10.1038/nature19795. [DOI] [PMC free article] [PubMed] [Google Scholar]
- 47.Courtney KD, et al. HIF-2 Complex Dissociation, Target Inhibition, and Acquired Resistance with PT2385, a First-in-Class HIF-2 Inhibitor, in Patients with Clear Cell Renal Cell Carcinoma. Clin Cancer Res. 2020;26:793–803. doi: 10.1158/1078-0432.CCR-19-1459. [DOI] [PMC free article] [PubMed] [Google Scholar]
- 48.Wykoff CC, Pugh CW, Maxwell PH, Harris AL, Ratcliffe PJ. Identification of novel hypoxia dependent and independent target genes of the von Hippel-Lindau (VHL) tumour suppressor by mRNA differential expression profiling. Oncogene. 2000;19:6297–6305. doi: 10.1038/sj.onc.1204012. [DOI] [PubMed] [Google Scholar]
- 49.Demaison C, et al. High-level transduction and gene expression in hematopoietic repopulating cells using a human immunodeficiency [correction of imunodeficiency] virus type 1-based lentiviral vector containing an internal spleen focus forming virus promoter. Hum Gene Ther. 2002;13:803–13. doi: 10.1089/10430340252898984. [DOI] [PubMed] [Google Scholar]
- 50.Bailey PSJ, et al. ABHD11 maintains 2-oxoglutarate metabolism by preserving functional lipoylation of the 2-oxoglutarate dehydrogenase complex. Nat Commun. 2020;11:4046. doi: 10.1038/s41467-020-17862-6. [DOI] [PMC free article] [PubMed] [Google Scholar]
- 51.Schödel J, et al. High-resolution genome-wide mapping of HIF-binding sites by ChIP-seq. Blood. 2011;117:e207–e217. doi: 10.1182/blood-2010-10-314427. [DOI] [PMC free article] [PubMed] [Google Scholar]
- 52.Salama R, et al. Heterogeneous Effects of Direct Hypoxia Pathway Activation in Kidney Cancer. PLoS One. 2015;10:e0134645. doi: 10.1371/journal.pone.0134645. [DOI] [PMC free article] [PubMed] [Google Scholar]
- 53.Shen L, Shao N, Liu X, Nestler E. ngs.plot: Quick mining and visualization of nextgeneration sequencing data by integrating genomic databases. BMC Genomics. 2014;15:284. doi: 10.1186/1471-2164-15-284. [DOI] [PMC free article] [PubMed] [Google Scholar]
- 54.Robinson JT, et al. Integrative genomics viewer. Nature Biotechnology. 2011;29:24–26. doi: 10.1038/nbt.1754. [DOI] [PMC free article] [PubMed] [Google Scholar]
- 55.Hower V, Evans SN, Pachter L. Shape-based peak identification for ChIP-Seq. BMC Bioinformatics. 2011;12:15. doi: 10.1186/1471-2105-12-15. [DOI] [PMC free article] [PubMed] [Google Scholar]
- 56.Stark R, Brown G. DiffBind differential binding analysis of ChIP-Seq peak data. R package version. 2011;100 [Google Scholar]
- 57.Dale RK, Pedersen BS, Quinlan AR. Pybedtools: a flexible Python library for manipulating genomic datasets and annotations. Bioinformatics. 2011;27:3423–3424. doi: 10.1093/bioinformatics/btr539. [DOI] [PMC free article] [PubMed] [Google Scholar]
- 58.Li H, et al. The Sequence Alignment/Map format and SAMtools. Bioinformatics. 2009;25:2078–9. doi: 10.1093/bioinformatics/btp352. [DOI] [PMC free article] [PubMed] [Google Scholar]
- 59.Subramanian A, et al. Gene set enrichment analysis: A knowledge-based approach for interpreting genome-wide expression profiles. Proceedings of the National Academy of Sciences. 2005;102:15545–15550. doi: 10.1073/pnas.0506580102. [DOI] [PMC free article] [PubMed] [Google Scholar]
- 60.Mootha VK, et al. PGC-1α-responsive genes involved in oxidative phosphorylation are coordinately downregulated in human diabetes. Nature Genetics. 2003;34:267–273. doi: 10.1038/ng1180. [DOI] [PubMed] [Google Scholar]
- 61.Leek R, Grimes DR, Harris AL, McIntyre A. Methods: Using Three-Dimensional Culture (Spheroids) as an In Vitro Model of Tumour Hypoxia. Adv Exp Med Biol. 2016;899:167–96. doi: 10.1007/978-3-319-26666-4_10. [DOI] [PubMed] [Google Scholar]
- 62.Väyrynen SA, et al. Clinical impact and network of determinants of tumour necrosis in colorectal cancer. Br J Cancer. 2016;114:1334–42. doi: 10.1038/bjc.2016.128. [DOI] [PMC free article] [PubMed] [Google Scholar]
- 63.Bankhead P, et al. QuPath: Open source software for digital pathology image analysis. Sci Rep. 2017;7:16878. doi: 10.1038/s41598-017-17204-5. [DOI] [PMC free article] [PubMed] [Google Scholar]
- 64.Niemistö A, Dunmire V, Yli-Harja O, Zhang W, Shmulevich I. Robust quantification of in vitro angiogenesis through image analysis. IEEE Trans Med Imaging. 2005;24:549–53. doi: 10.1109/tmi.2004.837339. [DOI] [PubMed] [Google Scholar]
- 65.Li W, et al. MAGeCK enables robust identification of essential genes from genome-scale CRISPR/Cas9 knockout screens. Genome Biol. 2014;15:554. doi: 10.1186/s13059-014-0554-4. [DOI] [PMC free article] [PubMed] [Google Scholar]
Associated Data
This section collects any data citations, data availability statements, or supplementary materials included in this article.
Supplementary Materials
Data Availability Statement
SgRNA read count tables from the CRISPR/Cas9 genetic screen are shown in Supplementary Data 1. RNA-seq (GSE169087) and ChIP-seq (GSE159128, GSE169040, and together under SuperSeries GSE169041) data deposited at Gene Expression Omnibus (https://www.ncbi.nlm.nih.gov/geo/).


