Abstract
The ability of proteins and nucleic acids to undergo liquid-liquid phase separation (LLPS) has recently emerged as an important molecular principle of how cells rapidly and reversibly compartmentalise their components into membraneless organelles such as the nucleolus, processing bodies or stress granules1,2. How the assembly and turnover of these organelles is controlled, and how these biological condensates selectively recruit or release components is poorly understood.
Here we show that members of the large and highly abundant family of RNA-dependent DEAD-box ATPases (DDXs) 3 are regulators of RNA-containing phase-separated organelles in pro- and eukaryotes. Using in vitro reconstitution and in vivo experiments we demonstrate that DDXs promote phase separation in their ATP-bound form, and ATP hydrolysis induces compartment turnover and RNA release. This mechanism of membraneless organelle regulation reveals a novel principle of cellular organisation that is conserved from bacteria to man. We further show that DDXs control RNA flux into and out of phase-separated organelles, and thus propose that a cellular network of dynamic, DDX-controlled compartments establishes biochemical reaction centres that affords cells spatial and temporal control of various RNA processing steps, which could regulate the composition and fate of ribonucleoprotein particles.
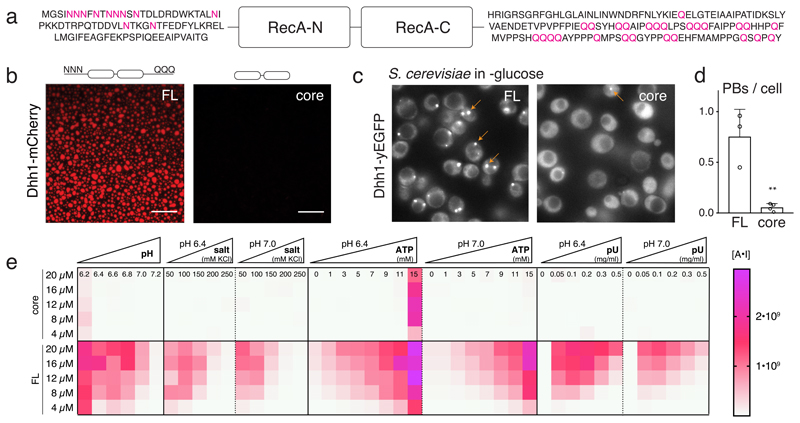
We recently demonstrated that yeast Dhh1 (DDX6 in humans) undergoes phase separation in vitro, and controls the dynamics of processing bodies (PBs) in vivo via its RNA-stimulated ATPase activity 4. To better understand how Dhh1 regulates PB formation, we sought to identify conditions and sequence elements in Dhh1 required for phase separation. DDX proteins are defined by a core of two RecA domains flanked by tails of diverse length and sequence composition 3,5. In Dhh1, the tails are enriched for low-complexity (LC) poly-asparagine and poly-glutamine stretches (Fig. 1a). Such LC domains (LCDs) were previously shown to allow for the formation of weak protein-protein interactions facilitating the formation of dynamic meshworks that manifest as phase-separated droplets 1,2,6. We thus analyzed the phase separation behavior of Dhh1 in multiple conditions and examined whether the LCDs in Dhh1 contribute to LLPS underlying PB formation in vivo.
Fig. 1. The RNA-binding core and the unstructured tails of Dhh1 are required for LLPS and PB formation.
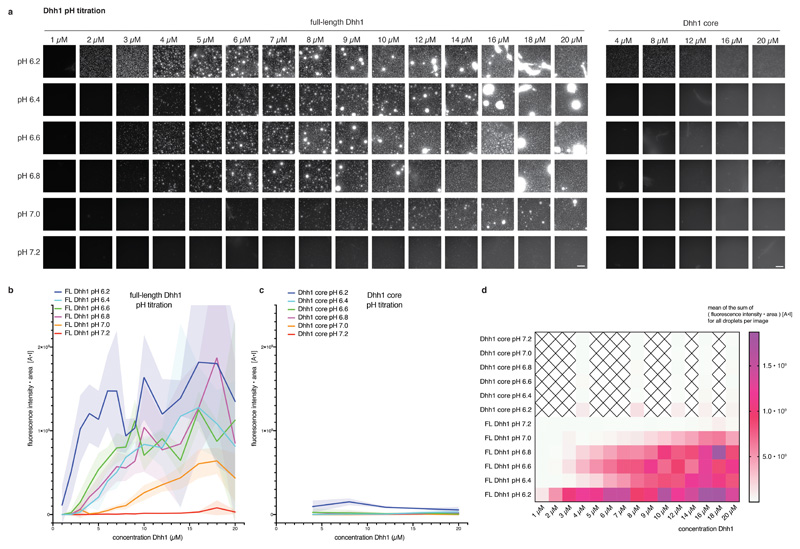
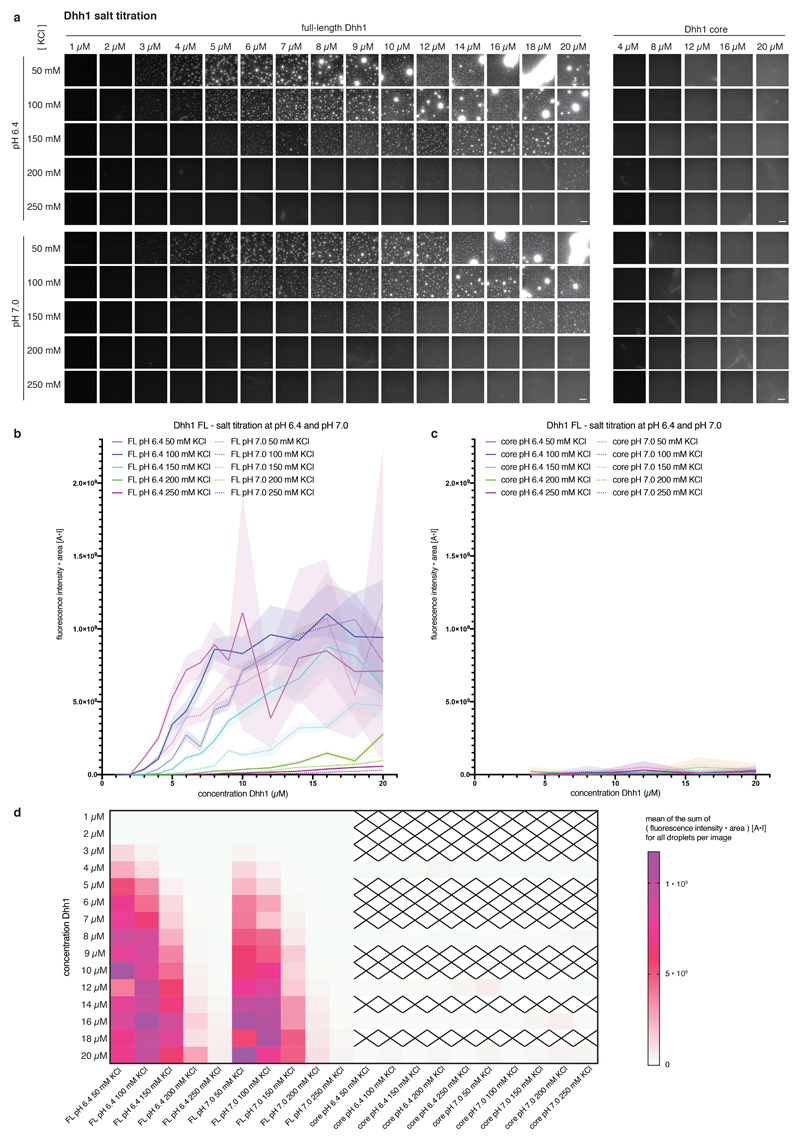
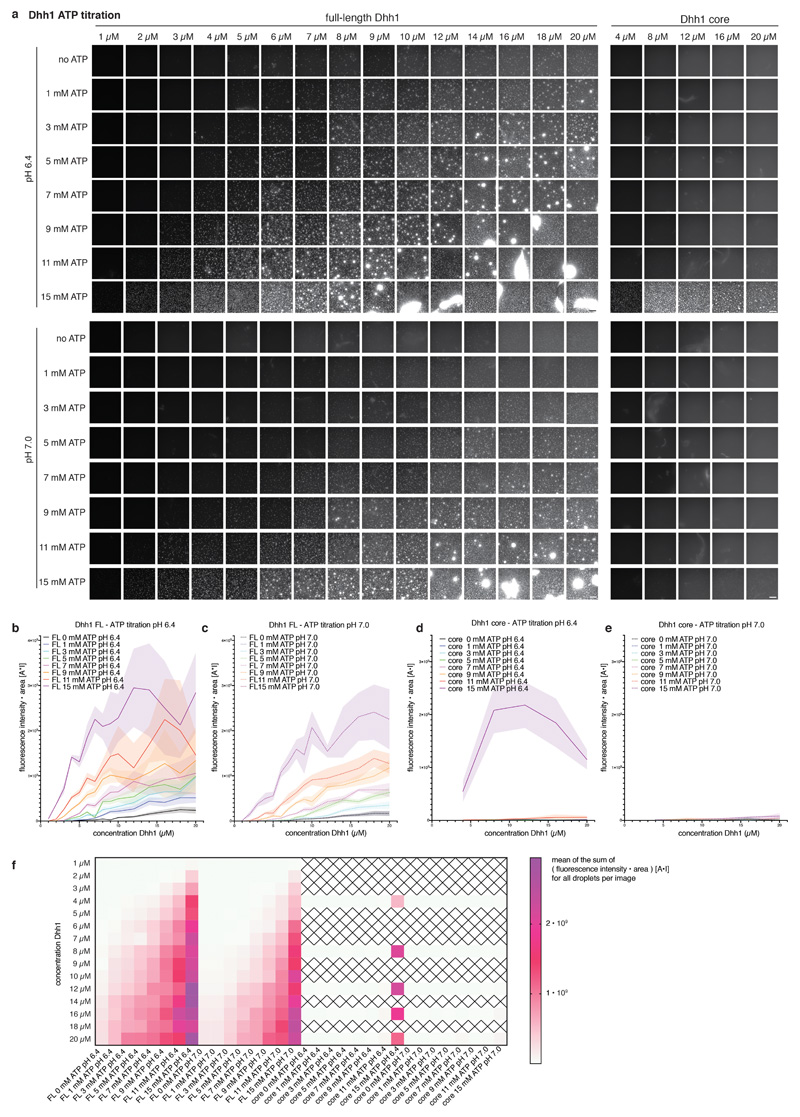
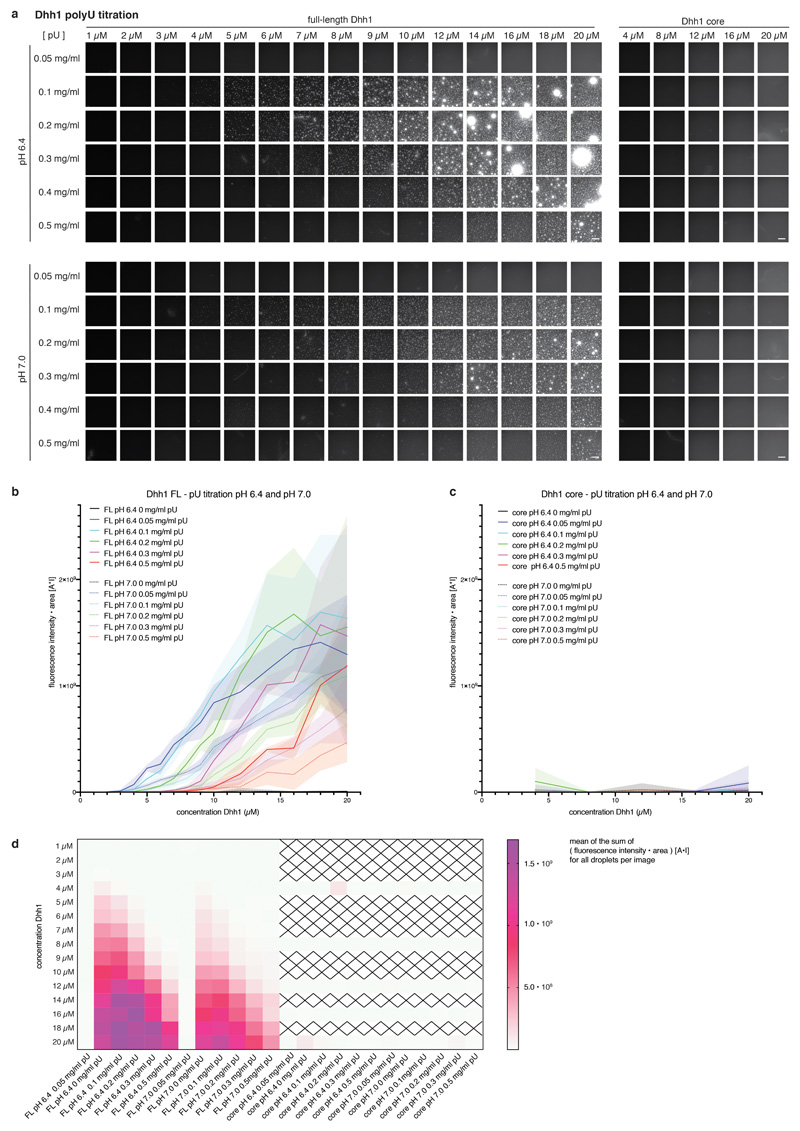
(A) Domain organization of Dhh1: RecA core and LCD tails. (B) In vitro phase separation of recombinant Dhh1-mCherry variants in the presence of ATP and RNA. Full-length (FL) and a truncation construct lacking both tails (core) were imaged at 10.5 μM protein. Representative images of at least 3 independent experiments. Scale bars: 25 μm. (C) Images of yeast cells expressing Dhh1-yEGFPs variants after 30 min glucose starvation. PBs are marked with arrows. Scale bars 5 μm. (D) Quantification of the number of PBs per cell using Diatrack. 3 (FL) or 4 (core) biological replicates of at least 417 (FL) or 505 (core) cells. Mean and SD; unpaired t-test (two-tailed), ** p-value = 0.0032. Dots represent the mean of individual replicates. (E) Phase separation behavior of full-length (FL) Dhh1 and the RecA core in response to changes in pH, salt, ATP and polyU concentration. Sum of the mean fluorescence intensity * area (arbitrary unit [A*I]) for all droplets per field of view, mean of 9 images (pH: 4 images).
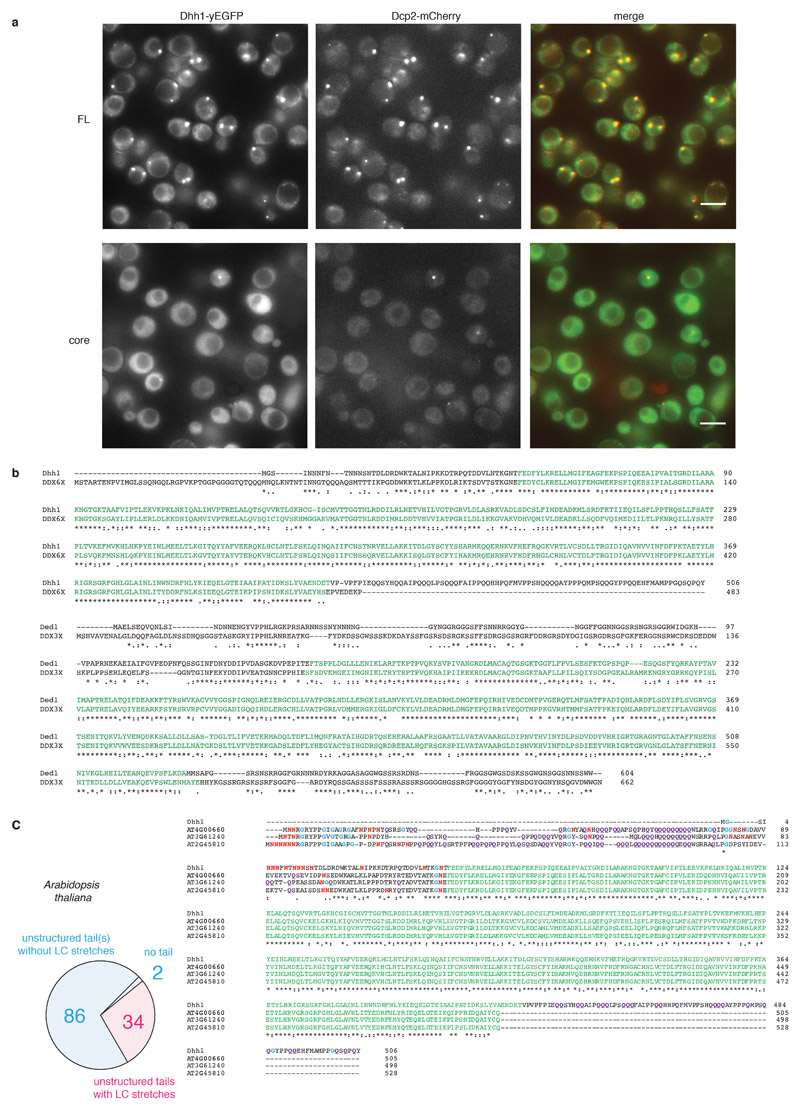
Full-length Dhh1 forms droplets in the presence of RNA, a process which is greatly stimulated by ATP, whereas excess RNA and high salt concentrations prevent condensation of Dhh1. Phase separation is enhanced in low pH, mimicking the conditions during glucose starvation in budding yeast (Fig. 1e and Extended Data Figs. 1-4). A Dhh1 construct lacking the LCD tails has a strongly reduced ability to phase separate in vitro in all conditions tested (Fig. 1b) and to form PBs in vivo (Figs. 1c and Extended Data Fig. 5a).
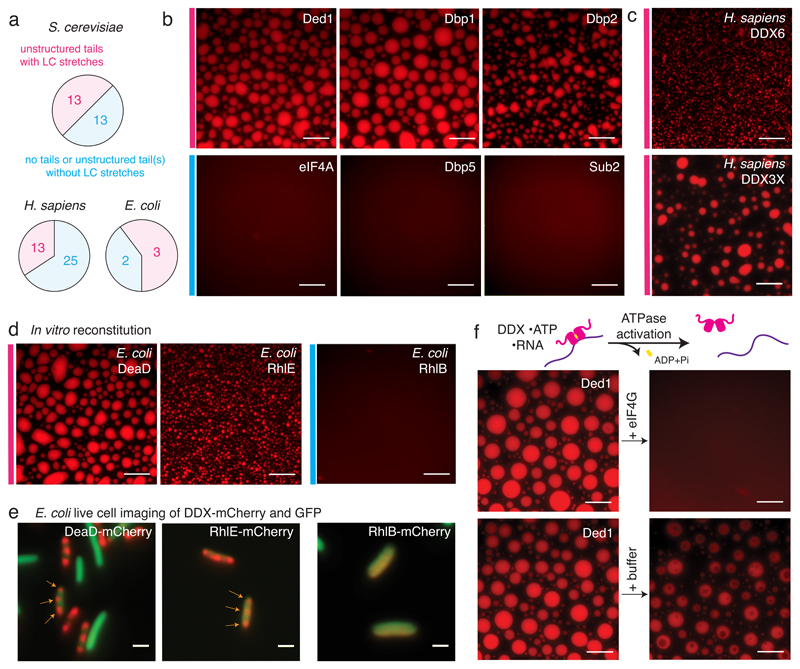
The DExD-box ATPase family comprises about 26 members in yeast and 38 in humans, of which at least one third harbor LC tails (Fig. 2a and SI 1). These enzymes were highly enriched in initial screens for hydrogel-forming proteins 7, and several family members localize to membraneless compartments. We therefore asked whether other DDXs undergo phase separation as well. LCD-containing DDXs in yeast include Ded1, a major component of stress granules (SGs), its meiotic paralog Dbp1, and the nucleolar Dbp2. Recombinant Ded1, Dbp1 and Dbp2 all readily undergo LLPS and form droplets in the presence of ATP and RNA. In contrast, other tested DDXs that either lack tails (eIF4A) or contain tails without detectable LCDs (Sub2, Dbp5) remain dispersed in all conditions tested (Fig. 2b).
Fig. 2. Phase separation by DDXs is wide-spread and evolutionary conserved.
(A) Graph illustrating occurrence of LC domains in yeast, human and E. coli DDXs. (B-D) Representative images of at least 3 independent experiments: in vitro phase separation in the presence of ATP and RNA of select S. cerevisiae (B), human (C) and E. coli DDXs (D); scale bars 25 μm; for details see SI 2 Table 4. (E) Images of E. coli cells co-expressing mCherry-tagged DDXs and GFP. Subcellular DDX foci are marked with arrows. Scale bars 2 μm. (F) Droplets formed from Ded1-mCherry, ATP and polyU dissolve upon addition of recombinant eIF4GC-terminus, but not buffer. Scale bars 25 μm, representative images of > 3 independent experiments.
To examine whether DDX-mediated phase separation is conserved, we next analyzed DDX6 and DDX3X, the human orthologs of Dhh1 and Ded1. Although the sequence of their unstructured tails has diverged significantly between yeast and human (Extended Data Fig. 5b), both recombinant DDX6 and DDX3X still form phase-separated droplets in vitro (Fig. 2c). Since also human DDX4 8 and C. elegans LAF-1/DDX3 9 form droplets, and additional LC-domain containing DDXs can be readily identified in many eukaryotes such as Arabidopsis (Extended Data Fig. 5c), the phenomenon of DDX phase separation is widespread and likely conserved among all eukaryotes.
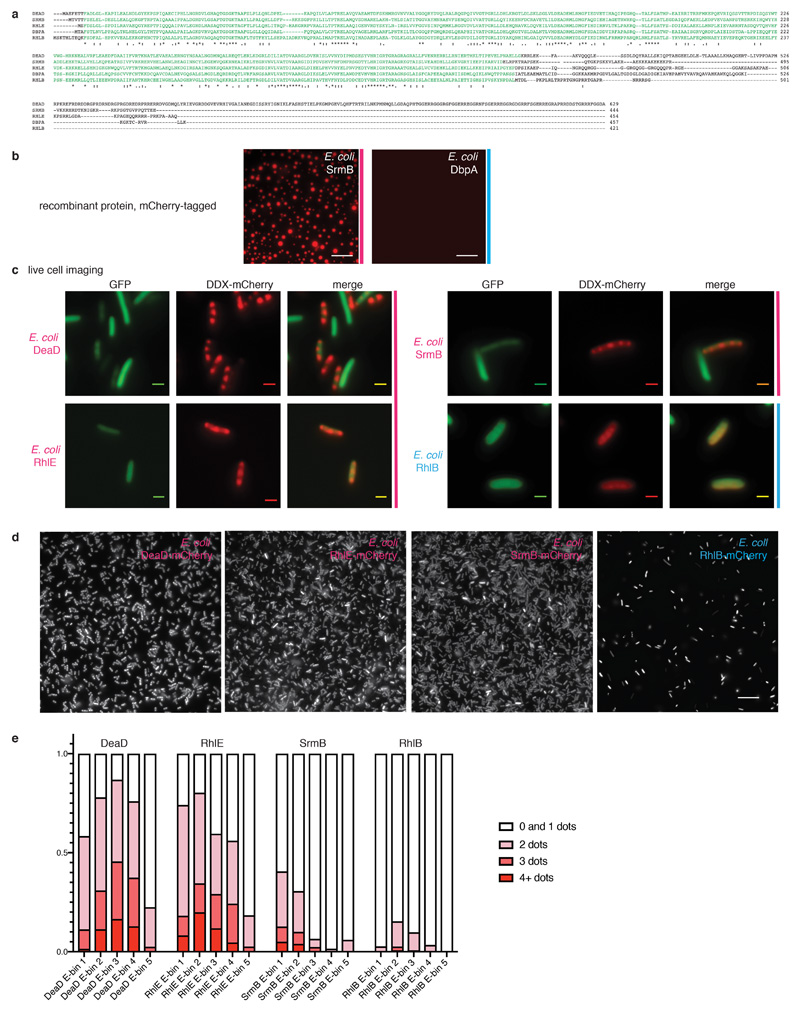
DDXs are also present in prokaryotes, and for example Escherichia coli expresses five DDX proteins (Fig. 2a). Intriguingly, three of them - DeaD, SrmB and RhlE - contain LCDs (Extended Data Fig. 6a) and readily form droplets in vitro, while RhlB and DbpA, which lack LCDs, remain dispersed (Fig 2d and Extended Data Fig. 6b). Furthermore, in vivo mCherry-tagged DeaD, RhlE and SrmB, but not RhlB, localize to clearly discernible subcellular structures, suggesting that they form phase-separated compartments (Fig. 2e and Extended Data Fig. 6c-e).
Our findings imply that both prokaryotic and eukaryotic cells utilize DDX-mediated phase separation to compartmentalize various RNA processing reactions constituting a rare example of cellular organization conserved between bacteria and man.
Whereas equilibrium phase separation has been described for several LCD-containing RNA-binding proteins 1, DDXs as ATPases can in addition harness the energy of ATP turnover to control RNA binding and release 5,10,11. Thus, our results suggest a novel hypothesis for how these enzymes globally regulate phase separation of RNA-protein complexes: in their ATP- and RNA-bound state DDXs form multivalent interactions with themselves and RNA to promote phase separation. Yet, ATP hydrolysis triggers the release of RNA clients from a DDX, thus breaking multivalency, and in consequence induce the disassembly of RNA-containing membraneless organelles (Figs. 2f and 4c).
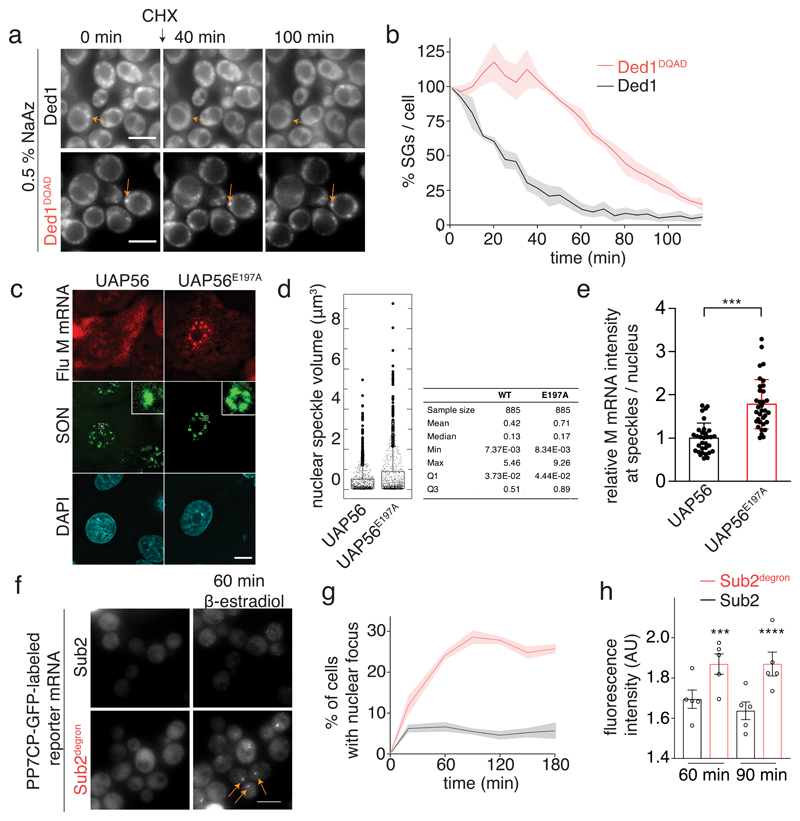
Fig. 3. The catalytic activity of DDXs regulates compartment turnover and RNA accumulation in phase-separated organelles.
(A) Ded1-mCherry labeled SGs were imaged after addition of 50 μg/ml cycloheximide (CHX). The ATP-deficient variants do not alter ATP and RNA-binding (Extended Data Fig. 3b,c) (B) Quantification of the percentage of SGs per cell normalized to t = 0 min; mean (solid line) and SEM (shaded area), n=3 biological replicates, at least 150 cells per replicate and strain. (C) A549 cells expressing WT or E179A mutant UAP56 were infected with influenza virus. After 6h, viral M mRNA was detected by smFISH and SON by immunofluorescene. Insets: enlargements of the marked white squares. Data are representative of three independent experiments. (D) Quantification of nuclear speckle volume (885 speckles per condition). (E) Quantification of relative M mRNA intensity at nuclear speckles (32 WT cells / 938 speckles and 34 E179A cells / 885 speckles). Mean and SD; two-sided t-test, *** p = 6.4*10-9. (F) Sub2 depletion leads to accumulation of a PP7CP-yEGFP labeled reporter mRNA in nuclear foci. Scale bar 5 μm. (G) Quantification of (F). Mean and SEM of 5 biological replicates with n>78 cells per time point. (H) Quantification of nuclear focus intensity, 5 (Sub2 degron) or 6 (WT) biological replicates; at least 13 / 33 cells (60 min WT / degron) or 14 / 60 (90 min WT / degron) cells per replicate. Mean and SEM; unpaired two-tailed t-test with *** p = 0.0002 and **** p = <0.0001. Dots represent the mean of individual replicates.
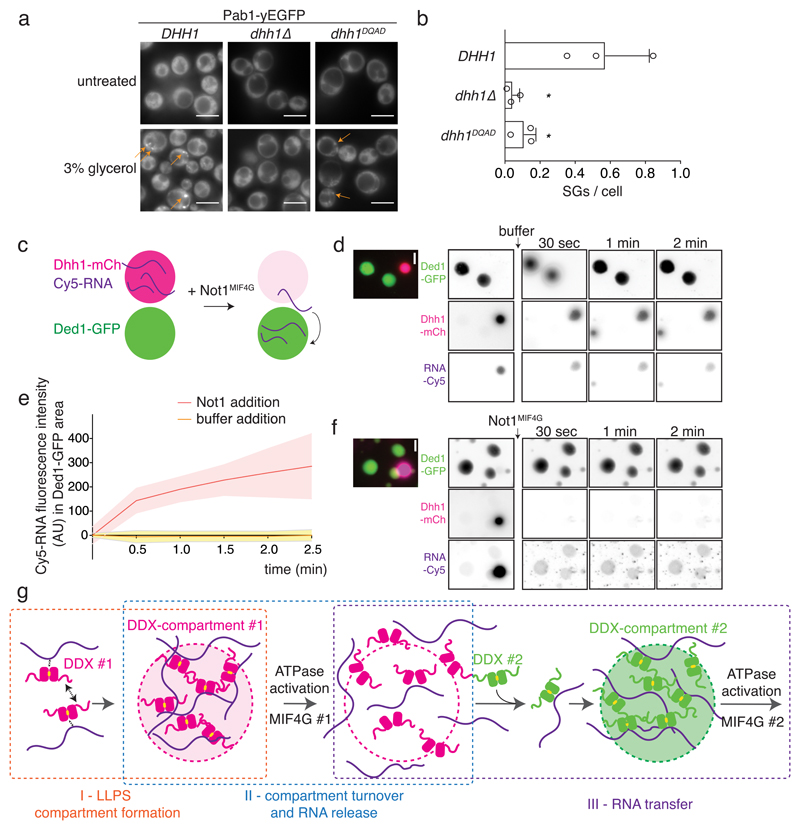
Fig. 4. DDX ATPase activity controls RNA partitioning between phase-separated compartments in vivo and in vitro.
(A) Pab1-yEGFP labeled SGs are induced in an untagged Dhh1 WT or Dhh1DQAD or dhh1Δ background. 3 biological replicates, at least 383 (WT), 93 (dhh1Δ) or 657 (Dhh1DQAD) cells per replicate. (B) Quantification of (A), mean and SD. Unpaired t-test (two-tailed), * p = 0.0224. Dots represent mean of individual replicates. (C) Schematic representation of in vitro RNA transfer experiment (D-F) Droplets were assembled from Dhh1-mCherry (mCh) with Cy5-labelled RNA (red circles), and from Ded1-yEGFP (green circles). Cy5-RNA, Dhh1-mCh and Ded1-GFP were monitored upon addition of buffer (D) or Not1MIF4G (F). Representative images of > 3 independent experiments. (E) Quantification of Cy5 intensity inside Ded1 areas, normalized to the intensity value at t=0 sec. Mean (line) and SD (shaded area) of 17 (“Not1 addition”) and 12 (“buffer addition”) large droplets per movie. At t = 2 min, 17.4 +/- 3.3% of the Cy5-RNA is enriched in Ded1-GFP droplets upon Not1 addition (n = 3 movies). Scale bars 5 μm. (G) Concept how DDXs could regulate multivalency, phase separation and compartment formation (I), ATPase-controlled compartment turnover and RNA release (II), and RNA transfer (III).
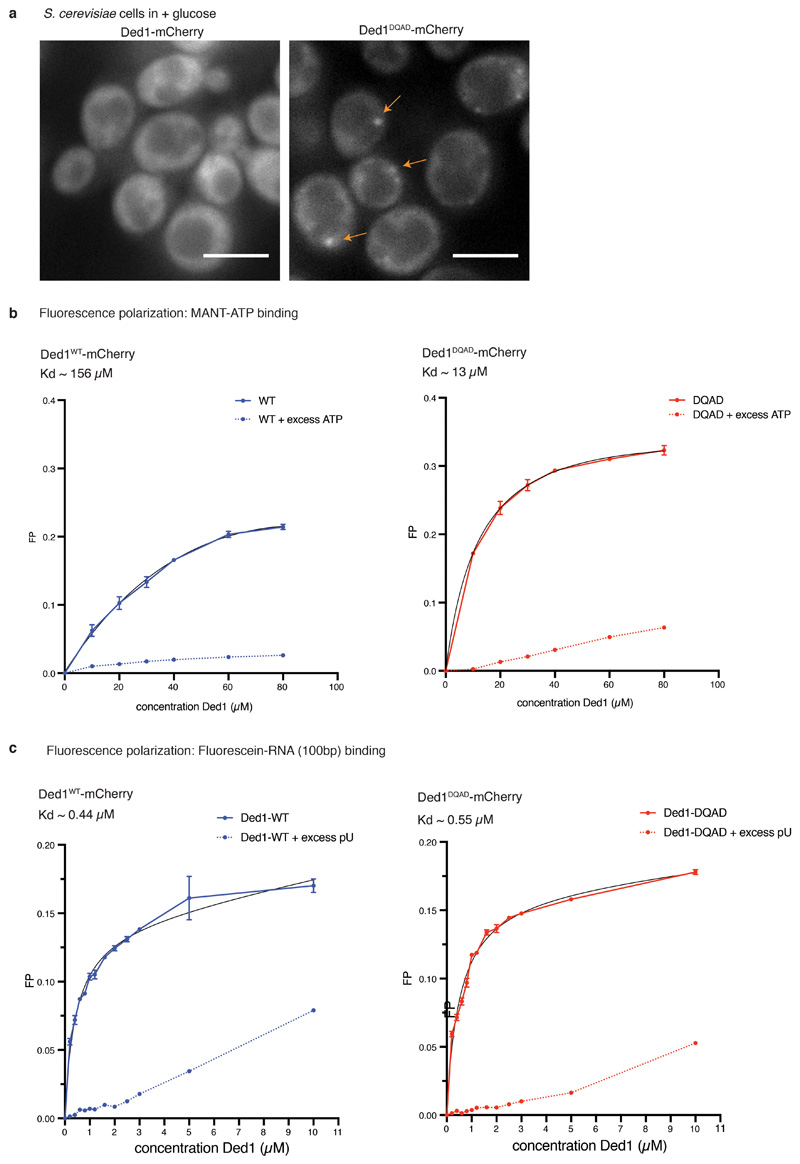
Consistent with this hypothesis, we and others have shown that ATP-hydrolysis-deficient variants of Dhh1 4, Ded1 (Extended Data Fig. 7a) 12 / DDX3X 13 and DDX4/Vasa 14 form constitutive foci even in unstressed cells. DDX ATPase activity and substrate release is tightly controlled and can be activated by specific co-factors 5. For example, Dhh1 is activated by the MIF4G domain of Not1 4,15 and Not1 dissolves Dhh1 droplets in vitro and inhibits PB formation in vivo 4. Few additional ATPase activators for DDXs have been identified to date, but Ded1 interacts with eIF4G, a translation initiation factor that also contains a MIF4G domain 16. Intriguingly, the C-terminal part of eIF4G containing the MIF4G domain and a Ded1 interaction domain 12 rapidly dissolves Ded1 condensates (Fig. 2f) suggesting that interactions between DDXs and MIF4G-domain containing proteins might generally control the turnover of phase-separated compartments.
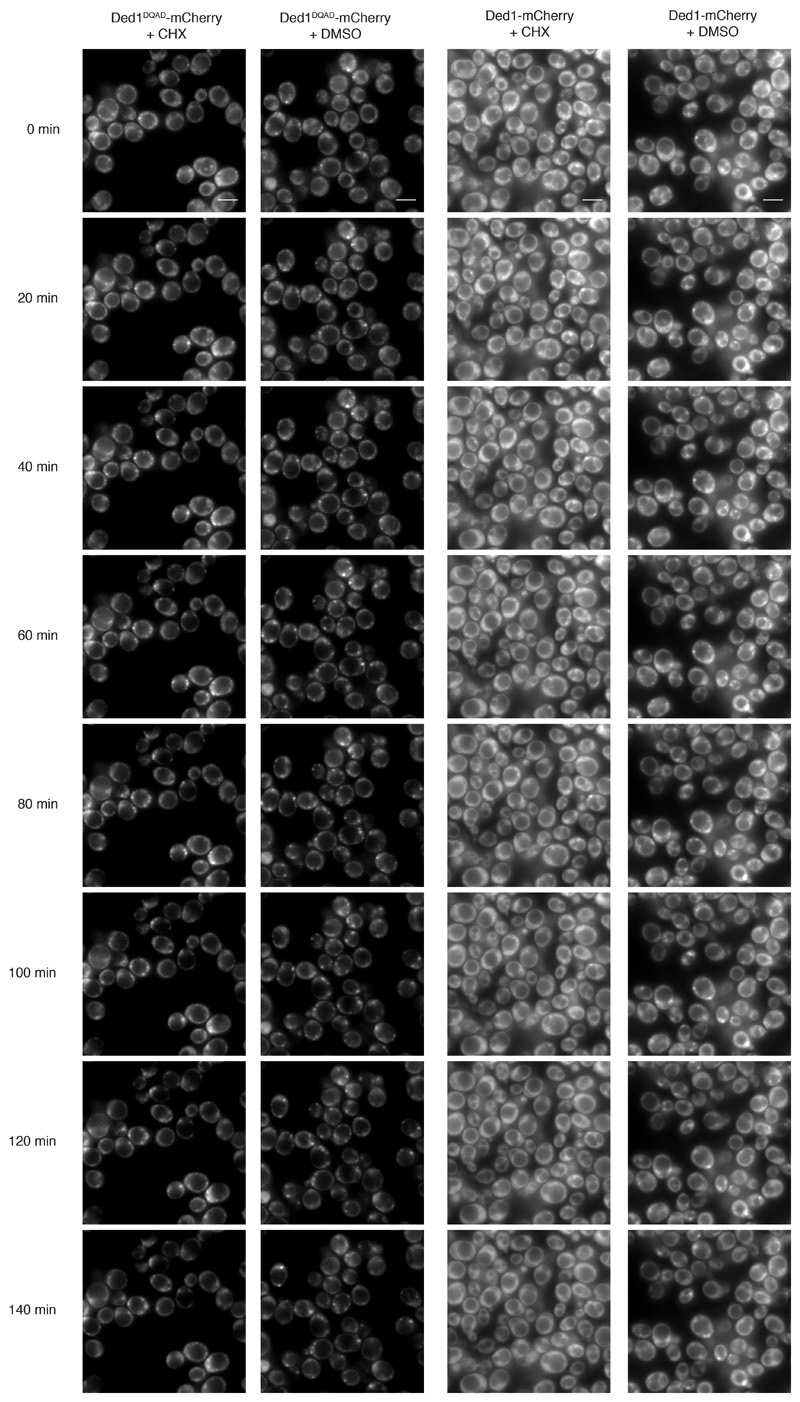
To further examine whether DDX ATPases regulate RNA release from phase-separated compartments also in vivo we utilized the translation elongation inhibitor cycloheximide (CHX). During stress, translation is attenuated, mRNAs are released from polysomes and accumulate in PBs and SGs 17. However, upon addition of CHX, mRNAs are locked onto stalled ribosomes, thereby disrupting the supply of mRNAs to PBs and SGs, and both organelles dissolve over time 18,19. If ATP hydrolysis by DDXs triggers mRNA release, inhibition of their ATPase activity is expected to delay the disassembly of PBs and SGs, as we have shown for Dhh1 and PBs 4. We next tested whether also SG disassembly is controlled by DDX activity. The DDX Ded1 is a prominent SG component, and in agreement with our model catalytically inactive Ded1DQAD delays SG disassembly about 2-fold (Fig. 3a,b and Extended Data Fig. 8). This demonstrates that the ATPase activity of LC-containing DDXs regulates membraneless compartment turnover in vivo.
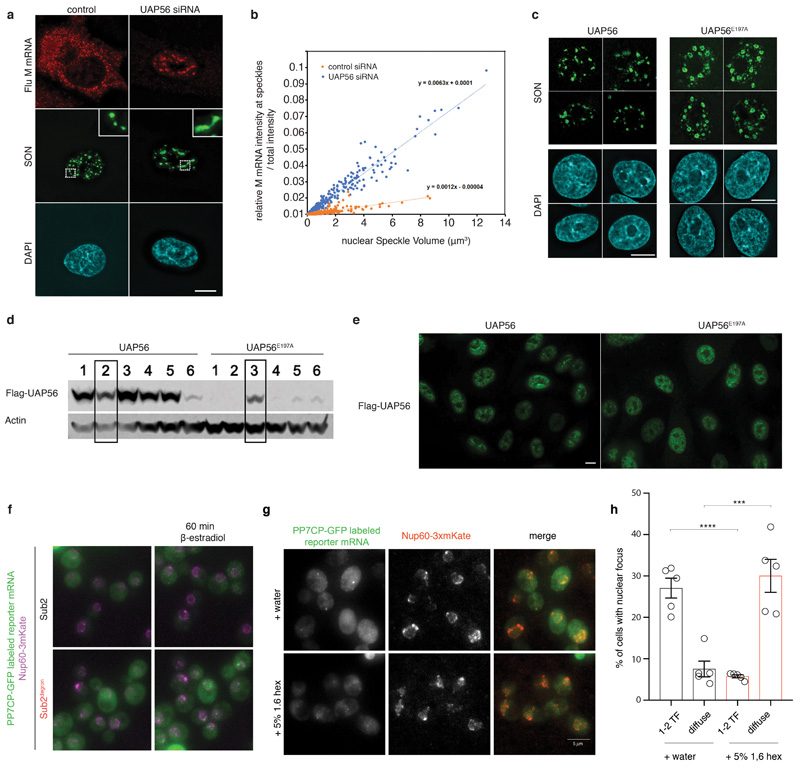
Interestingly, also several DDXs that lack detectable LCDs localize to membraneless organelles. We therefore tested whether non-LCD DDXs regulate phase-separated compartments and RNA release as well. Human UAP56/DDX39B, a DDX implicated in transcription, nuclear mRNA processing and export, accumulates in nuclear speckles presumably via interaction with LC-containing components of the Tho/TREX complex 20. Consistent with our hypothesis that DDXs trigger RNA release from RNA granules, depletion of UAP56 by siRNA in A549 cells leads to a size increase of nuclear speckles (Extended Data Fig. 9a,b) 21,22. While expression of wild-type UAP56 in cells depleted of the endogenous protein fully rescues the depletion phenotype, expression of catalytically inactive UAP56E197A leads to a further increase in both speckle size (Figs 3c,d and Extended Data Fig. 9c) and importantly mRNA accumulation as shown for a reporter mRNA, the influenza M mRNA (Figs. 3c,e).
Yeast cells do not have detectable nuclear speckles, yet depletion of Sub2, the yeast ortholog of UAP56, by an auxin-dependent degron system 23 also induces formation of nuclear foci that accumulate an inducible mRNA reporter (Figs. 3f-h and Extended Data Fig. 9f). These foci, which are likely associated with the site of transcription, quickly disperse upon treatment with 1,6-hexanediol, an aliphatic alcohol that can dissolve phase-separated compartments 24, indicating that they form via LLPS of LCD-containing proteins (Extended Data Fig. 9g,h).
Altogether, these results establish a novel function for members of the DEAD-box ATPase protein family as general enzymatic regulators of RNA-containing, membraneless compartments, either in cis or in trans.
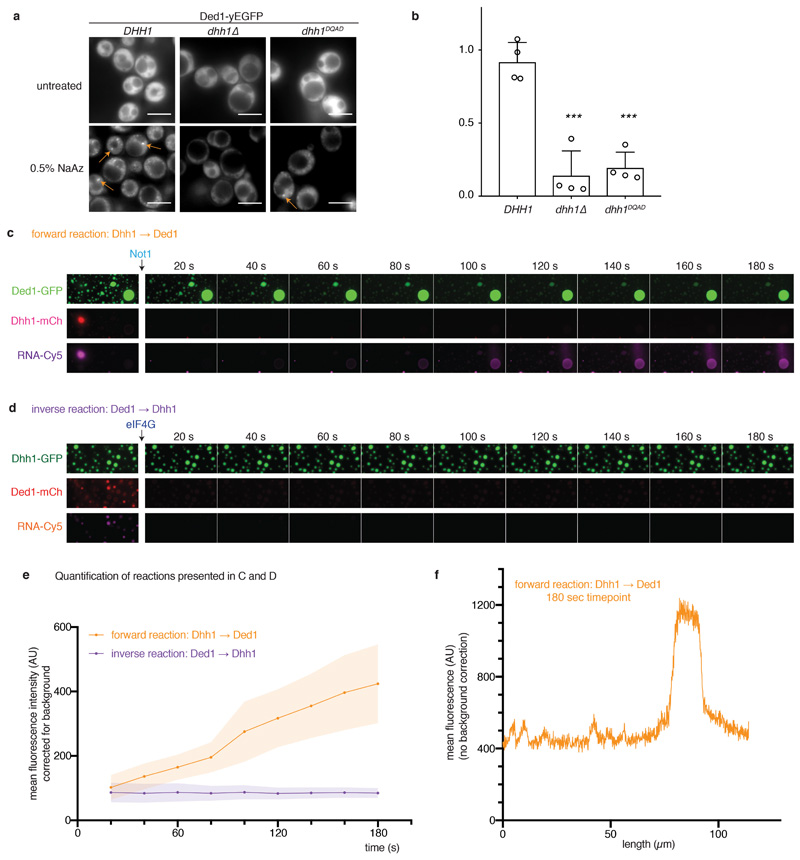
Since DDXs function in many steps of gene expression 3, we hypothesize that RNA maturation steps could be spatially and temporally separated in distinct DDX-regulated phase-separated compartments, and that RNA release from or transfer between membraneless organelles is controlled by DDX ATPase activity. To begin to test this model, we focused on the cytoplasmic exchange of mRNAs between translating polysomes, PBs and SGs. In yeast, PBs function upstream of SGs: mutations that abrogate PB assembly prevent the formation of SGs, but not vice versa 19. Since mRNA is an essential building block of SGs, we examined if Dhh1-regulated release of mRNA from PBs is essential for SG formation. Wild-type cells rapidly induce SGs in glycerol (Fig. 4a) or sodium azide stress (NaAz; Extended Data Fig. 10a), and as expected, SG assembly is inhibited in dhh1Δ cells (Fig. 4a) that cannot efficiently assemble PBs 19. Importantly, SG formation is also blocked in cells expressing the ATPase-deficient Dhh1DQAD variant (Figs. 4a,b and Extended Data Figs. 10a,b), which form constitutive, non-dynamic PBs 4. This suggests that mRNAs have to transit through PBs before they can contribute to the formation of SGs, and that the ATPase activity of Dhh1 affects the flux of mRNAs between PBs and SGs.
Finally, we wanted to test whether we can in principle recapitulate such a transfer of RNA also in vitro using reconstituted phase-separated DDX compartments. Dhh1 droplets were formed with fluorescently labeled RNA and mixed with preformed Ded1 droplets (Fig. 4c). Upon addition of buffer, no significant transfer of RNA between the two compartments can be detected in this experiment (Figs. 4d,e). However, addition of the Dhh1 activator Not1MIF4G rapidly dissolves the Dhh1 droplets and releases the labeled mRNA, which is then taken up by the Ded1 droplets (Figs. 4e,f and Extended Data Figs. 10c,e,f) enriching 2-3 fold over background. By contrast in the inverse reaction where Ded1 droplets were dissolved by addition of eIF4G, the released RNA did not enrich in preformed Dhh1 granules (Extended Data Fig. 10d, e). These experiments suggest that DDXs via their LCDs have the intrinsic ability to set up distinct compartments and that DDX ATPases influence partitioning of RNA molecules between compartments.
In summary, this work proposes a new and unifying paradigm for the function of RNA-dependent DEAD-box ATPases 3 in regulating the assembly and turnover of membraneless organelles in both pro- and eukaryotic cells (Fig. 4g). Since DDXs were previously shown to function as scaffolds that recruit specific cofactors to RNAs and to unwind RNA-RNA duplexes 25, which could contribute to granule identity 25–28, we propose that they could establish dynamic biochemical reaction centers that impart RNPase activity to promote changes in the composition of an RNP. Thus, we speculate that a cellular network of DDXs provides cells with both spatial and temporal control of various RNA processing steps, and by guiding RNA molecules through phase-separated compartments, DDXs can regulate the maturation state, RNP composition and ultimately fate of an RNA.
In addition to this DDX-mediated control, cells have evolved orthogonal layers of regulation of phase-separated compartments, and specific kinases were identified that inhibit granule assembly, for example, in the absence of stress or during mitosis 1,29,30. However, once such granules are formed, the DDX ATPase cycle keeps them dynamic and in a non-equilibrium state to create active liquids that can enrich RNP clients or buffer the dispersed RNP pool 1,2. Furthermore, we expect DDXs to counteract droplet maturation and solidification as observed for non-enzymatic phase-separating proteins such as FUS involved in ALS 1. Thus misregulation of DDXs could have pathological consequences and might contribute to the development of aggregation diseases.
Material and Methods
Experimental Design
All yeast strains used to express DDX variants and the respective controls that were used in this study are derivatives of W303 (PB and SG strains) or BY (Sub2 strains) and listed in SI 2 Table 1. Yeast deletion strains and C-terminal epitope tagging of ORFs was done by PCR-based homologous recombination, as previously described 31.
Plasmids used for this study are described in SI 2 Table 2, oligonucleotides are listed in SI 2 Table 3.
Protein expression and purification
The MIF4G domain of eIF4G (residues 572-952) was purified as described previously 10. All recombinantly expressed DDX proteins were amplified from yeast genomic DNA or human cDNA and cloned into pETMCN-based expression vector with an N-terminal 6xHis and V5 tag plus either C-terminal mCherry or mGFP tags. Plasmids are listed in SI 2 Table 2.
Recombinant proteins were transformed into chemically competent E. coli BL21 DE3 under the selection of ampicillin and chloramphenicol. Pre-cultures were grown in LB at 37°C over night, and diluted 1:100 into rich medium the next morning. Cells were grown at 37°C to an OD600 of 0.6 and induced with final 200 mM IPTG. Cells were then grown overnight at 18°C, harvested and resuspended in 30 ml lysis buffer (500 mM NaCl, 25 mM Tris-HCl pH 7.5, 10 mM imidazole, 10% glycerol, protease inhibitors) per cell pellet from 2l of culture. After cell lysis by EmulsiFlex (Avestin Inc, Ottawa, CA), the 6xHis tagged proteins were affinity extracted with Ni2+ sepharose in small columns, dialyzed into storage buffer (storage buffer for each individual recombinant protein is listed in SI 2 Table 4) with simultaneous protease cleavage of the His tag (and for DDX6 also the MBP tag) and further purified by size exclusion with a Superdex 200 column on an AEKTA purifier (GE Life Sciences, Marlborough, MA) in the final storage buffer. Protein expression levels, His eluates and gel filtration fractions were analyzed by SDS-PAGE. Clean Superdex elution fractions were pooled, concentrated to ~500 µM using Millipore Amicon Centrifugation units, snap frozen as ~ 20 µl aliquots in siliconized tubes in liquid nitrogen and stored at -80°C.
in vitro liquid droplet reconstitution assay
Reactions were pipetted in 384-well microscopy plates (Brooks 384 well ClearBottom Matriplate, low glass). Setup conditions for each individual protein, as well as their respective storage buffer, are listed in SI 2 Table 4. In general, proteins were diluted to the required stock concentration with storage buffer and directly pipetted to the side of the well. Next, a master-mix as consisting of an ATP reconstitution mix, polyU RNA, HEPES buffer of the required pH and BSA was added (for components, see below) and mixed by pipetting. First imaging was performed after 20 minutes incubation at room temperature; just prior to imaging, droplets were spun down at 100 g for 1 minute. Imaging was performed using widefield microscopy (see below). If subsequent analyses were performed, plates were stored at 4 °C. Images were analyzed using FIJI software 32. For the time course experiments in Fig. 2f, Ded1-droplets were pre-assembled for 5 min at room temperature followed by the imaging time course which was started with 10 second intervals. After the first two frames, 3 µl recombinant eIF4GC-terminus (500 µM) or eIF4G storage buffer was added and the reaction gently mixed to avoid disturbance of the droplets.
General material used
1 M HEPES-KOH of indicated pH, BSA (10 mg/mL), polyU (Sigma, diluted from 10 mg/ml stock; stock in H2O as indicated), RNAsin Plus (Promega).
Stock solution of CKM ATP reconstitution system
40 mM ATP, 40 mM MgCl2, 200 mM creatine phosphate, 70 U/mL creatine kinase.
Low salt buffers
LSB-150 (150 mM KCl, 30 mM HEPES-KOH pH 7.4, 2 mM MgCl2), LSB-100 (100 mM KCl, 30 mM HEPES-KOH pH 7.4, 2 mM MgCl2), LSB-50 (50 mM KCl, 30 mM HEPES-KOH pH 7.4, 2 mM MgCl2), 1x ATPase buffer (30 mM HEPES-KOH pH 7.5, 100 mM NaCl, 2 mM MgCl2)
Dhh1 phase diagram setup and analysis
Dhh1 phase diagram reactions were setup from two mastermixes of MM1: protein dilutions and MM2: LSB, ATP, salt, pU etc. as one replicate. Conditions for each reaction are described in SI 2 Table 5, and in the figure legends of Extended Data Figs. 1-4. In brief, after 20 minutes incubation at room temperature, 4 images (pH titration) or 9 images (all other titrations) were recorded per condition using an automated script with a 60x oil objective; droplets were imaged at the glass surface. For analysis, individual droplets were segmented and quantified using Diatrack33 and Matlab. For each droplet, the product of the mean fluorescence intensity (corrected for the surrounding background fluorescence) and the droplet area was calculated (A*I). The sum of A*I for all droplets was calculated for each image, and the mean and standard deviation (SD) of the images for one condition plotted against the Dhh1 concentration.
Widefield microscopy
Microscopy was performed with an inverted epi-fluorescence microscope (Nikon Ti) equipped with a Spectra X LED light source and a Hamamatsu Flash 4.0 sCMOS camera using a PlanApo 100x or 60x NA 1.4 oil-immersion objective and the NIS Elements software. Images were analysed using FIJI/ImageJ 32.
E. coli in vivo imaging
RIL bacteria were transformed with the respective DDX-mCherry plasmid (see SI 2 Table 2) and a plasmid expressing soluble GFP. Precultures were grown in LB with chloramphenicol, ampicillin and kanamycin selection for 20h at 37°C. A 25 ml culture (1xYT, same antibiotics) was inoculated with 1 ml of preculture and grown for 2h at 37°C, then induced with 1 mM IPTG and grown for 1h at 37°C. 15 µ-Slide 8-well plates (IBIDI, Martinsried, Germany) were Concanavalin A-coated and air-dried. 100 µl water and 30 µl bacterial culture were added and spun at 1050 g for 3 minutes. Imaging was performed by widefield microscopy. Quantitative analysis of foci formation was performed using Diatrack33 and Matlab on four images per expression construct, each containing at least 60 cells expressing the mCherry construct. In brief, cells were segmented, and objects that did not fit the size expectations for bacterial cells removed. For each cell, the mean fluorescence intensity and the number of foci per cell was measured. Cells containing 0 and 1 focus were grouped together in the analysis, since one focus may represent cells not completely in the focus plane, or aggregate particles. Cells were sorted into eight bins of expression levels based on their mean fluorescence intensity; the bin definitions were identical for different constructs so the bins are directly comparable between strains. The three bins with the highest expression levels may contain saturated cells and were removed from further analysis. For each bin, the percentage of cells with 0/1, 2, 3, or more than 3 foci was plotted.
General imaging and analysis of yeast cells
Cells were cultured in synthetic complete media with 2% glucose (SCD) to OD600 ~ 0.6 – 0.8, transferred to Concanavalin A-treated MatTek dishes (MatTek Corp., Ashland, MA) and visualized at room temperature. Microscopy was performed by widefield microscopy, as described above. Representative images were processed using ImageJ software. Brightness and contrast were adjusted to the same values for images belonging to the same experiment and were chosen to cover the whole range of signal intensities, unless indicated otherwise. Image processing for PB and SG analysis was performed using Diatrack3.5 particle tracking software 33 as described below. Graphs of mean and SD (Fig. 1d, 4b, S4b) or SEM (Fig. 3b) were generated using the Prism7 Software (Graphpad Inc).
Formation of constitutive stress granules and CHX SG disassembly
KWY8255 (Ded1-mCherry) and KWY8257 (Ded1DQAD-mCherry) were freshly streaked from glycerol stocks and precultures and 5 subsequent 1:10 dilutions thereof were grown in SCD overnight at 25°C rotating. Expression of Ded1-mCherry proteins was induced at OD = ~ 0.2 with a final concentration of 2 µM ß-estradiol (from a 10 mM stock in 50% EtOH which was pre-diluted 1:100 in SCD); cells are grown at 25°C rotating for 4-5 hours. Depletion of the endogenous, AID-tagged Ded1 protein was achieved by addition of auxin (IAA) in the presence of OsTIR expression plasmid 23 upon addition of final 1 mM auxin (IAA; Indole-3-acetic acid) and final 8 µM IP6(inositol 6 phosphate). Cells were incubated for at least 2h at 30°C with rotation before pre-stress images were recorded by widefield microscopy as described above. Subsequently, stress granules were induced in all strains by treatment with final 50 ug / ml sodium azide (stock solution 0.5%), and incubated at 25°C for 30 min. For the statistical analysis in Fig. C, we recorded three biological replicates on different days, imaged every 5 minutes. We imaged all four strains (WT and DQAD +/- osTIR) but only used the ones with OsTIR for analysis. Since bleaching towards the later time points was obvious in these samples, we recorded representative images from one more biological replicate that we imaged only every 20 minutes. This experiment was only performed on the strains with OsTIR, but we added a DMSO control (instead of CHX) to control for photobleaching. Since Ded1DQAD-mCherry is consistently expressed at lower levels than the wild-type protein, we increased intensity scaling for this strain about twofold for display of the microscopy images shown in Fig. 3A and S3A.
Automated image analysis for processing body quantification
In order to quantify PB and SGs in live cells, we used an automated image analysis pipeline in a manner similar to 34. First, P-bodies were counted using Diatrack3.5 particle tracking software 33 using local intensity maxima detection, followed by particle selection by intensity thresholding and particle selection by contrast thresholding with a value of 5% 33. To speed up the analysis, we renamed all our images in a form that can be recognized as a time-lapse sequence by Diatrack, and placed them all in a single directory, such that they could all be analyzed using exactly the same image analysis parameters. Renaming and copying was done by a custom script (Supplementary code 1), which also performed cell segmentation. Briefly, the method first detects all edges using a laplacian edge detection step, and then traces normals to those edges in a systematic manner. These normals tend to meet at the cell center where the high density of normals is detected, serving as seeds to reconstruct genuine cells. Our script can thus count cells and reports their number for each image - information which is output to an excel table. The results from Diatrack PB counting were then be imported from a text file into a table, and the number of PB was divided by the number of cells for each image of one biological replicate.
Stable cell lines
UAP56 wild-type and UAP56 (E197A) were cloned into pCDH-CMV-MCS-EF1-puro with 3x Flag tag at the amino-terminus. 1000 ng of each plasmid, together with 250 ng pVSV-G plasmid and 750 ng pCMVΔR9 plasmid were reverse transfected into 293T cells using TransIT-X2® Dynamic Delivery System to generate lentiviruses carrying the inserted gene. Vector expressing 3xFlag tag was used as control. At 60 h post-transfection, all supernatants containing viruses were collected and used to infect A549 cells in 12-well plates to stably express the inserted genes. At 24 h post-infection, cells were transferred to 15-cm dish and cultured in the presence of 1 µg/ml puromycin. Puromycin resistant single clones were collected and transferred to 6-well plates in the presence of 1 µg/ml puromycin. Expression of inserted genes was tested by Western blotting using mouse anti-flag antibody.
smRNA-FISH and immunofluorescence microscopy
smRNA-FISH and immunofluorescence microscopy were performed as described previously 35.
siRNA
In experiments performed with cells stably expressing UAP56 wild-type and UAP56 (E197A), endogenous UAP56 was knocked down with an siRNA targeting the 3’-UTR (Dharmacon, 5’-GCUUCCAUCUUUUGCAUCAUU-3’). siRNAs used to knock down UAP56 in A549 cells were previously described 35.
Acute Sub2 depletion using the auxin-inducible degron system
Cells expressing Sub2-3V5-IAA7 (‘Sub2-degron’) were treated with 500 µM IAA (Indole-3-acetic acid) and 4 µM IP6 (inositol 6 phosphate) to induce acute protein depletion in the presence of OsTIR 23. After 2 hours of IAA/IP6 addition, cells were treated with 400 nM beta-estradiol to induce expression of a 3xGST-24PP7sl reporter mRNA that can be visualised by co-expression of PP7CP-yEGFP. Induction and localisation of the reporter RNA in Sub2-containing and Sub2-depleted cells was monitored by widefield microscopy as described above. Images were processed using FIJI software. Depicted are maximum projections of the central 11 planes of a 3D image. Quantification of the number of transcription foci (TF) per cell was performed manually using the FIJI cell counter tool. Only nuclear foci brighter than 1.2x cellular background intensity were counted (in comparison, a single mRNA showed an intensity of 1.15x cellular background intensity). To quantify transcription foci intensities, nuclear TF intensity was normalized to cellular background intensity to correct for cell-to-cell variability of PP7CP-yEGFP expression (note that induction of the reporter RNA also varied between cells).
In vitro transcription of Cy5-labeled mRNA
Cy5-labelled mRNA (in vitro flux experiments) was transcribed from pKW891, the 100bp Fluorescein-labelled RNA (FP experiments) was transcribed from a PCR product based on pKW3631 that contains the T7 promoter, both using the MegaShortScript kit (Thermo Fischer Scientific) and Cy5- or Fluorescein-labelled UTP (Enzo Life Sciences) as described in the manufacturer’s protocol. After transcription, the reaction was precipitated with LiCl, washed once with 100% EtOH and resuspended in 100 µl TE to a final concentration of 1.1 µg/µl (Cy5-RNA) or 1 µg/µl (Fluorescein-RNA).
Fluorescence Polarization
Reactions were performed in black, low binding flat bottom 384 well plates (Corning) in a BMG CLARIOstar plate reader. All reagents were filtered before use. For ATP binding experiments, reactions were assembled from 16 µl of a mix of storage buffer (MH200G) and Ded1 (from a 600 µM stock) to achieve the final Ded1 concentration as indicated, 2 µl 1 M Tris pH 8.5 and FP buffer (20% glycerol, 40 mM Tris pH 8.0, 50 mM NaCl, 0.01% IGEPAL, 2 mM DTT and 2 mM MgCl2) to a final volume of 78 µl. Each reaction was set up in duplicate (n=2). Focus and gain were adjusted for one sample containing no protein with additional 0.8 µl of 10 µM MANT-ATP (Jena Biosciences) and 1.2 µl FP buffer, and the scattering values (emitted light in parallel and perpendicular direction) measured for all samples (three measurements per sample) (excitation 360 ± 20 nm, dichroic 410 nm, emission 450 ± 10 nm). Next, a mix of 0.8 µl MANT-ATP and 1.2 µl FP buffer was added to all reactions and incubated for 2 minutes at room temperature. If reactions were performed in the presence of cold ATP, 2 µl of a 0.25 M ATP (buffered to pH 6.6) / MgCl2 solution was added prior to MANT-ATP addition. The emitted light in parallel and perpendicular direction was measured for all samples (three measurements per sample), from which after subtraction of the scattering values the fluorescence polarization was calculated (FP = (parallel light – perpendicular light) / ((parallel light + perpendicular light)). The three measurements per sample were averaged to one value per sample. The mean and the standard deviation are plotted against the Ded1 concentration. Nonlinear fit binding curves and Kd values were calculated using Prism (GraphPad). For RNA binding measurements, the reactions contained 2 µl of a mix of storage buffer (MH200G) and Ded1 (from a 500 µM stock) to achieve the final Ded1 concentration as indicated, 2 µl 100 mM ATP, 1 µl 1 M Tris pH 8.5 and 72 µl FP buffer. Each sample was set up in triplicate, plus one control sample per Ded1 concentration that contained competitor polyU (final concentration 0.625 mg/ml). After gain / focus adjustment for the Fluorescein-RNA, scattering values were measured (excitation 482 ± 16 nm, dichroic 504 nm, emission 530 ± 40 nm) and afterwards 3 µl of diluted Fluorescein RNA (0.03 µg/µl or 0.9 µM) added to each sample. Sample analysis was performed as described for MANT-ATP.
In vitro transfer of RNA between phase-separated droplets
For the reaction in Figure 4, Ded1-droplets were assembled from 16 µl LSB-100, 8 µl 50 µM Ded1-GFP, 1 µl HEPES pH 6.4 and incubated on ice for 10 min. To prevent dissolution while washing, 6 µl 60% PEG6000 was added, mixed and the reaction incubated for another 10 - 15 minutes. Dhh1 droplets were assembled from 10 µl LSB-100, 2 µl CKM, 5 µl 100 µM fresh Dhh1-mCherry, 2 µl 10 mg/ml BSA, 1 µl 1 M HEPES pH 6.4, 4 µl 1 mg/ml polyU, 1ul in vitro transcribed Cy5-labelled RNA (1.1 µg/µl) and incubated for 10 minutes on ice. 2-3 µl of the Ded1 droplet solution was pipetted into a 384-well plate containing 10 µl of LSB-100 buffer. Droplets were spun down at 200 g for 1 minute and (carefully) washed once with 40 µl LSB-100 to remove excess Ded1-GFP protein. 10 µl MM2 (MM2: 100 µl LSB-100, 20 µl CKM, 20 µl 10 mg/ml BSA) was added to the droplets after washing. On the microscope stage, 1µl of the Dhh1 droplet solution was added to the well and droplets were settled by gravity for less than 10 seconds. Imaging (widefield microscopy as described above) was started immediately, at 30 second intervals. After one frame, 3ul concentrated Not1 (250 µM) or buffer was added and gently mixed. Quantification of Cy5 intensity inside Ded-1GFP droplets was performed using the FIJI software. At least 15 droplets were analysed for each time point, and the mean fluorescence intensity calculated per droplet. These values were averaged, corrected for the value at t = 0 seconds, and the mean and SD plotted over time. The reactions in Extended Data Figure 6 were performed with slight modifications. Ded1-GFP droplets were assembled from 5 µl LSB-50, 1 µl 1 M Hepes pH 6.4 and 3 µl 200 µM Ded1. Dhh1-mCH-Cy5 droplets were assembled from 7 µl LSB-50, 1 µl CKM, 0.5 µl Hepes pH 6.4, 0.5 BSA (10 mg/ml), 0.2 µl Cy5-labelled RNA, 0.5 µl 1 mg/ml polyU and 2 µl 200 µM Dhh1. Dhh1-GFP droplets were assembled from 2.5 µl LSB-50, 1 µl CKM, 1 µl Hepes pH 6.4, 1 BSA (10 mg/ml), 1 µl 1 mg/ml polyU and 3 µl 100 µM Dhh1-GFP. 0.5 µl of the respective green droplets were pipetted into 5 µl of IVF-buffer (100 µl LSB-100, 4 µl 1 M Hepes pH 6.4 without stabilizing agents such as PEG or BSA which can inhibit some of the enzymatic reactions) and settled by gravity. After plates were mounted on the microscope and focus adjusted to the green droplets on the glass surface, 0.3 µl of the mCherry-Cy5 droplets was added and their settling monitored in the mCherry channel. With sufficient mCherry droplets in focus, the imaging time course was started, and 3 µl of the recombinant Not1 (300 µM) or eIF4G (300 µM, diluted in MH100G) added to the reaction to dissolve the mCherry droplets. The fluorescence intensity scaling was adjusted for the first image for the GFP and mCherry channels to account for the sample dilution upon the addition of Not1 or eIF4G, respectively. However, scaling of the Cy5 channel in the first image, and in the subsequenct frames [20s – 180s], is identical for the forward and the inverse reaction to enable a direct visual comparison. For each timepoint, Cy5 uptake into the green droplets was measured as mean intensity for regions in at least 6 GFP droplets, and for at least 6 ‘background’ regions of similar size that do not contain GFP droplets. After correction for the timepoint-specific mean background fluorescence, values are plotted for each timepoint. These are proof-of-principle experiment that were performed at least three times, with very similar results, but since RNA uptake is variable and seems to depend on the local density of mCherry droplets the replicates were not included in the quantification.
For quantification of transfer efficiency, droplets of the final movie frame (t= 2min) were segmented based on the Ded1-GFP channel, and the area of the droplets and the mean Cy5 intensity inside Ded1 droplets measured. The product of area*mean intensity was summed up over all droplets and divided by the overall mean fluorescence intensity * area of the given frame to calculate a partitioning coefficient. Mean and standard deviation are reported for movies of three independent transfer reactions.
Statistical analysis
For yeast images, quantification was performed as described in the individual sections. Values of n (cell count) and numbers of biological replicates are indicated in the figure legends. Unpaired t-test were performed on averages from each biological replicate using the Prism7 software (Graphpad). Significance of p-values is indicated by asterisks: * equals P ≤ 0.05, ** equals P ≤ 0.01, *** equals P ≤ 0.001. For UAP56 experiments, an unpaired t-est was performed; the p-value is two-tailed
Extended Data
Extended Data Fig. 1. Phase separation behavior of full-length and tail-less (core) Dhh1 in different pH conditions.
(a) Example images for the Dhh1 pH phase diagram. Reactions were assembled in 384 well plates. Each reaction contained 13.4 μl LSB-100, 2.1 μl 0.5 M KCl (final KCl concentration 100 mM), 1 μl CKM mix, 1.25 μl 100 mM ATP / MgCl2 (final concentration 5 mM), 1 μl 10 mg/ml BSA, 2 μl 1 M Hepes of the respective pH, 1.25 μl 1 mg/ml polyU and 3 μl MH200G containing Dhh1 to achieve the final concentration as indicated. Reactions were incubated at room temperature for 20 minutes and imaged at room temperature on a Nikon widefield microscope using an automated script (4 images per well of one replicate). Dhh1 core = Dhh1 (residues 48 - 425), lacking the low complexity tails. Scale bar 50 μm. (b-c) For each well, individual droplets in each image were quantified using Diatrack (see MM) for their area and mean intensity. The sum of the product [area * mean fluorescence intensity] (arbitrary unit: [A*I]) of all droplets in one image was plotted against the Dhh1 concentration (μM). (Dotted) lines represent the mean, shaded area the SD of the four images recorded per well for one replicate. (b) FL = full-length Dhh1, (c) Dhh1 core = Dhh1 [48 - 425]. (d) Mean values of the [area * mean fluorescence intensity] (arbitrary unit: [A*I]) sum of the four images recorded per well are plotted against the Dhh1 concentration for all pH tested. Dhh1 core protein concentrations not tested are marked by a cross. FL = full-length Dhh1, Dhh1 core = Dhh1 [48 - 425].
Extended Data Fig. 2. Phase separation behavior of full-length and tail-less (core) Dhh1 in different salt concentrations.
(a) Example images for the Dhh1 salt phase diagram at pH 6.4 and 7.0. Reactions were assembled in 384 well plates. Each reaction contained 12.5 μl LSB-100, 3 μl 0.5 M KCl / water to achieve the final KCl concentration as indicated, 1 μl CKM mix, 1.25 μl 100 mM ATP / MgCl2 (final concentration 5 mM), 1 μl 10 mg/ml BSA, 2 μl 1 M Hepes of the respective pH, 1.25 μl 1 mg/ml polyU and 3 μl MH200G containing Dhh1 to achieve the final concentration as indicated. Reactions were incubated at room temperature for 20 minutes and imaged at room temperature on a Nikon widefield microscope using an automated script (9 images per well of one replicate). Dhh1 core = Dhh1 (residues 48 - 425), lacking the low complexity tails. Scale bar 50 μm. (b-c) For each well, individual droplets in each image were quantified using Diatrack (see MM) for their area and mean intensity. The sum of the product [area * mean fluorescence intensity] (arbitrary unit: [A*I]) of all droplets in one image was plotted against the Dhh1 concentration (μM). (Dotted) lines represent the mean, shaded area the SD of of the nine images recorded per well for one replicate. (b) FL = full-length Dhh1, (c) Dhh1 core = Dhh1 [48 - 425]. (d) Mean values of the [area * mean fluorescence intensity] (arbitrary unit: [A*I]) sum of the nine images recorded per well are plotted against the Dhh1 concentration for all conditions tested. Dhh1 core protein concentrations not tested are marked by a cross. FL = full-length Dhh1, Dhh1 core = Dhh1 [48 - 425].
Extended Data Fig. 3. Phase separation behavior of full-length and tail-less (core) Dhh1 in different ATP concentrations.
(a) Example images for the Dhh1 ATP phase diagram at pH 6.4 and pH 7.0. Reactions were assembled in 384 well plates. Each reaction contained 13.4 μl LSB-100, 2.1 μl 0.5 M KCl (final KCl concentration 100 mM), 1 μl CKM mix, 1.5 μl ATP / MgCl2 (250 mM stock) and H2O to achieve the final concentration as indicated, 1 μl 10 mg/ml BSA, 2 μl 1 M Hepes of the respective pH, 1.25 μl 1 mg/ml polyU and 3 μl MH200G containing Dhh1 to achieve the final concentration as indicated. Reactions were incubated at room temperature for 20 minutes and imaged at room temperature on a Nikon widefield microscope using an automated script (9 images per well of one replicate). Dhh1 core = Dhh1 (residues 48 - 425), lacking the low complexity tails. Scale bar 50 μm. (b-e) For each well, individual droplets in each image were quantified using Diatrack (see MM) for their area and mean intensity. The sum of the product [area * mean fluorescence intensity] (arbitrary unit: [A*I]) of all droplets in one image was plotted against the Dhh1 concentration (μM). (Dotted) lines represent the mean, shaded area the SD of the nine images recorded per well for one replicate. (b,c) FL = full-length Dhh1, (d,e) Dhh1 core = Dhh1 [48 - 425]. (b,d) pH 6.4, (c,e) pH 7.0. (f) Mean values of the [area * mean fluorescence intensity] (arbitrary unit: [A*I]) sum of the nine images recorded per well are plotted against the Dhh1 concentration for all conditions tested. Dhh1 core protein concentrations not tested are marked by a cross. FL = full-length Dhh1, Dhh1 core = Dhh1 [48 - 425].
Extended Data Fig. 4. Phase separation behavior of full-length and tail-less (core) Dhh1 in different polyU concentrations.
Example images for the Dhh1 polyU phase diagram at pH 6.4 and 7.0. Reactions were assembled in 384 well plates. Each reaction contained 13.4 μl LSB-100, 2.1 μl 0.5 M KCl (final KCl concentration 100 mM), 1 μl CKM mix, 1.25 μl 100 mM ATP/MgCl2 (final concentration 5 mM), 1 μl 10 mg/ml BSA, 2 μl 1 M Hepes of the respective pH, 1.25 μl water / 10 mg/ml polyU to achieve the final concentration as indicated, and 3 μl MH200G containing Dhh1 to achieve the final concentration as indicated. Reactions were incubated at room temperature for 20 minutes and imaged at room temperature on a Nikon widefield microscope using an automated script (9 images per well of one replicate). Dhh1 core = Dhh1 (residues 48 - 425), lacking the low complexity tails. Scale bar 50 μm. (b-c) For each well, individual droplets in each image were quantified using Diatrack (see MM) for their area and mean intensity. The sum of the product [area * mean fluorescence intensity] (arbitrary unit: [A*I]) of all droplets in one image was plotted against the Dhh1 concentration (μM). (Dotted) lines represent the mean, shaded area the SD of the nine images recorded per well for one replicate. (b) FL = full-length Dhh1, (c) Dhh1 core = Dhh1 [48 - 425]. (d) Mean values of the [area * mean fluorescence intensity] (arbitrary unit: [A*I]) sum of the nine images recorded per well are plotted against the Dhh1 concentration for all conditions tested. Dhh1 core protein concentrations not tested are marked by a cross. FL = full-length Dhh1, Dhh1 core = Dhh1 [48 - 425].
Extended Data Fig. 5. The unstructured LC-tails of Dhh1 are required for multivalent interactions underlying LLPS and PB formation.
(a) Larger field of view of the samples represented in Fig 1C. Scale bars 5 μm. Dcp2, the catalytic subunit of the Dcp1-Dcp2 mRNA decapping complex, is used as a marker of PBs. Representative images of > 4 independent experiments. (b) ClustalOmega sequence alignment of yeast DDXs and their human counterparts. The RecA core is displayed in green; asterisks indicate sequence identity, dots represent sequence similarity. (c) schematic representation of LC sequence distribution in the unstructured tails of A. thaliana DDXs. Clustal Omega alignment of Dhh1 with its three A. thaliana orthologues.
Extended Data Fig. 6. Three of the five E. coli DEAD-box ATPases harbor low complexity sequences, undergo phase separation in vitro and form foci in vivo.
(a) Clustal Omega alignment of the five E. coli DEAD-box ATPases. The RecA core is displayed in green; asterisks indicate sequence identity, dots represent sequence similarity. (b) In vitro phase separation of E.coli SrmB-mCherry (6 µM) and DbpA-mCherry (6 µM) in the presence of ATP and RNA; scale bar 25 μM. Representative images of 3 independent experiments. (c) Individual imaging channels of the composite images presented in Fig 2e; representative images of >3 independent experiments. DDX-mCherry, GFP and a composite image for E. coli DeaD, SrmB, RhlE, and for RhlB as a negative control. Scale bars 2 μM. (d) Larger field of view of E. coli DDX-mCherry expression samples. Scale bar 15 µm. Representative images of 3 independent experiments. (e) Quantification of foci in E. coli samples for 4 images per construct. Cells were segmented and for each individual cell, the mean fluorescence intensity and number of foci was quantified. Cells with 0 or 1 foci were grouped for technical reasons (see Material and Methods). Cells were binned based on mean fluorescence intensity, representing their expression level, and the three highest bins excluded from further analysis since they contain cells where fluorescence intensity has reached saturation. The percentage of cells containing 0 / 1, 2, 3 or more than 3 foci are plotted for each bin. There is no correlation between expression levels and focus formation in the various strains.
Extended Data Fig. 7. The catalytically deficient mutant Ded1DQAD forms constitutive stress granules, without being compromised for RNA or ATP binding.
(A) Ded1DQAD-mCherry, but not wild-type Ded1-mCherry, forms SGs (marked with arrows) in unstressed cells. Representative images of >3 independent experiments. (B) Fluorescence polarization analysis to measure binding of MANT-ATP to either wild-type Ded1 or Ded1DQAD. n = 3 technical replicates, mean and SD; nonlinear fit (on site binding curve) calculated using Prism (Graphpad). (C) Fluorescence polarization analysis to measure binding of a fluorescein-UTP labeled, 100bp-long RNA to wild-type either wild-type Ded1 or Ded1DQAD. n = 3 technical replicates, mean and SD; nonlinear fit (on site binding curve) calculated using Prism (Graphpad).
Extended Data Fig. 8. The ATPase activity of Ded1 controls disassembly of stress granules.
Larger field of view, more time points and DMSO-treated control samples of the experiment presented in Fig 1B. Scale bars 5 μm. Representative images of 3 biological replicates.
Extended Data Fig. 9. DDX ATPase activity controls turnover of nuclear compartments in human and yeast.
(A, B) Depletion of the DDX ATPase UAP56 leads to an increase in nuclear speckle size. This is consistent with the model that UAP56, which does not contain LCDs and is not an essential ‘building block’ for nuclear speckles, is required for RNA turnover in speckles and its absence would thus lead to an increased residence time of RNA in the compartment and a subsequent increase in the size of preexisting compartments. (A) A549 cells were transfected with control siRNA or UAP56 siRNA. After 48 h, cells were infected with influenza virus (WSN) at a MOI of 10 for 6 h. Cells were subjected to smRNA-FISH to label viral M mRNA and immunofluorescence to stain nuclear speckles with SON antibody. ‘Viral M RNA’ is an influenza virus transcript that has been described to traffic through nuclear speckles22 and is used as a model to represent poly-adenylated, spliced cellular transcripts. Insets: enlargements of the marked white squares showing nuclear speckles. Scale bar 10 μm. Data are representative of three independent experiments. (B) The percentage of M mRNA at nuclear speckles was plotted against the nuclear speckle volume (423 nuclear speckles for each condition - control and UAP56 siRNA). (C) Stably transfected A549 cells expressing wild-type (WT) or UAP56 mutant (E197A) were treated with siRNA targeting 3’-UTR to knockdown endogenous UAP56. Cells were subjected to immunofluorescence microscopy with SON antibody. Scale bar 10 μm. Data are representative of three independent experiments. (D, E) Selection and characterization of stably transfected A549 cells expressing WT or E197A UAP56. For gel source data, see Supplementary Figure 1. Data are representative of three independent experiments. (D) Several cell clones stably expressing WT or E197A UAP56 were tested by western blot using anti-Flag antibody. Clone 2 of WT and clone 3 of E197A were selected for further studies. (E) Immunofluorescence with anti-Flag antibody shows similar expression levels of exogenous UAP56 or UAP56 (E197A) in the selected stable cell lines. Scale bar, 10 μm. (F) Merged images with nuclear rim staining for experiments in Fig 3F. Representative images of 5 (Sub2 degron) or 6 (Sub2) biological replicates. (G) Cells were treated as in Figure 4G. At time point t=60 min after reporter RNA induction cells were treated with either water or 5% 1.6 hexanediol for 20 min. Representative images of 3 biological replicates. (H) Quantification of percentage of cells displaying either distinct nuclear RNA foci (transcription foci, TF; up to 2 to account for mitotic cells) or diffuse nuclear RNA signal in Sub2-depleted cells. Representative images of 5 biological replicates with n>380 cells per replicate. Unpaired t-test (two-tailed) with *** p=0.0009 and **** p<0.0001. Mean and SEM, dots represent mean of individual replicates.
Extended Data Fig. 10. DDX ATPase activity regulates transfer of RNA molecules between phase-separated compartments in vivo and in vitro.
(A, B) In vivo, SG assembly upon treatment with 0.5% sodium azide was monitored by Ded1-yEGFP in cells expressing untagged Dhh1 WT or Dhh1DQAD as the sole copy, and in a dhh1Δ background. Quantification of SGs per cell was performed using Diatrack. 4 biological replicates, at least 855 (WT), 755 (dhh1Δ) or 106 (Dhh1DQAD) cells per replicate. Ded1 and Pab1 (polyA-binding protein) are bona fide markers of stress granules. Mean and SD, unpaired t-test (two-tailed), *** p = 0.0003 (dhh1Δ) respectively p = 0.0001 (Dhh1DQAD). Dots represent mean of individual replicates. (C, D) RNA transfer between Dhh1 and Ded1 droplets. (C) Forward reaction: Dhh1-mCherry droplets were assembled with Cy5-labeled RNA and added to Ded1-GFP droplets. Upon Not1MIF4G addition, Dhh1 droplets dissolve and the Cy5-RNA accumulates in the Ded1 droplets. (D) Inverse reaction: Ded1-mCherry droplets were assembled with Cy5-labeled RNA and added to Dhh1-GFP droplets. Upon eIF4GC-terminus addition, Ded1 droplets dissolve, but the Cy5-RNA does not accumulate in the Dhh1 droplets. In contrast to the reaction presented in the main Figure 4, for the reactions shown in C and D, no stabilizing agents such as BSA or PEG were added in order to make the results in the forward and inverse reaction comparable. The fluorescence intensity scaling was adjusted for the first image (before Not1 / eIF4G addition) to account for the sample dilution upon the addition of Not1 or eIF4G, respectively. However, scaling of the Cy5 channel in the first image, and in the subsequent frames [20s – 180s], is identical for the forward and the inverse reaction to enable a direct visual comparison. (E) Quantification of the reactions presented in (C) and (D). For each experiment, the mean Cy5-RNA intensity accumulating in six Dhh1-GFP droplets is plotted over time after addition of Not1 or eIF4G, respectively. For background correction, six identically sized areas outside of Dhh1-GFP droplets were quantified and subtracted from the intensity measured inside the Dhh1-GFP droplets, mean and SD. These experiments were repeated at least three times, with comparable results. Mean (line) and SD (shaded area) of 6 large droplets per movie and forward and inverse reaction. At t= 180 s, 16.7 +/- 2.7% of the Cy5-RNA is enriched in Ded1-GFP droplets occupying 5-7% of the surface area (n = 3 movies, mean and SD). (F) Line scan of the Cy5 channel (raw data), at timepoint t = 180 s through Ded1 droplets shown in Extended Data Fig. 6c. In the ‘forward’ reaction, Ded1 droplets enrich Cy5-RNA 2-3 fold over background.
Supplementary Material
Acknowledgements
We would like to thank Gorjan Stojanovski and Magdalena Martinovic for technical assistance. We are grateful to Alan Sachs and Jan Liphardt for plasmids, Stefanie Jonas, Martin Jinek, Philipp Kimming, Elisa Dultz, Sarah Khawaja, Carmen Weber and Mostafa Zedan for their critical reading of this manuscript, ScopeM and Justine Kusch for help with microscopy, Miriam Linsenmeier and Andreas Küffner for helpful discussions of image and protein sequence analysis, and members of the Weis lab for helpful discussions and comments.
Funding: M.H. was supported by a Human Frontier Science Program (HFSP) postdoctoral fellowship (LT000914/2015) and an ETH postdoctoral fellowship (FEL-37-14-2). S.H. and M.H. acknowledge support from an EMBO long-term fellowship (ALTF 290-2014, EMBOCOFUND2012, GA-2012-600394 to S.H.; ALTF 870-2014 to M.H.). This work was supported by the Swiss National Science Foundation (SNF 31003A_179275 and 31003A_159731 to K.W.).
Footnotes
Code availability
Diatrack is available under www.diatrack.org. Additional Matlab codes used in this study are available from www.diatrack.org/DiatrackMaria.zip.
Data Availability Statement (DAS):
The datasets generated in this study are available from the corresponding author upon request. Code availability is described in the Material and Methods section.
Author contributions: M.H. and K.W. conceptualized and organized the project and wrote the manuscript. M.H. analysed protein sequences, designed and performed all in vitro experiments and the E. coli imaging. R.S. designed, performed and analysed yeast experiments in Fig. 1c and 4a. M.H., R.S. and S.H. designed, performed and analysed yeast experiments in Fig. 3a. S.H. designed, performed and analysed yeast experiments in Fig. 3f. J.W. and B.F. designed, performed and analysed experiments on human cell lines. P.V. anlysed images for the Dhh1 phase diagram and the bacterial protein expression. K.W. provided experimental input, contributed to FP experiments and supervised the study. All authors contributed to editing the manuscript.
Author Information Statement: Reprints and permissions information is available at www.nature.com/reprints.
The Authors declare no competing interests.
References
- 1.Shin Y, Brangwynne CP. Liquid phase condensation in cell physiology and disease. Science (New York, N.Y) 2017;357 doi: 10.1126/science.aaf4382. [DOI] [PubMed] [Google Scholar]
- 2.Banani SF, Lee HO, Hyman AA, Rosen MK. Biomolecular condensates: organizers of cellular biochemistry. Nat Rev Mol Cell Biol. 2017 doi: 10.1038/nrm.2017.7. [DOI] [PMC free article] [PubMed] [Google Scholar]
- 3.Linder P, Jankowsky E. From unwinding to clamping - the DEAD box RNA helicase family. Nat Rev Mol Cell Biol. 2011;12:505–516. doi: 10.1038/nrm3154. [DOI] [PubMed] [Google Scholar]
- 4.Mugler CF, et al. ATPase activity of the DEAD-box protein Dhh1 controls processing body formation. eLife. 2016;5 doi: 10.7554/eLife.18746. [DOI] [PMC free article] [PubMed] [Google Scholar]
- 5.Ozgur S, et al. The conformational plasticity of eukaryotic RNA-dependent ATPases. FEBS J. 2015 doi: 10.1111/febs.13198. n/a–n/a. [DOI] [PubMed] [Google Scholar]
- 6.Franzmann T, Alberti S. Prion-like low-complexity sequences: Key regulators of protein solubility and phase behavior. J Biol Chem. 2018 doi: 10.1074/jbc.TM118.001190. jbc.TM118.001190. [DOI] [PMC free article] [PubMed] [Google Scholar]
- 7.Kato M, et al. Cell-free formation of RNA granules: low complexity sequence domains form dynamic fibers within hydrogels. Cell. 2012;149:753–767. doi: 10.1016/j.cell.2012.04.017. [DOI] [PMC free article] [PubMed] [Google Scholar]
- 8.Nott TJ, et al. Phase Transition of a Disordered Nuage Protein Generates Environmentally Responsive Membraneless Organelles. Mol Cell. 2015;57:936–947. doi: 10.1016/j.molcel.2015.01.013. [DOI] [PMC free article] [PubMed] [Google Scholar]
- 9.Elbaum-Garfinkle S, et al. The disordered P granule protein LAF-1 drives phase separation into droplets with tunable viscosity and dynamics. Proc Natl Acad Sci U S A. 2015;112:7189–7194. doi: 10.1073/pnas.1504822112. [DOI] [PMC free article] [PubMed] [Google Scholar]
- 10.Montpetit B, et al. A conserved mechanism of DEAD-box ATPase activation by nucleoporins and InsP6 in mRNA export. Nature. 2011;472:238–242. doi: 10.1038/nature09862. [DOI] [PMC free article] [PubMed] [Google Scholar]
- 11.Oberer M, Marintchev A, Wagner G. Structural basis for the enhancement of eIF4A helicase activity by eIF4G. Genes Dev. 2005;19:2212–2223. doi: 10.1101/gad.1335305. [DOI] [PMC free article] [PubMed] [Google Scholar]
- 12.Hilliker A, Gao Z, Jankowsky E, Parker R. The DEAD-box protein Ded1 modulates translation by the formation and resolution of an eIF4F-mRNA complex. Mol Cell. 2011;43:962–972. doi: 10.1016/j.molcel.2011.08.008. [DOI] [PMC free article] [PubMed] [Google Scholar]
- 13.Valentin-Vega YA, et al. Cancer-associated DDX3X mutations drive stress granule assembly and impair global translation. Sci Rep. 2016;6:25996. doi: 10.1038/srep25996. [DOI] [PMC free article] [PubMed] [Google Scholar]
- 14.Xiol J, et al. RNA clamping by Vasa assembles a piRNA amplifier complex on transposon transcripts. Cell. 2014;157:1698–1711. doi: 10.1016/j.cell.2014.05.018. [DOI] [PubMed] [Google Scholar]
- 15.Mathys H, et al. Structural and biochemical insights to the role of the CCR4-NOT complex and DDX6 ATPase in microRNA repression. Mol Cell. 2014;54:751–765. doi: 10.1016/j.molcel.2014.03.036. [DOI] [PubMed] [Google Scholar]
- 16.Gao Z, et al. Coupling between the DEAD-box RNA helicases Ded1p and eIF4A. eLife. 2016;5:568. doi: 10.7554/eLife.16408. [DOI] [PMC free article] [PubMed] [Google Scholar]
- 17.Balagopal V, Parker R. Polysomes, P bodies and stress granules: states and fates of eukaryotic mRNAs. Curr Opin Cell Biol. 2009;21:403–408. doi: 10.1016/j.ceb.2009.03.005. [DOI] [PMC free article] [PubMed] [Google Scholar]
- 18.Teixeira D, Sheth U, Valencia-Sanchez MA, Brengues M, Parker R. Processing bodies require RNA for assembly and contain nontranslating mRNAs. RNA. 2005;11:371–382. doi: 10.1261/rna.7258505. [DOI] [PMC free article] [PubMed] [Google Scholar]
- 19.Buchan JR, Muhlrad D, Parker R. P bodies promote stress granule assembly in Saccharomyces cerevisiae. J Cell Biol. 2008;183:441–455. doi: 10.1083/jcb.200807043. [DOI] [PMC free article] [PubMed] [Google Scholar]
- 20.Galganski L, Urbanek MO, Krzyzosiak WJ. Nuclear speckles: molecular organization, biological function and role in disease. Nucleic Acids Res. 2017;45:10350–10368. doi: 10.1093/nar/gkx759. [DOI] [PMC free article] [PubMed] [Google Scholar]
- 21.Dias AP, Dufu K, Lei H, Reed R. A role for TREX components in the release of spliced mRNA from nuclear speckle domains. Nat Commun. 2010;1:97. doi: 10.1038/ncomms1103. [DOI] [PMC free article] [PubMed] [Google Scholar]
- 22.Mor A, et al. Influenza Virus mRNA Trafficking Through Host Nuclear Speckles. Nat Microbiol. 2016;2016:16069. doi: 10.1038/nmicrobiol.2016.69. [DOI] [PMC free article] [PubMed] [Google Scholar]
- 23.Nishimura K, Fukagawa T, Takisawa H, Kakimoto T, Kanemaki M. An auxin-based degron system for the rapid depletion of proteins in nonplant cells. Nat Meth. 2009;6:917–922. doi: 10.1038/nmeth.1401. [DOI] [PubMed] [Google Scholar]
- 24.Kroschwald S, Maharana S, Simon A. Hexanediol: a chemical probe to investigate the material properties of membrane-less compartments. Matters. 2017;3.5:1–6. [Google Scholar]
- 25.Nott TJ, Craggs TD, Baldwin AJ. Membraneless organelles can melt nucleic acid duplexes and act as biomolecular filters. Nat Chem. 2016;8:569–575. doi: 10.1038/nchem.2519. [DOI] [PubMed] [Google Scholar]
- 26.Langdon EM, et al. mRNA structure determines specificity of a polyQ-driven phase separation. Science. 2018;157:eaar7432. doi: 10.1126/science.aar7432. [DOI] [PMC free article] [PubMed] [Google Scholar]
- 27.Van Treeck B, et al. RNA self-assembly contributes to stress granule formation and defining the stress granule transcriptome. Proc Natl Acad Sci U S A. 2018;95 doi: 10.1073/pnas.1800038115. 201800038. [DOI] [PMC free article] [PubMed] [Google Scholar]
- 28.Jain A, Vale RD. RNA phase transitions in repeat expansion disorders. Nature Publishing Group. 2017;546:243–247. doi: 10.1038/nature22386. [DOI] [PMC free article] [PubMed] [Google Scholar]
- 29.Rai AK, Chen J-X, Selbach M, Pelkmans L. Kinase-controlled phase transition of membraneless organelles in mitosis. Nature Publishing Group. 2018;559:211–216. doi: 10.1038/s41586-018-0279-8. [DOI] [PubMed] [Google Scholar]
- 30.Ramachandran V, Shah KH, Herman PK. The cAMP-dependent protein kinase signaling pathway is a key regulator of P body foci formation. Mol Cell. 2011;43:973–981. doi: 10.1016/j.molcel.2011.06.032. [DOI] [PMC free article] [PubMed] [Google Scholar]
- 31.Longtine MS, et al. Additional modules for versatile and economical PCR-based gene deletion and modification in Saccharomyces cerevisiae. Yeast. 1998;14:953–961. doi: 10.1002/(SICI)1097-0061(199807)14:10<953::AID-YEA293>3.0.CO;2-U. [DOI] [PubMed] [Google Scholar]
- 32.Schindelin J, et al. Fiji: an open-source platform for biological-image analysis. Nat Meth. 2012;9:676–682. doi: 10.1038/nmeth.2019. [DOI] [PMC free article] [PubMed] [Google Scholar]
- 33.Vallotton P, et al. Diatrack particle tracking software: Review of applications and performance evaluation. Traffic. 2017;18:840–852. doi: 10.1111/tra.12530. [DOI] [PMC free article] [PubMed] [Google Scholar]
- 34.Mugler CF, et al. ATPase activity of the DEAD-box protein Dhh1 controls processing body formation. eLife. 2016;5:4154. doi: 10.7554/eLife.18746. [DOI] [PMC free article] [PubMed] [Google Scholar]
- 35.Mor A, et al. Influenza virus mRNA trafficking through host nuclear speckles. Nat Microbiol. 2016;1:16069. doi: 10.1038/nmicrobiol.2016.69. [DOI] [PMC free article] [PubMed] [Google Scholar]
Associated Data
This section collects any data citations, data availability statements, or supplementary materials included in this article.


