

Summary
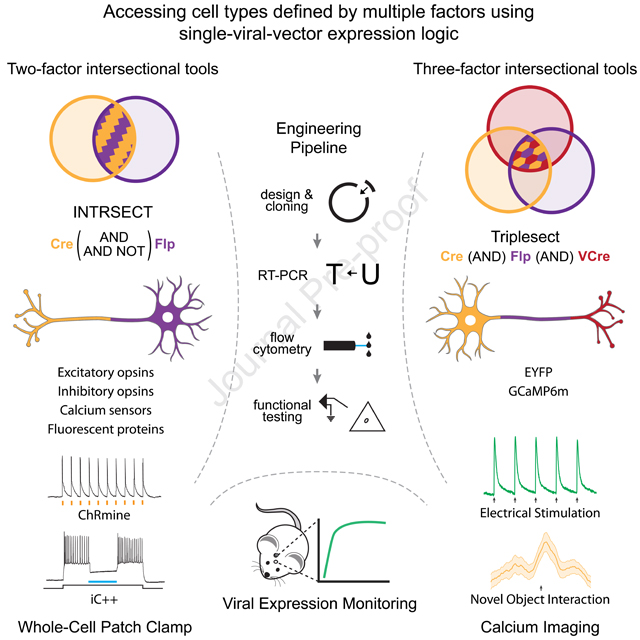
Both the resolution and dimensionality with which biologists can characterize cell types have expanded dramatically in recent years, and intersectional consideration of such features (e.g. multiple gene-expression and anatomical parameters) is increasingly understood to be essential. At the same time, genetically-targeted technology for writing-in and reading-out activity patterns for cells within living organisms has enabled causal investigation in physiology and behavior; however, cell-type-specific delivery of these tools (including microbial opsins for optogenetics and genetically-encoded Ca2+ indicators) has thus far fallen short of versatile targeting to cells jointly defined by many individually-selected features. In this Resource, we develop a comprehensive intersectional targeting toolbox, including 39 novel vectors for joint-feature-targeted delivery of 13 molecular payloads (including opsins, indicators, and fluorophores), systematic approaches for development and optimization of new intersectional tools, hardware for in vivo monitoring of expression dynamics, and the first versatile single-virus tools (Triplesect) that enable targeting of triply-defined cell types.
Keywords: Optogenetics, Fluorophores, Calcium Imaging, GECI, Channelrhodopsin, Recombinase, Cre, Flp, VCre, Targeting, Intersectional, Boolean
ETOC
Here, the authors enable versatile functional access to cell types defined by the presence of multiple (2 or 3) features, creating diverse expression-control logic contained within single viruses. This result is a comprehensive toolset enabling multiple feature-dependent optogenetic inhibition and excitation, and structure- or activity-based fluorescence-imaging with diverse new indicators.
Graphical abstract
Introduction
Cellular-resolution investigation of the biology of behaving animals has leveraged powerful genetically-encoded molecular tools that utilize visible light for exchange of information with targeted cells, including optogenetic tools to control cellular events, and fluorescent indicators to report cellular signaling and anatomy. However, application of these approaches depends upon the ability to selectively express the genetically-encoded tools in well-defined cellular subpopulations—with limitations that have become increasingly apparent with the rapid progression of detailed single-cell transcriptomes and connectomes revealing that cell-type definition with only single features is inadequate.
A technique termed INTRSECT (intronic recombinase sites enabling combinatorial targeting) partially addressed this challenge (Fenno et al., 2014), advancing beyond earlier single-feature methods for cell-type targeting (which in the case of viral tools, had been based upon enhancer- or anatomy-guided expression of a single recombinase (e.g. Cre) employed in combination with a Cre-dependent virus) (reviewed in Fenno et al., 2011; Yizhar et al., 2011)). In contrast, INTRSECT allowed adeno-associated virus (AAV)-borne molecular payloads to be expressed in cells based on a doubly-specified combination of genetic and/or anatomical-defined parameters, by placing two orthogonal recombinase (Cre and Flp) recognition sequences within synthetic introns (Fenno et al., 2017). Though only enabled for EYFP and the excitatory channelrhodopsin fusion-protein ChR2-EYFP, the initial proof-of-concept two-feature INTRSECT has been successfully applied in diverse experimental settings, including for mapping projection patterns of certain neuronal subtypes (Chuhma et al., 2018; Poulin et al., 2018) and for probing the contribution of doubly-specified cell populations to diverse motivated behaviors (Gao et al., 2019; Lazaridis et al., 2019; Marcinkiewcz et al., 2016; Tovote et al., 2016). However, the ensuing six years have witnessed an explosion in the richness of molecular cell typology, creating fundamental unmet need for a comprehensive toolset beyond ChR2-EYFP able to investigate both necessity and sufficiency as well as natural activity of targeted cell populations in multiply-defined neurons, including both dual-feature and triple-feature targeting.
Here we report our development of this toolset, driven by an approach spanning four independent domains of intersectional-expression engineering: 1) design of a pipeline for developing multiple-recombinase-dependent constructs to expand the repertoire of two-feature targeting to a wide array of commonly-used molecular tools, bringing the total number of validated intersectional tools from 6 to 45; 2) refinement of the Flp recombinase-dependent components of the viral backbone to significantly enhance Flp-mediated recombination, thereby widening the range of intersectional experimental designs available; 3) quantifying recombinase- and non-recombinase-dependent expression kinetics with a novel device for chronic in vivo expression monitoring; and 4) the first triple-intersectional viral technology, validating resulting tools both in vitro and in vivo. These resources allow detailed and rigorous investigation of the natural and causal roles of cells defined by the intersection of many genetically- and/or anatomically-specified properties.
Results
Development of the intersectional pipeline
INTRSECT combines synthetic introns and dependency on two recombinases (Cre and Flp) to restrict EYFP or ChR2-EYFP to cellular populations specified by two features (Figure 1A–F). For example, two introns could be inserted into a gene with two reading frames (initially, an opsin-fluorophore fusion gene). The starting configuration of the exons and the recombinase recognition sites (e.g. lox and FRT) determined which logical combination of Cre and Flp would enable expression (Figure 1D,E), and the synthetic introns that contained these recombinase sites were reliably removed during mRNA splicing, allowing functional protein to be expressed (Figure 1F).
Figure 1. INTRSECT strategy and engineering pipeline.

A,D) INTRSECT molecular designs for single open reading frame (‘ORF’; A) and double ORF (D) in three boolean configurations (Cre AND Flp, Cre AND NOT Flp, Flp AND NOT Cre). Reagents for each configuration are listed. B,E) Activity of Cre and Flp to move the single ORF (B) and double ORF (E) INTRSECT starting configurations (top) to the active (dotted box, middle), and inactivated (bottom) states. C,F) From top to bottom, how initial DNA configuration for single ORF (C) and double ORF (F) constructs transition to the active state after recombinase-dependent rearrangement, mRNA processing that removes introns containing recombinase recognition sites, and translation without addition of extraneous sequence (crystal structure in C: GCaMP6m PDB: 3wld (Ding et al., 2014); F: iC++ PDB: 6csn (Kato et al., 2018)). G) Standardized engineering pipeline for production of novel INTRSECT constructs consisting of (left to right) design of intron placement and cloning, RT-PCR to ensure proper splicing, flow cytometry to assay proper expression, and functional testing (in cultured neurons or HEK cells) to compare with the parent. H) Electrophysiology in cultured neurons expressing WT, Con/Fon, Con/Foff, or Coff/Fon variants of ChRmine 3.3-p2a-oScarlet (left) or iC++-EYFP (right) with recombinases. See Figs. s1–s4.
To create next-generation intersectional tools with a broad diversity of molecular payloads, we began by designing a production pipeline (Figure 1G, H). We tested this pipeline by creating novel intersectional viruses for a broad array of commonly-used optical tools, implementing new classes of payload as well as incorporating vastly more potent capabilities that have emerged in recent years: fluorescent proteins (mTagBFP, mCherry, oScarlet; Figure s1 (oScarlet and sRGECO are variants of mScarlet and jRGECO1a that we engineered to reduce aggregation, described in Figures s1A–C and s2A–E)), Ca2+ indicators (GCaMP6f, GCaMP6m, sRGECO; Figure s2), excitatory opsins (ChRmine3.3-p2a-oScarlet; ChR2(H134R)-mCherry, bReaChES-EYFP, ChR2(E123T/T159C)-EYFP; Figure s3), and inhibitory opsins (iC++-EYFP; NpHR3.3-p2a-EYFP, Arch3.3-p2a-EYFP; Figure s4). The new pipeline (Figure 1G) was validated both through the generalized success of its informatics-based intron placement in generating properly spliced products, and by the early identification of occasional two-intron constructs with spurious splice products (allowing early modification prior to further characterization in vitro or in vivo; Figure 2).
Figure 2. Standardized INTRSECT design/implementation.

A) RT-PCR testing and mis-splicing resolution approach for new INTRSECT constructs. B,E) Mis-spliced RT-PCR results for INTRSECT bReaChES-EYFP and NpHR3.3-p2a-EYFP. bReaChES-EYFP (B) and NpHR3.3-p2a-EYFP (E) had major and minor splice variants from cryptic splicing (noted by #) and exon1 to exon 3 direct splicing (noted by *). C,F) The bReaChES-EYFP intron was moved to an alternative splice site (C). NpHR3.3-p2a-EYFP did not have a separate splice site or degenerate codon options; guided by the published crystal structure, we disrupted the cryptic splice site (F-arrow) by introducing the mutation W179F (F-center), which did not affect opsin function (F-right; p = 0.9754, unpaired t-test). D,G) These iterations of bReaChES-EYFP (D) and NpHR3.3-p2a-EYFP (G) generated either single spliced products (D), or the correct major product and an exon 1-exon 3 minor splice variant (G). H) To catch errors early during scaling/implementation, we have described a protocol for making new INTRSECTs (Fenno et al., 2017) and maintain a Standard Operating Procedure (http://www.optogenetics.org/intrsect_sop.pdf). See Figures s1–s4.
When necessary, improving splice fidelity required individualized strategies based on sequence of the mis-spliced products (Figure 2A); for example, we observed a preferred, cryptic splice site within the second exon of bReaChES-EYFP as well as direct splicing of exon-1 to exon-3 (Figure 2B). In this case, simply moving the first intron to a 3’secondary candidate splice site was sufficient to eliminate both the cryptic site and exon skipping (Figure 2C,D). Separately, mis-splicing at a cryptic site was found with NpHR3.3-p2a-EYFP (Figure 2E); in this case, the sequence of NpHR did not offer an additional splice site option and we were unable to use codon degeneracy to disrupt the cryptic splice site. We instead leveraged the structure of NpHR (Kouyama et al., 2010) to consider that the distance (>8 angstroms) of the residue encoded by the cryptic splice site from the retinal binding pocket likely would enable engineering of a site that would be non-destructive to protein function (Figure 2F-left); indeed, the introduced mutation W179F did not negatively influence opsin function (Figure 2F-right; p=0.9754, unpaired t-test), and successfully resolved mis-splicing (Figure 2G). We anticipate that our algorithmic approach to addressing mis-splicing will be a helpful addition to the standard operating procedure and design manual for INTRSECT implementation (Figure 2H).
Aside from such rare cryptic splice sites, direct exon-1 to exon-3 splicing was a frequently-observed minor splice variant in two-intron (three-exon) constructs. We attenuated this phenomenon with a panel of approaches including modifying the splice acceptor polypyrimidine tract C/T content, increasing intron sequence length, and increasing distance between the introns. None of these approaches completely eliminated exon-1 to exon-3 direct splicing (data not shown); in fact even original wildtype (WT) cDNA exhibited the same splice product and sequence in some cases (including in NpHR3.3(W179F)-p2a-EYFP, Figure s4A; ChR2(H134R)-mCherry, Figure s3G), indicative of intrinsic splicing without synthetic introns. These alternatively-spliced variants were minor products that did not adversely affect functional expression relative to WT.
Flow cytometry in HEK293 cells revealed operation as expected for all of the novel Cre AND Flp (Con/Fon) vectors (schematized in Figure 1B,E): no expression in the absence of recombinases, expression level comparable to WT when paired with activating recombinases, and no off-target expression. The Flp AND NOT Cre (Coff/Fon) constructs exhibited a range of expression associated with tool class: fluorophores and GECIs expressed at moderately reduced levels relative to WT (Figure s1E,H,K; Figure s2G,J,M), while excitatory (Figure s3B,E,H,K) and inhibitory (Figure s4B,E,H) opsin expression levels were comparable to that of WT. Inactivation of Coff/Fon constructs, by co-transfection with Cre as well as Flp, was effective at diminishing expression to levels similar to negative-control levels. For the opposite configuration (Con/Foff; Cre AND NOT Flp), co-transfection with Flp as well as Cre diminished expression in all cases; in some constructs expression was abolished (i.e. to levels indistinguishable from those of negative controls), while in others expression was decreased by more than an order of magnitude but still detectable at 5 days post-transfection. These constructs thus revealed the potential for transient off-target expression in cells co-expressing Cre and Flp, which could occur (for example) if Cre acts before Flp in Con/Foff constructs due to the known higher efficacy of Cre relative to Flp (Leonie Ringrose et al., 1998); we address this (Figures s5,s6) with optimized Flp recombinase-dependent construct design.
Next, regarding function of resulting correctly-assembled constructs in the pipeline, fluorophores were tested by expression in neurons in addition to flow cytometry analysis (Figure s1F,I,L). GECIs were transfected into neuronal primary cultures and functionally assayed by electrical field stimulation with single-cell resolution fluorescence [Ca2+]i imaging. All GECI constructs (sRGECO, GCaMP6f, GCaMP6m) generated reliable signals. Basal expression from these intersectional constructs was significantly decreased relative to the parental tool in some cases (Figure s2H,K; all vs. WT; sRGECO Con/Fon p = 0.0034, Con/Foff and Coff/Fon p< 0.0001; GCaMP6m Coff/Fon p = 0.0414, Kruskal-Wallis test with Dunn’s test); [Ca2+]i signals (∆F/F) were greater in cases of lower basal fluorescence (Figure s2H,N; sRGECO Con/Fon p = 0.0161, Con/Foff and Coff/Fon p < 0.0001, GCaMP6f Con/Fon p = 0.0468, Coff/Fon p< 0.0001, Kruskal-Wallis test with Dunn’s test). Whole-cell electrophysiology of opsin variants under photostimulation was generally indistinguishable compared with WT/parental constructs (Figure s3C,F,I,L; Figure s4C,I), with the exception of Arch3.3-p2a-EYFP where Con/Fon and Con/Foff exhibited moderately diminished photocurrents in culture (p< 0.05 for both, ANOVA with Dunnett’s test). To explore this effect, we produced adeno-associated virus (AAV) of the parental and Arch3.3-p2a-EYFP constructs and co-injected these with AAV encoding activating recombinases (Ef1a-Cre, Ef1a-Flp, and Ef1a-Flp-2a-Cre) into mouse hippocampus for further evaluation by slice electrophysiology. In contrast to photocurrents observed after one week of cultured neuron expression, we found that photocurrents with intersectional Arch3.3-p2a-EYFP tools in slice four weeks post-injection (a more natural application setting than cultured neurons) were indistinguishable from WT Arch3.3-p2a-EYFP (Figure s4F-left, Con/Fon p= 0.3966, Con/Foff p= 0.9286, Coff/Fon p< 0.0001, ANOVA with Dunnett’s test).
This new molecular engineering pipeline, that identifies sub-optimal function early in the production process (Figure 2A) and enables efficient creation of intersectional constructs in silico that function well out-of-the-gate after cloning (Figure 1G), allowed the systematic generation and validation of a broad repertoire of intersectional viral tools for precision cell-type investigation in biology and brings the total number to 45; at the same time, this algorithmic approach was crucial for creating the triple-recombinase-dependent virus described below.
Improvement of the FRT cassette
While flow cytometry data largely matched functional expression when constructs were paired with correct recombinases, we consistently observed a minor population of cells with residual expression 5 days after co-transfection of Con/Foff constructs with Cre and Flp. We hypothesized that this pattern might result from inefficiency of Flp relative to Cre, characterized to be an order of magnitude less efficient at equimolar concentrations in vitro (Leonie Ringrose et al., 1998). We therefore sought to reduce this off-target expression by screening Con/Foff variants containing modifications of the Flp-dependent elements for increased sensitivity to Flp-mediated recombination.
The Flp-dependent cassette (Figure s5A-top) utilizes two independent Flp recognition elements in the double-floxed inverted open-reading-frame (DIO; Zhang et al., 2008) configuration for recombinase-dependent inversion of exons (Zhang et al., 2008; Atasoy et al., 2008; Sohal et al., 2009). The original INTRSECT design utilized the F3 and F5 sequences (Schlake and Bode, 1994), chosen to avoid potential intermolecular recombination between virus and the genome of transgenic Cre-expressing animal lines, some of which may contain a residual FRT sequence. Here we used a rational screening approach that started with a wide range of Con/Foff-EYFP variants (Figure s5A-bottom) and further modified promising ones. Candidates were screened by flow cytometry in vitro to evaluate mean EYFP intensity of the residual population as well as the percentage of the parent population that these residuals represent (Figure s5B). We found that replacing the F3 site with FRT (‘FRT/F5’) or a modified form containing an additional 14 bp palindromic sequence (‘14bp-FRT/F5’) significantly decreased both the residual expression signal as well as the percentage of cells that continued to aberrantly express EYFP at 5 days post-transfection, while maintaining high expression in the active configuration (co-transfected with Cre alone; Figure s5C).
We next assayed whether this improvement in function at an equimolar Flp:Cre ratio was maintained across other Flp:Cre ratios by comparing our original Con/Foff-EYFP to these two variants and systematically varying the relative amounts of Cre and Flp. Both candidate plasmids maintained their improved expression pattern across a wide range of recombinase ratios (Figure s5D,E-top). Consistent with our hypothesis that residual expression is driven by inefficiency of Flp relative to Cre, ratios of Flp:Cre beyond 1:1 reduced residual expression, while ratios greater than 10:1 contributed marginal improvement as expression neared fitted floor values for both mean expression and fraction of the population with residual expression (R2 mean expression v1 = 0.8028, g = 0.7114, o = 0.6921; R2 fraction with residual expression v1 = 0.2793 g = 0.5848, o = 0.3983). The magnitude of the improvement was equivalent between these two variants (Figure s5D,E-bottom; all p > 0.25 ANOVA with Sidak’s test). Last, we evaluated the performance of these two variants in vivo, in cohorts co-injected with AAV-Con/Foff-EYFP incorporating the functional components of variants v1, g, or o and either AAV-Cre or AAV-Flp-2a-Cre. In vivo performance closely parallel our in vitro observations with both variants g and o outperforming variant v1 and with negligible difference between them (Figure s5F, residual signal relative to v1 p = 0.0009 variant g, p = 0.0008 variant o, ANOVA with Dunnett’s test). As these two variants appeared equivalent in vitro and in vivo, we chose to continue with the FRT/F5-based variant to simplify cloning.
We integrated this improved Flp cassette into all Con/Foff constructs from the comprehensive new intersectional toolbox and compared the original (F3/F5) and improved (FRT/F5) versions (Figure s5G–I) across all tools. As expected, when transfected with Cre alone, we found no significant difference between original and improved versions in either the mean signal or fraction of positive cells (Figure s5G; Con/Foff-EYFP vs Con/Foff-(FRT/F5)-EYFP, mean signal p = 0.46, fraction positive cells p = 0.47, paired t-tests). In contrast, when co-transfected with equimolar amounts of Cre and Flp, the FRT/F5 constructs performed significantly better than their F3/F5 counterparts (Figure s5H; Con/Foff-EYFP vs Con/Foff-(FRT/F5)-EYFP, mean signal p = 0.0069, fraction positive cells p = 0.010, paired t-tests). To assay whether the observed differences were due to changes specific to Flp activity or to overall construct expression, we additionally analyzed the data by normalizing inactive (Cre and Flp) to paired active (Cre alone) data, and found that the consistent improvement seen with FRT/F5 is largely driven by a Flp-dependent reduction in the residual fraction of positive cells (Figure S5I; mean signal p = 0.080, fraction positive cells p = 0.0010). To further assess the function of Con/Foff-(FRT/F5)-EYFP in vivo, we injected AAV-Con/Foff-(FRT/F5)-EYFP into the mPFC and dorsal hippocampus of Ssttm(Cre) (SST-Cre) animals, either alone or with AAV-Flp (Figure s6A–D); four weeks after surgery, we observed robust expression of EYFP when injected alone and extinguished expression when co-injected with Flp that was indistinguishable from un-injected, wild-type controls.
We recommend that Con/Foff experimental designs utilize ratios of Flp:Cre that favor Flp, ideally with a 10:1 ratio, which may be achieved through viral delivery or utilizing Flp transgenic lines with high expression. Our characterization of the Flp cassettes, and the function of the intersectional Con/Foff backbone in particular, illustrate the importance of quantifying and addressing potential off-target expression, as well as provide a practical evaluation framework to enable wider adoption of the intersectional expression platform specifically, and Flp-dependent constructs more generally.
Modeling intersectional virus kinetics in vivo using a novel, spectroscopy device
We next turned our attention to characterizing the in vivo dynamics of intersectional viruses to ask whether recombinase-dependence would change rate of expression in vivo, and to provide guidance on experimental design incorporating intersectional viruses. Expression-kinetics parameters of non-recombinase-dependent AAV8 have been previously characterized by histology (Klein et al., 2006; Reimsnider et al., 2007) showing that expression velocity peaks at 2–3 weeks followed by a plateau. To our knowledge, there has not been a published study thoroughly quantifying the expression time course of commonly employed and/or new optical tools in vivo; this knowledge void could result in heterogeneity among experimental designs employing AAV-delivered molecular tools. Since behavioral experiments are frequently conducted over days to weeks, experimental designs that do not wait for peak viral expression may result in recruitment of changing populations (more or fewer) neurons over time.
To address this data void, we designed (for broad applicability and availability) a robust and inexpensive device for adoption in laboratories across biology (even without infrastructure for microscopy or imaging, requiring only a simple visible-wavelength spectrometer) to track expression dynamics, using off-the-shelf components to assay fluorescence emission from fluorophore expression in vivo (Figure 3A). The relationship between the spectrometer’s tunable integration time and counted photons was verified to be linear for both a fluorescein slide Figure 3B; R2 = 0.9999) and in vivo virally-expressed EYFP (Figure 3C,D; R2 = 0.9999). To assay expression over weeks, we chose to follow measurements across a wide range of integration times to enable sensitivity to low expression (with longer integration times) while maintaining the ability to quantify high expression (with shorter integration times). The resulting expression-score metric (Figure 3E) spanned many orders of magnitude; to pool data across animals, we log-transformed and normalized scores (Figure 3F) to model expression (Figure 3G).
Figure 3. Chronic monitoring of viral expression: equivalent INTRSECT and WT expression kinetics.

A) Expression monitoring device: LED light source fed into a filter cube; visible wavelength spectrometer for emission detection. B) Linear input-output relationship between total counted photons (area under the curve - ‘AUC’) of the band-pass filtered signal and integration time set by spectrometer (R2 = 0.9999); spectrometer absorbance (range 0–1) and absolute photons are shown. C-G) Exemplar data: animal co-injected in mPFC with AAV-Con/Fon-EYFP and AAV-Flp-2a-Cre. (C) Wide range of spectrometer integration times ensures a continuous dynamic range (color) of non-zero and non-saturated (grey) signal from early/weak expression through late/strong expression. D) Linear relationship between AUC and integration time in dynamic range of spectrometer maintained in vivo (colors as in C; R2 = 0.9999). E) Expression score: normalizing AUC to integration time and averaging all expression scores for a given time point within spectrometer dynamic range; the time point from panels C and D is noted (arrow). F) Viral expression kinetics model: fit to y = 1−e^(−bx); y: normalized log expression, x: days; b: rate constant (blue dots: within-animal expression scores, red: expression curve fit, dashed: 95% confidence of fit, b = 0.12715, R2 = 0.9474). G) Chronic viral monitoring does not require components beyond typical optogenetic experiments (here, 200um fiber). H) Comparison of WT EYFP expression vs. all three INTRSECT logical expression variants of EYFP co-injected with indicated recombinase viruses. Note high titers of Cre are initially expressed but cause toxicity over time (Con/Foff-EYFP + Cre-green and orange dots), which would not have been apparent without chronic monitoring. Expression kinetics between INTRSECT and non-INTRSECT EYFP viruses are equivalent (comparison of rate constant b between WT and Con/Fon p = 0.4775, WT and Con/Foff p = 0.7728, WT and Coff/Fon p = 0.1380, n = 6 animals per condition, ANOVA with Dunnett’s test). I) Comparison of in vivo expression of all INTRSECT AAV-EYFP variants co-injected with all combinations of AAV recombinases as assayed by confocal fluorescence (6 wks). No difference between expression of WT EYFP and Con/Fon-EYFP (p = 0.7615, unpaired t-test) or WT EYFP and Con/Foff-EYFP (p = 0.2559, unpaired t-test). Coff/Fon-EYFP expression was lower than WT EYFP (EYFP 2.41 × 10e7 a.u. vs. 8.96 × 10e6 a.u., p = 0.0003, unpaired t-test). See also Figures s5 and s6.
We applied this approach to the three dual-parameter, intersectional logical configurations to characterize expression kinetics and compare with WT EYFP. We prepared cohorts of animals injected with AAV-EF1a viruses delivering EYFP, Con/Fon-EYFP + Flp-2a-Cre, Con/Foff-(FRT/F5)-EYFP + Cre, or Coff/Fon-EYFP + Flp (Figure 3H). Expression of EYFP was measurable two days post-injection and rapidly increased over two weeks, reaching 95% of maximal expression between weeks two and three. Intersectional viruses co-injected with recombinases exhibited similar expression kinetics; expression rate constants for Con/Fon-EYFP, Coff/Fon-EYFP, and Con/Foff-EYFP did not differ significantly from non-recombinase-dependent control EYFP (Figure 3H, column ‘b’; all vs. WT, WT b = 0.1638 +/− 0.01148, Con/Fon b = 0.1392 +/− 0.01372 p = 0.4775, Con/Foff b = 0.1512 +/− 0.005248 p = 0.7728, Coff/Fon b = 0.1197 +/− 0.01678 p = 0.1380, ANOVA with Dunnett’s test, all +/− SEM). We noted a decrease in the fluorescence of Con/Foff-EYFP with high titers of Cre recombinase (after 26 days for 1×10e11 and after 14 days for 1×10e12; Figure 3H), suggesting that high viral expression of Cre was toxic. This toxicity was not observed with Cre at a titer of 1×10e10, or of Flp or Flp-2a-Cre at high titer (1×10e12). Separate cohorts with co-injections of lower titers of Con/Foff-EYFP and Cre at 1×10e12 confirmed that this toxicity was a result of Cre expression, and not intersectional virus toxicity (Figure s6E).
We also evaluated animals injected with either Con/Foff-EYFP + Flp-2a-Cre or Coff/Fon-EYFP + Flp-2a-Cre. In the Coff/Fon-EYFP cohort, we found no transient, off-target expression prior to Cre inactivation of expression, highlighting the utility of chronic viral expression monitoring. In the Con/Foff-EYFP cohort, we found that the time course of low-level off-target expression with approximately equimolar expression of Cre and Flp peaked at approximately two weeks and slowly decayed to approximately 80% of maximum log expression at six weeks (data not shown). Finally, we used the cohort as an opportunity to confirm expression profiles of these intersectional viruses using a sensitive reporter (EYFP) and efficient actuator (viral recombinase). We injected separate control cohorts with EYFP intersectional viruses paired with no recombinase, AAV-Cre, AAV-Flp, or AAV-Flp-2a-Cre. We injected Cre at both 1×10e10 and 1×10e12 titers, to confirm our previous observations of toxicity with high viral Cre titers. As expected, we saw consistent, high expression in all viruses when paired with correct activating recombinases (Figure 3I); it was notable that AAV-Coff/Fon-EYFP expression was lower than control AAV-EYFP at equal viral titers (p = 0.0003, unpaired t-test). As expected, we observed no off-target expression with AAV-Con/Fon-EYFP or AAV-Coff/Fon-EYFP with any combination of viral recombinases, while co-infection of Con/Foff-(FRT/F5)-EYFP with an approximately 1:1 ratio of Flp:Cre using AAV-Flp-2a-Cre exhibited modest residual expression, consistent with prior results (Figure s5D,E). Together these results underscore our recommendation to use increased ratios of Flp:Cre for Con/Foff viruses, while also revealing a wider tolerance of recombinase ratios for other expression logic.
We used these histologic data to further validate the in vivo viral monitoring device by examining the relationship between post-hoc fluorescence and final in vivo spectroscopy expression score, taken at six weeks post-injection (Figure s6F; R2 = 0.5123, p < 0.0001, n = 30 animals, Pearson correlation). Chronic expression profiling in this way may be easily and generally applicable for biological laboratories, and here reveals (at these titers) that recombinase-dependence does not slow viral expression kinetics, that viral expression builds non-linearly and plateaus between the second and third weeks of expression, that intersectional virus expression is maintained for at least six weeks (the longest period examined), and that incorporation of an additional recombinase for next-step three-parameter targeting may be unlikely to slow experimental timelines.
New regime of viral intersectionality: triple recombinase-based targeting
As powerful as two-feature intersectional viruses have been, many meaningfully-defined cellular populations may require targeting by virtue of combinations of several genetic and anatomical parameters (Poulin et al., 2018). For example, known neuronal populations defined by 1) a single genetic feature and 2) multiple axonal-projection features (‘double-projection’ neurons; Jinno, 2009) are of substantial interest, although assessing the functional significance of these populations (as with the vast majority of multiple feature-defined cell types revealed by the ongoing revolution in single-cell sequencing) remains beyond the reach of currently-available molecular targeting approaches.
Although triple-recombinase dependence has not yet been achieved in single viruses, our screening of many recombinases (e.g. VCre, SCre, Dre) for orthogonality to Flp and Cre by assaying expression of single-recombinase-dependent DIO-ChR2-EYFP constructs in flow cytometry led to identification of VCre (Suzuki and Nakayama, 2011) as the most promising potential third recombinase (Fenno et al., 2014). In order to create the desired new dimension of multi-feature intersectional targeting, we therefore tested for generality of this result using cytosolic DIO-EYFP in place of membrane-localized DIO-ChR2-EYFP constructs (Figure 4A). Consistent with our previous results, we observed robust activity of Cre, Flp, Dre, and VCre when transfected along with each respective xDIO-EYFP construct (with less efficient activation exhibited by SCre); however, bi-directional, off-target activity between Cre and Dre was observed as before (Fenno et al., 2014). VCre, in contrast, was orthogonal to all of the tested recombinases (no indication of cross-activity), and thus found to be potentially best-suited for use in parallel with Cre and Flp. To test crucial in vivo functionality, we next generated AAVs for these three recombinases and corresponding xDIO-EYFP constructs, and then separately injected all permutations of these constructs into mouse mPFC (Figure 4B). After four weeks of expression we found robust expression in subjects co-injected with the proper combinations of recombinase/xDIO-EYFP, and no cross-expression in improper pairings, confirming that this combination of three recombinases is suitable for orthogonal use in vivo.
Figure 4. Identifying and validating a recombinase orthogonal to Cre and Flp.

A) Co-transfected HEK293 cells with combinations of recombinase constructs (rows) and recombinase-dependent EYFP constructs (xDIO-EYFP; columns): flow cytometry. Cre and Dre showed bi-directional cross-activity, and some cross-activity noted when Cre was paired with scDIO-EYFP. VCre showed expected robust action on its vcDIO-EYFP partner without any noted in vitro cross-activity. B) AAV-Cre, -Flp, and -VCre show expected robust activity when co-injected with their partner AAV-xDIO-EYFP without cross-activity after 4 wks in mPFC; low (left) or high (right) magnification. Needle track used to identify injection sites in samples without expression. C) rAAV serotypes of Flp and VCre co-injected with respective AAV-xDIO-EYFP in mPFC, while also injecting AAV-xDIO-EYFP into the VTA. After 2 wks (left), sparse EYFP expression was observed in mPFC and VTA, and at 4 wks high levels of expression in both sites (right).
We then sought to create a triple intersectional construct that would only be active in cells that co-express Cre AND Flp AND VCre, but not in cells with any other combination of recombinases (Figure 5A). To achieve this goal, we first leveraged the modular design of INTRSECT to create a hybrid version of our one-intron and two-intron dual-parameter constructs (Figure 1A,D), by inserting two introns into EYFP (Figure 5B). We utilized the engineering pipeline described here (Figure 1G) to iterate through many variants with the introns placed at different locations (Figure 5C), since incorporating multiple introns into EYFP itself was non-trivial and resulted in a high degree of mis-splicing. As expected, splicing efficiency was accurately reflected in EYFP expression levels of HEK293 cells quadruple-transfected with the three recombinases and Con/Fon/VCon-EYFP variants (Figure 5D). Through this iterative approach, we identified a variant with excellent expression (from here on ‘3x-EYFP’). We next performed flow cytometry of HEK293 cells co-transfected with various combinations of recombinases and the triple-dependent INTRSECT (‘Triplesect’) construct and confirmed that expression of 3x-EYFP was limited to cells co-expressing all three recombinases (Figure 5E). We tested the specificity of 3x-EYFP expression in vivo by injecting mPFC of mice with AAV-3x-EYFP and combinations of AAV-recombinases, confirming strong specific expression of this novel Triplesect virus only in cells co-expressing Cre, Flp, and VCre (Figure 5F).
Figure 5. Engineering, optimization, testing, and in vivo function of three-recombinase-dependent Triplesect constructs.

A) Potential intersectional populations available with three-recombinase expression. Cre AND Flp AND VCre intersectional population denoted by central pattern. B) Detailed diagram of EYFP divided into three exons with addition of two introns and recombinase recognition sites (top). The activity of Cre AND Flp AND VCre, reorients exons in the sense direction (middle). Introns are removed during RNA processing (bottom), ending with an intact mRNA encoding EYFP; we labeled this three-recombinase-dependent approach 3x-EYFP. C,D) We generated multiple 3x-EYFP construct variants with different intron placement; variants 1–3 spliced poorly (C), while variant 4 spliced efficiently, as verified by sequencing (bottom); (D) splicing results mirrored by expression patterns in HEK293 cells co-transfected with 3x-EYFP variants and Cre, Flp, and VCre. We therefore used variant 4 going forward. E,F) No expression of 3x-EYFP observed if any of the three recombinases is missing, assayed by flow cytometry of HEK293 cells (E) or in animals injected with 3x-EYFP and recombinases (F; n = 1–2 animals per condition). G-K) 3x engineering approach applied to the calcium sensor GCaMP6m (3x-G6m): similar pattern of proper intron splicing (G) and lack of off-target expression by flow cytometry of HEK293 cells (H; coloring as in E). I) In vitro function of quadruple-transfected (with Cre, Flp, and VCre) neurons expressing 3x-G6m with electrical field stimulation. Population comparison of 3x-G6m vs. WT G6m showed reliable function, albeit with reduced basal fluorescence level (Time-to-peak: 0.3727±0.03938 vs. 0.282±0.01359, p = 0.0045; SNR: 25.01±2.733 vs. 15.72±1.66, p = 0.0080; dF/F: 0.2646±0.03951 vs. 0.0466±0.007635, p < 0.0001; Basal F: 280.6±48.05 vs. 2141±337.2, p < 0.0001; Tau: 1.15±0.1112 vs. 1.736±0.1179, p = 0.0001. 3x-G6m n = 32, WT n = 43, all mean ± S.E.M. Mann-Whitney). J-L) Co-infection of TH-Cre mouse VTA with 3x-G6m and separate viruses encoding Flp and VCre gave rise to robust calcium signals during novel object exploration (J; orange), but not in animals co-infected with 3x-G6m and combinations of only two recombinases did not (green, purple, blue). K) Average Ca2+ signal from traces in J time-locked to onset of novel object exploration (left) show consistent signal from 3x-G6m with all three recombinases, but no signal in two-recombinase controls (total object interactions orange trace = 32, green trace = 27, purple trace = 32, blue trace = 42); (middle) shuffling the bout onset times while maintaining the bout structure in this same trace showed that observed signal was not due to random fluctuation (p <0.01). (right) Average peak signal from traces in K as well as additional three-recombinase-expressing animals (Cre and Flp and VCre active condition vs each two recombinase control p < 0.0001, ANOVA with Dunnett’s test). L) Exemplar slice images (left) and quantification (right) from mice in J: expression of 3x-G6m only (n=3 mice) when all three recombinases are expressed, but not in two-recombinase control mice; Cre and Flp and VCre active condition vs each two-recombinase control p < 0.05, ANOVA with Dunnett’s test; n = 3 sections/mouse, 1 mouse in each of 3 controls, 3 mice in triple-recombinase).
Having created a proof-of-concept, triple-recombinase-dependent EYFP and confirmed its specific, strong expression in vivo, we next asked whether this targeting approach (Triplesect) would be generalizable, and would (for example) allow creation of a 3x-GCaMP6m. As with 3x-EYFP, 3x-GCaMP6m spliced efficiently (Figure 5G) and was only expressed when co-transfected with all three recombinases (Figure 5H). We verified functionality of 3x-GCaMP6m in cultured neurons (Figure 5I); to assess in vivo function and specificity of our 3x expression platform, we next co-injected AAV-3x-GCaMP6m and combinations of recombinases into the VTA of TH-Cre transgenic mice and inserted 400 μm fiberoptic implants to conduct fiber photometry during novel object exploration (Gunaydin et al., 2014). Consistent with our previous Triplesect results (Figure 5F), robust Ca2+ signals were observed in animals coexpressing all three recombinases (Figure 5J-orange), but not in animals expressing only two recombinases (Figure 5J-green, purple, and blue). 3x-GCaMP6m animals expressing all three recombinases showed consistent, time-locked Ca2+ transients beginning immediately prior to periods of novel object exploration, not seen in animals expressing only any two of these recombinases (Figure 5J-blue bars, Figure 5K). Histology (Figure 5L) of 3x-GCaMP6m animals was consistent with the photometry, showing no expression in control subjects but the expected VTA expression pattern in three-recombinase animals. The Triplesect approach and the intron-engineering pipeline described here thus define a generalizable approach to creation and testing of versatile tools for probing cell types with a new dimension of precision and specificity, in vivo and in behaving animals.
Discussion
Experimental capabilities for cell-type-specific delivery of function-testing tools (such as genetically-encoded Ca2+ indicators and microbial opsins) have not kept pace with the insights and opportunities afforded by single-cell transcriptomics and connectomics. As a result, the ongoing revolutions in cellular-resolution molecular phenotyping have remained largely passive and descriptive. In this Resource, we have 1) developed a comprehensive toolbox for precision viral targeting of cells based on dual-parameter logic using a standardized algorithmic engineering pipeline and bringing the total number of INTRSECT viruses to 45, now including a wide array of optically-modulated molecular payloads; 2) demonstrated improved recombinase efficiency for specific logical configurations found through a rational screen utilizing functional criteria; 3) implemented in vivo viral expression-monitoring hardware suitable for widespread use in biology laboratories; and 4) described the first triple-parameter viral targeting logic through creation of Triplesect.
The intersectional pipeline
In creating the pipeline, we sought to deliver intersectionally-targetable tools (Fenno et al., 2011, 2014) covering a wide range of actuation wavelengths, biophysical mechanisms, and temporal kinetics, including fluorophores ranging from blue to red, multiple excitatory opsins paired with different fluorophores, a range of inhibitory opsins, and Ca2+ indicators with different excitation wavelengths and temporal dynamics. The engineering pipeline was designed to reveal flaws early (including minor splice variants and inefficiency of Flp relative to Cre; Figures 2,s5) and ensure that each tool would function appropriately. In the work reported here, splice variants were either corrected or, where persistent, demonstrated to exert no adverse effects on function.
Relative inefficiency of Flp constrains utility of all combinatorial systems using Flp, motivating our substantial effort to screen for and improve Flp-dependent components of the intersectional backbone (complementing previous work to improve function of Flp recombinase itself; Buchholz et al., 1998; Raymond and Soriano, 2007). While this screen yielded an approximate 20% improvement in Flp efficiency in the FRT/F5-based constructs compared to our initial design, it is likely that more efficient Flp-responsive elements (e.g. FRT sequence variants) or improved Flp recombinase variants may be developed in the future to further expand the utility of the intersectional virus approach. Additional approaches not yet tested include decreasing efficiency of Cre (possibly through the use of less-efficient lox sequence variants to match the recombination kinetics of the two recombinases; Leonie Ringrose et al., 1998), and incorporating novel recombinase recognition sites that are less prone to spontaneous recombination (Fischer et al., 2019).
Ongoing within-mouse expression-tracking in vivo
The known difference in efficiency between recombinases motivated our development of a robust device that could be used broadly across biological laboratories, including groups not specialized in optical methodologies. To test if factors such as recombinase-dependence of intersectional tools or variable recombinase efficiency changed rate of payload expression in vivo, we developed a novel, inexpensive fiberoptic device for chronic expression monitoring, using off-the-shelf commercially-available components. More complex larger-fiber neuroscience-specialized systems (e.g. fiber photometry hardware; Gunaydin et al., 2014) could acquire similar data, however, the system described here is likely to be more broadly useful across biological systems spanning organisms and tissues, and will be generally useful for screening experimental subjects prior to behavioral experiment to assay steady-state expression, proper interventional (optogenetic) fiber placement, and/or virus efficacy (especially in unique and valuable individual subjects such as non-human primates; Diester et al., 2011).
Our findings that both recombinase- and non-recombinase-dependent AAV8 expression tracked previous histology-based expression profiling (Klein et al., 2006; Reimsnider et al., 2007) both validated this approach and provided useful quantitative new-tool characterization. Importantly, recombinase-dependence of the intersectional tools at these viral titers was found to not slow expression in vivo. Additional characterization of other serotypes, payloads, and titers will further build knowledge of critical (and generally unknown) parameters of viral expression in organs and species across biology.
Triplesect
To extend targeting resolution to three-parameter-dependence, VCre (Suzuki and Nakayama, 2011) was chosen over other tested recombinases for superior orthogonality to Cre and Flp in multiple expression platforms, with multiple payloads, and as evaluated with two separate assays for cross-expression (one in vitro and the other in vivo); bi-directional cross-activity of Dre (with Cre), as well as poor efficiency of SCre, were consistent with prior work (Weinberg et al., 2017). Here the demonstration of three-recombinase-dependent viral expression (Triplesect) marks a new level of viral targeting specificity (in vitro or in vivo); going forward, additional recombinase/recombination sites, including Nigri/nox and Panto/pox (Karimova et al., 2016), may show promise as potential additional orthogonal recombinases for complementary targeting approaches.
Animal platforms for intersectional biology
Triplesect and the intersectional tool set leverage the expanding availability of Flp recombinase and other transgenic mouse lines (Daigle et al., 2018; Karimova et al., 2018; Madisen et al., 2015; Plummer et al., 2015). From an experimental design perspective, single virus targeting offers multiple advantages over the use of multiply-crossed, intersectional transgenics. First, viruses are restricted in both time and space, avoiding potential off-target expression due to transient gene expression during development and allowing for expression only within specified anatomic regions of interest (Poulin et al., 2018). In addition, viruses also afford the opportunity for simultaneous expression of multiple intersectionally-expressed, molecular tools in the same anatomic space for co-labeling – an approach that would generally require a prohibitive animal husbandry effort to replicate with a purely transgenic approach. Last, the viral tools provide a vast increase in resource efficiency, as the dissociation of cell-targeting and molecular tool identity allows a single recombinase-expressing transgenic mouse line to be paired with an unlimited variety of virally-delivered tools.
The intersectional viruses described here are designed to be integrated with any combination of molecular tool and recombinase expression. However, one limitation in fully integrating the diversity of Flp-expressing animal lines with intersectional tools is the lack of a centralized database of these animal lines. To facilitate a wide range of two-parameter (e.g. Cre/Flp double transgenic) and three parameter Triplesect experimental designs (e.g. Cre/Flp double transgenics with additional recombinases delivered by local or retrograde virus; Figure 4C)), we have created such a database (Table 1). We searched academic publications, commercial mouse repositories, and publicly-funded transgenic efforts to inventory the currently-reported and still-unpublished Flp-expressing mouse lines. We identified 60 mouse lines that represent a total of 47 separate genetic drivers and one transgenic rat line. Of these, five different lines have already been used experimentally with INTRSECT viruses. To ensure the ongoing usefulness of this resource, we created a web-based version that includes the ability for researchers to submit data: www.optogenetics.org/flp_lines.html.
Table 1. Transgenic Flp mouse lines for intersectional biology.
Transgenic lines were located using a range of search methods. Lines no longer maintained are included for completeness.
| Driver | Flp Gene | Genetics | Source | Original Citation | INTRSECT Citation |
|---|---|---|---|---|---|
| Actb | FlpE | A | Jackson: 003800 | Rodriguez et al., 2000 | |
| Atoh1 | FlpO-ER | A | joynera@mskcc.org | Wojcinski et al., 2019 | |
| Bhlhe22 | FlpO | C | saross@pitt.edu | Cai et al., 2016 | |
| Cag | FlpE | A | RBRC: 10707, 10708 | Kanki et al., 2006 | |
| Cag | FlpE-ER | A | No longer maintained | Hunter et al., 2005 | |
| CamK2a | FlpE | Taconic - Not available | |||
| Cdx2 | FlpO | A | Jackson: 030288 | Abraira et al., 2017 | |
| Cdx2 | FlpO | A | goulding@salk.edu | Britz et al., 2015 | |
| Crh | FlpO | D | Jackson: 031559 | Unpublished | |
| DbH | FlpO | C | Jackson: 033952 | Robertson et al., 2013 | |
| DbH | FlpO | C | MMRRC: 41577 | Sun and Ray, 2016 | |
| DbH | FlpO | E | MMRRC: 41575 | Sun and Ray, 2016 | |
| Dlx5/6 | Myc-FlpE | A | Jackson: 010815 | Miyoshi et al., 2010 | Wick et al., 2019 |
| EF1A | Flp | A | RBRC: 01251, 01252 | Takeuchi et al., 2002 | |
| Fezf2 | FlpO | E | huangj@cshl.edu | Unpublished | |
| Gad2 | FlpO | D | hantmana@janelia.hhmi.org | Alhadeff et al., 2018 | |
| GFAP | FlpO | A | Jackson: 33116 | Hara and Verma, 2019 | |
| Gsh2 | FlpE | D | CARD: 2114 | Unpublished | |
| Hcrt | FlpO | E | yamank@riem.nagoya-u.ac.jp | Chowdhury et al., 2019 | |
| Hoxb8 | FlpO | A | EMMA: 11094 | Zhang et al., 2018 | |
| Htr3a | FlpO | D | Jackson: 030755 | Schuman et al., 2019 | |
| Lbx1 | FlpO | C | goulding@salk.edu | Bourane et al., 2015 | |
| mGluR6 | FlpO | A | RBRC: 09715 | Unpublished | |
| MMTV | FlpO | A | gerhard.christofori@unibas.ch | Lüönd et al., 2019 | |
| Mrgprb4 | EGFP-2aFlpO | F | Jackson: 021078 | Vrontou et al., 2013 | |
| Nestin | FlpO-ER | A | joynera@mskcc.org | Lao et al., 2012 | |
| Nkx2.1 | FlpO | D | Jackson: 28577 | He et al., 2016 | |
| Nphs1 | FlpO | A | minerj@wustl.edu | Goldberg et al., 2010 | |
| Npy | FlpO | D | Jackson: 030211 | Daigle et al., 2018 | |
| Pdx1 | FlpO | A | dieter.saur@tum.de | Schönhuber et al., 2014 | |
| Pdx1 | FlpO | C | ostrowsk@musc.edu | Wu et al., 2017 | |
| Pet1 | FlpE | A | dymecki@genetics.med.harvard.edu | Jensen et al., 2008 | |
| Pgk1 | FlpO | A | Jackson: 011065 | Wu et al., 2009 | |
| Phox2b | FlpO | B | Jackson: 022407 | Hirsch et al., 2013 | |
| Prkcd | FlpO | E | bli@cshl.edu | Unpublished | |
| PlexinD1 | FlpO | E | huangj@cshl.edu | Unpublished | |
| Plxnd1 | dgFlpO | D | tanyad@alleninstitute.org | Daigle et al., 2018 | |
| Pomc | FlpE | A | No longer maintained | Vooijs et al., 1998 | |
| Pvalb | FlpE | E | Jackson: 021191 | Madisen et al., 2015 | |
| Pvalb | FlpO | E | Jackson: 022730 | Madisen et al., 2015 | Hafner et al., 2019 |
| Pvalb* | FlpO | E | joshua.berke@ucsf.edu | Unpublished | |
| Rasgrf2 | dgFlpO | E | Jackson: 029589 | Daigle et al., 2018 | |
| Rorb | FlpO | D | Jackson: 029590 | Daigle et al., 2018 | |
| Rorb | FlpO | E | tanyad@alleninstitute.org | Daigle et al., 2018 | |
| Slc17a6 | FlpO | D | Jackson: 030212 | Daigle et al., 2018 | |
| Slc32a1 | FlpO | D | Jackson: 031331 | Daigle et al., 2018 | |
| Slc32a1 | FlpO | E | Jackson: 029591 | Daigle et al., 2018 | Lazaridis et al., 2019 |
| Slc6a3 | FlpO | D | Jackson: 033673 | Unpublished | |
| Slc6a4 | FlpO | D | Jackson: 033674 | Unpublished | |
| SST | FlpO | D | Jackson: 028579 | He et al., 2016 | Clemente et al., 2017 Cummings et al., 2020 Fadok et al., 2017 Fenno et al., 2014 Yu et al., 2017 |
| Tbr2 | FlpO-ER | E | huangj@cshl.edu | Unpublished | |
| Tbx21 | FlpE-ER | D | Graham.lord@manchester.ac.uk | Gökmen et al., 2013 | |
| TH | FlpO | E | MMRRC: 50618 | Poulin et al., 2018 | Chuhma et al., 2018 Poulin et al., 2018 Mingote et al., 2019 |
| TH | FlpO | A | RBRC: 5168–5171 | Imayoshi et al., 2012 | |
| Trf | FlpE | Taconic - Not available | |||
| Tshz1 | FlpO | E | bli@cshl.edu | Unpublished | |
| VGlut2 | FlpO | D | hantmana@janelia.hhmi.org | Alhadeff et al., 2018 | |
| VIP | FlpO | D | Jackson: 028578 | He et al., 2016 | |
| Wnt1 | Flp(F70L) | A | No longer maintained | Dymecki et al., 1998 | |
| Wnt1 | FlpE-ER | A | No longer maintained | Hunter et al., 2005 | |
| Wnt1 | FlpE | A | dymecki@genetics.med.harvard.edu | Awatramani et al., 2003 |
Any reference to contact individuals was approved. Online version with functionality to add lines is maintained at www.optogenetics.org/flp_lines.html.
transgenic rat line. A: Random Integration; B: BAC transgenic; C: START knock-in; D: IRES knock-in; E: 2a knock-in; F: 2a knock-in/driver knock-out. Jackson: Jackson Laboratory, http://www.jax.org; RBRC: Riken BioResource Research Center, https://mus.brc.riken.jp/en/; MMRRC: Mutant Mouse Resource & Research Centers, https://www.mmrrc.org; CARD: Center for Animal Resources and Development, http://cardb.cc.kumamoto-u.ac.jp/transgenic/index.jsp; EMMA: European Mouse Mutant Archive, https://www.infrafrontier.eu/
General considerations in experimental design with intersectional viruses
AAV has become the standard for gene transduction in vivo, including in neuroscience, due to relative safety of the DNA genome, with ease of production and engineering. A feature of AAVs salient to experimental design is viral tropism--the ability of viruses to transduce a subset of cells based on the expression of a viral receptor specific to viral serotype--here referring to the capsid protein that interacts with the receptor. AAVs are now routinely produced in a number of serotypes; throughout this study we used AAV8 and a synthetic retro-AAV (evolved to transduce axon terminals, Tervo et al., 2016). The identity of cells infected by a particular AAV is affected by AAV serotype (Aschauer et al., 2013; Burger et al., 2004; Davidson et al., 2000), developmental timepoint (Chakrabarty et al., 2013), animal strain (Hordeaux et al., 2018), and viral titer (Nathanson et al., 2009). Despite the critical role that AAVs play in modern biology, a broad accounting of cell-subtype transducibility influenced by these parameters has not been described, although it is conceivable that this information may be extracted (Cristinelli and Ciuffi, 2018) from existing transcriptome datasets (Ecker et al., 2017) utilizing a combination of AAV transduction and single cell RNA-seq.
For both viral and transgenic intersectional approaches, imperfections in reagents (e.g. specificity and sensitivity of recombinase expression, an important consideration even between separate knock-in animal lines encoding the same transgene at the same locus; Madisen et al., 2010) are multiplicative, and independent knowledge that the selected viral tropism and recombinase expression pattern appropriately recruit the sub-population of interest is critical. Control experiments co-injecting viruses that require only Cre or only Flp to be activated, and assaying the expression pattern by histological evaluation, is one way to obtain this critical validation. Note that characterization of recombinase expression patterns using only antibody or in situ data on the recombinase itself will not give information about viral transducibility, but still serve as important complementary controls. Understanding and characterizing the limitations of these (and any other) tools is a critical component of successful experimental design and interpretation. Here, we have worked to describe the function of the intersectional toolbox using a variety of platforms, both in vitro and in vivo. To assist users in designing experiments and important controls to consider, we maintain a freely-available resource (www.optogenetics.org/intrsect_sop.pdf) updated in response to feedback from the community, that also describes common pitfalls that we and others have experienced in scaling and implementing recombinase-based systems (Figure 2H).
Further extending the precision with which biologists are able to functionally interrogate cell populations is critical, and becoming more important as the field progresses. Going forward, strategies such as iterative improvement of Con/Foff constructs, incorporation of additional molecular tools (Hafner et al., 2019; Platt et al., 2014; Villette et al., 2019), and extension to multiple-recombinase-dependent RNA polymerase III (Ventura et al., 2004; Yu and P, 2006) expression will continue to push boundaries of intersectional experimental design. In this way, our rapidly-advancing ability to describe cell types through multi-modal data streams integrating single-cell gene expression with developmental (Asp et al., 2019; Petropoulos et al., 2016), anatomical (Codeluppi et al., 2018; Satija et al., 2015), sub-cellular (Chen et al., 2015) and three-dimensional architectural (Wang et al., 2018) features at high resolution may become accompanied by improved capability to investigate functional relevance of these cell types to health or disease in living systems.
STAR Methods
Resource Availability
Lead contact
All reagents detailed in this manuscript are freely available for academic use from the Deisseroth Lab (http://www.optogenetics.org/sequence_info.html) and via the Lead Contact (Karl Deisseroth; deissero@stanford.edu).
Materials Availability
Most plasmids and viruses are also available through AddGene (http://www.addgene.com; see Key Resources) and/or the Stanford Viral Vector Core (https://neuroscience.stanford.edu/research/programs/community-labs/neuroscience-gene-vector-and-virus-core). The Flp mouse line database is maintained by the Deisseroth Lab (http://www.optogenetics.org/flp_lines.html). A standard operating procedure for INTRSECT reagents is also available (https://web.stanford.edu/group/dlab/optogenetics/intrsect_sop.pdf).
KEY RESOURCES TABLE
| REAGENT or RESOURCE | SOURCE | IDENTIFIER |
|---|---|---|
| Bacterial and Virus Strains | ||
| One Shot Stbl3 e-coli | ThermoFisher | Cat# C737303 |
| Adeno-Associated Virus Coat Protein 2/8 | Stanford GVVC | AAV8 |
| Adeno-Associated Virus Coat Protein 2/retro | Stanford GVVC | AAV-retro |
| pAAV-EF1a-FlpO-p2a-Cre | This Paper | Stanford GVVC AAV8 |
| pAAV-EF1a-FlpO | Fenno et al. 2014 | Stanford GVVC AAV8 |
| pAAV-EF1a-FlpO | Fenno et al. 2014 | Stanford GVVC AAV-retro |
| pAAV-EF1a-Cre | Fenno et al. 2014 | Stanford GVVC AAV8 |
| pAAV-EF1a-VCre | Fenno et al. 2014 | Stanford GVVC AAV8 |
| pAAV-EF1a-VCre | Fenno et al. 2014 | Stanford GVVC AAV-retro |
| pAAV-cDIO-EYFP | Fenno et al. 2014 | Stanford GVVC AAV8 |
| pAAV-fDIO-EYFP | Fenno et al. 2014 | Stanford GVVC AAV8 |
| pAAV-vcDIO-EYFP | Fenno et al. 2014 | Stanford GVVC AAV8 |
| pAAV-Ef1a-EYFP | This paper | Stanford GVVC AAV8 |
| pAAV-Ef1a-Con/Fon-EYFP | Fenno et al. 2014 | Stanford GVVC AAV8 |
| pAAV-Ef1a-Con/Foff-EYFP | Fenno et al. 2014 | Stanford GVVC AAV8 |
| pAAV-Ef1a-Coff/Fon-EYFP | Fenno et al. 2014 | Stanford GVVC AAV8 |
| pAAV-Ef1a-Con/Foff 2.0-EYFP | This Paper | Stanford GVVC AAV8 |
| pAAV-nEF-3x-EYFP | This Paper | Addgene Cat# 137163 |
| pAAV-Ef1a-3x-GCaMP6M | This Paper | Addgene Cat# 137164 |
| Chemicals, Peptides, and Recombinant Proteins | ||
| AP-V | Tocris | Cat# 0106 |
| CNQX | Tocris | Cat# 0190 |
| Fluorodeoxyuridine (FUDR) | Sigma | Cat# F0503 |
| Lipofectamine 2000 | ThermoFisher | Cat# 11668027 |
| Propidium Iodide | Sigma | Cat# P4170 |
| RNeasy Mini Kit | Qiagen | Cat # 74106 |
| SuperScript III One-Step RT-PCR System | ThermoFisher | Cat # 12574026 |
| Tetrodotoxin | Tocris | Cat #1078 |
| Experimental Models: Cell Lines | ||
| Rat Hippocampal Primary Neurons | Derived In-House | N/A |
| HEK293 Cells | ThermoFisher Scientific | Cat # R70007 |
| Experimental Models: Organisms/Strains | ||
| WT C57/BL6 mice | Jackson Laboratories | Cat# 000664 |
| SST-Cre C57/BL6 transgenic mice | Jackson Laboratories | Cat# 013044 |
| Sprague-Dawley rat pups | Charles River | n/a |
| Oligonucleotides | ||
| See Table S1 | ||
| Recombinant DNA | ||
| pAAV-EF1a-Con/Fon-GCaMP6M | This Paper | Addgene Cat# 137119 |
| pAAV-Ef1a-Con/Foff-GCaMP6M | This Paper | N/A |
| pAAV-Ef1a-Con/Foff 2.0-GCaMP6M | This Paper | Addgene Cat# 137120 |
| pAAV-Ef1a-Coff/Fon-GCaMP6M | This Paper | Addgene Cat# 137121 |
| pAAV-Ef1a-Con/Fon-GCaMP6F | This Paper | Addgene Cat# 137122 |
| pAAV-Ef1a-Con/Foff-GCaMP6F | This Paper | N/A |
| pAAV-Ef1a-Con/Foff 2.0-GCaMP6F | This Paper | Addgene Cat# 137123 |
| pAAV-Ef1a-Coff/Fon-GCaMP6F | This Paper | Addgene Cat# 137124 |
| pAAV-Ef1a-sRGECO | This Paper | Addgene Cat# 137125 |
| pAAV-Ef1a-Con/Fon-sRGECO | This Paper | Addgene Cat# 137126 |
| pAAV-Ef1a-Con/Foff-sRGECO | This Paper | N/A |
| pAAV-Ef1a-Con/Foff 2.0-sRGECO | This Paper | Addgene Cat# 137127 |
| pAAV-Ef1a-Coff/Fon-sRGECO | This Paper | Addgene Cat# 137128 |
| pAAV-Ef1a-Con/Fon-BFP | This Paper | Addgene Cat# 137129 |
| pAAV-Ef1a-Con/Foff-BFP | This Paper | N/A |
| pAAV-Ef1a-Con/Foff 2.0-BFP | This Paper | Addgene Cat# 137130 |
| pAAV-Ef1a-Coff/Fon-BFP | This Paper | Addgene Cat# 137131 |
| pAAV-Ef1a-Con/Fon-mCherry | This Paper | Addgene Cat# 137132 |
| pAAV-Ef1a-Con/Foff-mCherry | This Paper | N/A |
| pAAV-Ef1a-Con/Foff 2.0-mCherry | This Paper | Addgene Cat# 137133 |
| pAAV-Ef1a-Coff/Fon-mCherry | This Paper | Addgene Cat# 137134 |
| pAAV-Ef1a-oScarlet | This Paper | Addgene Cat# 137135 |
| pAAV-Ef1a-Con/Fon-oScarlet | This Paper | Addgene Cat# 137136 |
| pAAV-Ef1a-Con/Foff-oScarlet | This Paper | N/A |
| pAAV-Ef1a-Con/Foff 2.0-oScarlet | This Paper | Addgene Cat# 137137 |
| pAAV-Ef1a-Coff/Fon-oScarlet | This Paper | Addgene Cat# 137138 |
| pAAV-nEF-Con/Fon-ChR2(ET/TC)-EYFP | This Paper | Addgene Cat# 137139 |
| pAAV-nEF-Con/Foff-ChR2(ET/TC)-EYFP | This Paper | N/A |
| pAAV-nEF-Con/Foff 2.0-ChR2(ET/TC)-EYFP | This Paper | Addgene Cat# 137140 |
| pAAV-nEF-Coff/Fon-ChR2(ET/TC)-EYFP | This Paper | Addgene Cat# 137141 |
| pAAV-nEF-Con/Fon-ChR2-mCherry | This Paper | Addgene Cat# 137142 |
| pAAV-nEF-Con/Foff-ChR2-mCherry | This Paper | N/A |
| pAAV-nEF-Con/Foff 2.0-ChR2-mCherry | This Paper | Addgene Cat# 137143 |
| pAAV-nEF-Coff/Fon-ChR2-mCherry | This Paper | Addgene Cat# 137144 |
| pAAV-nEF-Con/Fon-bREACHes-EYFP | This Paper | Addgene Cat# 137145 |
| pAAV-nEF-Con/Foff-bREACHes-EYFP | This Paper | N/A |
| pAAV-nEF-Con/Foff 2.0-bREACHes-EYFP | This Paper | Addgene Cat# 137146 |
| pAAV-nEF-Coff/Fon-bREACHes-EYFP | This Paper | Addgene Cat# 137147 |
| pAAV-nEF-Con/Fon-Arch3.3-p2a-EYFP | This Paper | Addgene Cat# 137148 |
| pAAV-nEF-Con/Foff-Arch3.3-EYFP | This Paper | N/A |
| pAAV-nEF-Con/Foff 2.0-Arch3.3-EYFP | This Paper | Addgene Cat# 137149 |
| pAAV-nEF-Coff/Fon-Arch3.3-p2a-EYFP | This Paper | Addgene Cat# 137150 |
| pAAV-nEF-NpHR3.3-EYFP | This Paper | Addgene Cat# 137151 |
| pAAV-nEF-Con/Fon-NpHR3.3-EYFP | This Paper | Addgene Cat# 137152 |
| pAAV-nEF-Con/Foff-NpHR3.3-EYFP | This Paper | N/A |
| pAAV-nEF-Con/Foff 2.0-NpHR3.3-EYFP | This Paper | Addgene Cat# 137153 |
| pAAV-nEF-Coff/Fon-NpHR3.3-EYFP | This Paper | Addgene Cat# 137154 |
| pAAV-nEF-Con/Fon-iC++-EYFP | This Paper | Addgene Cat# 137155 |
| pAAV-nEF-Con/Foff-iC++-EYFP | This Paper | N/A |
| pAAV-nEF-Con/Foff 2.0-iC++-EYFP | This Paper | Addgene Cat# 137156 |
| pAAV-nEF-Coff/Fon-iC++-EYFP | This Paper | Addgene Cat# 137157 |
| pAAV-nEF-ChRmine-mScarlet | This Paper | Addgene Cat# 137158 |
| pAAV-nEF-Con/Fon-ChRmine-oScarlet | This Paper | Addgene Cat# 137159 |
| pAAV-nEF-Coff/Fon-ChRmine-oScarlet | This Paper | Addgene Cat# 137160 |
| pAAV-nEF-Con/Foff-ChRmine-oScarlet | This Paper | N/A |
| pAAV-nEF-Con/Foff 2.0-ChRmine-oScarlet | This Paper | Addgene Cat# 137161 |
| pAAV-Ef1a-Con/Foff 2.0-EYFP | This Paper | Addgene Cat# 137162 |
| pAAV-nEF-Con/Foff 2.0-ChR2-EYFP | This Paper | Addgene Cat# 137163 |
| pAAV-nEF-3x-EYFP | This Paper | Addgene Cat# 137164 |
| pAAV-Ef1a-3x-GCaMP6M | This Paper | Addgene Cat# 137165 |
| Software and Algorithms | ||
| ImageJ | NIH | https://imagej.nih.gov/ij/ |
| SnapGene | GSL Biotech LLC | http://www.snapgene.com |
| FlowJo | Flowjo | flowjo.com |
| Pymol | Schrodinger | https://www.pymol.org/2/ |
| Netgene2 splicing algorithm | DTU Bioinformatics | http://www.cbs.dtu.dk/services/NetGene2/ |
| Matlab | MathWorks | https://www.mathworks.com/products/matlab.html |
| Metamorph | Molecular Devices | moleculardevices.com |
| pClamp 10.6 | Molecular Devices | moleculardevices.com |
| CueMol: Molecular Visualization Framework | Cuemol | http://www.cuemol.org/ |
| Other | ||
| MultiClamp700B Amplifier | Molecular Devices | moleculardevices.com |
| DigiData 1440A | Molecular Devices | moleculardevices.com |
| DM-LFSA | Leica | |
| Power meter | Thorlabs | PM100D |
| 200 um implants | Doric | MFC_200/245–0.53_3.5mm_MF2.5_FLT |
| 400 um implants | Doric | MFC_400/430–0.66_15mm_MF2.5_FLT (cut to length) |
| DxP FACSCAN | Becton Dickinson | bdbiosciences.com |
| SPECTRA-X Light Engine | Lumencor | lumencor.com |
| 3D-printed well insert | This Paper | Protolabs.com |
| Compact CCD Spectrometer | Thorlabs | CCS100 |
| Fiber Bundle | Thorlabs | BFL200LS02 |
| Reflective Collimator | Thorlabs | RC04SMA-P01 |
| Zoom Lens Tube | Thorlabs | SM1NR05 |
| Lens | Edmund Optics | #62–561 |
| Filter Holder | Thorlabs | CFH2 |
| Lens Tube Coupler | Thorlabs | Sm1T20 |
| Kinematic Dichroic Filter Mount, 30mm | Thorlabs | DFM1 |
| End Cap | Thorlabs | SM1CP2 |
| Sm1 Threaded Adapter | Thorlabs | AD12F |
| Fixed Focus Collimator | Thorlabs | F240FC-A |
| SM1 coupler | Thorlabs | SM1NT |
| Multimode Fiber Optic Patch Cable (FCPC to SMA) | Thorlabs | m76L01 |
| LED Controller | Thorlabs | LEDD1B |
| Fiber-Coupled LED | Thorlabs | M505F1 |
| Excitation Bandpass Filter | Thorlabs | MF497–16 |
| Dichroic | Chroma | T525LPXR |
| Emission Bandpass Filter | Thorlabs | MF535–22 |
Data and Code Availability
No stand-alone code was generated for this project, however, MatLab code available upon request from lead contact.
Experimental Model and Subject Details
Animals
Adult (at least 8 weeks of age) wild-type female and transgenic Ssttm(Cre) (somatostatin-IRES-Cre; Jax 013044; RRID:IMSR_JAX:013044) mice were group housed up to four to a cage and kept on a reverse 12-h light/dark cycle with ad libitum food and water. Experimental protocols were approved by and conform to Stanford University IACUC and meet guidelines of the US National Institutes of Health guide for the Care and Use of Laboratory Animals. See Key Resources Table for specific transgenic animal strain information.
Flp Line Database
To locate transgenic, Flp-expressing mouse lines, the following websites were searched using the term ‘Flp’ (with the exception of Google Scholar, where the term ‘Flp driver mouse line’ was used) in September, 2018 and November, 2019, and the results were manually assessed.
The initial publications describing the production of the lines were assessed for the construction method, promoter, and Flp variant. In cases where animals located in publications were not found in available repositories or when animal lines in repositories were not found in publications, the corresponding author or listed depositor was directly contacted for more information and for direction in how other researchers can acquire the lines.
Primary Neuronal Cell Cultures
Primary cultured hippocampal neurons were prepared from P0 Sprague-Dawley rat pups (Charles River). CA1 and CA3 from entire litters (male and female pups) were isolated, digested with 0.4 mg ml−1 papain (Worthington), and plated onto glass coverslips precoated with 1:30 Matrigel (Becton Dickinson Labware). Cultures were maintained in a 5% CO2 humid incubator with Neurobasal-A media (Thermo Fisher) containing 1.25% FBS (HyClone), 4% B-27 supplement (Gibco), 2 mM Glutamax (Gibco) and 2 mg/ml fluorodeoxyuridine (FUDR, Sigma), and grown on coverslips in a 24-well plate at a density of 65,000 cells per well.
HEK293 Cell Cultures
HEK293FT cells (Thermo Fisher) were maintained in a 5% CO2 humid incubator with DMEM media (GIBCO) supplemented with 10% FBS (Invitrogen), 1% Glutamax (Invitrogen), and 1x Penicillin-Streptomycin (Invitrogen). They were enzymatically passaged at 90% confluence by trypsinization.
Method Details
Molecular cloning
All single recombinase-dependent plasmids were constructed in an AAV-Ef1α backbone using the double-floxed inverted open-reading-frame (DIO) strategy described previously (Atasoy et al., 2008; Sohal et al., 2009); briefly, the ORF is in the reverse complement orientation between two cassettes of recombinase recognition sites. See the Key Resources Table for information specific to the Cre-dependent (cDIO), Flp-dependent (fDIO) vCre-dependent (vcDIO), Dre-dependent (dDIO), and sCre-dependent (scDIO) iterations. dDIO rox cassette was previously described (Fenno et al., 2014). This, and all constructs used in this paper, contain the woodchuck hepatitis virus post-transcriptional regulatory element (WPRE) to enhance expression.
A series of recombinase-expression plasmids were used, as detailed in the Key Resources Table. All recombinase expression plasmids were constructed in an AAV-EF1α backbone. These were made as fluorophore-expressing, bicistronic plamids (using an internal ribosomal entry site or p2a sequence), or without any visual marker, as indicated in the text and figures. FlpO (Raymond and Soriano, 2007) was used for Flp-dependent expression.
Mutations to NpHR, jRGECO1a, and mScarlett were introduced via overlapping PCR with primers containing the mutation. The NpHR W179F mutation was chosen from amino acids more than 8 angstroms away from the retinal binding pocket / ion-pumping pathway by analyzing the crystal structure of NpHR (PDB ID: 3A7K; Kouyama et al., 2010). The jRGECO1a (Dana et al., 2016) mutation E217D and the mScarlett (Bindels et al., 2017) mutation E95D was chosen to improve functional expression by interrupting a lysosomal import motif (Piccirillo et al., 2006). jRGECO1a, sRGECO, mScarlet, and oScarlet inclusion quantification was performed by viral infection (jRGECO1a and sRGECO) or calcium-phosphate transfection (mScarlet and oScarlet) of primary neuron cultures, followed by 4% PFA fixation, mounting, imaging on a confocal, and blinded manual analysis with randomly shuffled and anonymized image labeling.
Tools noted to be ‘3.3’ versions (NpHR, ChRmine, and Arch) include the addition of endoplasmic reticulum and membrane trafficking motifs previously described (Gradinaru et al., 2010), as well as the addition of a p2a bicistronic expression sequence that allows for independent translation of opsin and fluorophore from a single mRNA transcript.
INTRSECT constructs were produced with either one intron (for single ORF, two-recombinase-dependent tools), two introns (for double ORF, two-recombinase-dependent tools), or two introns (for single ORF, three-recombinase-dependent tools).
Single ORF, two-recombinase-dependent INTRSECT plasmids were constructed by splitting the reading frame into two pieces (referred to as ‘exon 1’ and ‘exon 2’) after being analyzed for naturally occurring splice-site-like sequences using a public bioinformatics tool (http://www.cbs.dtu.dk/services/NetGene2/; Brunak et al., 1991), designed as possible to have the splice site disrupt the reading frame to decrease the chance of partial protein synthesis from exon 2 in the absence of the pre-defined expression criteria. A derivative of the mouse IgE intron 3 (Fenno et al., 2014) containing a cDIO cassette and fDIO cassette was inserted between the exons, with the donor and acceptor sites fused directly to the 3’ terminus of exon 1 and 5’ terminus of exon 2, respectively. A separate cDIO cassette was added directly after the promoter (5’ to the entire coding sequence) and a fDIO cassette was added directly before the WPRE (3’ to the entire coding sequence). To create Con/Fon constructs, both exons are in the reverse complement orientation. To create Con/Foff constructs, exon 1 is in the reverse complement orientation and exon 2 is in the sense direction. To create Coff/Fon constructs, exon 1 is in the sense direction and exon 2 is in the reverse complement orientation. All of these plasmids are constructed in an AAV-EF1α backbone with a 3’ WPRE and are detailed in the Key Resources Table.
Double ORF, two-recombinase-dependent INTRSECT plasmids were constructed by splitting the reading frame into three pieces (referred to as ‘exon 1’, ‘exon 2’, and ‘exon 3’) after being analyzed for naturally occurring splice-site-like sequences using a public bioinformatics tool (http://www.cbs.dtu.dk/services/NetGene2/; Brunak et al., 1991) and choosing a splice site in each of the reading frames, designed as possible to have the splice sites disrupt the reading frame to decrease the chance of partial protein synthesis from exon 2 or exon 3 in the absence of the pre-defined expression criteria. A derivative of the CMV Towne Variant intron B (Fenno et al., 2014) containing a cDIO cassette was inserted between exon 1 and exon 2, with the donor and acceptor sites fused directly to the 3’ terminus of exon 1 and 5’ terminus of exon 2, respectively. A derivative of the mouse IgE intron 3 (Fenno et al., 2014) containing a cDIO cassette was inserted between exon 2 and exon 3, with the donor and acceptor sites fused directly to the 3’ terminus of exon 2 and 5’ terminus of exon 3, respectively. Separate fDIO cassettes were added directly after the promoter (5’ to the entire coding sequence) and directly before the WPRE (3’ to the entire coding sequence). To create Con/Fon constructs, the exon order is exon 3, exon 2, exon 1, with exons 1 and 3 in the reverse complement orientation and exon 2 in the sense orientation. To create Con/Foff constructs, the exon order is exon 1, exon 2, exon 3, with exons 1 and 3 in the sense orientation and exon 2 in the reverse complement orientation. To create Coff/Fon constructs, the exon order is exon 3, exon 2, exon 1, with all exons in the reverse complement orientation. All of these plasmids are constructed in an AAV-nEF backbone with a 3’ WPRE and are detailed in the Key Resources Table.
Single ORF, three-recombinase-dependent INTRSECT plasmids were constructed by splitting the reading frame into three pieces (referred to as ‘exon 1’, ‘exon 2’, and ‘exon 3’) after being analyzed for naturally occurring splice-site-like sequences using a public bioinformatics tool (http://www.cbs.dtu.dk/services/NetGene2/; Brunak et al., 1991), designed as possible to have the splice site disrupt the reading frame to decrease the chance of partial protein synthesis from exon 2 or exon 3 in the absence of the pre-defined expression criteria. A derivative of the CMV Towne Variant intron B (Fenno et al., 2014) containing a cDIO cassette and fDIO (F3/F5-based) cassette was inserted between exon 1 and exon 2, with the donor and acceptor sites fused directly to the 3’ terminus of exon 1 and 5’ terminus of exon 2, respectively. A derivative of the mouse IgE intron 3 (Fenno et al., 2014) containing a fDIO cassette and vcDIO cassette was inserted between exon 2 and exon 3, with the donor and acceptor sites fused directly to the 3’ terminus of exon 2 and 5’ terminus of exon 3, respectively. A separate cDIO cassette was added directly after the promoter (5’ to the entire coding sequence) and a vcDIO cassette was added directly before the WPRE (3’ to the entire coding sequence). To create Con/Fon/VCon constructs, the exon order is exon 1, exon 2, exon 3, with all exons in the reverse complement orientation. All of these plasmids are constructed in an AAV-nEF backbone with a 3’ WPRE and are detailed in the Key Resources Table.
To produce FRT variants for screening Con/Foff improvements, the FRT, F3, F5 (Schlake and Bode, 1994), and F72 (Nakano et al., 2001) sequences were built into various combinations of AAV-EF1α-Con/Foff-EYFP. In addition, a 14bp addition noted from the genomic FRT sequence (Andrews et al., 1985) was added either to the 5’ or 3’ (or both) ends of F3, F5, and/or FRT in configurations. These were synthesized de novo and incorporated into the Flp cassette using standard cloning techniques. After screening, the FRT-F5 cassette was incorporated into all Con/Foff constructs.
| FRT variant | 5’ repeat | 8bp central motif | 3’ repeat |
| FRT | gaagttcctattc | tctagaaa | gtataggaacttc |
| F3 | gaagttcctattc | ttcaaata | gtataggaacttc |
| F5 | gaagttcctattc | ttcaaaag | gtataggaacttc |
| F72 | gaagttcctattc | tgtagaaa | gtataggaacttc |
| 14bp addition | gaagttcctattcc |
All AAV vectors were tested for in vitro expression before viral production. Maps are available at http://optogenetics.org/.
sRGECO and oScarlet development
Prior to entering mScarlet and jRGECO1a into the INTRSECT production pipeline, we observed fluorescent puncta (assumed to be protein aggregates) when expressed either in vitro (mScarlet; Figure s1b) or in vivo (jRGECO1a; Figure s2b). Both are based on monomeric Red Fluorescent Protein (Bindels et al., 2017; Dana et al., 2016), which is known to be degradation-resistant and accumulate in lysosomes (Katayama et al., 2008). We found that the unconventional lysosomal targeting motif tryptophan-glutamic acid (Piccirillo et al., 2006) was conserved in both of these tools. To overcome this aggregation problem we mutated this motif mScarlet(E95D) (‘oScarlet’ for ‘optimized’; Figure s1a) and jRGECO1a(E217D) (‘sRGECO’ for ‘Stanford’ and ‘smooth’; Figure s2a). oScarlet had significantly fewer aggregates in cultured neurons (25.9 per neuron in mScarlet, 0.58 per neuron in oScarlet, p < 0.0001, Mann-Whitney test), with no obvious difference in fluorescence intensity as assayed by flow cytometry (Figure s1b,c). The distribution of aggregates in sRGECO were significantly less relative to jRGECO1a in mouse mPFC (p = 0.0368, Kolmogorov-Smirnov test), without a difference in either mean aggregates per neuron or total fluorescence across the imaged cortical slices (Figure s2b,c; mean aggregates 6.96 per neuron in jRGECO1a vs. 5.73 per neuron in sRGECO, p = 0.7846, Mann-Whitney test, total integrated fluorescence p = 0.1867, unpaired t-test. N as indicated). To characterize this improved GECI more thoroughly, we designed a small, 3D-printable well insert for electrical stimulation of cultured neurons using a 100 mA source applied through platinum wires (Figure s2d). In vitro characterization of sRGECO and jRGECO1a (Figure s2e) revealed a difference in basal fluorescence and related differences in signal magnitude, but intact function. Considering the improved expression patterns of oScarlet and sRGECO, we used these versions as the sequence base for creating their INTRSECT variants.
mRNA isolation and cDNA synthesis
HEK293FT cells at 50% confluence were transfected with endotoxin-free DNA using Lipofectamine 2000 (Thermo Fisher) following the manufacturer protocol. Five days post transfection, RNA extraction was performed using reagents from the RNeasy Mini Kit (Qiagen). Cells were disrupted with lysis buffer and homogenized using QiaShredder homogenizer columns. Combined first-strand cDNA/PCR using the SuperScript III One-Step RT-PCR System (Thermo Fisher) was performed with the following initial reaction conditions: 45 °C . 30 min, 94 °C . 2 min, 40 cycles of 94 °C . 15 s, 45 °C . 30 s, 68 °C . 1 min, ending with 68 °C . 5 min using various combinations of primers (F, forward; R, reverse) as noted in the Key Resources Table and sometimes optimized further to reduce off-target amplicons. The PCR product was electrophoresed on a 0.8% agarose gel, photographed, and DNA bands purified from the gel and sequenced to determine splice junctions.
Flow cytometry
HEK293FT cells (Thermo Fisher) were grown in 24-well tissue culture plates to 50% confluence and transfected in duplicate with 800 ng total DNA with Lipofectamine 2000 (Thermo Fisher) following the manufacturer protocol. In dual-recombinase INTRSECT plasmid experiments, 267ng of each plasmid was used, except in recombinase ratio experiments, where a fixed amount of INTRSECT plasmid and variable ratios of Cre and Flp, as noted in the figure, were added. In Triplesect experiments, 200ng of each plasmid was added. Five days post transfection, cells were removed by enzymatic dissociation (TrypLE, Gibco), resuspended in cold PBS, pelleted at 200g for 5 min and resuspended in 500 μL PBS supplemented with 1 μg/mL propidium iodide (PI; Sigma, used with green and blue fluorescent constructs) or 5μM 4’6-diamidino-2-phenylindole (DAPI; Thermo Fisher, used with red fluorescent constructs), and then placed on ice under aluminum foil until analysis. Flow cytometry was completed on a DxP FACSCAN analyzer at the Stanford Shared FACS Facility using settings optimized for side scatter (SS), forward scatter (FS), vital dye (PI or DAPI) and fluorophore (BFP, EYFP, GCaMP6, mCherry, sRGECO, or oScarlet) acquisition using positive (non-recombinase-dependent parent construct), negative (empty transfection) and dead (heat-killed; 95 °C for 3 min) conditions as controls. Live-cell populations used in comparisons were isolated from debris and dead cells in post hoc analysis using FlowJo 10.4.2 (FlowJo) by (i) positively gating for the high-density population in plotting FS vs. SS and (ii) negatively gating for vital dye+ cells. Analysis and plots were completed using FlowJo software.
Analysis of FRT cassette variants was completed by exporting the live-cell populations defined as above, then isolating the population of cells with EYFP expression higher than the maximum expression value of the negative population (‘residual population’). Outliers were removed from the negative sample prior to determining the maximum fluorescence value by excluding samples with fluorescence values greater than three median absolute deviations from the median fluorescence. We then calculated the (i) mean fluorescence of the residual population and (ii) the percentage of the total cells represented by the residual population. Flp titration experiments were completed by transfecting a fixed amount of Con/Foff-EYFP variant, Cre, and a varying amount of Flp to create molar ratios as indicated in the figure. A constant amount of DNA was transfected in each condition, with the difference between conditions made up with empty vector.
Primary Neuron Culture Transfection
2ug total DNA of mixture of recombinase and INTRSECT construct, or an equivalent amount of the parental tool expression construct, was mixed with 1.875 μl 2 M CaCl2 (final Ca2+ concentration 250 mM) in 15 μl H2O. To DNA-CaCl2 we added 15 μl of 2× HEPES-buffered saline (pH 7.05). After 20 min at room temperature (20–22 °C), the mix was added dropwise into each well (from which the growth medium had been removed and replaced with pre-warmed minimal essential medium (MEM)) and transfection proceeded for 45–60 min at 37 °C, after which each well was washed with 3 × 1 ml warm MEM before the original growth medium was returned. Neurons were allowed to express transfected DNA for 6–8 days prior to experimentation.
Primary Culture Electrophysiology
Recordings of neurons prepared and transfected as above were obtained in Tyrode’s medium (in mM: 150 NaCl, 4 KCl, 2 MgCl2, 2 CaCl2, 10 d-glucose, 10 HEPES, adjusted to pH 7.3–7.4 with NaOH, 320–330 osmolarity) supplemented with Tetrodotoxin (TTX; Tocris, 1 μM), (2R)-2-amino-5-phosphonopentanoic acid (APV; Tocris, 10 μM), and 6-cyano-7-nitroquinoxaline-2,3-dione (CNQX; Tocris, 25 μM) as indicated, with a standard internal solution (in mM: 130 K-gluconate, 10 KCl, 10 HEPES, 10 EGTA, 2 MgCl2, to pH 7.25 with KOH, 300–310 osmolarity) in 3- to 6-MΩ glass pipettes. Light from a SPECTRA-X Light Engine (Lumencor) with LEDs with individual light power adjusted for uniform light power density of 1mW/mm2 across wavelengths and 470/15, 513/15, and 585/29 filters were used for blue, green and orange illumination, respectively. The Spectra X was coupled with a liquid light guide to an inverted microscope Leica DM-LFSA. All data collected from whole-cell recordings. Recordings were made using a MultiClamp700B amplifier (Molecular Devices). Signals were filtered at 4 kHz and digitized at 10 kHz with a Digidata 1440A analog-digital interface (Molecular Devices). pClamp10.6 software (Molecular Devices) was used to record and analyze data. Peak photocurrents were measured from a 1 or 5 s light pulse in voltage-clamp mode.
Cultured Neuron Calcium Imaging
Calcium imaging conducted on neurons prepared and transfected as above in Tyrode media equivalent to primary culture electrophysiology media, including blockers, except with (mM) 1 MgCl2 and 3 CaCl2. A custom-designed and 3D-printed stimulation insert with platinum wires 1 cm apart was attached to a bipolar stimulator (Warner Instruments) time-locked to imaging software (MetaMorph) via LabVIEW (National Instruments). Stimulation was conducted a 100 mA, 3ms pulse width, 0.1 Hz, with 5 pulses per imaging field and images acquired at 33 Hz. Bulk signal was extracted from manually drawn ROIs and signals were corrected for background fluorescence and GECI signal bleaching prior to calculating dF/F using custom MATLAB code.
Virus production
AAV-8 (Y733F), was produced by the Stanford Neuroscience Gene Vector and Virus Core. In brief, AAV-8 was produced by standard triple transfection of AAV 293 cells (Agilent). At 72 h post transfection, the cells were collected and lysed by a freeze-thaw procedure. Viral particles were then purified by an iodixanol step-gradient ultracentrifugation method. The iodixanol was diluted and the AAV was concentrated using a 100-kDa molecular mass–cutoff ultrafiltration device. Genomic titer was determined by quantitative PCR. All viruses were tested in cultured neurons for expected expression patterns prior to use in vivo. Virus titers were obtained for every new batch of virus produced and virus expression was checked in cultured neurons prior to injection in vivo. Viral dilutions were calculated based on original titers given at the time of virus production in order to match the viral titer of all viruses used in an experiment. Aliquots of each virus were kept separately from in-use supply and, after all experiments were completed, all viruses used in the Resource were re-titered simultaneously (across two plates) to standardize values across experiments and time and these final re-titered values, and these values are reported in the submitted text, figures, and summary below. As virus titers vary based on probe, standard curve, freeze-thaw cycles, and titer batch, we presented order-of-magnitude rounded titers in the figures and text. Viral titers by figure rounded to nearest order of magnitude are below. Additional details are available in the Key Resources Table.
| Figure 3f,h,I & Figure s6e,f | AAV8-Cre | e10 | ||
| AAV8-EYFP | e12 | AAV8-Flp | e12 | |
| AAV8-Con/Fon-EYFP | e12 | AAV8-VCre | e13 | |
| AAV8-Con/Foff-EYFP | e11 | |||
| AAV8-Coff/Fon-EYFP | e12 | Figure 5j | ||
| AAV8-Cre | e10, e11, e12 | AAV8–3x-G6M | e12 | |
| AAV8-Flp | e12 | AAV8-Flp | e10 | |
| AAV8-Flp-2a-Cre | e12 | AAV8-VCre | e11 | |
| Figure 4b | Figure s2b | |||
| AAV8-cDIO-EYFP | e12 | AAV8-jRGECO1a | e12 | |
| AAV8-fDIO-EYFP | e12 | AAV8-sRGECO | e12 | |
| AAV8-vcDIO-EYFP | e12 | |||
| AAV8-Cre | e11 | Figure s4f | ||
| AAV8-Flp | e11 | AAV8-Arch-EYFP | e12 | |
| AAV8-VCre | e12 | AAV8-Con/Fon-Arch-EYFP | e12 | |
| AAV8-Con/Foff-Arch-EYFP | e12 | |||
| Figure 4c | AAV8-Coff/Fon-Arch-EYFP | e12 | ||
| AAV8-fDIO-EYFP | e12 | AAV8-Cre | e12 | |
| AAV8-vcDIO-EYFP | e12 | AAV8-Flp | e12 | |
| AAVretro-Flp | e13 | AAV8-Flp-2a-Cre | e12 | |
| AAVretro-VCre | e13 | |||
| Figure s6a–d | ||||
| Figure 5f | AAV8-Con/Foff-EYFP | e11 | ||
| AAV8–3x-EYFP | e12 | AAV8-Flp | e12 |
Stereotactic injections
Stereotactic viral injections were carried using typical technique. Briefly, mice induced and maintained on isoflurane anesthesia were placed in a stereotactic frame (Kopf Instruments) and the head leveled using bregma and lambda skull landmarks. Craniotomies were performed so as to cause minimal damage to cortical tissue using a hand drill. Injections were made using a 10μL syringe and 33g-36g beveled needle (World Precision Instruments). 1000 nl of viral suspension was infused at a rate of 100 nl/min at the indicated locations (coordinates in mm below). The needle was left in place for 10 minutes after the completion of injection before being withdrawn under supervision. Skin was approximated with suture.
Stereotactic coordinates (mm) relative to Bregma
| Anterior-Posterior | Medial-Lateral | Dorsal-Ventral | |
|---|---|---|---|
| mPFC | + 1.5 | +/− 0.3 | − 2.5 |
| mPFC | + 1.85 | +/− 0.3 | − 2.5 |
| VTA | − 3.3 | +/− 0.4 | − 4.2 |
Slice electrophysiology
To prepare coronal slices (300 μm) from mice four weeks after viral injection, subjects were first trans-cardially perfused with ice-cold, NMDG-HEPES recovery solution (‘NMDG solution’; Ting et al., 2014; in mM): 93 NMDG, 2.5 KCl, 1.2 NaH2PO4, 30 NaHCO3, 20 HEPES, 25 glucose, 5 sodium ascorbate, 2 thiourea, 3 sodium pyruvate, 10 MgSO4, 0.4 CaCl2, adjusted to pH 7.3 – 7.4 with HCl/NaOH. A vibratome with ice-cold, bubbled (5% CO2 ‘carbogen’) NMDG solution was used to cut slices, which were then recovered for 12 – 14 minutes in carbogen-bubbled NMDG solution at 32 °C before being recovered for 1 hr in RT (22– 25 °C) carbogen-bubbled artificial cerebrospinal fluid (‘aCSF; in mM): 124 NaCl, 2.5 KCl, 1.2 NaH2PO4, 24 NaHCO3, 5 HEPES, 12.5 glucose, 2 MgSO4, 2 CaCl2, adjusted to pH 7.3–7.4 with NaOH. Synaptic transmission blockers APV (25 μM), CNQX (10 μM) and sodium channel blocker TTX (1 μM) are used as indicated. Electrophysiological recordings were performed at RT. Slices were visualized with an upright microscope LEICA DM LFSA equipped with a 40x water-immersion objective. Individual neuron recordings were obtained after identifying fluorescent protein expression without interruption of ACSF perfusion. Filtered light from a Spectra X Light engine (Lumencor) was coupled to the fluorescence port of the microscope and used to both view fluorescence and deliver light pulses for opsin activation. Whole-cell recordings were obtained with patch pipettes pulled from borosilicate glass capillaries (Sutter Instruments) with a horizontal puller (P-2000, Sutter Instruments) and contained the following internal solution (in mM): 130 K-gluconate, 10 KCl, 10 HEPES, 10 EGTA, 2 MgCl2, to pH 7.25 with KOH. Recordings were made using a MultiClamp700B amplifier (Molecular Devices). Signals were filtered at 4 kHz and digitized at 10 kHz with a Digidata 1440A analog-digital interface (Molecular Devices). pClamp10.6 software (Molecular Devices) was used to record and analyze data. Peak photocurrents were measured from a 1 s light pulse in voltage-clamp mode.
Spectrophotometry and Viral Kinetic Analysis
A complete parts list is available in the Key Resources Table. Briefly, data describing viral expression kinetics in vivo were collected with an inexpensive device consisting of a 505 nm LED (Thorlabs M505F1) coupled to a dichroic filter mount via multi-mode fiber optic patch cable (Thorlabs m76L01). Excitation light was band-pass filtered (497 nm/16 nm FWHM, Thorlabs MF497–16) and reflected by dichroic (525 nm long-pass, Chroma T525lpxr) into a 200 μm, 0.53 NA (Doric) fiber optic patch cable to the sample. Emission light then passed through the same dichroic, then through two identical clean-up filters (535 nm/22 nm FWHM, Thorlabs MF535–22), and to a visible wavelength, compact CCD spectrometer (Thorlabs CCS100) via a round-to-linear fiber bundle (Thorlabs BFL200LS02). The spectrometer was connected by USB to a computer running Windows and data acquired with the bundled Thorlabs spectrometer software.
EYFP expression data were acquired from individual animals injected with various AAV8 viruses as indicated (Figure 3) and fitted with 200 μm, 0.53 NA fiber optic implants (Doric) with the fiber tip placed at the injection site. Animals were injected on Wednesdays (day 0) and the first reading taken on Friday (day 2) with (in ms), 5, 10, 50, 100, 500, 1000, 3000, 5000, 10000, and 20000 integration times, with a large range designed to be sensitive to low expression (longer integration time), but also not saturated with high expression (shorter integration time). Readings were taken every Monday, Wednesday, and Friday thereafter for 6 weeks (18 timepoints). Animals were sacrificed after timepoint 18 for expression analysis by confocal. Prior to recording each day, the excitation LED was calibrated to 0.214 mW using a power meter (Thorlabs) and readings from a fluorescein slide (Thorlabs) and purified EYFP were taken to ensure consistent system performance. The raw data were stored as .txt files.
To calculate the ‘expression score’ of an individual time point, raw data were imported into MATLAB, signal from 528 nm – 540 nm were segmented from the dataset, and the area under the curve was calculated using the trapz function across this signal subset for each integration timepoint. Timepoints with zero or saturated values were excluded. Remaining values were normalized to integration time and averaged, resulting in that day’s expression score.
Virus-dependent expression kinetics were modeled in MATLAB by first log-transforming individual animal expression score datasets, normalizing these log-transformed data to the subject maximum, and pooling the samples within a condition. This combined dataset was then fit with the equation y=1*(1-exp(−b*x)) where y is fraction of max expression, x is the days of expression, and b is solved for using the MATLAB fit function. Days of expression to a certain fraction of normalized log maximum expression was calculated from fitted curves by solving for x (days of expression) for a given y (fraction of maximum). 95% confidence interval of the fit and the solved days of expression were calculated by using the 95% CI values of b.
To calculate absolute photon number, we calculated a conversion factor between photons and AUC (calculated as above) of a fluorescein slide. To do this, we set the 505 nm excitation LED to 0.214 mW (mJ/s) at the tip of a fiber and connected this fiber to the slide (as above). We next acquired spectrometry data for a series of integration time points between 100 ms and 500 ms, which gave non-zero and non-saturated results. We then disconnected the patch cable (see Key Resources) connecting the optical components to the spectrometer and measured light power coming out of this cable (and thus into the spectrometer) in the absence of ambient light (with the power meter reading ‘zero’) using a highly sensitive power meter (Thorlabs CS130C) tuned to 534 nm (the median wavelength within our filtered emission range), which was 2.0 nW. We calculated the photon energy (in J/photon) using the equation E = hc/λ, where h is Planck’s constant, c is the speed of light, and λ is the photon wavelength, which we set at 534 nm. We next solved for photons/second using E and the measured output emission power in W. Last, we scaled the acquired AUC values to AUC/second and used this set of values to calculate a scale factor x for the spectrometer using the equation photons/s = x*AUC/s. To extrapolate this scale factor to absorbance from AUC, we used absorbance values for a single wavelength (534 nm).
Fiber Photometry
Mice were injected in VTA with combinations of 3x-GCaMP6m and recombinase AAV and fitted with 400 μm, 0.66 NA fiber optic implants (Doric). After four weeks of expression, bulk fluorescence was collected as previously described (Gunaydin et al., 2014). Calcium signal was collected by recording bulk fluorescence using a single optical fiber while simultaneously delivering excitation light as previously described (Gunaydin et al., 2014; Inoue et al., 2019). We used a 385 nm LED (M385F1, Thorlabs) for movement correction and 490 nm LED (M490F3, Thorlabs) for calcium signal recording. LEDS were filtered with 386–23 nm (FF01–386/23–25, Semrock) and 488–10 nm (FF01–488/10–25, Semrock) bandpass filters. LED beams were combined using a 425 nm longpass dichroic mirror (T425lpxr, Chroma) before being coupled into an optical fiber patch cable (400 nm diameter, 0.66 NA, Doric Lenses) using a multiband dichroic (ZT405/488/561rpc, Chroma). The far end of the patch cord is end-end coupled to the fiber implant in the animal using 2.5 mm ferrules and zirconia or bronze sleeves. Fluorescent calcium signal emission light was passed through a 555 nm dichroic mirror (FF555-Di03–25×36, Semrock) which was filtered through a 447/522 nm dual band filter (ZET405/488 nm-custom narrow green, Chroma) and then focused onto a femtowatt photoreceiver (Model 2151, Newport) using a lens (62–561, Edmund Optics); note that this system is designed to additionally collect red light and that this feature was not used for these experiments. The signal was sampled at 6.1 kHz and independent signals were recovered using synchronous demodulation techniques, low-pass filtered (corner frequency of 15 Hz, decimated to 382 Hz, then recorded to disk. Calcium signal was calculated for each continuous behavioral recording with custom written MATLAB scripts. First, the 405 nm signal was subtracted from the calcium signal for motion correction. Next, a double exponential was fitted to a thresholded version of the fluorescence time series and the best fit was subtracted from the un-thresholded signal to account for slow bleaching. The fluorescence signal was normalized within each mouse by calculating the dF/F as (F median (F)) / median (F), where the median was taken over the first 100 s of the trial. To shuffle bouts, the bout structure (length of each bout and time between bouts) was preserved, while the starting time of the bouts was randomly placed within the period of the trials when novel objects were present in the arena. When this caused bouts to extend beyond the end of the trial, those bouts were wrapped to the beginning of the object interaction period, again preserving the bout structure. Each trial was shuffled 300 times.
Novel object trials were conducted by placing subjects in a new cage after connecting them to the fiber photometry apparatus by fiber optic patch cable (Doric). Behavior was recorded using an overhead mounted camera and synchronized with fiber photometry using a trial-triggered LED that was mounted below the cage to be out of view of the subject. Animals explored the environment for two minutes before novel objects were introduced. Animals were allowed to continue exploring for five additional minutes before the trial was ended. Videos were scored manually for physical object interactions.
Histology
Mice were trans-cardially perfused with 10 mL of ice-cold 1x PBS followed by 10 mL of 4% paraformaldehyde (PFA). After an overnight post-fix in 4% PFA, brains were equilibrated in sterile 30% sucrose/1x PBS for at least 24 h (or until they sunk in the tube). Tissue was sectioned at 60 μm using a freezing microtome (Leica) and mounted with DAPI-containing hard-mount solution (H-1500; Vector Laboratories). Images were obtained on a Leica confocal microscope using 5x, 10x, 40x, and 63x objectives. For comparative expression analysis, z-stacks with the same settings (z-distance, number of optical slices, acquisition parameters) were taken from the slice judged to have maximum expression. These were analyzed in Image-J (Fiji) by calculating the sum of the total integrated fluorescence extracted from every optical section using a standardized ROI.
Quantification and Statistical Analysis
Statistical analysis was performed with GraphPad Prism 7 and MATLAB. Statistical tests, number of subjects, and significance are as detailed in the figure legends and text. General statistical approaches to analyzing data are as follows:
For two-sample comparisons of a single variable with sample sizes less than 10, we performed an independent, two-sample t-test. For simultaneous, pair-wise comparisons of multiple, independent variables we performed one-way ANOVA with Sidak’s multiple comparison test. For two-sample comparisons with individual sample sizes greater than 10, samples were first analyzed for distribution normality using the Shapiro-Wilk normality test. If any samples from an experiment failed normality testing, comparisons of unmatched data were performed with a Mann-Whitney test, while matched data comparisons were performed with a Wilcoxon matched-pairs signed rank test; otherwise, an independent, two-sample t-test was used.
For multiway comparisons of a single variable with sample sizes less than 10, we performed a one-way ANOVA with follow-up comparison of INTRSECT variants to parental (WT) sample using Dunnett’s multiple comparison test. For multiway comparisons with individual sample sizes greater than 10, samples were first analyzed for distribution using the Shapiro-Wilk normality test. If any samples from an experiment failed normality testing, comparisons were performed using a Kruskal-Wallis test with follow-up comparison of INTRSECT variants to parental (WT) sample using Dunn’s multiple comparison test; otherwise, a one-way ANOVA was performed.
For comparisons across multiple variables with matched data, we performed two-way ANOVA with follow-up comparison of variants to parental (WT) sample using Dunnett’s multiple comparison test.
To examine the linear relationship between related datasets, we first log-transformed data that spanned multiple log scales, then analyzed matched datasets with normal distributions by computing the R2 value using Pearson correlation. Separately, to test the dependency of a property on an experimental condition, we performed linear regression and examine the R2 value.
Viral expression kinetic curve fits are described in Spectrophotometry and Viral Kinetic Analysis.
Additional Resources
Deisseroth Lab Website (listing of constructs, sequence maps, and viruses):
http://www.optogenetics.org/sequence_info.html
AddGene (repository for most constructs generated in this Resource):
http://www.addgene.com and see Key Resources
Stanford Viral Vector Core (Produced viruses in the Resource and maintains stocks of some of these viruses):
Flp mouse line database (living document version of Table 1):
http://www.optogenetics.org/flp_lines.html
INTRSECT Standard Operating Procedure (guidelines for experimental design):
https://web.stanford.edu/group/dlab/optogenetics/intrsect_sop.pdf
NetGene2 (Splice site prediction software used for INTRSECT construct design):
Supplementary Material
Highlights.
Multiple recombinase-dependent expression of 15 new molecular payloads in single AAVs.
Intersectional Ca2+-imaging, cell labeling, & optogenetic inhibition or excitation.
Creation and in vivo validation of triple-feature-dependent viruses (Triplesect).
Design of a widely-adaptable, in vivo, quantitative expression-tracking system.
Acknowledgments
We thank Meredith Weglarz at the Stanford FACS Facility, the Stanford Department of Statistics and Ethan Richman for assistance with bio-statistics, and Javier Fernandez-Alcudia and the Stanford Gene Vector and Virus Core for virus production. S.V. received support from NSF, Y.S.K from Stanford Bio-X and the Kwanjeong Fellowship, L.E.F. from NIMH and Stanford Psychiatry, and K.D. from NIH, NSF, DARPA, and Gatsby, NOMIS, Wiegers, Tarlton, and Fresenius Foundations.
Footnotes
Declaration of Interests
No conflicts or competing interests.
Publisher's Disclaimer: This is a PDF file of an unedited manuscript that has been accepted for publication. As a service to our customers we are providing this early version of the manuscript. The manuscript will undergo copyediting, typesetting, and review of the resulting proof before it is published in its final form. Please note that during the production process errors may be discovered which could affect the content, and all legal disclaimers that apply to the journal pertain.
References
- Abraira VE, Kuehn ED, Chirila AM, Springel MW, Toliver AA, Zimmerman AL, Orefice LL, Boyle KA, Bai L, Song BJ, et al. (2017). The cellular and synaptic architecture of the mechanosensory dorsal horn. Cell 168, 295–310. [DOI] [PMC free article] [PubMed] [Google Scholar]
- Alhadeff AL, Su Z, Hernandez E, Klima ML, Phillips SZ, Holland RA, Guo C, Hantman AW, De Jonghe BC, and Betley JN (2018). A Neural Circuit for the Suppression of Pain by a Competing Need State. Cell 173, 140–152.e15. [DOI] [PMC free article] [PubMed] [Google Scholar]
- Andrews BJ, Proteau GA, Beatty LG, and Sadowski PD (1985). The FLP recombinase of the 2μ circle DNA of yeast: Interaction with its target sequences. Cell 40, 795–803. [DOI] [PubMed] [Google Scholar]
- Aschauer DF, Kreuz S, and Rumpel S. (2013). Analysis of Transduction Efficiency, Tropism and Axonal Transport of AAV Serotypes 1, 2, 5, 6, 8 and 9 in the Mouse Brain. PLoS One 8, e76310. [DOI] [PMC free article] [PubMed] [Google Scholar]
- Asp M, Giacomello S, Larsson L, Wu C, Fürth D, Qian X, Wärdell E, Custodio J, Reimegård J, Salmén F, et al. (2019). A Spatiotemporal Organ-Wide Gene Expression and Cell Atlas of the Developing Human Heart. Cell 179, 1647–1660.e19. [DOI] [PubMed] [Google Scholar]
- Atasoy D, Aponte Y, Su HH, and Sternson SM (2008). A FLEX switch targets Channelrhodopsin-2 to multiple cell types for imaging and long-range circuit mapping. J Neurosci 28, 7025–7030. [DOI] [PMC free article] [PubMed] [Google Scholar]
- Awatramani R, Soriano P, Rodriguez C, Mai JJ, and Dymecki SM (2003). Cryptic boundaries in roof plate and choroid plexus identified by intersectional gene activation. Nat. Genet. 35, 70–75. [DOI] [PubMed] [Google Scholar]
- Berndt A, Lee SY, Wietek J, Ramakrishnan C, Steinberg EE, Rashid AJ, Kim H, Park S, Santoro A, Frankland PW, et al. (2016). Structural foundations of optogenetics: Determinants of channelrhodopsin ion selectivity. Proc. Natl. Acad. Sci. U. S. A. 113, 822–829. [DOI] [PMC free article] [PubMed] [Google Scholar]
- Bindels DS, Haarbosch L, van Weeren L, Postma M, Wiese KE, Mastop M, Aumonier S, Gotthard G, Royant A, Hink MA, et al. (2017). mScarlet: a bright monomeric red fluorescent protein for cellular imaging. Nat. Methods 14, 53–56. [DOI] [PubMed] [Google Scholar]
- Bourane S, Duan B, Koch SC, Dalet A, Britz O, Garcia-Campmany L, Kim E, Cheng L, Ghosh A, Ma Q, et al. (2015). Gate control of mechanical itch by a subpopulation of spinal cord interneurons. Science (80-. ). 350, 550–554. [DOI] [PMC free article] [PubMed] [Google Scholar]
- Britz O, Zhang J, Grossmann KS, Dyck J, Kim JC, Dymecki S, Gosgnach S, and Goulding M. (2015). A genetically defined asymmetry underlies the inhibitory control of flexor–extensor locomotor movements. Elife 4. [DOI] [PMC free article] [PubMed] [Google Scholar]
- Brunak S, Engelbrecht J, and Knudsen S. (1991). Prediction of human mRNA donor and acceptor sites from the DNA sequence. J. Mol. Biol. 220, 49–65. [DOI] [PubMed] [Google Scholar]
- Buchholz F, Angrand PO, and Stewart AF (1998). Improved properties of FLP recombinase evolved by cycling mutagenesis. Nat Biotechnol 16, 657–662. [DOI] [PubMed] [Google Scholar]
- Burger C, Gorbatyuk OS, Velardo MJ, Peden CS, Williams P, Zolotukhin S, Reier PJ, Mandel RJ, and Muzyczka N. (2004). Recombinant AAV Viral Vectors Pseudotyped with Viral Capsids from Serotypes 1, 2, and 5 Display Differential Efficiency and Cell Tropism after Delivery to Different Regions of the Central Nervous System. Mol. Ther. 10, 302–317. [DOI] [PubMed] [Google Scholar]
- Cai X, Kardon AP, Snyder LM, Kuzirian MS, Minestro S, de Souza L, Rubio ME, Maricich SM, and Ross SE (2016). Bhlhb5::flpo allele uncovers a requirement for Bhlhb5 for the development of the dorsal cochlear nucleus. Dev. Biol. 414, 149–160. [DOI] [PMC free article] [PubMed] [Google Scholar]
- Chakrabarty P, Rosario A, Cruz P, Siemienski Z, Ceballos-Diaz C, Crosby K, Jansen K, Borchelt DR, Kim J-Y, Jankowsky JL, et al. (2013). Capsid Serotype and Timing of Injection Determines AAV Transduction in the Neonatal Mice Brain. PLoS One 8, e67680. [DOI] [PMC free article] [PubMed] [Google Scholar]
- Chen KH, Boettiger AN, Moffitt JR, Wang S, and Zhuang X. (2015). Spatially resolved, highly multiplexed RNA profiling in single cells. Science (80-. ). 348, aaa6090–aaa6090. [DOI] [PMC free article] [PubMed] [Google Scholar]
- Chowdhury S, Hung CJ, Izawa S, Inutsuka A, Kawamura M, Kawashima T, Bito H, Imayoshi I, Abe M, Sakimura K, et al. (2019). Dissociating orexin-dependent and - independent functions of orexin neurons using novel orexin-flp knock-in mice. Elife 8. [DOI] [PMC free article] [PubMed] [Google Scholar]
- Chuhma N, Mingote S, Yetnikoff L, Kalmbach A, Ma T, Ztaou S, Sienna A, Tepler S, Poulin J, Ansorge M, et al. (2018). Dopamine neuron glutamate cotransmission evokes a delayed excitation in lateral dorsal striatal cholinergic interneurons. 1–29. [DOI] [PMC free article] [PubMed] [Google Scholar]
- Clemente-perez A, Makinson SR, Higashikubo B, Deisseroth K, and Paz JT (2017). Distinct Thalamic Reticular Cell Types Differentially Modulate Normal and Pathological Cortical Rhythms Article Distinct Thalamic Reticular Cell Types Differentially Modulate Normal and Pathological Cortical Rhythms. 2130–2142. [DOI] [PMC free article] [PubMed] [Google Scholar]
- Codeluppi S, Borm LE, Zeisel A, La Manno G, van Lunteren JA, Svensson CI, and Linnarsson S. (2018). Spatial organization of the somatosensory cortex revealed by osmFISH. Nat. Methods 15, 932–935. [DOI] [PubMed] [Google Scholar]
- Cristinelli S, and Ciuffi A. (2018). The use of single-cell RNA-Seq to understand virus–host interactions. Curr. Opin. Virol. 29, 39–50. [DOI] [PubMed] [Google Scholar]
- Cummings KA, and Clem RL (2020). Prefrontal somatostatin interneurons encode fear memory. Nat. Neurosci. 23, 61–74. [DOI] [PMC free article] [PubMed] [Google Scholar]
- Daigle TL, Madisen L, Hage TA, Valley MT, Knoblich U, Larsen RS, Takeno MM, Huang L, Gu H, Larsen R, et al. (2018). A Suite of Transgenic Driver and Reporter Mouse Lines with Enhanced Brain-Cell-Type Targeting and Functionality. Cell 174, 465–480.e22. [DOI] [PMC free article] [PubMed] [Google Scholar]
- Dana H, Mohar B, Sun Y, Narayan S, Gordus A, Hasseman JP, Tsegaye G, Holt GT, Hu A, Walpita D, et al. (2016). Sensitive red protein calcium indicators for imaging neural activity. Elife 5. [DOI] [PMC free article] [PubMed] [Google Scholar]
- Davidson BL, Stein CS, Heth JA, Martins I, Kotin RM, Derksen TA, Zabner J, Ghodsi A, and Chiorini JA (2000). Recombinant adeno-associated virus type 2, 4, and 5 vectors: Transduction of variant cell types and regions in the mammalian central nervous system. Proc. Natl. Acad. Sci. 97, 3428–3432. [DOI] [PMC free article] [PubMed] [Google Scholar]
- Diester I, Kaufman MT, Mogri M, Pashaie R, Goo W, Yizhar O, Ramakrishnan C, Deisseroth K, and Shenoy KV (2011). An optogenetic toolbox designed for primates. Nat Neurosci 14, 387–397. [DOI] [PMC free article] [PubMed] [Google Scholar]
- Ding JJ, Luo AF, Hu LY, Wang DC, and Shao F. (2014). Structural basis of the ultrasensitive calcium indicator GCaMP6. Sci. China Life Sci. 57, 269–274. [DOI] [PubMed] [Google Scholar]
- Dymecki SM, and Tomasiewicz H. (1998). Using Flp-recombinase to characterize expansion of Wnt1-expressing neural progenitors in the mouse. Dev. Biol. 201, 57–65. [DOI] [PubMed] [Google Scholar]
- Ecker JR, Geschwind DH, Kriegstein AR, Ngai J, Osten P, Polioudakis D, Regev A, Sestan N, Wickersham IR, and Zeng H. (2017). The BRAIN Initiative Cell Census Consortium: Lessons Learned toward Generating a Comprehensive Brain Cell Atlas. Neuron 96, 542–557. [DOI] [PMC free article] [PubMed] [Google Scholar]
- Fadok JP, Krabbe S, Markovic M, Courtin J, Xu C, Massi L, Botta P, Bylund K, Müller C, Kovacevic A, et al. (2017). A competitive inhibitory circuit for selection of active and passive fear responses. Nature 542, 96–99. [DOI] [PubMed] [Google Scholar]
- Fenno L, Yizhar O, and Deisseroth K. (2011). The development and application of optogenetics. Annu Rev Neurosci 34, 389–412. [DOI] [PMC free article] [PubMed] [Google Scholar]
- Fenno LE, Mattis J, Ramakrishnan C, Hyun M, Lee SY, He M, Tucciarone J, Selimbeyoglu A, Berndt A, Grosenick L, et al. (2014). Targeting cells with single vectors using multiple-feature Boolean logic. Nat Methods 11, 763–772. [DOI] [PMC free article] [PubMed] [Google Scholar]
- Fenno LE, Mattis J, Ramakrishnan C, and Deisseroth K. (2017). A guide to creating and testing new INTRSECT constructs. Curr. Protoc. Neurosci. 2017, 4.39.1–4.39.24. [DOI] [PMC free article] [PubMed] [Google Scholar]
- Fischer KB, Collins HK, and Callaway EM (2019). Sources of off-target expression from recombinasedependent AAV vectors and mitigation with cross-over insensitive ATG-out vectors. Proc. Natl. Acad. Sci. U. S. A. 116, 27001–27010. [DOI] [PMC free article] [PubMed] [Google Scholar]
- Gao Z, Chen W, Liu M, Chen X, Wan L, Zhang X, and Yuan L. (2019). Tac1-Expressing Neurons in the Periaqueductal Gray Facilitate the Itch-Scratching Cycle via Article Tac1-Expressing Neurons in the Periaqueductal Gray Facilitate the Itch-Scratching Cycle via Descending Regulation. Neuron 101, 45–59.e9. [DOI] [PubMed] [Google Scholar]
- Gökmen MR, Dong R, Kanhere A, Powell N, Perucha E, Jackson I, Howard JK, Hernandez-Fuentes M, Jenner RG, and Lord GM (2013). Genome-Wide Regulatory Analysis Reveals That T-bet Controls Th17 Lineage Differentiation through Direct Suppression of IRF4. J. Immunol. 191, 5925–5932. [DOI] [PMC free article] [PubMed] [Google Scholar]
- Goldberg S, Adair-Kirk TL, Senior RM, and Miner JH (2010). Maintenance of glomerular filtration barrier integrity requires laminin α5. J. Am. Soc. Nephrol. 21, 579–586. [DOI] [PMC free article] [PubMed] [Google Scholar]
- Gradinaru V, Zhang F, Ramakrishnan C, Mattis J, Prakash R, Diester I, Goshen I, Thompson KR, and Deisseroth K. (2010). Molecular and Cellular Approaches for Diversifying and Extending Optogenetics. Cell. [DOI] [PMC free article] [PubMed] [Google Scholar]
- Gunaydin LA, Grosenick L, Finkelstein JC, Kauvar IV, Fenno LE, Adhikari A, Lammel S, Mirzabekov JJ, Airan RD, Zalocusky KA, et al. (2014). Natural neural projection dynamics underlying social behavior. Cell 157, 1535–1551. [DOI] [PMC free article] [PubMed] [Google Scholar]
- Hafner G, Witte M, Guy J, Subhashini N, Fenno LE, Ramakrishnan C, Kim YS, Deisseroth K, Callaway EM, Oberhuber M, et al. (2019). Mapping Brain-Wide Afferent Inputs of Parvalbumin-Expressing GABAergic Neurons in Barrel Cortex Reveals Local and Long-Range Circuit Motifs. Cell Rep. 28, 3450–3461.e8. [DOI] [PMC free article] [PubMed] [Google Scholar]
- Hara T, and Verma IM (2019). Modeling gliomas using two recombinases. Cancer Res. 79, 3983–3991. [DOI] [PMC free article] [PubMed] [Google Scholar]
- He M, Tucciarone J, Lee SH, Nigro MJ, Kim Y, Levine JM, Kelly SM, Krugikov I, Wu P, Chen Y, et al. (2016). Strategies and Tools for Combinatorial Targeting of GABAergic Neurons in Mouse Cerebral Cortex. Neuron 91, 1228–1243. [DOI] [PMC free article] [PubMed] [Google Scholar]
- Hirsch M-R, d’Autréaux F, Dymecki SM, Brunet J-F, and Goridis C. (2013). A Phox2b::FLPo transgenic mouse line suitable for intersectional genetics. Genesis 51, 506–514. [DOI] [PMC free article] [PubMed] [Google Scholar]
- Hordeaux J, Wang Q, Katz N, Buza EL, Bell P, and Wilson JM (2018). The Neurotropic Properties of AAV-PHP.B Are Limited to C57BL/6J Mice. Mol. Ther. 26, 664–668. [DOI] [PMC free article] [PubMed] [Google Scholar]
- Hunter NL, Awatramani RB, Farley FW, and Dymecki SM (2005). Ligand-activated Flpe for temporally regulated gene modifications. Genesis 41, 99–109. [DOI] [PubMed] [Google Scholar]
- Imayoshi I, Hirano K, Sakamoto M, Miyoshi G, Imura T, Kitano S, Miyachi H, and Kageyama R. (2012). A multifunctional teal-fluorescent Rosa26 reporter mouse line for Cre- and Flp-mediated recombination. Neurosci. Res. 73, 85–91. [DOI] [PubMed] [Google Scholar]
- Inoue M, Takeuchi A, Manita S, Horigane S ichiro, Sakamoto M, Kawakami R, Yamaguchi K, Otomo K, Yokoyama H, Kim R, et al. (2019). Rational Engineering of XCaMPs, a Multicolor GECI Suite for In Vivo Imaging of Complex Brain Circuit Dynamics. Cell 177, 1346–1360.e24. [DOI] [PubMed] [Google Scholar]
- Jensen P, Farago AF, Awatramani RB, Scott MM, Deneris ES, and Dymecki SM (2008). Redefining the serotonergic system by genetic lineage. Nat. Neurosci. 11, 417–419. [DOI] [PMC free article] [PubMed] [Google Scholar]
- Jinno S. (2009). Structural organization of long-range GABAergic projection system of the hippocampus. Front. Neuroanat. 3, 13. [DOI] [PMC free article] [PubMed] [Google Scholar]
- KANKI H, SUZUKI H, and ITOHARA S. (2006). High-efficiency CAG-FLPe Deleter Mice in C57BL/6J Background. Exp. Anim. 55, 137–141. [DOI] [PubMed] [Google Scholar]
- Karimova M, Splith V, Karpinski J, Pisabarro MT, and Buchholz F. (2016). Discovery of Nigri/nox and Panto/pox site-specific recombinase systems facilitates advanced genome engineering. Sci. Rep. 6, 30130. [DOI] [PMC free article] [PubMed] [Google Scholar]
- Karimova M, Baker O, Camgoz A, Naumann R, Buchholz F, and Anastassiadis K. (2018). A single reporter mouse line for Vika, Flp, Dre, and Cre-recombination. Sci. Rep. 8, 14453. [DOI] [PMC free article] [PubMed] [Google Scholar]
- Katayama H, Yamamoto A, Mizushima N, Yoshimori T, and Miyawaki A. (2008). GFP-like proteins stably accumulate in lysosomes. Cell Struct. Funct. 33, 1–12. [DOI] [PubMed] [Google Scholar]
- Kato HE, Kim YS, Paggi JM, Evans KE, Allen WE, Richardson C, Inoue K, Ito S, Ramakrishnan C, Fenno LE, et al. (2018). Structural mechanisms of selectivity and gating in anion channelrhodopsins. Nature 561, 349–371. [DOI] [PMC free article] [PubMed] [Google Scholar]
- Klein RL, Dayton RD, Leidenheimer NJ, Jansen K, Golde TE, and Zweig RM (2006). Efficient neuronal gene transfer with AAV8 leads to neurotoxic levels of tau or green fluorescent proteins. Mol. Ther. 13, 517–527. [DOI] [PMC free article] [PubMed] [Google Scholar]
- Kouyama T, Kanada S, Takeguchi Y, Narusawa A, Murakami M, and Ihara K. (2010). Crystal structure of the light-driven chloride pump halorhodopsin from Natronomonas pharaonis. J Mol Biol 396, 564–579. [DOI] [PubMed] [Google Scholar]
- Lao Z, Raju GP, Bai CB, and Joyner AL (2012). MASTR: A Technique for Mosaic Mutant Analysis with Spatial and Temporal Control of Recombination Using Conditional Floxed Alleles in Mice. Cell Rep. 2, 386–396. [DOI] [PMC free article] [PubMed] [Google Scholar]
- Lazaridis I, Tzortzi O, Weglage M, Märtin A, Xuan Y, Parent M, Johansson Y, Fuzik J, Fürth D, Fenno LE, et al. (2019). A hypothalamus-habenula circuit controls aversion. Mol. Psychiatry. [DOI] [PMC free article] [PubMed] [Google Scholar]
- Ringrose Leonie, Lounnas Valere, Ehrlich Lutz, Buchholz Frank, Wade Rebecca, and Stewart AF (1998). Comparative kinetic analysis of FLP and Cre recombinases: mathematical models for DNA binding and recombination. J. Mol. Biol. 363–384. [DOI] [PubMed] [Google Scholar]
- Lüönd F, Bill R, Vettiger A, Oller H, Pelczar P, and Christofori G. (2019). A Transgenic MMTV-Flippase Mouse Line for Molecular Engineering in Mammary Gland and Breast Cancer Mouse Models. J. Mammary Gland Biol. Neoplasia 24, 39–45. [DOI] [PubMed] [Google Scholar]
- Madisen L, Zwingman TA, Sunkin SM, Oh SW, Zariwala HA, Gu H, Ng LL, Palmiter RD, Hawrylycz MJ, Jones AR, et al. (2010). A robust and high-throughput Cre reporting and characterization system for the whole mouse brain. Nat Neurosci 13, 133–140. [DOI] [PMC free article] [PubMed] [Google Scholar]
- Madisen L, Garner AR, Shimaoka D, Chuong AS, Klapoetke NC, Li L, van der Bourg A, Niino Y, Egolf L, Monetti C, et al. (2015). Transgenic Mice for Intersectional Targeting of Neural Sensors and Effectors with High Specificity and Performance. Neuron 85, 942–958. [DOI] [PMC free article] [PubMed] [Google Scholar]
- Marcinkiewcz CA, Mazzone CM, D’Agostino G, Halladay LR, Hardaway JA, Diberto JF, Navarro M, Burnham N, Cristiano C, Dorrier CE, et al. (2016). Serotonin engages an anxiety and fear-promoting circuit in the extended amygdala. Nature 537, 97–101. [DOI] [PMC free article] [PubMed] [Google Scholar]
- Mingote S, Amsellem A, Kempf A, Rayport S, and Chuhma N. (2019). Dopamine-glutamate neuron projections to the nucleus accumbens medial shell and behavioral switching. Neurochem. Int. 129, 104482. [DOI] [PMC free article] [PubMed] [Google Scholar]
- Miyoshi G, Hjerling-Leffler J, Karayannis T, Sousa VH, Butt SJB, Battiste J, Johnson JE, Machold RP, and Fishell G. (2010). Genetic fate mapping reveals that the caudal ganglionic eminence produces a large and diverse population of superficial cortical interneurons. J. Neurosci. 30, 1582–1594. [DOI] [PMC free article] [PubMed] [Google Scholar]
- Nakano M, Ishimura M, Chiba J, Kanegae Y, and Saito I. (2001). DNA Substrates Influence the Recombination Efficiency Mediated by FLP Recombinase Expressed in Mammalian Cells. Microbiol. Immunol. 45, 657–665. [DOI] [PubMed] [Google Scholar]
- Nathanson JL, Yanagawa Y, Obata K, and Callaway EM (2009). Preferential labeling of inhibitory and excitatory cortical neurons by endogenous tropism of adeno-associated virus and lentivirus vectors. Neuroscience 161, 441–450. [DOI] [PMC free article] [PubMed] [Google Scholar]
- Petropoulos S, Edsgärd D, Reinius B, Deng Q, Panula SP, Codeluppi S, Plaza Reyes A, Linnarsson S, Sandberg R, and Lanner F. (2016). Single-Cell RNA-Seq Reveals Lineage and X Chromosome Dynamics in Human Preimplantation Embryos. Cell 165, 1012–1026. [DOI] [PMC free article] [PubMed] [Google Scholar]
- Piccirillo R, Palmisano I, Innamorati G, Bagnato P, Altimare D, and Schiaffino MV (2006). An unconventional dileucine-based motif and a novel cytosolic motif are required for the lysosomal and melanosomal targeting of OA1. J. Cell Sci. 119, 2003–2014. [DOI] [PMC free article] [PubMed] [Google Scholar]
- Platt RJ, Chen S, Zhou Y, Yim MJ, Swiech L, Kempton HR, Dahlman JE, Parnas O, Eisenhaure TM, Jovanovic M, et al. (2014). CRISPR-Cas9 knockin mice for genome editing and cancer modeling. Cell 159, 440–455. [DOI] [PMC free article] [PubMed] [Google Scholar]
- Plummer NW, Evsyukova IY, Robertson SD, de Marchena J, Tucker CJ, and Jensen P. (2015). Expanding the power of recombinase-based labeling to uncover cellular diversity. Development 142, 4385–4393. [DOI] [PMC free article] [PubMed] [Google Scholar]
- Poulin JF, Caronia G, Hofer C, Cui Q, Helm B, Ramakrishnan C, Chan CS, Dombeck DA, Deisseroth K, and Awatramani R. (2018). Mapping projections of molecularly defined dopamine neuron subtypes using intersectional genetic approaches. Nat. Neurosci. 21, 1260–1271. [DOI] [PMC free article] [PubMed] [Google Scholar]
- Raymond CS, and Soriano P. (2007). High-efficiency FLP and PhiC31 site-specific recombination in mammalian cells. PLoS One 2, e162. [DOI] [PMC free article] [PubMed] [Google Scholar]
- Reimsnider S, Manfredsson FP, Muzyczka N, and Mandel RJ (2007). Time course of transgene expression after intrastriatal pseudotyped rAAV2/1, rAAV2/2, rAAV2/5, and rAAV2/8 transduction in the rat. Mol. Ther. 15, 1504–1511. [DOI] [PubMed] [Google Scholar]
- Robertson SD, Plummer NW, De Marchena J, and Jensen P. (2013). Developmental origins of central norepinephrine neuron diversity. Nat. Neurosci. 16, 1016–1023. [DOI] [PMC free article] [PubMed] [Google Scholar]
- Rodríguez CI, Buchholz F, Galloway J, Sequerra R, Kasper J, Ayala R, Stewart AF, and Dymecki SM (2000). High-efficiency deleter mice show that FLPe is an alternative to Cre-loxP. Nat. Genet. 25, 139–140. [DOI] [PubMed] [Google Scholar]
- Satija R, Farrell JA, Gennert D, Schier AF, and Regev A. (2015). Spatial reconstruction of single-cell gene expression data. Nat. Biotechnol. 33, 495–502. [DOI] [PMC free article] [PubMed] [Google Scholar]
- Schlake T, and Bode J. (1994). Use of mutated FLP recognition target (FRT) sites for the exchange of expression cassettes at defined chromosomal loci. Biochemistry 33, 12746–12751. [DOI] [PubMed] [Google Scholar]
- Schönhuber N, Seidler B, Schuck K, Veltkamp C, Schachtler C, Zukowska M, Eser S, Feyerabend TB, Paul MC, Eser P, et al. (2014). A next-generation dual-recombinase system for time- and host-specific targeting of pancreatic cancer. Nat. Med. 20, 1340–1347. [DOI] [PMC free article] [PubMed] [Google Scholar]
- Schuman B, Machold RP, Hashikawa Y, Fuzik J, Fishell GJ, and Rudy B. (2019). Four unique interneuron populations reside in neocortical layer 1. J. Neurosci. 39, 125–139. [DOI] [PMC free article] [PubMed] [Google Scholar]
- Sohal VS, Zhang F, Yizhar O, and Deisseroth K. (2009). Parvalbumin neurons and gamma rhythms enhance cortical circuit performance. Nature 459, 698–702. [DOI] [PMC free article] [PubMed] [Google Scholar]
- Sun JJ, and Ray R. (2016). Generation of Two Noradrenergic-Specific Dopamine-Beta-Hydroxylase-FLPo Knock-In Mice Using CRISPR/Cas9-Mediated Targeting in Embryonic Stem Cells. PLoS One 11, e0159474. [DOI] [PMC free article] [PubMed] [Google Scholar]
- Suzuki E, and Nakayama M. (2011). VCre/VloxP and SCre/SloxP: new site-specific recombination systems for genome engineering. Nucleic Acids Res 39, e49. [DOI] [PMC free article] [PubMed] [Google Scholar]
- Takeuchi T, Nomura T, Tsujita M, Suzuki M, Fuse T, Mori H, and Mishina M. (2002). Flp recombinase transgenic mice of C57BL/6 strain for conditional gene targeting. Biochem. Biophys. Res. Commun. 293, 953–957. [DOI] [PubMed] [Google Scholar]
- Tervo DGR, Hwang BY, Viswanathan S, Gaj T, Lavzin M, Ritola KD, Lindo S, Michael S, Kuleshova E, Ojala D, et al. (2016). A Designer AAV Variant Permits Efficient Retrograde Access to Projection Neurons. Neuron 92, 372–382. [DOI] [PMC free article] [PubMed] [Google Scholar]
- Ting JT, Daigle TL, Chen Q, and Feng G. (2014). Acute Brain Slice Methods for Adult and Aging Animals: Application of Targeted Patch Clamp Analysis and Optogenetics. (Humana Press, New York, NY: ), pp. 221–242. [DOI] [PMC free article] [PubMed] [Google Scholar]
- Tovote P, Esposito MS, Botta P, Chaudun F, Fadok JP, Markovic M, Wolff SB, Ramakrishnan C, Fenno L, Deisseroth K, et al. (2016). Midbrain circuits for defensive behaviour. Nature 534, 206–212. [DOI] [PubMed] [Google Scholar]
- Ventura A, Meissner A, Dillon CP, McManus M, Sharp PA, Van Parijs L, Jaenisch R, and Jacks T. (2004). Cre-lox-regulated conditional RNA interference from transgenes. Proc. Natl. Acad. Sci. U. S. A. 101, 10380–10385. [DOI] [PMC free article] [PubMed] [Google Scholar]
- Villette V, Chavarha M, Dimov IK, Bradley J, Pradhan L, Mathieu B, Evans SW, Chamberland S, Shi D, Yang R, et al. (2019). Ultrafast Two-Photon Imaging of a High-Gain Voltage Indicator in Awake Behaving Mice. Cell 179, 1590–1608.e23. [DOI] [PMC free article] [PubMed] [Google Scholar]
- Vooijs M, Van Der Valk M, Te Riele H, and Berns A. (1998). Flp-mediated tissue-specific inactivation of the retinoblastoma tumor suppressor gene in the mouse. Oncogene 17, 1–12. [DOI] [PubMed] [Google Scholar]
- Vrontou S, Wong AM, Rau KK, Koerber HR, and Anderson DJ (2013). Genetic identification of C fibres that detect massage-like stroking of hairy skin in vivo. Nature 493, 669–673. [DOI] [PMC free article] [PubMed] [Google Scholar]
- Wang X, Allen WE, Wright MA, Sylwestrak EL, Samusik N, Vesuna S, Evans K, Liu C, Ramakrishnan C, Liu J, et al. (2018). Three-dimensional intact-tissue sequencing of single-cell transcriptional states. Science (80-. ). 361. [DOI] [PMC free article] [PubMed] [Google Scholar]
- Weinberg BH, Pham NTH, Caraballo LD, Lozanoski T, Engel A, Bhatia S, and Wong WW (2017). Large-scale design of robust genetic circuits with multiple inputs and outputs for mammalian cells. Nat. Biotechnol. 35, 453–462. [DOI] [PMC free article] [PubMed] [Google Scholar]
- Wick ZC, Tetzlaff MR, and Krook-Magnuson E. (2019). Novel long-range inhibitory nNOS-expressing hippocampal cells. Elife 8. [DOI] [PMC free article] [PubMed] [Google Scholar]
- Wojcinski A, Morabito M, Lawton AK, Stephen DN, and Joyner AL (2019). Genetic deletion of genes in the cerebellar rhombic lip lineage can stimulate compensation through adaptive reprogramming of ventricular zone-derived progenitors. Neural Dev. 14, 4. [DOI] [PMC free article] [PubMed] [Google Scholar]
- Wu J, Liu X, Nayak SG, Pitarresi JR, Cuitiño MC, Yu L, Hildreth BE, Thies KA, Schilling DJ, Fernandez SA, et al. (2017). Generation of a pancreatic cancer model using a Pdx1-Flp recombinase knock-in allele. PLoS One 12, e0184984. [DOI] [PMC free article] [PubMed] [Google Scholar]
- Wu Y, Wang C, Sun H, LeRoith D, and Yakar S. (2009). High-Efficient FLPo Deleter Mice in C57BL/6J Background. PLoS One 4, e8054. [DOI] [PMC free article] [PubMed] [Google Scholar]
- Yizhar O, Fenno LE, Davidson TJ, Mogri M, and Deisseroth K. (2011). Optogenetics in Neural Systems. Neuron 71, 9–34. [DOI] [PubMed] [Google Scholar]
- Yu J, and M.A. P (2006). Reproducible and Inducible Knockdown of Gene Expression in Mice. Genesis 224, 252–261. [DOI] [PubMed] [Google Scholar]
- Yu K, Ahrens S, Zhang X, Schiff H, Ramakrishnan C, Fenno L, Deisseroth K, Zhao F, Luo MH, Gong L, et al. (2017). The central amygdala controls learning in the lateral amygdala. Nat. Neurosci. 20, 1680–1685. [DOI] [PMC free article] [PubMed] [Google Scholar]
- Zhang F Larry M Katz Memorial Lecture, Cold Spring Harbor Laboratory Meeting on Neuronal Circuits. (Cold Spring Harbor Laboratory, March 2008). [Google Scholar]
- Zhang MD, Su J, Adori C, Cinquina V, Malenczyk K, Girach F, Peng C, Ernfors P, Löw P, Borgius L, et al. (2018). Ca2+-binding protein NECAB2 facilitates inflammatory pain hypersensitivity. J. Clin. Invest. 128, 3757–3768. [DOI] [PMC free article] [PubMed] [Google Scholar]
Associated Data
This section collects any data citations, data availability statements, or supplementary materials included in this article.
Supplementary Materials
Data Availability Statement
No stand-alone code was generated for this project, however, MatLab code available upon request from lead contact.