Abstract
Objective
To assess the relationship between diet pattern and prodromal Parkinson disease (PD) features.
Methods
These analyses include 47,679 participants from the Nurses' Health Study and the Health Professionals Follow-up Study. Since 1986, both cohorts have collected dietary information every 4 years and calculated scores for adherence to different diet patterns, including the alternate Mediterranean diet (aMED) and the Alternative Healthy Eating Index (AHEI). In 2012, participants responded to questions regarding constipation and probable REM sleep behavior disorder. For a subset of 17,400 respondents to the 2012 questionnaire, 5 additional prodromal features of PD were assessed in 2014 to 2015. We used multinomial logistic regression to estimate the association between baseline (1986) diet pattern score quintiles and number of prodromal features (0, 1, 2, or ≥3) in 2012 to 2015. Additional analyses investigated the association between long-term adherence to these dietary patterns over 20 years and prodromal features suggestive of PD.
Results
In a comparison of extreme aMED diet quintiles, the odds ratio for ≥3 vs 0 features was 0.82 (95% confidence interval [CI] 0.68–1.00, false discovery rate [FDR]–adjusted ptrend = 0.03) at baseline and 0.67 (95% CI 0.54–0.83, FDR-ptrend < 0.001) for long-term diet; results were equally strong for the association with AHEI scores. Higher adherence to these diets was inversely associated with individual features, including constipation, excessive daytime sleepiness, and depression.
Conclusions
The inverse association between these diet patterns and prodromal PD features is consistent with previous findings and suggests that adherence to a healthy diet may reduce the occurrence of nonmotor symptoms that often precede PD diagnosis.
It is well known that clinical Parkinson disease (PD) is preceded by a prodromal period of ≥10 years during which individuals may experience a range of subtle nonmotor symptoms1–7 before the more classic motor features of the disease. Although these nonmotor features are individually nonspecific, the co-occurrence of multiple features is strongly associated with PD.8 Several foods and nutrients9–12 and adherence to specific dietary patterns13–15 have been associated with the risk of developing PD in previous investigations. Recently, in a cross-sectional study, individuals with features suggestive of prodromal PD reported lower adherence to a Mediterranean diet,16 but there are no longitudinal studies on the relationship between diet or dietary factors and features of prodromal PD. The objective of this study is to investigate whether long-term adherence to 2 diet patterns, the alternate Mediterranean diet (aMED) and the Alternative Healthy Eating Index (AHEI), is associated with the probability of developing prodromal features suggestive of PD during nearly 30 years of follow-up.
Methods
Study population
This investigation uses data from the Nurses' Health Study (NHS) and the Health Professionals Follow-up Study (HPFS) cohorts. The NHS cohort is composed of 121,700 female registered nurses who resided in 1 of 11 states and were between the ages of 30 and 55 years at the time of enrollment in 1976. The HPFS cohort is composed of 51,529 male health professionals who responded to the baseline questionnaire and were between the ages of 40 and 75 years at the time of enrollment in 1986. In both the NHS and HPFS cohorts, the participants complete biennially administered follow-up questionnaires on lifestyle practices, occupational and other exposures, and medical history. Cohort participants <85 years of age and without diagnosed PD who responded to questions assessing probable (p) REM sleep behavior disorder (RBD) and constipation on the 2012 questionnaire and the baseline (1986) food frequency questionnaire (FFQ) are included in these analyses (NHS n = 29,899, HPFS n = 17,770). Because the pRBD question is asked to the sleep partner of the participant, 13,188 NHS and 856 HPFS otherwise eligible participants who did not have a sleep partner were excluded. Due to cost constraints, secondary screening consisting of olfactory testing and an additional premotor PD questionnaire was administered to a subset of eligible participants. This subset consisted of all participants who screened positive for either pRBD or constipation on the 2012 questionnaire but only 23% of those with neither of these features who were randomly selected. In total, 17,400 participants (NHS n = 11,493, HPFS n = 5,907) included in these analyses completed all secondary screening, and an additional 1,129 participants (NHS n = 781, HPFS: n = 348) participants completed some but not all secondary screening.
Outcome assessment
Seven prodromal features are included in these analyses: constipation, pRBD, hyposmia, excessive daytime sleepiness, impaired color vision, depressive symptoms, and body pain. The assessment of these features in the NHS (K.C.H., unpublished data, March 2020) and the HPFS8 has previously been described. For the purposes of these analyses, constipation was assessed according to responses to the 2012 questionnaire and defined as either having a bowel movement frequency of every other day or less or using laxative twice a week or more frequently. The 2012 questionnaire was also used to assess pRBD, which was defined as having a positive response to a screening question from the Mayo Sleep Questionnaire (“Has your spouse [or sleep partner] told you that you appear to ‘act out your dreams’ while sleeping [punched or flailed arms in the air, shouted, or screamed], which has occurred at least 3 times?”).17 In a community-based study and without the specification of dream enactment having happened 3 times, this pRBD screening question had a sensitivity of 100% and a specificity of 95% for the diagnosis of polysomnography-confirmed RBD.18 Hyposmia was assessed with the Brief Smell Identification Test, a standardized test in which participants were asked to identify 12 different odorants. The Epworth Sleepiness Scale19 was used to measure excessive daytime sleepiness, defined as a score of ≥10. A mailed version of the Roth color discrimination test, itself an abridged version of the Farnsworth-Munsell Test,20 was used to assess color discrimination. Body pain presence and severity were assessed with questions from the Short-Form Health Survey. Depressive symptoms were measured with the Mental Health Inventory,21 a 5-question subscale of the Short-Form Health Survey. We defined hyposmia, impaired color vision, body pain, and depressive symptoms as having a score in the bottom 10% of the cohort-specific distribution of participants without pRBD or constipation who completed the respective assessments. For the main analyses, we took the sum of each participant's prodromal features and categorized participants as having 0, 1, 2, or ≥3 features.
Assessment of diet and other covariates
Because most previous reports on diet pattern and PD or prodromal PD have focused on the Mediterranean diet, we treat analyses of the aMED as the primary analyses and analyses of the AHEI as secondary analyses. Diet is measured every 4 years in both the NHS and HPFS with semiquantitative FFQs, which have been validated for use in these cohorts.22,23 From the participants' FFQ responses, a score for aMED adherence was calculated as the sum of 9 component scores: vegetables (excluding potatoes), fruits, nuts, whole grains, legumes, fish, the ratio of monounsaturated to saturated fat, red and processed meats, and alcohol, as previously reported.24,25 For the first 7 of these components, a score of 1 was given if the participant has an intake above the cohort- and questionnaire cycle–specific median. A score of 1 was given for red and processed meat consumption if the participant reports below median intake. For alcohol intake, a score of 1 was given for moderate consumption (5–15 g/d for women, 10–25 g/d for men). If a participant did not meet criteria to receive a score of 1 for a given component, that individual receives a score of 0. Because the HPFS cohort began in 1986, we used 1986 as the baseline diet assessment. For NHS participants with missing 1986 dietary information but who were otherwise eligible for this study, we carried forward information, including FFQ responses, from the 1984 questionnaire cycle.
In a set of secondary analyses, we also explored the relationship between AHEI score and prodromal PD features. Briefly, the AHEI diet is defined by 11 components: vegetables, fruits, whole grains, sugar-sweetened beverages and fruit juice, nuts and legumes, red and processed meat, trans fat, long-chain (n-3) fats, polyunsaturated fatty acids, sodium, and alcohol. Scores for each component, which have been described previously,26 are assigned on a continuous basis, ranging from 0 to 10, and are summed to create a total diet score that ranges from 0 to 110. As with the aMED diet, higher component-specific and total scores for the AHEI indicate a higher adherence to the diet pattern.
Information on other covariates of interest, including caffeine consumption, energy intake, body mass index (BMI), smoking pack-years, and physical activity, was collected at baseline and on subsequent questionnaires in both cohorts.
Statistical analysis
In the primary analyses, we used baseline quintiles of aMED diet score as a measure of Mediterranean diet adherence. We also conducted analyses of cumulative average aMED diet score using all available dietary information collected between 1986 and 2006 to examine the relationship between long-term Mediterranean diet adherence and prodromal features. To minimize the possibility of reverse causation, we did not consider dietary information collected after the 2006 questionnaire cycle, which allowed at least 6 years between the last diet assessment and earliest prodromal feature assessment. Furthermore, because dietary fiber intake is associated with risk of constipation and used in the treatment of constipation,27 we conducted all analyses both including and excluding constipation from the total number of prodromal features to ensure that any association between diet pattern and prodromal features was not solely a reflection of the relationship between diet and constipation. For baseline analyses in the NHS and analyses of long-term diet in both cohorts, values were carried forward 1 questionnaire cycle for participants missing information on either exposure or covariates. Missing value indicators were used if the value from the preceding questionnaire cycle was also missing and could not be carried forward. Because baseline physical activity in the HPFS and cumulative average physical activity in both cohorts were very uncommonly missing (baseline HPFS n = 11 [0.19%]; cumulative average: HPFS n = 0 [0.0%], NHS n = 4 [0.03%]), participants with missing information were assigned to the median quintile to ensure that participants with each level of activity would be sampled in each bootstrap resample. Across all analyses, we used the Benjamini-Hochberg false discovery rate (FDR) approach to adjust p values for multiple testing.28
Within each cohort, multinomial logistic regression was used to estimate the odds ratio (OR) between Mediterranean diet adherence and prodromal feature combinations (1, 2, or ≥3 vs 0). Age-adjusted models of baseline diet were adjusted for age (years); multivariable models were further adjusted for caffeine intake (quintiles), caloric intake (quintiles), smoking pack-years (<5, 5–<10, 10–<15, 15–<20, ≥20), BMI (<25, 25 to <30, ≥30 kg/m2), and physical activity (metabolic equivalent of task hours per week; quintiles). Models of long-term diet intake were adjusted for age, cumulative average caffeine intake, caloric intake, and physical activity, as well as updated versions of smoking pack-year categories and BMI category. For each exposure of interest, the quintile median values were modeled continuously to assess linear trend across quintiles. To account for the oversampling of participants with pRBD or constipation on the 2012 questionnaire, all models were weighted with inverse probability weights, and bootstrapping (500 resamples) was used to obtain valid standard errors. Pooled measures of association and tests of heterogeneity were obtained with random-effects meta-analysis.
We also conducted a series of secondary and sensitivity analyses. First, we completed a complementary set of secondary analyses by repeating the analyses described above with AHEI scores in place of aMED scores. Given that the association between alcohol consumption and PD is not specific to moderate alcohol intake,29 we also refitted the aMED models excluding the alcohol component from the aMED score and instead adjusted for quintile of alcohol consumption. To further evaluate the temporal relationship between diet adherence and prodromal features of PD, we examined the association between each diet pattern and prodromal feature category at each year that diet was assessed between 1986 and 2006 and the mean of the first 2 (1986, 1990) and last 2 (2002, 2006) diet assessments. Using multivariable-adjusted logistic regression, we additionally assessed the relationship between each specific prodromal feature of PD and diet pattern adherence among individuals who completed screening on that feature; because constipation and pRBD were measured in the entire study population, inverse probability weighting and bootstrapping were not used for these specific outcomes. To determine whether specific aMED components were driving the observed associations, we used multivariable-adjusted multinomial logistic regression to assess the relationship between the baseline and cumulative average scores of the individual aMED components and prodromal feature category. To investigate the extent to which excluding individuals who completed some but not all of the secondary premotor screening might have biased our results, we repeated the main analyses by first assuming that these individuals had none of the features for which they were missing data and then again assuming that they had all of the features for which they were missing data. Lastly, we estimated multivariable-adjusted cohort-specific linear risk models among participants with 0 or ≥3 to determine the risk difference comparing the extreme diet pattern quintiles at baseline.
All analyses were performed with SAS statistical software (SAS Institute, Inc, Cary, NC) and R 3.5.0 (cran.r-project.org; R Foundation for Statistical Computing, Vienna, Austria). The p values were considered significant at <0.05.
Standard protocol approvals, registrations, and patient consents
The study protocol was approved by the Institutional Review boards of the Brigham and Women's Hospital and the Harvard T.H. Chan School of Public Health.
Data availability
The data analyzed in the current study are not publicly available because of restricted access, but further information about the datasets is available from the corresponding author on reasonable request.
Results
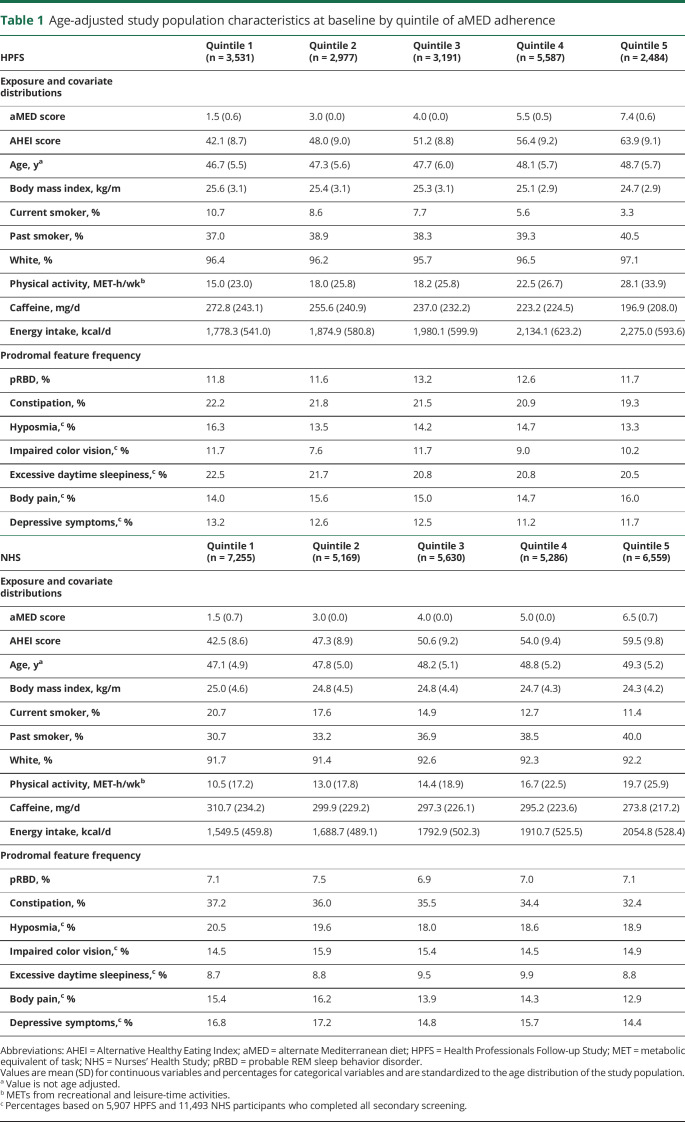
The characteristics of the study population are described in table 1. In both the NHS and the HPFS cohorts, individuals with higher adherence to the aMED diet had a lower BMI; were older, less likely to be current smokers, and more physically active; and consumed both less caffeine and more total energy than individuals with lower aMED adherence. At baseline, the quintiles corresponded to aMED scores of 0 to 2, 3, 4, 5 to 6, and 7 to 9 in the HPFS and 0 to 2, 3, 4, 5, and 6 to 9 in the NHS. Among those who completed screening for all prodromal features, 1,729 NHS participants and 1,155 HPFS participants had 0 features, and 1,966 NHS and 950 HPFS participants had ≥3 prodromal features. When constipation was excluded from the count of prodromal features, there were then 5,057 NHS and 2,275 HPFS participants with 0 features and 777 NHS and 500 HPFS participants with ≥3 features.
Table 1.
Age-adjusted study population characteristics at baseline by quintile of aMED adherence
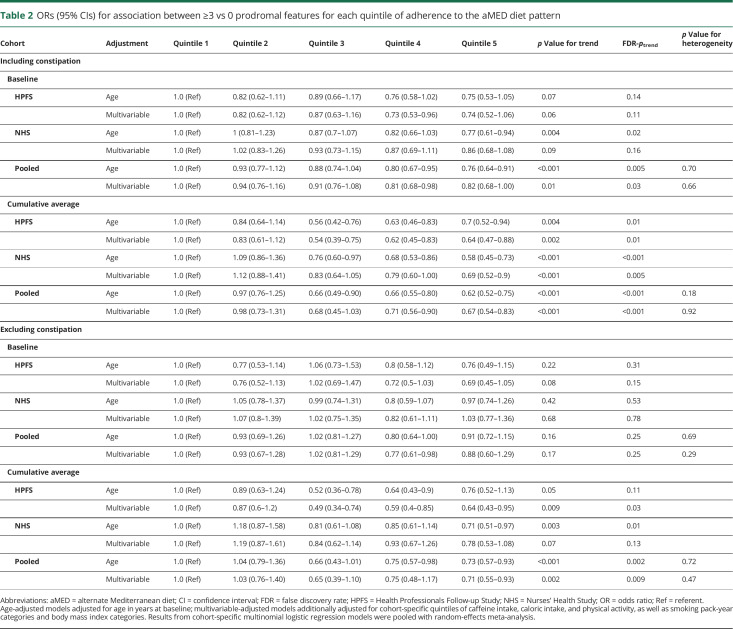
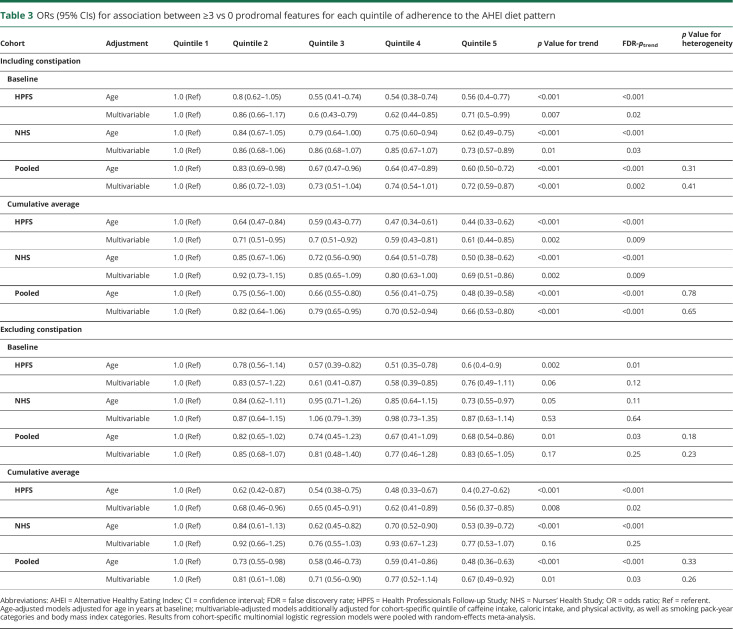
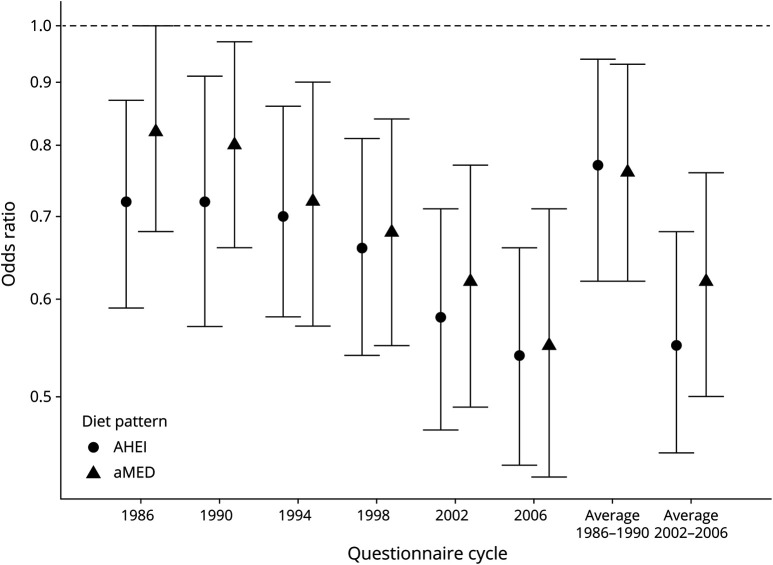
Both baseline adherence and long-term adherence to a Mediterranean-style diet were inversely associated with combinations of prodromal features (table 2). In pooled analyses, the multivariable-adjusted OR for having ≥3 vs 0 prodromal features comparing those in the highest and lowest aMED quintiles was 0.82 (95% confidence interval [CI] 0.68–1.00, FDR-ptrend = 0.03) at baseline and 0.67 (95% CI 0.54–0.83, FDR-ptrend < 0.001) for long-term diet. Results for the AHEI diet followed a similar pattern but were stronger in magnitude (table 3); the multivariable-adjusted OR for ≥3 vs 0 prodromal features comparing extreme AHEI quintiles was 0.72 (95% CI 0.59–0.87, FDR-ptrend = 0.002) at baseline and 0.66 (95% CI 0.53–0.80, FDR-ptrend < 0.001) for long-term diet. These associations were attenuated when we excluded constipation as a prodromal feature but, for long-term diet, remained significant. Excluding moderate alcohol intake as a component of the aMED score similarly weakened but did not completely attenuate the association (multivariable-adjusted OR comparing extreme quintiles 0.86, 95% CI 0.72–1.04, FDR-ptrend = 0.10 for baseline diet; 0.73 95% CI 0.59–0.91, FDR-ptrend = 0.002 for long-term diet). Figure 1 indicates that the observed association at each subsequent dietary assessment between 1986 and 2006 remained inverse and became increasingly stronger.
Table 2.
ORs (95% CIs) for association between ≥3 vs 0 prodromal features for each quintile of adherence to the aMED diet pattern
Table 3.
ORs (95% CIs) for association between ≥3 vs 0 prodromal features for each quintile of adherence to the AHEI diet pattern
Figure 1. Diet pattern association with ≥3 vs 0 prodromal features at each diet assessment between 1986 and 2006.
Multivariable-adjusted pooled odds ratios for ≥3 vs 0 prodromal features comparing extreme quintiles of diet score at each time of diet assessment between 1986 and 2006 and the mean diet score for first 2 assessments (1986, 1990) and last 2 assessments (2002, 2006) for both alternate Mediterranean diet (aMED) and Alternative Healthy Eating Index (AHEI) dietary patterns. Models are adjusted for age (years) and cohort- and questionnaire cycle–specific quintiles of caffeine intake, energy intake, and physical activity, as well as smoking pack-year and body mass index categories.
Results of analyses of 2 vs 0 and 1 vs 0 prodromal features followed a similar pattern but attenuated as the number of features decreased. Briefly, the pooled multivariable-adjusted OR for having 2 vs 0 prodromal features comparing those in the highest and lowest aMED quintiles was 0.82 (95% CI 0.86–1.03, FDR-ptrend = 0.13) at baseline and 0.74 (95% CI 0.61–0.89, FDR-ptrend = 0.01) for long-term diet. The AHEI results were comparable for 2 vs 0 prodromal features; the multivariable-adjusted OR comparing extreme quintiles was 0.81 (95% CI 0.68–0.98, FDR-ptrend = 0.02) at baseline and 0.71 (95% CI 0.59–0.85, FDR-ptrend < 0.001) for long-term diet. In analyses of 1 vs 0 prodromal features, the pooled multivariable-adjusted OR comparing extreme diet pattern quintiles was 0.96 (95% CI 0.82–1.14, FDR-ptrend = 0.75) for aMED and 0.85 (95% CI 0.72–1.01, FDR-ptrend = 0.02) for AHEI at baseline and 0.92 (95% CI 0.77–1.09, FDR-ptrend = 0.15) for aMED and 0.79 (95% CI 0.66–0.95, FDR-ptrend = 0.03) for AHEI for long-term diet.
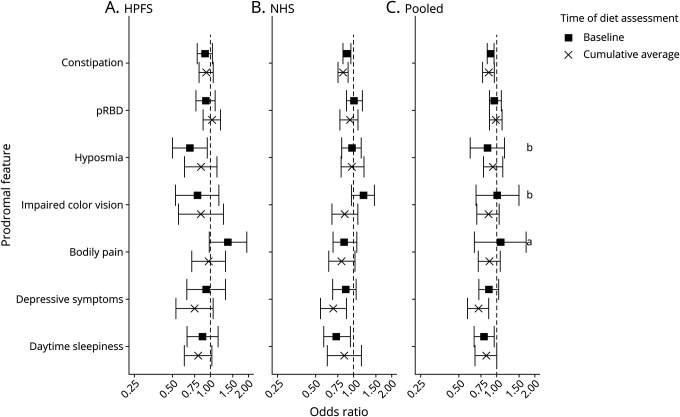
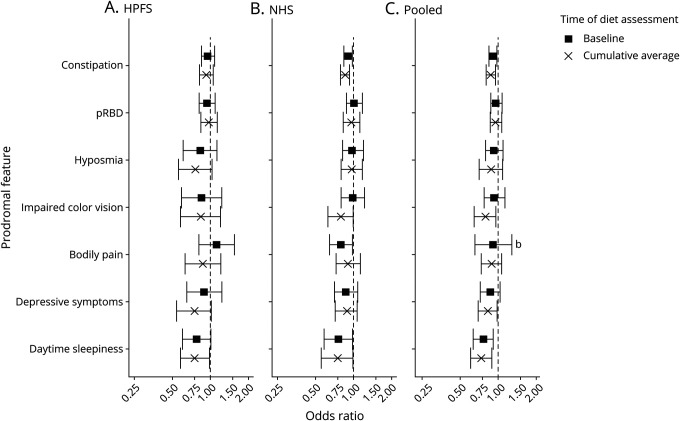
The cohort-specific and pooled associations between each prodromal feature and diet pattern, comparing extreme quintiles of diet, are presented in figures 2 and 3. In pooled multivariable-adjusted analyses, increased aMED adherence at baseline was inversely associated with constipation, and increased long-term aMED adherence was inversely associated with constipation, excessive daytime sleepiness, and depressive symptoms. Adherence to the aMED diet pattern at baseline or long term was not associated with pRBD, hyposmia, body pain, or impaired color vision. Results were similar for AHEI analyses with the exception that the long-term diet association with depressive symptoms was only marginally significant (multivariable-adjusted OR comparing extreme quintiles 0.87, 95% CI 0.83–0.99, FDR-ptrend = 0.10). The results between cohorts were not significantly heterogeneous except for the association between aMED adherence and body pain at baseline (extreme quintiles: pheterogeneity = 0.02); there was marginally significant heterogeneity for the associations between hyposmia and impaired color vision with baseline aMED diet (pheterogeneity = 0.08, pheterogeneity = 0.07) and between body pain and baseline AHEI diet (pheterogeneity = 0.08).
Figure 2. Association with each prodromal feature comparing extreme quintiles of adherence to aMED diet pattern.
Cohort-specific and pooled multivariable-adjusted odds ratios for each of the 7 prodromal features comparing each the extreme quintiles of alternate Mediterranean diet (aMED) adherence at baseline and for cumulative average diet between 1986 and 2006. Models are adjusted for age in years at baseline and cohort-specific quintiles of caffeine intake, caloric intake, and physical activity, as well as smoking pack-year categories and body mass index categories. (A) Health Professionals Follow-up Study (HPFS), (B) Nurses' Health Study (NHS), and (C) pooled cohort. pRBD= probable REM sleep behavior disorder. aStatistically significant heterogeneity across cohorts. bMarginally statistically significant heterogeneity across cohort.
Figure 3. Association with each prodromal feature comparing extreme quintiles of adherence to the AHEI diet pattern.
Cohort-specific and pooled multivariable-adjusted ORs for each of the 7 prodromal features comparing the extreme quintiles of Alternative Healthy Eating Index (AHEI) adherence at baseline and for cumulative average diet between 1986 and 2006. Models are adjusted for age in years at baseline, cohort-specific quintile of caffeine intake, caloric intake, and physical activity, as well as smoking pack-year categories and body mass index categories. (A) Health Professionals Follow-up Study (HPFS), (B) Nurses' Health Study (NHS), and (C) pooled cohort. pRBD= probable REM sleep behavior disorder. bMarginally statistically significant heterogeneity across cohort.
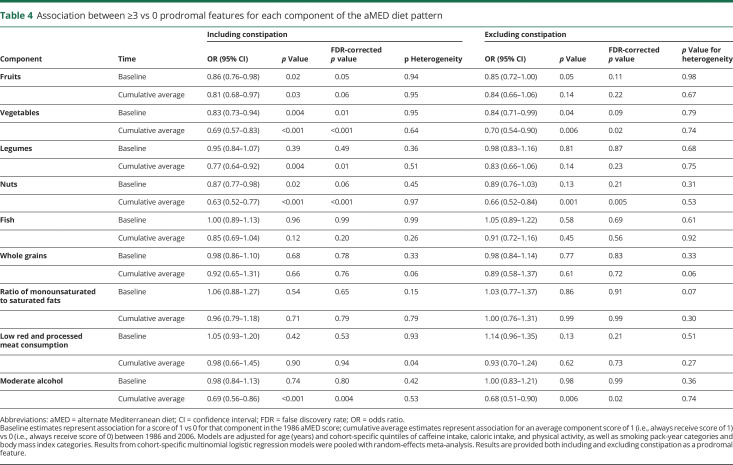
Results of analyses of the association between individual aMED components and prodromal feature combination are provided in table 4. With constipation included as a prodromal feature, increased consumption of vegetables at baseline and increased long-term consumption of vegetables, nuts, legumes and moderate alcohol intake were inversely associated with having ≥3 vs 0 prodromal features. When constipation was excluded as a prodromal feature, the inverse association between long-term consumption of vegetables, nuts, and moderate alcohol intake remained significant.
Table 4.
Association between ≥3 vs 0 prodromal features for each component of the aMED diet pattern
Sensitivity analyses suggest that the main findings are robust to exclusion of participants completing only a portion of secondary screening. With the assumption that the individuals who completed only a portion of secondary screening did not have any features for which they were missing data, the OR for ≥3 vs 0 prodromal features comparing extreme aMED quintiles was 0.83 (95% CI 0.69–1.00, FDR-ptrend = 0.03) at baseline and 0.70 (95% CI 0.57–0.86, FDR-ptrend < 0.001) for long-term diet. When we repeated this analysis assuming that the individuals instead had all features for which they were missing data, the OR for ≥3 vs 0 prodromal features comparing those in the highest vs lowest aMED quintile was 0.81 (95% CI 0.67–0.98, FDR-ptrend = 0.02) at baseline and 0.71 (95% CI 0.58–0.87, FDR-ptrend < 0.001) for long-term adherence. In cohort-specific multivariable-adjusted linear risk models for ≥3 vs 0 prodromal features, the risk difference comparing the highest and lowest quintiles of the aMED diet was between 2% and 3% (NHS: risk difference −0.023 [95% CI −0.056 to 0.011]; HPFS: risk difference −0.033 [95% CI −0.074 to 0.0085]). Estimates were comparable for the AHEI diet pattern. This suggests that in a population with a dietary pattern distribution and risk of prodromal PD similar to that of our cohort participants and assuming that the observed associations reflect a causal effect, between 31 and 44 individuals should change their diet from the lowest to the highest quintile of adherence to the aMED pattern (an increase of ≈5–6 points) to prevent 1 case of ≥3 prodromal PD features.
Discussion
In this pooled analysis of 2 large cohort studies with prospectively collected dietary information, we found that increased aMED and AHEI diet pattern scores were inversely associated with the odds of ≥3 prodromal PD features and specifically with constipation, excessive daytime sleepiness, and depressive symptoms. Analyses of individual aMED components indicate that increased consumption of vegetables and nuts and moderate alcohol intake are each inversely associated with the odds of ≥3 prodromal features. Sensitivity analysis results suggest that the association between diet pattern and prodromal PD features cannot be attributed solely to the effect of diet on constipation or the association between PD and alcohol intake. There was little to no evidence of heterogeneity between men and women for most of our findings.
Although there have been few investigations of the relationship between dietary pattern and either PD13,15 or prodromal PD features,16 our results are broadly consistent with the findings of these previous studies. While our study and each of the previous investigations found an inverse association with increased adherence to a Mediterranean-style diet, the results of both studies conducted in the NHS and the HPFS are similar for the AHEI diet, suggesting that adherence to a healthy diet pattern rather than specifically to a Mediterranean-style diet may reduce risk of PD and its prodromal features. Although the mechanism by which diet pattern might influence risk of PD or its prodromal features remains unclear, growing evidence indicates that the gut and enteric nervous system are involved in PD pathogenesis.30–34 Adherence to a healthy diet pattern may therefore influence PD or prodromal PD features by protecting against α-synuclein aggregation in the gut or by otherwise promoting gut health35,36 in a manner that protects against degeneration in the enteric system or CNS. Alternatively, because adherence to these dietary patterns is associated with consumption of foods high in antioxidant and anti-inflammatory compounds, diet pattern may instead reduce risk of PD or prodromal PD features by preventing oxidative stress37 and neuroinflammation.38
The prodromal features assessed in our cohorts have each been linked with PD individually1–7 and in combination.8 Some of these features, however, may also occur in the prodromal phase of a less common synucleinopathy, dementia with Lewy bodies (DLB). In particular, RBD, olfactory dysfunction, constipation, and depression are associated with the prodromal phase of both PD and DLB.39 The results of our investigation are agnostic as to whether individuals will eventually go on to develop PD or DLB, but the incidence of PD is ≈4-fold higher than that of DLB40; therefore, DLB is likely to account for only a small proportion of individuals with prodromal features. Only with further investigation will we be able to understand whether or how the relationship between diet, prodromal features, and disease differs for PD and DLB.
A few limitations should be considered in the interpretation of the results of this investigation. First, the prodromal features of PD were not assessed at baseline; therefore, for some participants, these features may have been present at baseline and influenced their diet. This limitation, however, is unlikely to explain the inverse association between dietary patterns and key prodromal features such as hyposmia, which is rare at the age of the cohort participants at baseline; constipation, which would tend to cause an increased consumption of fruits and vegetables because of their high fiber content and thus higher adherence to the aMED and AHEI diet patterns; or RBD, which may affect consumption of caffeine but is unlikely to otherwise be a strong determinant of dietary quality. An additional limitation of this investigation is that, although the prodromal features investigated here are associated with increased risk of PD, particularly in combination with each other,8 experiencing any or multiple of these features does not necessarily mean an individual will eventually develop clinically manifest PD. Only with continued observation of this cohort will we be able to identify which participants go on to develop PD and therefore were most likely to have been in the prodromal phase of disease at the time these features were assessed. Due to the observational nature of this investigation, it is also possible that unmeasured or residual confounding or measurement error may be biasing our results. To mitigate these biases as much as possible, we took care to adjust for several known confounders and used well-validated instruments.41–44 Finally, the homogeneity of our cohorts, which are composed largely of White individuals with higher socioeconomic status living in the United States, may limit the generalizability of our findings to populations with different characteristics.
This investigation also has several important strengths. First, the large sample size and availability of information on a range of prodromal features allowed us to investigate the relationship between diet and combinations of prodromal features. This is crucial because the individual features are common and nonspecific, whereas the combination of ≥3 features is rarely observed in individuals without prodromal PD. Second, we were able to leverage >20 years' worth of validated dietary information. This allowed us to assess diet at a baseline date nearly 30 years before prodromal feature assessment when our participants were predominantly middle-aged, thereby minimizing as much as possible the chance of the prodromal features influencing diet. The richness of these dietary data also allowed us to assess long-term diet, the exposure that may be most relevant for disease development, over a 20-year period by averaging participants' diet scores, which has the further benefit of minimizing the influence of within-participant variation. By ending our long-term diet assessment 6 years before the earliest prodromal feature assessment, we again lessened the chance of reverse causation. Third, because dietary and covariate information is collected prospectively in these cohorts, these findings are unlikely to be significantly affected by recall or selection bias.
The results of this investigation suggest that increased adherence to an aMED or AHEI dietary pattern is inversely associated with a combination of prodromal PD features and specifically with constipation, excessive daytime sleepiness, and depressive symptoms. Additional prospective research is needed to determine whether increased adherence to the aMED or AHEI dietary patterns can prevent or delay conversion to PD among individuals with prodromal features.
Acknowledgment
The content is solely the responsibility of the authors and does not necessarily represent the official views of the NIHY. The authors acknowledge the NHS and HPFS cohort participants for enabling this work. This work was supported by a grant from the Department of Defense (W81XWH-14-1-0131) awarded to A.A. as well as the Farmer Family Foundation Parkinson's Research Initiative. The NHS is funded by the NIH through grant UM1 CA186107. The HPFS cohort is funded by the NIH through grant U01 CA167552.
Glossary
- AHEI
Alternative Healthy Eating Index
- aMED
alternate Mediterranean diet
- BMI
body mass index
- CI
confidence interval
- DLB
dementia with Lewy bodies
- FDR
false discovery rate
- FFQ
food frequency questionnaire
- HPFS
Health Professionals Follow-up Study
- NHS
Nurses' Health Study
- OR
odds ratio
- PD
Parkinson disease
- pRBD
probable RBD
- RBD
REM sleep behavior disorder
Appendix. Authors

Footnotes
CME Course: NPub.org/cmelist
Study funding
This study was supported by Department of Defense grant W81XWH-14-0131. The NHS cohort is funded by NIH grant UM1 CA186107, and the HPFS cohort is funded by NIH grant U01 CA167552.
Disclosure
S. Molsberry, K. Bjornevik, and K.C. Hughes report no disclosures relevant to the manuscript. B. Healy has received research support from Merck Serono, Genzyme, Novartis, Verily Life Sciences, and Analysis Group. M. Schwarzschild has within the past 3 years received funding from the Cure Parkinson's Trust, CBD Solutions trust, Michael J. Fox Foundation for Parkinson's Research (MJFF), Prevail Therapeutics, and nQ Medical for serving on their scientific advisory boards; from Eli Lilly and Co for serving on a trial Data Monitoring Committee; from Biotie Therapeutics, Inc/Acorda Therapeutics, MJFF, Parkinson's Foundation and University of California–San Francisco for serving on study steering committees; and from Denali Therapeutics for presenting a seminar. He has within the past 3 years received research funding from the NIH, Parkinson's (Disease) Foundation, US Department of Defense, RJG Foundation, Target ALS Foundation, MJFF, and the Farmer Family Foundation. A. Ascherio reports no disclosures relevant to the manuscript. Go to Neurology.org/N for full disclosures.
References
- 1.Gao X, Chen H, Schwarzschild MA, Ascherio A. A prospective study of bowel movement frequency and risk of Parkinson's disease. Am J Epidemiol 2011;174:546–551. [DOI] [PMC free article] [PubMed] [Google Scholar]
- 2.Ross GW, Petrovitch H, Abbott RD, et al. Association of olfactory dysfunction with risk for future Parkinson's disease. Ann Neurol 2008;63:167–173. [DOI] [PubMed] [Google Scholar]
- 3.Postuma RB, Gagnon JF, Vendette M, Fantini ML, Massicotte-Marquez J, Montplaisir J. Quantifying the risk of neurodegenerative disease in idiopathic REM sleep behavior disorder. Neurology 2009;72:1296–1300. [DOI] [PMC free article] [PubMed] [Google Scholar]
- 4.Ishihara L, Brayne C. A systematic review of depression and mental illness preceding Parkinson's disease. Acta Neurol Scand 2006;113:211–220. [DOI] [PubMed] [Google Scholar]
- 5.Walter U, Kleinschmidt S, Rimmele F, et al. Potential impact of self-perceived prodromal symptoms on the early diagnosis of Parkinson's disease. J Neurol 2013;260:3077–3085. [DOI] [PubMed] [Google Scholar]
- 6.Diederich NJ, Pieri V, Hipp G, Rufra O, Blyth S, Vaillant M. Discriminative power of different nonmotor signs in early Parkinson's disease: a case-control study. Mov Disord 2010;25:882–887. [DOI] [PubMed] [Google Scholar]
- 7.Abbott RD, Ross GW, White LR, et al. Excessive daytime sleepiness and subsequent development of Parkinson disease. Neurology 2005;65:1442–1446. [DOI] [PubMed] [Google Scholar]
- 8.Hughes KC, Gao X, Baker JM, et al. Non-motor features of Parkinson's disease in a nested case-control study of US men. J Neurol Neurosurg Psychiatry 2018;89:1288–1295. [DOI] [PubMed] [Google Scholar]
- 9.Ascherio A, Zhang SM, Hernan MA, et al. Prospective study of caffeine consumption and risk of Parkinson's disease in men and women. Ann Neurol 2001;50:56–63. [DOI] [PubMed] [Google Scholar]
- 10.Chen H, Zhang SM, Hernan MA, Willett WC, Ascherio A. Dietary intakes of fat and risk of Parkinson's disease. Am J Epidemiol 2003;157:1007–1014. [DOI] [PubMed] [Google Scholar]
- 11.Zhang D, Jiang H, Xie J. Alcohol intake and risk of Parkinson's disease: a meta-analysis of observational studies. Mov Disord 2014;29:819–822. [DOI] [PubMed] [Google Scholar]
- 12.Chen H, O'Reilly E, McCullough ML, et al. Consumption of dairy products and risk of Parkinson's disease. Am J Epidemiol 2007;165:998–1006. [DOI] [PMC free article] [PubMed] [Google Scholar]
- 13.Gao X, Chen H, Fung TT, et al. Prospective study of dietary pattern and risk of Parkinson disease. Am J Clin Nutr 2007;86:1486–1494. [DOI] [PMC free article] [PubMed] [Google Scholar]
- 14.Cassani E, Barichella M, Ferri V, et al. Dietary habits in Parkinson's disease: adherence to Mediterranean diet. Parkinsonism Relat Disord 2017;42:40–46. [DOI] [PubMed] [Google Scholar]
- 15.Alcalay RN, Gu Y, Mejia-Santana H, Cote L, Marder KS, Scarmeas N. The association between Mediterranean diet adherence and Parkinson's disease. Mov Disord 2012;27:771–774. [DOI] [PMC free article] [PubMed] [Google Scholar]
- 16.Maraki MI, Yannakoulia M, Stamelou M, et al. Mediterranean diet adherence is related to reduced probability of prodromal Parkinson's disease. Mov Disord 2019;34:48–57. [DOI] [PubMed] [Google Scholar]
- 17.Boeve BF, Molano JR, Ferman TJ, et al. Validation of the Mayo Sleep Questionnaire to screen for REM sleep behavior disorder in an aging and dementia cohort. Sleep Med 2011;12:445–453. [DOI] [PMC free article] [PubMed] [Google Scholar]
- 18.Boeve BF, Molano JR, Ferman TJ, et al. Validation of the Mayo Sleep Questionnaire to screen for REM sleep behavior disorder in a community-based sample. J Clin Sleep Med 2013;9:475–480. [DOI] [PMC free article] [PubMed] [Google Scholar]
- 19.Johns MW. A new method for measuring daytime sleepiness: the Epworth Sleepiness Scale. Sleep 1991;14:540–545. [DOI] [PubMed] [Google Scholar]
- 20.Erb C, Adler M, Stubiger N, Wohlrab M, Zrenner E, Thiel HJ. Colour vision in normal subjects tested by the colour arrangement test “Roth 28-hue desaturated.” Vis Res 1998;38:3467–3471. [DOI] [PubMed] [Google Scholar]
- 21.Berwick DM, Murphy JM, Goldman PA, Ware JE Jr, Barsky AJ, Weinstein MC. Performance of a five-item mental health screening test. Med Care 1991;29:169–176. [DOI] [PubMed] [Google Scholar]
- 22.Salvini S, Hunter DJ, Sampson L, et al. Food-based validation of a dietary questionnaire: the effects of week-to-week variation in food consumption. Int J Epidemiol 1989;18:858–867. [DOI] [PubMed] [Google Scholar]
- 23.Feskanich D, Rimm EB, Giovannucci EL, et al. Reproducibility and validity of food intake measurements from a semiquantitative food frequency questionnaire. J Am Diet Assoc 1993;93:790–796. [DOI] [PubMed] [Google Scholar]
- 24.Fung TT, Hu FB, McCullough ML, Newby PK, Willett WC, Holmes MD. Diet quality is associated with the risk of estrogen receptor-negative breast cancer in postmenopausal women. J Nutr 2006;136:466–472. [DOI] [PubMed] [Google Scholar]
- 25.Fung TT, McCullough ML, Newby PK, et al. Diet-quality scores and plasma concentrations of markers of inflammation and endothelial dysfunction. Am J Clin Nutr 2005;82:163–173. [DOI] [PubMed] [Google Scholar]
- 26.Chiuve SE, Fung TT, Rimm EB, et al. Alternative dietary indices both strongly predict risk of chronic disease. J Nutr 2012;142:1009–1018. [DOI] [PMC free article] [PubMed] [Google Scholar]
- 27.McCallum IJ, Ong S, Mercer-Jones M. Chronic constipation in adults. BMJ 2009;338:b831. [DOI] [PubMed] [Google Scholar]
- 28.Benjamini Y, Yekutieli D. The control of the false discovery rate in multiple testing under dependency. Ann Statistics 2001;29:1165–1188. [Google Scholar]
- 29.Jimenez-Jimenez FJ, Alonso-Navarro H, Garcia-Martin E, Agundez JAG. Alcohol consumption and risk for Parkinson's disease: a systematic review and meta-analysis. J Neurol 2018;266:1821–34. [DOI] [PubMed] [Google Scholar]
- 30.Martinez-Martin P. The importance of non-motor disturbances to quality of life in Parkinson's disease. J Neurol Sci 2011;310:12–16. [DOI] [PubMed] [Google Scholar]
- 31.Clairembault T, Leclair-Visonneau L, Neunlist M, Derkinderen P. Enteric glial cells: new players in Parkinson's disease? Mov Disord 2015;30:494–498. [DOI] [PubMed] [Google Scholar]
- 32.Klingelhoefer L, Reichmann H. Pathogenesis of Parkinson disease: the gut-brain axis and environmental factors. Nat Rev Neurol 2015;11:625–636. [DOI] [PubMed] [Google Scholar]
- 33.Mulak A, Bonaz B. Brain-gut-microbiota axis in Parkinson's disease. World J Gastroenterol 2015;21:10609–10620. [DOI] [PMC free article] [PubMed] [Google Scholar]
- 34.Pan-Montojo F, Schwarz M, Winkler C, et al. Environmental toxins trigger PD-like progression via increased alpha-synuclein release from enteric neurons in mice. Sci Rep 2012;2:898. [DOI] [PMC free article] [PubMed] [Google Scholar]
- 35.Sampson TR, Debelius JW, Thron T, et al. Gut microbiota regulate motor deficits and neuroinflammation in a model of Parkinson's disease. Cell 2016;167:1469–1480 e1412. [DOI] [PMC free article] [PubMed] [Google Scholar]
- 36.De Filippis F, Pellegrini N, Vannini L, et al. High-level adherence to a Mediterranean diet beneficially impacts the gut microbiota and associated metabolome. Gut 2016;65:1812–1821. [DOI] [PubMed] [Google Scholar]
- 37.Dai J, Jones DP, Goldberg J, et al. Association between adherence to the Mediterranean diet and oxidative stress. Am J Clin Nutr 2008;88:1364–1370. [DOI] [PMC free article] [PubMed] [Google Scholar]
- 38.Hornedo-Ortega R, Cerezo AB, de Pablos RM, et al. Phenolic compounds characteristic of the Mediterranean diet in mitigating microglia-mediated neuroinflammation. Front Cell Neurosci 2018;12:373. [DOI] [PMC free article] [PubMed] [Google Scholar]
- 39.Fujishiro H, Nakamura S, Sato K, Iseki E. Prodromal dementia with Lewy bodies. Geriatr Gerontol Int 2015;15:817–826. [DOI] [PubMed] [Google Scholar]
- 40.Savica R, Grossardt BR, Bower JH, Boeve BF, Ahlskog JE, Rocca WA. Incidence of dementia with Lewy bodies and Parkinson disease dementia. JAMA Neurol 2013;70:1396–1402. [DOI] [PMC free article] [PubMed] [Google Scholar]
- 41.Chasan-Taber S, Rimm EB, Stampfer MJ, et al. Reproducibility and validity of a self-administered physical activity questionnaire for male health professionals. Epidemiology 1996;7:81–86. [DOI] [PubMed] [Google Scholar]
- 42.Rimm EB, Giovannucci EL, Stampfer MJ, Colditz GA, Litin LB, Willett WC. Reproducibility and validity of an expanded self-administered semiquantitative food frequency questionnaire among male health professionals. Am J Epidemiol 1992;135:1114–1126. [DOI] [PubMed] [Google Scholar]
- 43.Wolf AM, Hunter DJ, Colditz GA, et al. Reproducibility and validity of a self-administered physical activity questionnaire. Int J Epidemiol 1994;23:991–999. [DOI] [PubMed] [Google Scholar]
- 44.Colditz GA, Martin P, Stampfer MJ, et al. Validation of questionnaire information on risk factors and disease outcomes in a prospective cohort study of women. Am J Epidemiol 1986;123:894–900. [DOI] [PubMed] [Google Scholar]
Associated Data
This section collects any data citations, data availability statements, or supplementary materials included in this article.
Data Availability Statement
The data analyzed in the current study are not publicly available because of restricted access, but further information about the datasets is available from the corresponding author on reasonable request.


