

Summary
Mitochondria require nicotinamide adenine dinucleotide (NAD+) in order to carry out the fundamental processes that fuel respiration and mediate cellular energy transduction. Mitochondrial NAD+ transporters have been identified in yeast and plants 1,2 but their very existence is controversial in mammals 3–5. Here we demonstrate that mammalian mitochondria are capable of taking up intact NAD+ and identify SLC25A51 (an essential 6,7 mitochondrial protein of previously unknown function, also known as MCART1) as a mammalian mitochondrial NAD+ transporter. Loss of SLC25A51 decreases mitochondrial but not whole-cell NAD+ content, impairs mitochondrial respiration, and blocks the uptake of NAD+ into isolated mitochondria. Conversely, overexpression of SLC25A51 or a nearly identical paralog, SLC25A52, increases mitochondrial NAD+ levels and restores NAD+ uptake into yeast mitochondria lacking endogenous NAD+ transporters. Together, these findings identify SLC25A51 as the first transporter capable of importing NAD+ into mammalian mitochondria.
Nicotinamide adenine dinucleotide (NAD+) is vital for the metabolic reactions that fuel all life. NAD+ functions as an electron acceptor (through hydride transfer) for hundreds of reactions, becoming reduced to NADH in the process. NADH subsequently provides reducing power throughout the cell, including to complex I of the mitochondrial electron transport chain to drive cellular respiration. Due to the requirement for NAD+ in both glycolysis and mitochondrial respiration, cells possess no sustainable means to produce ATP in the absence of NAD+. In addition to its redox roles, NAD+ is also a substrate for multiple classes of signaling enzymes including sirtuins, ADP-ribosyltransferases, and cyclic ADP-ribose synthases 8. Thus, changes in NAD+ availability can influence cellular behavior even at concentrations that do not interfere directly with metabolism, whereas a complete lack of NAD+ is lethal.
Despite more than 100 years of research on NAD+ 3, and intense focus on NAD+-dependent processes within the mitochondrial matrix, the question of how mammalian mitochondria obtain their NAD+ pool has never been answered. The mitochondrial NAD+ pool is distinct from that in the cytosol 4,9,10 and may be regulated independently under stress 11. Yeast and plants possess well-characterized transporters embedded in the inner mitochondrial membrane 1,2. However, no obvious homologues exist in mammals, and the most closely-related transporter has instead been characterized as a mitochondrial carrier for folate 12 and flavin adenine dinucleotide (FAD) 13. Based on the existence of a mitochondrial nicotinamide mononucleotide adenylyltransferase (NMNAT3), it has been suggested that mitochondria might take up cytosolic nicotinamide mononucleotide (NMN) and subsequently convert it to NAD+ 14. A minority of nicotinamide phosphoribosyltransferase (NAMPT) also co-purifies with liver mitochondria, leading to the alternate suggestion that mitochondria might possess an intact pathway to synthesize NAD+ directly from nicotinamide 4. However, mitochondria from multiple mammalian cell types lack active NAMPT, arguing against this as a universal mechanism 10,15–17. In addition, mice lacking NMNAT3 survive to adulthood and have no overt change in mitochondrial NAD+ content 18,19. We recently showed that isolated mitochondria do not synthesize NAD+ within the matrix from exogenous nicotinamide or NMN, but that stable-isotope labeled NAD+ can be taken up from the cytosol 15. Thus, our data support the existence of a mammalian mitochondrial NAD+ transporter, but its molecular identity has remained a mystery.
Here we identify SLC25A51 as a mammalian mitochondrial NAD+ transporter. We considered SLC25A51 as a candidate because it was identified as an essential gene in several genome-wide screens 6,7 and is a member of the mitochondrial carrier family that has not previously been assigned a function (Extended Data Table 1). We show that expression of SLC25A51 dictates mitochondrial NAD+ levels and uptake capacity in mammalian cells and complements yeast lacking their known mitochondrial NAD+ transporters. A nearly identical paralog, SLC25A52, is also capable of restoring NAD+ uptake in yeast, but is not widely expressed 20. Thus, SLC25A51-dependent direct uptake is an important mechanism by which mammalian mitochondria obtain NAD+.
SLC25A51 sets mitochondrial NAD+ levels
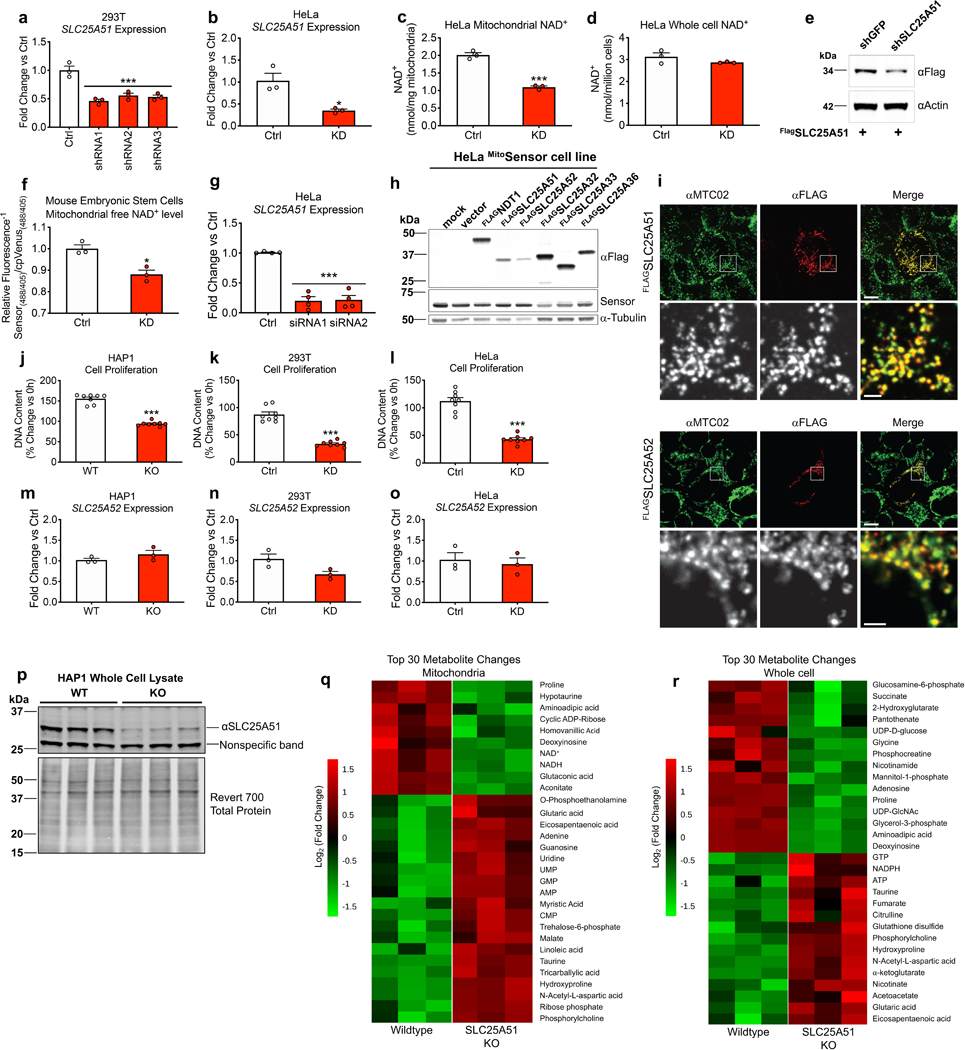
To test whether SLC25A51 plays a role in mitochondrial NAD+ homeostasis, we performed knockdown experiments in human cell lines using multiple distinct shRNA and siRNA sequences. We found that SLC25A51 is required for the maintenance of mitochondrial NAD+ levels (Fig. 1a, Extended Data Fig. 1a-c) but does not affect total cellular NAD+ content (Fig. 1b, Extended Data Fig. 1d). To measure mitochondrial free NAD+ concentrations in intact cells and avoid any artifacts that might be produced during isolation, we next employed two distinct mitochondrially-targeted NAD+ biosensors. The first sensor couples an engineered NAD+-binding domain with circularly-permutated Venus (cpVenus) to report local concentrations of free NAD+ via ratiometric changes in the fluorescence intensity 9. This method confirmed a decline in mitochondrial free NAD+ levels in SLC25A51-deficient tumor cells and mouse embryonic stem cells (Fig. 1c, Extended Data Fig. 1e-g). Overexpression of either SLC25A51 or its nearly identical paralog, SLC25A52, was sufficient to increase mitochondrial free NAD+ levels, similar to the effect of overexpressing the yeast mitochondrial NAD+ transporter NDT1, whereas candidates with greater homology to NDT1 had no effect (Fig. 1d, Extended Data Fig. 1h). The effects of SLC25A51 and SLC25A52 on mitochondrial free NAD+ levels were confirmed using the FRET-based NAD+-Snifit biosensor NAD+ (Fig. 1e,f) 21. Both Flag-HA-SLC25A51 and Flag-HA-SLC25A52 co-localized with the mitochondrial marker MTC02 (Extended Data Fig. 1i). We focused primarily on SLC25A51, rather than SLC25A52 because the latter exhibits a more restricted expression pattern 20 and has not emerged as essential in screens performed to date 6,7,22,23.
Figure 1. SLC25A51 and SLC25A52 expression dictates mitochondrial NAD+ concentration.

a, NAD+ content of isolated mitochondria (n=4) and b, whole cell lysates (n=3) from HEK293T cells stably depleted of SLC25A51 (shRNA1–3) and stably expressing non-targeting control shRNA (Ctrl). c, Mitochondrial free NAD+ levels in HeLa cells transfected with siRNA targeting SLC25A51 (siRNA1 and 2) and non-targeting siRNA (Ctrl), measured by the mitochondrially-targeted cpVenus NAD+ biosensor, (n=4). d, Mitochondrial free NAD+ levels in HeLa cells overexpressing NDT1 (yeast mitochondrial NAD+ transporter) (n=24), SLC25A32 (n=4), SLC25A33 (n=4), SLC25A36 (n=4), SLC25A51 (n=4), SLC25A52 (n=4), and vector control (n=24) measured by the cpVenus NAD+ biosensor. e, Mitochondrial free NAD+ levels in HEK293 cells with stable shRNA-mediated knockdown of SLC25A51 (n=3) and stable expression of non-targeting shRNA (Ctrl) (n=3). f, Mitochondrial free NAD+ levels in U2OS cells overexpressing SLC25A51, SLC25A52 and vector control (n=6), as measured by NAD+-Snifit. g, Mitochondrial (n=3) and h, whole cell NAD+ content (n=3) of lysates collected from CRISPR/Cas9-mediated SLC25A51 knockout (KO) and wildtype (WT) HAP1 cells. i, Mitochondrial (n=3) and j, whole cell (n=3) metabolomes of HAP1 SLC25A51 KO and WT cells measured by liquid chromatography–mass spectrometry. Significantly changed metabolites were determined by setting a false discovery rate of 1% (two-stage step-up method of Benjamini, Krieger, and Yekutieli) and are represented in a volcano plot. n represents biological independent replicates. Data represented as mean ± SEM. P values were determined by unpaired, two-tailed Student’s t-test (for two groups) or one-way ANOVA with multiple comparisons analysis using Dunnett’s method (for groups of three or more). **P<0.01, ***P<0.001 vs. control, vector, or wildtype (exact P values are provided in the source data).
To understand the consequences of total SLC25A51 loss, we studied knockout (KO) cells generated by CRISPR in HAP1 cells, where SLC25A51 was previously reported to be non-essential 22. Targeted cells survived and proliferated, albeit at a reduced rate, similar to cell lines with shRNA-based knockdowns (Extended Data Fig. 1j-l). No compensatory upregulation of SLC25A52 was detected in any of the cell lines (Extended Data Fig. 1m-o), although its expression may have contributed to the survival of KO cells and may account for a residual band that was apparent when blotting for SLC25A51 (Extended Fig. 1p). SLC25A51 KO cells exhibited loss of mitochondrial NAD+ (Fig. 1g), but not total cellular NAD+ (Fig. 1h). Metabolomic profiling revealed that only NAD+, NADH and the NAD+-derived metabolite cyclic ADP-ribose were significantly changed in mitochondrial extracts (Fig. 1i, Extended data Fig. 1q). In contrast, NAD+ and NADH levels were unchanged in whole cell extracts, while several sugars and nucleotide-related metabolites were decreased, and hydroxyproline increased, likely reflecting a combination of impaired mitochondrial metabolism and increased reliance on glycolytic energy production (Fig. 1j, Extended data Fig. 1r). Thus, loss of SLC25A51 results in selective loss of NAD+ from the mitochondrial fraction.
Loss of SLC25A51 impairs mitochondria
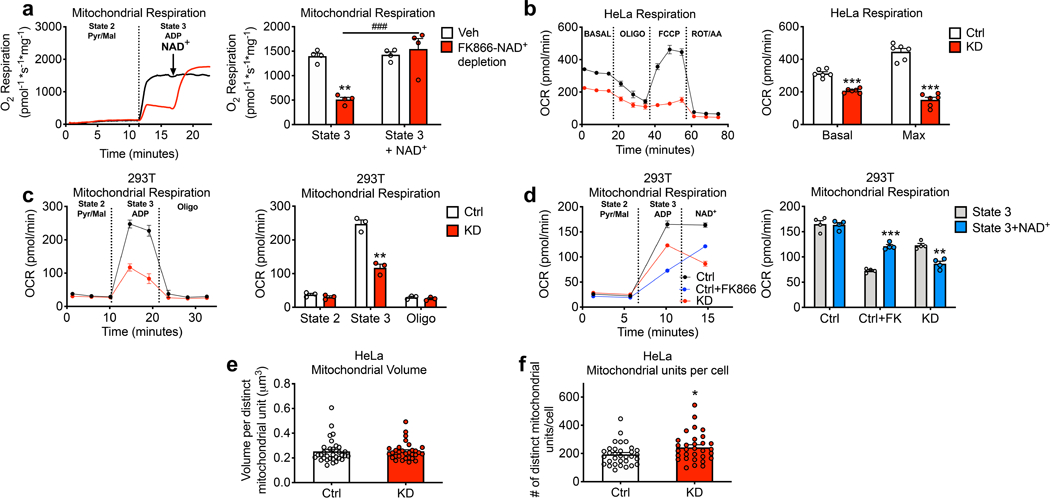
Mitochondrial NAD+ is essential for the tricarboxylic acid cycle to fuel oxidative phosphorylation. Loss of NAMPT activity causes NAD+ deficiency and impairs mitochondrial respiration in mammalian cells and tissues 24,25. Exogenous NAD+ was sufficient to rescue respiratory capacity in mitochondria isolated from cells treated with NAMPT inhibitor FK866 (Extended Data Fig. 2a), similar to a previous report using mitochondria isolated from cells cultured under nutrient-poor conditions 26. SLC25A51 deficiency (Fig. 2a, Extended Data Fig. 2b,c) or KO (Fig. 2b) impaired basal and maximal respiratory capacity in cells and complex I-dependent respiration in isolated mitochondria. However, exogenous NAD+ was insufficient to restore respiration in mitochondria from cells with SLC25A51 knockdown (Extended Data Fig. 2d). Adenoviral expression of SLC25A51 restored respiration in KO cells, and further increased the respiration of wild type cells when given at a low, but not a high multiplicity of infection (Fig. 2d). This is consistent with prior observations that excess NDT1/2 activity decreases mitochondrial efficiency in yeast 27 and impairs respiration in mammalian cells 5. Thus, expression of SLC25A51 profoundly impacts cellular respiration.
Figure 2. SLC25A51 modulates mitochondrial respiratory capacity.

Oxygen consumption rate (OCR) for a, SLC25A51 shRNA-depleted HEK293T (n=5), b, HAP1 SLC25A51 KO cells (n=6), c, HAP1 SLC25A51 KO cells rescued using adenovirus-mediated SLC25A51 expression (multiplicity of infection or MOI-4) (n=6), and d, HAP1 wildtype cells with low (MOI-2), medium (MOI-4) and high (MOI-6) overexpression of SLC25A51 (n=6) (80,000 cells per well). Basal OCR was measured prior to the addition of treatments and maximal respiration was measured after the sequential addition of oligomycin (Oligo, ATP synthase inhibitor) and FCCP (uncoupler). Rotenone (Rot) and Antimycin A (AA) were then added as a control to completely block mitochondrial oxygen consumption. e, Quantification of mitochondrial membrane potential using the cell permeant fluorescent dye tetramethylrhodamine, ethyl ester (TMRE) (n=4). f, Mitochondrial content measured by fluorescence intensity of the mitochondrial localization dye, MitoTracker Deep Red (n=4). Relative fluorescence intensities were determined by flow cytometry. g, Cumulative mitochondrial volume per cell quantified from confocal image reconstructions of mitochondrial voxels in SLC25A51 shRNA knockdown (n=31 cells) and control (n=32 cells) HeLa cells. h, Representative images of mitochondrial voxels (mitochondrial marker, anti-MTC02) reconstructed using 0.1 μm optical slices and Imaris Surface Analyses. Scale bar: top, 5 μm; bottom, 1 μm. i, Western blot of mitochondrial oxidative phosphorylation complexes in HAP1 SLC25A51 KO cells. TOM20 was blotted as a mitochondrial loading control. n represents biological independent replicates unless otherwise indicated. Data represented as mean ± SEM. P values were determined by unpaired, two-tailed Student’s t-test or two-way ANOVA with multiple comparisons analysis using Dunnett’s method (for groups of three or more). *P<0.05, **P<0.01, and ***P<0.001 vs. control, wildtype, or KO (exact P values are provided in the source data).
In contrast to respiratory capacity, mitochondrial membrane potential was maintained after SLC25A51 loss. Staining with tetramethylrhodamine ethylester (TMRE), which accumulates in mitochondria proportionally to their membrane potential, was modestly increased in SLC25A51 KO cells (Fig. 2e). This likely reflects an increase in mitochondrial abundance, rather than membrane potential, since a similar increase in signal was noted for cells stained with MitoTracker dye (Fig. 2f). A modest increase in mitochondrial volume was confirmed by staining mitochondria in cells with shRNA-mediated depletion of SLC25A51 using anti-MTC02 antibody and performing 3D reconstructions (Fig. 2g,h Extended Data Fig. 2e,f). Interestingly, SLC25A51 is reported to interact with C7orf55, an assembly factor for complex V of the electron transport chain, and Bola1, a protein that forms an iron-sulfur linked complex with glutaredoxin 5 and may be involved in oxidative stress resistance 28. We detected no apparent change in the expression of the complex V subunit ATP5A (Fig. 2i) and note that uncoupling (bypassing complex V) did not restore respiration in SLC25A51 deficient cells (Fig. 2a,b, Extended Fig. 2b). However, expression of complex I, II, and IV subunits was reduced (Fig 2i), and we cannot rule out a contribution of changes in iron-sulfur cluster metabolism or oxidative stress to the observed effects of SLC25A51 deficiency.
SLC25A51 drives mitochondrial NAD+ uptake
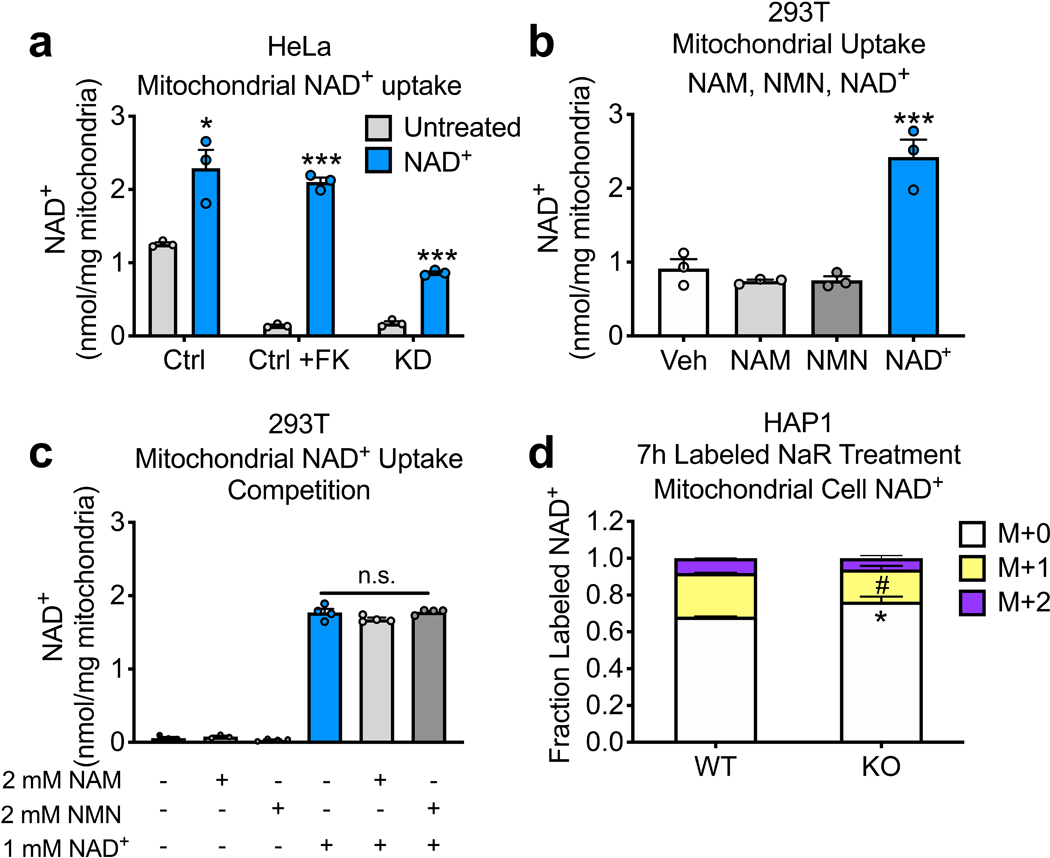
To test whether SLC25A51 mediates uptake of NAD+ into mammalian mitochondria, we isolated organelles from SLC25A51-depleted and SLC25A51 KO cells and incubated with exogenous NAD+. Exogenous NAD+ increased the matrix NAD+ content in control mitochondria or in mitochondria that had low NAD+ content due to inhibition of NAD+ synthesis with FK866 in the parent cells (Fig. 3a,b, Extended Data Fig. 3a). This effect was specific to NAD+, as it was not recapitulated with either nicotinamide or NMN (Extended Data Fig. 3b). Moreover, addition of excess nicotinamide or NMN failed to compete with uptake of NAD+ (Extended Data Fig. 3c). In mitochondria isolated from SLC25A51 deficient cells, exogenous NAD+ did not increase the matrix NAD+ content (Fig. 3a,b). Further, re-expression of SLC25A51 in depleted or KO cells restored uptake of exogenous NAD+ (Fig. 3a,b). Yeast NDT1, a bona fide mitochondrial NAD+ transporter 2, similarly rescued NAD+ uptake in SLC25A51 deficient cells (Fig. 3c). This indicates that a lack of transport activity is likely the defect limiting mitochondrial NAD+ accumulation in the absence of SLC25A51. Consistent with a direct role for SLC25A51 in NAD+ transport, overexpression was sufficient to increase uptake of exogenous NAD+ into isolated mitochondria (Fig. 3d). Finally, we used a mitochondrially-targeted biosensor in intact cells to show that incubation with the NAD+ precursor nicotinamide riboside (NR) was sufficient to restore mitochondrial NAD+ levels in an SLC25A51-dependent manner (Fig. 3e). Together, these data indicate that the ability of mitochondria to import NAD+ is dependent on the expression of either SLC25A51 or a protein with NAD+ transporter activity.
Figure 3. SLC25A51 expression is required for NAD+ uptake in isolated mitochondria.

NAD+ content of isolated mitochondria measured before and after a 40-min incubation with 1 mM NAD+ from a, HEK293T control (Ctrl) cells, control + FK866 (Ctrl+FK) to deplete mitochondrial NAD+, SLC25A51 shRNA knockdown (KD) cells, and SLC25A51 KD + murine Slc25a51 cDNA (KD+A51) cells; b, HAP1 wildtype (WT) cells, WT + FK866 (WT+FK), SLC25A51 (KO) knockout cells, and KO cells transduced with adenovirus encoding SLC25A51 (KO+A51); and c, HEK293T control (Ctrl) cells, control +FK866 (Ctrl+FK), SLC25A51 (KD) cells, and SLC25A51 KD cells + cDNA encoding the yeast mitochondrial NAD+ transporter NDT1 (KD+NDT1). d, NAD+ content of mitochondria isolated from HEK293T control cells and cells overexpressing SLC25A51 (OE) before and after a 20-min incubation with 1 mM NAD+ (a-d; n=3 independent experiments). e, HeLa cells were transfected 3 days in advance with non-targeting siRNA (siNT) and siRNA targeting SLC25A51 (siA51), or NAMPT (siNampt) and mitochondrial free NAD+ levels were measured after 16-hours of nicotinamide riboside (NR) treatment (n=3). f, HEK293 cells stably expressing Arabidopsis thaliana NDT2-FLAG (AtNDT2), SLC25A32-FLAG, SLC25A51-FLAG or g, SLC25A52-FLAG were transfected with mitochondrially-targeted eGFP (mito-eGFP) or the catalytic domain of PARP1 (mitoPARP1cd). Mitochondrial PARylation levels reflect mitochondrial NAD+ availability. h, Mitochondrial NAD+ content after 7-hours of treatment with doubly isotopically labeled nicotinic acid riboside (NaR). i, Whole cell and j, mitochondrial fractional labeling patterns normalized to total ion counts in WT to reflect relative abundance of NAD+ after NaR treatment (n=3). n represents biological independent replicates unless otherwise indicated. Data represented as mean ± SEM. P values were determined by unpaired, two-tailed Student’s t-test. *P<0.05, **P<0.01, and ***P<0.001 vs untreated, wildtype M+0; ###P<0.001 vs control + NAD+, wildtype M+1; ^^^P<0.001 vs wildtype M+2 (exact P values are provided in the source data).
To further investigate the capabilities of SLC25A51 and SLC25A52 to mediate mitochondrial NAD+ transport in intact cells, we employed a mitochondrially-targeted poly ADP-ribose polymerase (mitoPARPcd) 29. This reporter system is based on the continuous consumption of mitochondrial NAD+ and its preference for automodification with poly ADP-ribose (PAR). Thus, the steady-state level of PAR is an indication of the ability of mitochondria to replenish the NAD+ pool. Overexpression of SLC25A51 or SLC25A52 dramatically enhanced the signal of the mitoPARPcd reporter, similar to the effect of the Arabidopsis thaliana NAD+ transporter AtNDT2 (Fig. 3f,g). Expression of SLC25A32, the mammalian mitochondrial carrier most homologous to AtNDT2, had no effect as reported previously 5.
Nicotinic acid riboside (NaR) is converted to NAD+ via the cytosolic enzyme NAD+ synthase. By isotopically labeling both the nicotinic acid and ribose moieties, we can monitor a pool of NAD+ synthesized in the cytosol, which we previously demonstrated is able to enter the mitochondria 15. We incubated wild type and SLC25A51 KO HAP1 cells with double-labeled NaR and measured the appearance of double-labeled NAD+ in the mitochondria. While NaR increased the total abundance of mitochondrial NAD+ in wild type cells, it had no effect in SLC25A51 KO cells (Fig. 3h). Whole cell NAD+ pools were labeled to a similar extent in both cell populations (Fig. 3i), but as expected, a substantial portion of the labeled NAD+ entered the mitochondria only in wild type cells and not in the SLC25A51 KO cells (Fig. 3j). Notably the small amount of NAD+ that was present in the KO cells still partially labeled, suggesting that even the residual NAD+ is taken up directly, whether via SLC25A52 or another mechanism, and not synthesized within the mitochondria (Extended Data Fig. 3d).
SLC25A51 complements NDT1/2 deficiency
To explore the function of SLC25A51 in a system that lacks transport activity, we developed a recombinant assay using 3H-NAD+ in yeast deleted for the genes encoding both established mitochondrial NAD+ transporters, NDT1 and NDT2 (DKO) (Extended Data Fig. 4a-e). We isolated mitochondria from either wildtype or DKO yeast in mid-exponential growth and incubated with 100 μM NAD+ (3H-NAD+ traced). Wildtype mitochondria readily imported NAD+, with an initial rate of 7.6 ± 1.5 pmol/min (Fig. 4a-c, Extended Data Table 2). There was minimal uptake of NAD+ by DKO mitochondria over 30 minutes. Ectopic expression of human SLC25A51 in the DKO strain fully rescued mitochondrial NAD+ uptake (initial rate 12.1 ± 2.8 pmol/min), and SLC25A52 provided a partial rescue (initial rate 4.3 ± 1.5 pmol/min) (Fig. 4a-c, Extended Data Table 2). As expected, excess unlabeled NAD+ competed with import of 3H-NAD+ into DKO cells rescued with SLC25A51 (Extended Data Fig. 5a). On the other hand, the initial rate of uptake was not significantly altered by up to 500 μM NMN or 100 μM NADH (Extended Fig. 5b,c, Extended Data Table 2), supraphysiological concentrations exceeding free cytosolic levels by 1–2 orders of magnitude 21,30–32. Consistent with the ability of human SLC25A51 and SLC25A52 to transport NAD+ into mitochondria, expression of either in the DKO strain was sufficient to restore mitochondrial NAD+ levels (Fig. 4d). While proof that reconstituted SLC25A51 is sufficient to transport NAD+ in an isolated system is still lacking, these experiments demonstrate that it can functionally replace bona fide mitochondrial NAD+ transporters. To define kinetic parameters for SLC25A51, we determined the abundance of SLC25A51 in mitochondrial preparations. We obtained mass spectrometry data for 15 mitochondrial proteins of similar molecular weights whose levels did not fluctuate across experimental conditions. Peptide counts were mapped onto a meta-dataset of absolute yeast protein abundances 33 to obtain a standard curve that was then used to estimate the concentration of SLC25A51 in each sample (Extended Data Fig. 5d), yielding a value of approximately 475 ng (~14 pmol) of SLC25A51 per milligram of isolated mitochondria. We measured NAD+ uptake by SLC25A51 at 1 minute, 3 minutes, and 30 minutes using a range of NAD+ concentrations, 100 μM, 200 μM, 300 μM, 500 μM, and 1000 μM NAD+ (Extended Fig. 5e). Initial rates were interpolated from the linear portions of the curves between 0.1 – 0.2 minutes. We plotted mean initial rates against NAD+ concentrations in a double reciprocal (Lineweaver-Burk) plot and used the Michaelis-Menten equation to determine a KM, apparent (NAD+) for SLC25A51 of ~ 200 μM ± 60 μM and its Vmax, apparent approximated 1200 pmol sec−1 mg−1 ± 300 pmol sec−1 (Extended Data Fig. 5f). Together, these data demonstrate that human SLC25A51 and human SLC25A52 can directly transport NAD+ into the mitochondrial matrix.
Figure 4. SLC25A51 is sufficient for transport of NAD+ into yeast mitochondria lacking their endogenous transporters, NDT1 and NDT2.

3H-NAD+ uptake measured in isolated mitochondria from wildtype (n=4 independent experiments), NDT1 and NDT2 double knockout (DKO) (n=4 independent experiments), and a, DKO + overexpression of SLC25A51 (n=4 independent experiments) or b, DKO + overexpression of SLC25A52 (n=3 independent experiments) yeast; grey line indicates mean basal radioactivity in DKO samples. P values were determined by a two-way ANOVA with multiple comparisons analysis using Dunnett’s method. c, Initial rates of NAD+ uptake into isolated yeast mitochondria (n=4 independent experiments for WT, DKO, and DKO + SLC25A51; n=3 for DKO + SLC25A52). d, NAD+ content measured from isolated yeast mitochondria (n=3 biological independent replicates). P values were determined by one-way ANOVA with multiple comparisons analysis using Tukey’s method. Data represented as mean ± SEM. **P<0.01, and ***P<0.001 vs DKO, ##P<0.01 and ###P<0.001 vs wildtype (exact P values are provided in the source data).
Conclusion
Despite the central role of NAD+ in mitochondrial metabolism, the mechanism by which mammalian organelles obtain this dinucleotide has never been elucidated 9,15. Here we have shown that SLC25A51 and its paralog, SLC25A52, are both capable of mediating mitochondrial uptake of NAD+, and that SLC25A51 is required for the maintenance of normal mitochondrial NAD+ levels in human cells. While these data do not exclude the possibility that other modes of mitochondrial NAD+ replenishment exist, the essential nature of SLC25A51 across multiple cell lines suggest that direct SLC25A51-mediated uptake is a major mechanism responsible for the generation of the mitochondrial NAD+ pool in mammals.
Methods
Cell Culture
HEK293T (ATCC: CRL-3216), HEK293 (ATCC: CRL-1573), HeLa (ATCC: CCL-2), U2OS (ECACC: 92022711) cells were cultured in either Dulbecco’s modified Eagle’s medium (DMEM) containing 4.5 g/L glucose, 1 mM sodium pyruvate and 4 mM L-glutamine with supplemented with 10% fetal bovine serum and 1x penicillin/streptomycin, or a custom DMEM formulation without antibiotics or niacinamide for nicotinamide riboside (NR) (3-(aminocarbonyl)-1-β-D-ribofuranosyl-pyridinium, CAS Number 1341–23-7) supplementation assays. HAP1 wildtype (Horizon Discovery: C631) and HAP1 SLC25A51 knockout 4bp deletion (Horizon Discovery: HZGHC001927c010) cells were cultured in Iscove’s Modified Dulbecco’s culture medium supplemented with 10% fetal bovine serum and 1x penicillin/streptomycin. Low-passage J1 murine embryonic stem cells (ATCC: SCRC-1010) were cultured in DMEM containing 4.5g/L glucose without pyruvate (Sigma #D5796), 20% fetal bovine serum (Sigma #12306C), 1X EmbryoMax Nucleoside Mix (Millipore #ES-008D), 1X Non-Essential Amino Acids Mix (Millipore #MS-001-C), 100 μM beta-mercaptoethanol (Sigma #M3148), and 7 × 10⁶ U recombinant murine LIF (Millipore #ESG1107). Cells were grown at 37°C with 5% CO2. After stable depletion or deletion of SLC25A51, medium was supplemented with 50 μg/mL uridine (1-[(2R,3R,4S,5R)-3,4-dihydroxy-5-(hydroxymethyl)oxolan-2-yl]pyrimidine-2,4-dione, CAS Number: 58–96-8) to improve cellular viability. To deplete NAD+, cells were treated with 100 nM FK866 (N-[4-(1-benzoyl-4-piperidinyl)butyl]-3-(3-pyridinyl)-2E-propenamide, CAS Number: 658084–64-1) for 18–24 hours.
Generation of NAD+ sensor cell lines
Clonal HeLa mitocpVenus and HeLa mitoSensor cell lines were generated by lentiviral transduction of HeLa cells (ATCC: CCL-2) with virus encoding mitocpVenus or mitoSensor at a MOI of approximately one. Stable integration was selected with 2.5 μg/mL puromycin ((2S)-2-amino-N-[(2S,3S,4R,5R)-5-[6-(dimethylamino)purin-9-yl]-4-hydroxy-2-(hydroxymethyl)oxolan-3-yl]-3-(4-methoxyphenyl)propanamide, CAS Number 58–58-2) for two weeks and individual clones were then isolated by dilution plating. Once colonies were established, 10 clonal lines were screened to confirm fluorescence and responses to FK866 treatment (10 nM, 16 hours).
A U2OS and HEK293 FlpIn T-Rex cell lines were generated as described previously 34. The Flp-In™ T-Rex™ System (ThermoFisher Scientific) was used to generate inducible U2OS and HEK293 Flp-In™ cell lines that express the NAD+ Snifit in the mitochondria. pcDNA5-FRT-Cox8-SPR-Halo-p30-SNAP19 and the Flp recombinase (pOG44) were co-transfected into the host FlpIn cell line following the manufacturer’s instructions. Homologous recombination between the FRT sites in pcDNA5-FRT-Cox8-SPR-Halo-p30-SNAP and the host cell chromosome, catalysed by the Flp recombinase expressed from pOG44, produced stable and inducible U2OS and HEK293 FlpIn cells. Cells were single-cell sorted before usage.
shRNA and siRNA knockdown
Cells were transduced with lentivirus encoding shRNA targeting against human SLC25A51 (Sigma, Mission shRNA).
TRCN0000060234: CCGGGCACTTATGTTTGGTCTGTATCTCGAGATACAGACCAAACATAAGTGCTTTTTG
TRCN0000060235: CCGGGCAACTTATGAGTTCTTGTTACTCGAGTAACAAGAACTCATAAGTTGCTTTTTG
TRCN0000060237: CCGGGCACTGAAATGTCATGGAATTCTCGAGAATTCCATGACATTTCAGTGCTTTTTG
Non-targeting control shGFP targeting sequence: GCAAGCTGACCCTGAAGTTCAT3
To generate stable knockdown cell lines, cells were selected with 2 μg/mL puromycin. Both gene expression and mitochondrial NAD+ levels were used to validate targeting sequences (shRNA1-sh234), (shRNA2-sh235), and (shRNA3-sh237). For human cell lines, TRCN0000060235 was used in figures simply referencing knockdown (KD). All of the analyses were conducted before the 5th passage after transduction.
Murine shRNA against Slc25a51:
To transiently deplete SLC25A51 expression and measure mitochondrial free NAD+, J1 mouse embryonic stem cells were co-transfected using linear polyethylenimine (MW 250,000) with plasmids encoding shRNA targeting murine Slc25a51 and either mitocpVenus-IRES-puromycinR or mitoSensor-IRES-puromycinR expressed from an EF1α promoter. Plasmids were transfected at a ratio of 3:1 shRNA:sensor. The shRNA or control shFF2 (targeting firefly luciferase) hairpins were flanked by microRNA-30 sequences and constitutively expressed via the UBC promoter from the 3’UTR of a puromycin-resistance cassette. Two days post-transfection, cells were selected with 1 μg/mL puromycin for an additional 48 hours.
Murine Slc25a51 hairpin:
GGTATATTGCTGTTGACAGTGAGCGAGGCCTTCGAGGGCCCATTAAGGTAGTGAAGCCACAGATGTACCTTAATGGGCCCTCGAAGGCATGCCTACTGCCTCGGACTTC
Non-targeting control shFF2 (firefly luciferase #2) hairpin:
GGTATATTGCTGTTGACAGTGAGCGAugguccaaccgacuaauacagTAGTGAAGCCACAGATGTActgtattagtcggttggaccaaTGCCTACTGCCTCGGACTTC
siRNA knockdown:
siGENOME siRNAs targeting human SLC25A51 (D-007358–01, D-007358–02), NAMPT (D-004581–01) and Non-Targeting Scramble controls (D-001206–14) were obtained from Dharmacon RNAi Technologies and resuspended at 20 μM in 10mM Tris pH 8.0 buffer. Lipofectamine RNAiMax transfection reagent (ThermoFisher Scientific) was used to transfect siRNA into cells. Cells were grown in DMEM complete media and incubated for 72 hours after treatment.
Expression plasmids
Human cDNA encoding SLC25A51 (NCBI: NM_033412) and SLC25A52 (NCBI: NM_001034172) were either purchased from Origene (SLC25A51: RC203348 or MR204144; SLC25A52: RC215808) or synthesized as double-stranded DNA fragments. Synthesized sequences are either codon-optimized for expression in S. cerevisiae or mammals. cDNA encoding NDT1 was obtained with gene-specific PCR from genomic DNA of BY4742 and expressed from its endogenous promoter. These genes were either cloned into pRS415 with HiFi assembly, or into pENTR-D-Topo (Gateway System, ThermoFisher Scientific). pENTR constructs were recombined using LR Clonase II into mammalian expression vectors.
Analysis of gene expression
RNA was isolated using the Qiagen RNeasy Mini Kit (Qiagen, #74104) and cDNA was generated using the Applied Biosystems High-Capacity cDNA Reverse Transcription Kit (Applied Biosystems, #4368814). qPCR analysis was conducted following the manufacturer’s instructions (Power Sybr, ThermoFisher Scientific #4367659). Human 18S was used as a house keeping control. To calculate fold change in mRNA expression, the 2−ΔΔCt method was used. Primers: yeast-codon optimized SLC25A51 (Fwd: ATAGGTGGCGAGTTTCAGAGTTT, Rev: TGAACGGTGATAGTTTAGGTGGG); yeast codon-optimized SLC25A52 (Fwd: CCATCACCTATCCGATCCAGAAG, Rev: TGGTGGCAGAATTCCTCTGTAAA); endogenous human SLC25A51 mRNA (Fwd: TACCAACACTTACCAGGCTTTCA, Rev: CAAGACATTGCTGAGTCCATTCC OR Fwd: CGCTGATGGGAAATCCAGTTA, Rev: CTGGAGTTTGGCAGGATGATAG); human SLC25A52 mRNA (Fwd: ATGGACTCGGGAAGAGAGAA, Rev: CTGGAGTTTGGCAGGATGATAG); human 18S mRNA (Fwd: TTGACGGAAGGGCACCACCAG, Rev: GCACCACCACCCACGGAATCG).
Lysis and Western Blotting
Cells were washed with ice-cold PBS and lysed directly in either RIPA buffer (Cell Signaling: #9806) with Halt Protease and Phosphatase Inhibitor (ThermoScientific, #78442) or 2X Laemmli sample buffer containing DTT. Protein samples were electrophoresed on 4–12% Bis-Tris protein gels (Invitrogen) or 10% Mini-PROTEAN TGX precast gel (BioRad) and transferred to 0.45 μm nitrocellulose or PVDF membrane (Bio-Rad). Membranes were blocked with 5% BSA or 5% milk in Tris-buffered saline (TBS) pH 7.6 containing 0.1% (v/v) Tween 20 (TBST) or LiCOR blocking buffer. Antibodies were prepared in 1% BSA or 1:1 LiCOR Blocking Buffer in TBST. Dilutions were as follows: anti-SLC25A51 (ProSci, #55–424, 1:200), anti-Flag M2 (Sigma, #F1804, 1:3,000), anti-α-Tubulin (Sigma, #T9026, 1:3,000), anti-Total OXPHOS (Abcam, #ab110413, 1:2,000), anti-TOM20 (Santa Cruz Biotechnology, #sc-17764), anti-PAR 10H (Enzo, #LX-804–220-R100, 1:6,000), anti-GFP JL-8 (Takara Clontech, #632381, 1:15,000), anti-SC2 (Novus Bio, #NBP1–92465, 1:1,000), anti-Actin (Abcam, #ab14128, 1:1000), anti-MTC02 (Abcam, #ab9479, 1:1000), anti-CoxIV (Abcam, #ab33985, 1:1000), anit-β-tubulin (Sigma, #T5293, 1:10,000) and anti-mouse IgG H&L IRDye® 800CW (Abcam, #ab216773, 1:10,000), IRDye® 680RD Goat anti-Mouse IgG (LiCOR, #926–68070, 1:12,000), IRDye® 800CW Donkey anti-Rabbit IgG (LiCOR, #926–32213, 1:12,000). Total protein loading was determined using Revert 700 Total Protein Dye (LiCOR, #926–11010). Membranes were imaged using a LiCOR Odyssey Clx or a ChemiDoc XRS+ imaging system (Bio-Rad).
Overexpression of SLC25A51
SLC25A51 was cloned into pAd/CMV/V5-dest (Invitrogen, V49320) from the entry plasmid Gateway PLUS shuttle clone for SLC25A51 (NM_033412.3) (Genecopoeia, #GC-T0831) by recombination using LR Clonase II (Gateway system; Invitrogen, #11791020. pAd/CMV/V5-dest containing SLC25A51 was used to generate adenovirus in HEK293T cells. Adenovirus titer was determined, and cells were treated with adenovirus encoding SLC25A51 at a multiplicity of infection (MOI) ranging from 2–6. 16–20 hrs after transduction, the virus-containing medium was removed, and new medium was added. To restore SLC25A51 expression in SLC25A51 knockdown cells, a plasmid encoding murine Slc25a51 was transfected into cells using Fugene 6 (1:3 DNA:Fugene ratio) (Promega, #E269A). Cells were transfected or transduced 48–72 hours prior to the experiment. A stable SLC25A51 overexpression cell line was generated using genomic integration with lentivirus encoding SLC25A51 in HEK293T cells. After transduction, the cell line was selected using puromycin as described above.
NAD+ measurement in extracts
Cells and mitochondria were extracted with ice-cold 0.6 N perchloric acid. NAD+ was measured after extraction by an enzymatic cycling assay in a 96-well format. Standards or diluted sample extracts (at least 1:10 in in 100 mM phosphate buffer, pH 8.0) were combined with 95 μl of cycling mixture (2% ethanol, 100 μg/mL alcohol dehydrogenase, 10 μg/mL diaphorase, 20 μM resazurin, 10 μM flavin mononucleotide, 10 mM nicotinamide, 0.1% BSA in 100 mM phosphate buffer, pH 8.0). The rate of resorufin accumulation was measured by comparing fluorescence excitation at 544 nm and emission at 590 nm before and after incubation of the cycling reaction for 15 minutes at room temperature.
Mitochondrial NAD+ measurements using the NAD+ biosensor and semisynthetic NAD+-Snifit
Clonal Hela lines stably expressing mitocpVenus or MitoSensor were seeded into a 24-well plate one day before transfection (~20,000–50,000 cells/well). The cells were transfected with mitochondrial carrier family constructs, (plasmids encoding NDT1, SLC25A32, SLC25A33, SLC25A36, SLC25A51, or SLC25A52) (0.5 μg DNA/well), using 2.5 μL of polyethylenimine solution (1 mg/mL) in 100 μL of Opti-MEM or transfected with 20nM siRNA,1 μL Lipofectamine RNAiMax in 100 μL Opti-MEM. Cells were grown in DMEM complete media and incubated for 48–72 hours. For nicotinamide riboside (NR) treatment, cells were treated with 100 μM NR in complete DMEM without nicotinamide 16 hours prior to analysis. Measurements of mitochondrial NAD+ using the NAD+ biosensor has been previously described 35. Briefly, HeLa mitocpVenus and HeLa mitoSensor cells were harvested in ice-cold DMEM and kept cold until analysis. Data was collected on a NovoCyte flow cytometer using the following parameters: ex. 488 nm, em. 530±30 nm and ex. 405 nm, em. 530±30 nm. Cells were gated to exclude debris, a standard doublet-exclusion was performed, and 10,000 fluorescent cells were analyzed per condition. Ratiometric 488/405 nm fluorescence values were obtained for each cell using the derived function on FlowJo v10.
U2OS and HEK293 T-Rex Flp-In cells with an inducible NAD+-Snifit sensor in the mitochondria were plated at 5×10⁴ cells/mL in a 24-well plate (TPP, #92024). Sensor expression was induced by the addition of doxycycline (4S,4aR,5S,5aR,6R,12aR)-4-(dimethylamino)-1,5,10,11,12a-pentahydroxy-6-methyl-3,12-dioxo-4a,5,5a,6-tetrahydro-4H-tetracene-2-carboxamide, Cas Number 564–25-0) (200 ng/mL). After 24 h, the cells were transfected with either cDNA encoding SLC25A51, SLC25A52 or an empty pcDNA3.1 vector using Fugene 6 (1:1.5 DNA:Fugene ratio, 0.5 μg DNA/well) Promega, #E269A). At 48 h, the cells were labelled with CP-TMR-C6-SMX (500 nM) and Halo-SiR (200 nM) 21 for 16 h. The cells were resuspended in 2% FBS in PBS, filtered and subjected to flow cytometry analysis. Flow cytometry data were recorded on a FACS Melody (BD Bioscience) or an LSR II (BD Bioscience) using the following settings: TMR (ex. 561 nm, em. 582±15 nm), FRET (ex. 561 nm, em. 697±58 nm) and SiR (ex. 640 nm, em. 660±10 nm). Cells were gated to exclude debris, a standard doublet-exclusion was performed, and 10,000 fluorescent cells were analyzed per condition. The data were analyzed with FlowJo v10 software.
Respiration Assays
Cells (80,000 cell/well) were plated into a well of a Seahorse XF 96 well culture plate and cultured overnight. After 16–20 hours the cells media was changed to XF DMEM Medium containing 10 mM glucose, 1 mM sodium pyruvate and 2 mM L-glutamine and incubated for 1 hour at 37°C without CO2. Cell respiration was measured using a Seahorse XF96e Analyzer. Cells were treated with 1.5 μM oligomycin (an ATP synthase inhibitor, 4-ethyl-11,12,15,19-tetrahydroxy-6’-(2-hydroxypropyl)-5’,10,12,14,16,18,20,26,29-nonamethylspiro[24,28-dioxabicyclo[23.3.1]nonacosa-5,7,21-triene-27,2’-oxane]-13,17,23-trione, CAS Number 579–13-5), 1.5 μM FCCP (a mitochondrial uncoupler, 2-[2-[4-(trifluoromethoxy)phenyl]hydrazinylidene]-propanedinitrile, CAS Number 370–86-5), 0.5 μM Rotenone/Antimycin A (Complex I and III inhibitors, Rotenone: (1S,6R,13S)-16,17-dimethoxy-6-prop-1-en-2-yl-2,7,20-trioxapentacyclo[11.8.0.03,11.04,8.014,19]henicosa-3(11),4(8),9,14,16,18-hexaen-12-one. CAS Number: 83–79-4; Antimycin A: [(2R,3S,6S,7R,8R)-3-[(3-Formamido-2-hydroxybenzoyl)amino]-8-hexyl-2,6-dimethyl-4,9-dioxo-1,5-dioxonan-7-yl] 3-methylbutanoate, CAS Number: 1397–94-0). Basal respiration is respiration before the addition of any drugs and maximum respiration is peak respiration after oligomycin and FCCP treatment.
To measure mitochondrial respiration, 7.5 μg/well mitochondria were plated on Seahorse XF 96 well culture plate by centrifuging for 20 min at 1,000g. Respiration of mitochondria was measured in MiRO5 respiration medium (110 mM sucrose, 20 mM HEPES, 10 mM KH2PO4, 20 mM taurine, 60 mM K-lactobionate, 3 mM MgCl2, 0.5 mM EGTA, and 1 g/L fatty acid free BSA adjust pH to 7.2 with KOH) using a Seahorse XF96e Analyzer at 37°C. To measure state 2 respiration 5 mM malate and 10 mM pyruvate were added. State 3 respiration was measured with the addition of 2 mM ADP. To inhibit complex V and block ATP generation, 1.5 μM oligomycin was added.
For assessing the consequences of NAD+ depletion in mitochondria, respiration of isolated mitochondria (200 μg/chamber for Oroboros or 7.5 μg/well for Seahorse XF96e) was measured in MiRO5 respiration medium using an Oroboros high-resolution respirometer or Seahorse XF96e Analyzer at 37°C. To measure state 2 respiration 5 mM malate and 10 mM pyruvate were added. State 3 respiration was measured with the addition of 2 mM ADP. After stabilization of the state 3 reading, 1 mM NAD+ was added to determine whether its addition could restore state 3 respiration in NAD+ depleted mitochondria.
Cell proliferation Assay
To measure cell proliferation, cells were plated at 10,000 cells per well into a 96-well plate. The CyQuant (Invitrogen, #C7026) cell proliferation assay was conducted using the manufacturer’s protocol to measure DNA content at 0 h and 96 h after plating the cells.
Mitochondrial membrane potential and mitochondrial content assays:
Cells were loaded with either tetramethylrhodamine, ethyl ester (TMRE) (Invitrogen: #T669) to measure mitochondrial membrane potential or MitoTracker Deep Red (Cell Signaling: #8778S) to label mitochondria following the manufacturer’s protocols. After loading, the cells were collected by trypsinization, resuspended in 2% FBS in PBS, filtered and subjected to flow cytometry analysis. Flow cytometry data were recorded on an LSR II (BD Bioscience) for 10,000 events. To measure mitochondrial membrane potential, fluorescence intensity data was collected using ex. 561 nm, em. 582±15 nm. To control for TMRE loading, FCCP was added to collapse the mitochondrial membrane potential after collecting the baseline recording. The FCCP recording was subtracted from the baseline recording. To measure mitochondrial content in intact cells, the MitoTracker Deep Red fluorescence intensity data were collected using ex. 640 nm, em. 660±10 nm.
Mammalian Mitochondrial Isolation
Cells were cultured on a 100 mm or 150 mm plate. For experiments where mitochondria were depleted of NAD+, the media was changed the day before collection and the cells were treated with 100 nM FK866 for 18–24 hours. Cells were collected by trypsinization. Mitochondria were isolated by homogenizing cells in 2 mL of mitochondrial isolation buffer (210 mM Mannitol, 70 mM Sucrose, 10 mM HEPES, 1 mM EGTA, 0.25% fatty acid free BSA; adjust pH to 7.2 with KOH) using a dounce homogenizer (1200 rpm for 20 strokes). Mitochondria were collected by differential centrifugation. Cell debris was spun down at 800 g for 10 min and supernatant was transferred to a new tube. This was repeated until no cell debris pellet was present. Next the supernatant was spun at 11,000 g for 15 min. The mitochondrial pellet was resuspended in 50–200 μL BSA-free mitochondrial isolation buffer.
Mammalian mitochondrial NAD+ uptake
To measure mitochondrial NAD+ uptake, isolated mitochondria (50–200 μg) were resuspended in MiR05 containing 5 mM malate and 10 mM pyruvate along with NAD+ (1 mM) in a 1.5 mL Eppendorf tube. The reaction was agitated at 900 rpm and the tube was briefly opened every 10 min to allow for re-oxygenation. Mitochondria were pelleted by centrifugation (14,000g for 2 min). The mitochondrial pellet was washed 2 times with ice-cold Mitochondrial Isolation Buffer before extracting in ice-cold 0.6 N perchloric acid for biochemical measurements of mitochondria NAD+ content.
Labeled NaR and Metabolomics
For the tracer studies, cells were treated with double-isotope labeled 0.1 mM nicotinic acid riboside (NaR, double labeled with a 13C label on the pyridine carboxyl group and a deuterium label on the ribose moiety) for 7 hrs in complete Iscove’s Modified Dulbecco’s culture medium supplemented with 10% fetal bovine serum and 1x penicillin/streptomycin and 50 μg/mL uridine before extracting. The cells were then rapidly harvested using trypsin and media containing the label and were washed with ice-cold isolation buffer. Either cells or subsequently isolated mitochondria were collected for analysis.
Metabolites were extracted from pelleted mitochondria and whole cells using -80°C 80:20 methanol:water. Whole cell and mitochondria extracts were analyzed by liquid chromatography coupled to a mass spectrometer (LC-MS). The LC–MS method employed hydrophilic interaction chromatography (HILIC) coupled to the Q Exactive PLUS mass spectrometer (Thermo Scientific) 36. The LC separation was performed on a XBridge BEH Amide column (150 mm 3 2.1 mm, 2.5 mm particle size, Waters, Milford, MA). Solvent A is 95%: 5% H2O: acetonitrile with 20 mM ammonium bicarbonate, and solvent B is acetonitrile. The gradient was 0 min, 85% B; 2 min, 85% B; 3 min, 80% B; 5 min, 80% B; 6 min, 75% B; 7 min, 75% B; 8 min, 70% B; 9 min, 70% B; 10 min, 50% B; 12 min, 50% B; 13 min, 25% B; 16 min, 25% B; 18 min, 0% B; 23 min, 0% B; 24 min, 85% B; 30 min, 85% B. Other LC parameters are: flow rate 150 ml/min, column temperature 25°C, injection volume 10 mL and the autosampler temperature was 5°C. The mass spectrometer was operated in both negative and positive ion mode for the detection of metabolites. Other MS parameters are: resolution of 140,000 at m/z 200, automatic gain control (AGC) target at 3e6, maximum injection time of 30 ms and scan range of m/z 75–1000. Raw LC/MS data were converted to mzXML format using the command line “msconvert” utility 37. Data were analyzed via MAVEN v3.1 software, and all isotope labeling patterns were corrected for natural 13C abundance using AccuCor 38. To determine metabolites that were significantly changed, the fold change of metabolites was analyzed with multiple t-tests and a false discovery rate (FDR) was calculated using the two-stage step-up method of Benjamini, Krieger, and Yekutieli) with a desired FDR of 1%. A volcano plot was generated using Prism 8.0 comparing the -log(adjusted P value) to fold change. A heat map was generated using MetaboAnalyst 3.0 39. To generate the heat map, the samples were normalized by the median and the data was log transformed. A hierarchical clustering heat map was produced using a Pearson correlation to determine distance and Ward’s method for clustering analysis. T-test/ANOVA was used to determine Top 30 metabolite changes.
Generation of stably transfected HEK293 cells
Parental HEK293 cells were cultivated in DMEM (high glucose) supplemented with 10 % (v/v) fetal calf serum (FCS), 2 mM glutamine, 1 mM sodium pyruvate 100 U/mL penicillin and 100 μg/mL streptomycin. One day after transfection of 106 parental HEK293 cells in a 6-well plate with 1 μg plasmid encoding C-terminally FLAG-HA-tagged carriers using X-tremeGENE 9 transfection reagent (Merck Sigma XTG9-RO), one fifth of the cells were distributed onto a 10 cm dish and grown for ten days in complete DMEM supplemented with 550 μg/mL G418 whilst replacing the medium every other day. A total of 350 surviving cells were seeded on a 10 cm dish for a first round of clonal selection. Subsequently, cell clones were transferred into a 24 well plate and further expanded. Cells stably expressing the transgene were identified by FLAG-immunoblot analysis and subjected to another round of clonal selection.
Poly-ADP-ribose assisted detection of mitochondrial NAD+
Parental HEK293 cells and stably transfected HEK293 cells expressing Arabidopsis thaliana NDT2 (AtNDT2), human SLC25A32 and human SLC25A51 were grown in a 6-well plate and transfected with 1 μg plasmid encoding a mitochondrially targeted fusion construct composed of EGFP and the catalytic domain of PARP1 (mitoPARP1cd) using X-tremeGENE 9 transfection reagent. Cells transfected with the same construct lacking the PARP1cd portion (mitoEGFP) served as control. Thirty hours post transfection, cells were washed with 1 mL PBS prior to adding 130 μL lysis buffer (20 mM TrisHCl [pH 7.4], 150 mM NaCl, 1% (v/v) SDS, 1 mM EDTA, 1 mM 3-aminobenzamide). After 10 times passaging of the lysates through a 23-gaugle needle and determination of protein concentration using BCA assay (ThermoFisher, #23225), 50 μg of lysate were separated by reducing SDS-polyacrylamide gel electrophoresis in a 7% and 10% gel and subjected to immunoblotting using anti-PAR, anti-FLAG, anti-GFP, and anti-β-tubulin antibodies followed by incubation with HRP-conjugated goat anti-mouse secondary antibody. Overnight incubation at 4°C was used for primary antibodies and 1 h incubation at room temperature for the secondary antibody. HRP-detection was performed using Super Signal West Dura Extended Duration Substrate (ThermoFisher, #34075) and a ChemiDoc XRS+ imaging system (Bio-Rad).
Generation of Yeast Strains
The ndt2Δ::KanMX targeted deletion strain in BY4742 (MATα; his3Δ1; leu2Δ0; lys2Δ0; ura3Δ0) background was purchased from the Yeast Knockout Collection through GE (#YSC6272–201917555) and confirmed via genomic PCR. The double ndt1Δ ndt2Δ knockout strain was generated by additional cassette replacement of NDT1 with the HygMX cassette from pAG32. pRS415 or pRS415-based plasmids containing sc. NDT1, SLC25A51, or SLC25A52 were transformed using the LiAc method 40, selected for and maintained in SC-Leu media.
Yeast Mitochondrial Isolation
Mitochondria were isolated as previously described 41. Briefly, mitochondria were grown in 500 mL YPR (yeast extract, peptone, 2% raffinose) until the culture reached exponential phase. Raffinose was used as a carbon source instead of dextrose to promote respiration 42.These cultures were pelleted, washed and resuspended in zymolyase buffer (1.2M sortbitol, 20 mM potassium phosphate, pH 7.4). The cell suspension was treated with zymolyase at 1 unit per mL of the original culture and shaken at 80 rpm at 30˚C for 30 minutes. After zymolyase treatment the spheroplasts were kept on ice. The spheroplasts were pelleted, washed and resuspended in homogenization buffer (0.6M sorbitol, 10 mM Tris-HCl, pH 7.4, 1 mM ethylenediaminetetraacetic acid (EDTA) 0.2% w/v BSA and protease inhibitors at 2X). For mass-spectrometry analysis, BSA was omitted. The suspension was homogenized using 15 strokes of a 10 mL dounce homogenizer. The mitochondria were then isolated from the lysate using differential centrifugation. The mitochondria were stored on ice and in buffer containing sorbitol to preserve the osmolarity of the organelles (Homogenization Buffer). Isolated mitochondria were used within 3 hours of isolation.
Uptake of 3H-NAD+ in Isolated Yeast Mitochondria
Uptake was performed as previously described 43. Isolated mitochondria (3 mg for 3 timepoints) were pelleted at 12,000 x g for 10 minutes at 4˚C. Protein concentrations were measured using A280 spectrophotometry. Mitochondrial pellets were maintained in sorbitol buffer until immediately before use. Pellets were resuspended in 50 μL suspension Buffer (120 mM KCl, 5 mM KH2PO4, 1 mM EGTA, 3 mM HEPES pH 7.4, pH to 7.4 with KOH). The reaction was initiated by addition of 100 μL of respiration buffer (120 mM KCl, 5 mM KH2PO4, 1 mM EGTA, 3 mM HEPES pH 6.8) that included 1.5X substrate mix (1.5 mM ADP, 1.5 mM ATP, 30 mM succinate, 150 μM malate, 150 μM–1500 μM NAD+ as indicated, pH to 6.8 with KOH). Reaction buffer also included 0.3–3 nmol of 3H-NAD+, depending on relative NAD+ concentration to maintain the ratio when varying the concentration of substrate. For competition assays, 0.3 nmol 3H-NAD+ was used. 3H-NAD+ was purchased from Moravek, Inc (1 mCi/mL). The total 1X reaction volume was 150 μL, yielding three 50 μL samples for 1, 3 and 30 min timepoints. Each timepoint was filtered through a 0.22 μm MCE filter using vacuum filtration and then washed with 5 mL suspension buffer. Washed filters were placed in a 7 mL scintillation vial and dissolved in 5 mL Filtron-X scintillation fluid. Scintillation vials were analyzed using an LSC6500 liquid scintillation counter at 1 min per sample. Background signal from equivalent amounts of 3H-NAD+ incubated without mitochondria was subtracted. For calculating rates, mean background signal from the DKO strain was subtracted.
Quantitation of SLC25A51 abundance in yeast samples
Wild-type, double-knockout (Δndt1 Δndt2) and pRS415-TEF SLC25A51; Δndt1 Δndt2 strains were grown in triplicate in 250 mL YPR (Yeast extract, peptone, 2% raffinose) to mid-exponential phase at 30°C, 225 rpm. OD600 was used to estimate the cell concentrations of each culture so that 9 × 10⁹ cells were used for each isolation. Mitochondria were isolated in the absence of BSA. After determining the yield of each mitochondrial preparation, 10 μg of mitochondria per sample were pelleted at 10,000 x g for 15 minutes at 4°C. The mitochondrial pellet was lysed in 20 μL of 20 mM Tris pH 7.4, 200 mM NaCl, 20 mM C12M for 30 min at 4C. The lysate was centrifuged at 10,000 x g for 30 min at 4°C and supernatant was immediately placed in 20 μL 2X Laemmli Buffer and boiled at 95C for 5 min. The samples were resolved in a 10% Bis-Tris gel at 100V for 20 minutes and stained with Imperial Stain. Gel sections between 25 kDa and 37 kDa were excised with a clean razorblade and treated with 50% ethanol, 50 mM ammonium bicarbonate for 30 min at RT. Gel cubes were then reduced and subjected to in-gel digest with trypsin. Peptide samples were extracted in acetonitrile and desalted before analysis on a Dionex LC and Orbitrap Fusion 1 for LC MS/MS with a two-hour run time. Integrated peak intensities were mapped onto a known meta dataset of absolute protein abundances 33 to interpolate an estimate of SLC25A51 abundance per mg of mitochondria. Selection of proteins used to generate the standard curve were uniquely mitochondrially localized, had consistent abundance across all experimental conditions, and had confirmed molecular weights between 25 and 37 kDa. Using the standard curve, the amount of SLC25A51 expressed was estimated to be ~3000 molecules per cell. Calculated concentration of SLC25A51 in each uptake reaction was ~280 nM ± 40 nM SLC25A51 or ~500 ng ± 70 ng SLC25A51 per mg of mitochondria.
Immunofluorescence and Imaging
Approximately thirty hours following transient transfected of either pCMV-Flag-HA-SLC25A51 or pCMV-Flag-HA-SLC25A52, HeLa cells seeded on coverslips were fixed using 4% paraformaldehyde (Electron Microscopy Sciences #15710)/PBS for 15 minutes at room temperature. Fixed cells were then washed in PBS, blocked, and permeabilized for 1 hour at room temperature in 5% normal goat serum/0.3% Triton X-100/PBS. Primary antibodies were diluted and incubated with cells overnight at 4ºC in 1% BSA/0.3% Triton X-100/PBS. Rabbit anti-Flag (Cell Signaling Technologies #14793, 1:500); mouse anti-MTC02 (Abcam ab79479, 1:40). After washing, secondary antibodies were similarly diluted and incubated with cells for 1 hour at room temperature. Goat anti-Mouse IgG - Alexa Fluor 488 (Invitrogen A-11001, 1:1000); Goat anti-Rabbit IgG - Alexa Fluor 568 (Invitrogen A-11036, 1:1000). Following 3X PBS washes, cells were mounted with Vectashield Hardset w/ DAPI (Vector Labs, H-100). 0.11 μm optical slices were imaged using a Yokogawa W2 spinning disk confocal setup that includes 100mW 488 nm and 565 nm lasers, a 100X Olympus objective, and a Photonics Prime 95B sCMOS camera.
Mitochondrial Volumetric Analyses
For analyses of mitochondrial volume per cell, a z-stack series comprised of 0.11 μm optical slices that comprehensively covered the full depth of a single cell was captured and imported into Bitplain Imaris x64 (v.8.4.1) for assembly. Data for over 30 individual w per experimental condition were blindly collected and analyzed. Power analysis (alpha 0.05, beta 0.8) indicated that a sample size of 26 cells would be sufficient to observe differences with this confidence. Surfaces analysis was performed for each cell; surface detail was set to 0.1 μm. For thresholding, background subtraction (local contrast) was performed using a spherical diameter of 0.2 μm surrounding the identified surfaces. A volume filter was applied to analyze objects above 0.0184 μm3. Data were collected for cumulative volume per cell, number of disconnected puncta components per cell, and median volume of each disconnected unit. Data were analyzed for statistical significance between conditions using GraphPad Prism v8.2.0.
Statistics and Reproducibility
All results are presented as mean ± standard error of the mean as indicated. Statistical analyses were performed using Prism 8.0 (Graph Pad Software) and Microsoft Excel. Where appropriate, statistical analyses were performed using an unpaired, two-tailed t-test (for comparison of two groups), one-way ANOVA (for comparison of three or more groups), or two-way ANOVA (for grouped analysis). Multiple comparisons analysis was performed using Dunnett’s, Tukey’s, or Sidak’s methods (method was selected based on the recommendation of Prism 8.0 for a given comparison). P values less than 0.05 were considered significant. All experiments are represented by multiple biological replicates or independent experiments. The number of replicates per experiment are indicated in the legends.
For data presented in Fig. 2h, the data for shControl are representative of 2 independent experiments and the data for shSLC25A51 are representative of 4 independent experiments. Over 30 cells were analyzed per condition.
For data presented in Extended Data Fig. 1e the experiment was repeated 2 independent times; for Extended Data Fig. 1h, NDT1 and vector experiments were repeated 24 times and the experiment for each transporter was repeated 4 times; for Extended Data Fig. 1i the experiment was repeated 4 independent times and over 20 cells were analyzed each time; for Extended Data Fig. 4a, the experiment was repeated 3 times and 9 distinct colonies were tested; for Extended Data Fig. 4b, the experiment was repeated over 10 times with over 10 transformations and 3 colonies were tested for each transformation. This experiment was regularly repeated throughout use of the strain to validate that its growth phenotype was as expected. For Extended Data Fig. 4c, this experiment was repeated over 10 times; including over 10 transformation with 3 colonies tested per transformation. This experiment was regularly repeated throughout use of the strain to validate that no compensatory mutations had been created. For Extended Data Fig. 4d, this experiment was repeated 2 independent times. For Extended Data Fig. 4e, this experiment was performed once with technical triplicates.
Data Availability Statement.
The authors declare that the data supporting the findings of this study are available within the paper and its supplementary information files.
Code Availability.
No custom codes were used during this study. Mathematical calculations are described in the materials and methods section or by cited works.
Extended Data
Extended Data Figure 1. SLC25A51 is a mitochondrial protein that affects cellular NAD+ distribution, proliferation, and metabolome profiles.
qPCR quantification of SLC25A51 mRNA expression in a, HEK293T (n=3) and b, HeLa cells (n=3) expressing shRNA targeting SLC25A51. NAD+ content of c, isolated mitochondria (n=3) and d, whole cell lysates (n=3) from HeLa cells with stable shRNA knockdown of SLC25A51 (KD) and non-targeting control (Ctrl). e, Western blot confirming shRNA targeting murine Slc25a51 reduces SLC25A51 protein expression in cells transfected with cDNA encoding SLC25A51-FLAG. f, Mitochondrial free NAD+ levels in mouse embryonic stem cells expressing shRNA against Slc25a51 and non-targeting shRNA (shFF2), as measured with the mitochondrial cpVenus NAD+ biosensor (n=3). g, qPCR quantification of SLC25A51 mRNA expression in HeLa cells transfected with siRNA targeting SLC25A51 (n=3). h, Western blot confirming protein expression of Flag-tagged mitochondrial carriers. Controls include stable expression of the NAD+ biosensor (sensor) and anti-Tubulin for loading. i, Immunofluorescent detection of SLC25A51 and SLC25A52 subcellular localization. Cells were transiently transfected with cDNA encoding Flag-HA-tagged SLC25A51 or SLC25A52 and probed with anti-Flag and the mitochondrial marker, anti-MTC02. Scale bar: 10 μM, 2 μM on inset. Inset represents zoomed view of Flag localization and mitochondria. Proliferation of j, HAP1 SLC25A51 KO (n=8), k, HEK293T SLC25A51 shRNA-knockdown (n=8) l, HeLa SLC25A51 shRNA-knockdown cells (n=8) and their respective controls. Proliferation was measured by CyQuant, a fluorescent DNA dye, at 0h and 96h after plating and expressed as fold change. qPCR quantification of SLC25A52 mRNA expression in m, HAP1 SLC25A51 KO, n, HEK293T SLC25A51 shRNA-knockdown and o, HeLa SLC25A51 shRNA-knockdown cells (n=3). p, Western blot of whole cell protein lysates from HAP1 wildtype (WT) and SLC25A51 knockout (KO) cells confirming SLC25A51 loss. Loading control is total protein measured by Revert 700 Total Protein. Heat map of top 30 q, mitochondrial and r, whole cell metabolites that differ between HAP1 wildtype and SLC25A51 KO cells (n=3). Data represented as mean ± SEM. P values were determined by unpaired, two-tailed Student’s t-test (for two groups) or one-way ANOVA with multiple comparisons analysis using Dunnett’s method (for groups of three or more). *P<0.05, and ***P<0.001 vs control or WT (exact P values are provided in the source data).
Extended Data Figure 2. NAD+ and SLC25A51 affect oxidative phosphorylation.
a, Respiration of isolated mitochondria from HEK293T cells treated with either vehicle (Veh) or the NAMPT inhibitor FK866 to deplete mitochondrial NAD+. Mitochondria were treated with pyruvate and malate (state 2), then ADP was added to induce state 3 respiration. 1 mM NAD+ was added to test the ability of exogenous NAD+ to rescue respiration in the setting of mitochondria NAD+ depletion (Trace is representative of n=4 independent experiments). P values were determined by two-way ANOVA with multiple comparisons analysis using the Sidak method. b, Oxygen consumption rate (OCR) was measured in SLC25A51 shRNA knockdown (KD) and control (Ctrl) HeLa cells using a Seahorse XF96e. Basal OCR was measured prior to the addition of treatments and maximal respiration was measured after the sequential addition of oligomycin (Oligo, ATP synthase inhibitor) and FCCP (uncoupler). Rotenone (Rot) and Antimycin A (AA) were added as a control to completely block mitochondrial oxygen consumption (n=6). c, Respiration of isolated mitochondria from SLC25A51 knockdown HEK293T cells. Mitochondria were treated with pyruvate/malate (state 2), and then ADP was added to induce state 3 respiration. Oligomycin was added to block ATP synthase-mediated respiration (n=3 independent experiments). d, Mitochondria were isolated from HEK293T control, SLC25A51 shRNA knockdown cells, and controls treated with FK866 to deplete mitochondrial NAD+. Mitochondrial oxygen consumption rate was measured after treatment with pyruvate/malate (state 2), ADP (state 3), and 1 mM NAD+ (n=4 independent experiments). e, Mean volume per mitochondrial unit and f, number of distinct mitochondria per cell quantified from confocal image reconstructions of mitochondrial voxels in SLC25A51 shRNA knockdown (n=31 cells) and control (n=32 cells) HeLa cells. Data represented as mean ± SEM. P values were determined by unpaired, two-tailed Student’s t-test. *P<0.05, **P<0.01, and ***P<0.001 vs vehicle or control; ###P<0.001 vs state 3 (exact P values are provided in the source data).
Extended Data Figure 3. Intact NAD+, but not nicotinamide or nicotinamide mononucleotide contributes to the mitochondrial NAD+ pool.
a, Mitochondrial NAD+ content was measured in isolated mitochondria from a, HeLa control (Ctrl) cells, cells treated with FK866 (Ctrl+FK), and SLC25A51 shRNA-knockdown (KD) cells. NAD+ content of isolated mitochondria was determined before (untreated) and after a 40-min incubation with 1 mM NAD+ (n=3 independent experiments). b, NAD+ levels in HEK293T mitochondria incubated with 1 mM nicotinamide (NAM), 1 mM nicotinamide mononucleotide (NMN), or 1 mM NAD+ (n=3 independent experiments). c, NAD+ uptake in NAD+-depleted mitochondria isolated from HEK293T cells incubated with NAD+ ± 2 mM NAM or 2mM NMN (n=4 independent experiments). d, Fractional labeling of mitochondrial NAD+ in HAP1 cells treated with isotopically double labeled NaR (n=3 biological independent replicates). Data represented as mean ± SEM. P values were determined by unpaired, two-tailed Student’s t-test (for two groups) or one-way ANOVA with multiple comparisons analysis using Dunnett’s or Tukey’s method (for groups of three or more). *P<0.05 and ***P<0.001 vs untreated, vehicle, and wildtype M+0; #P<0.05 vs wildtype M+1.
Extended Data Figure 4. Generation and validation of yeast strains for testing mitochondrial NAD+ transport.
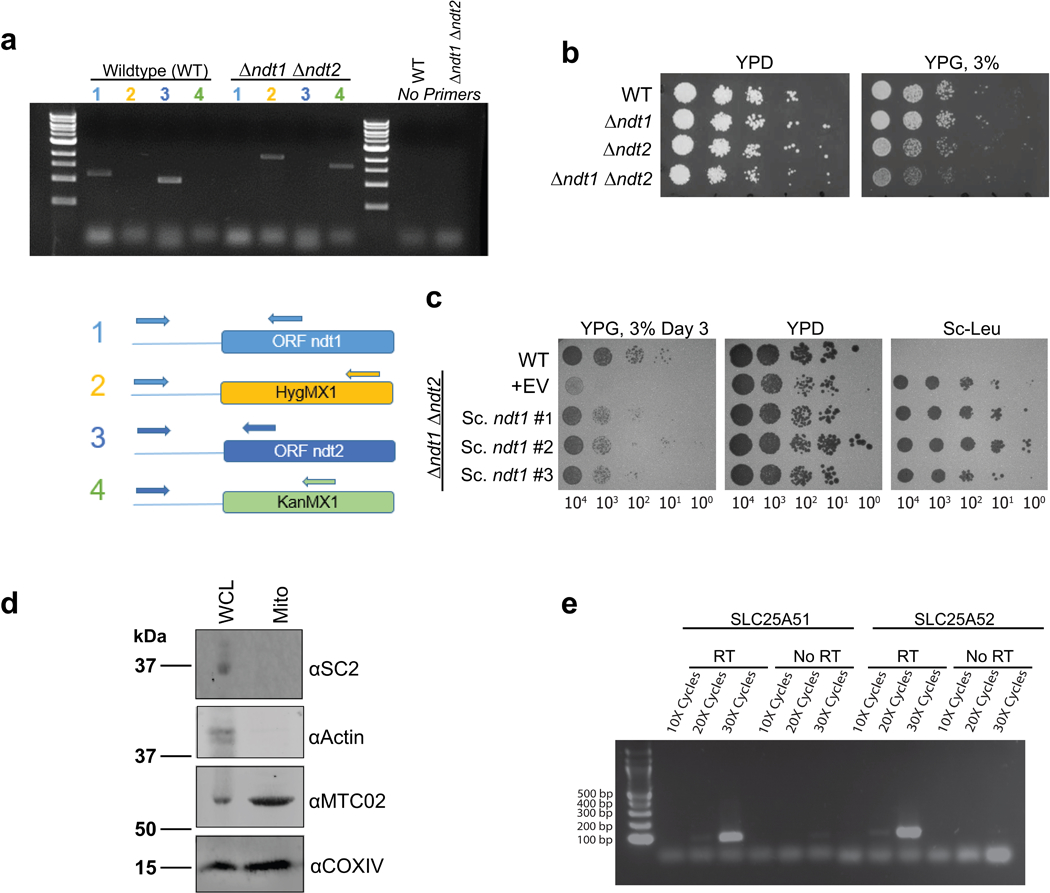
a, PCR genotyping to confirm double knockout gene deletion in BY4727 S. Cerevisiae via antibiotic-resistance cassette replacement at the NDT1 and NDT2 loci. b, c, Deletion of the mitochondrial NAD+ carriers NDT1 and NDT2 in DKO strain phenocopied previously described growth defects on non-fermentative media (YP, 3% glycerol media)2, which was rescued by plasmid expression of NDT1 d, Western blot confirmed enrichment of mitochondrial markers (MTC02 and COXIV) and absence of cytoplasmic proteins (actin) or ER (SC2) in isolated mitochondria from yeast. e, RT-PCR confirmed ectopic expression from pRS415-SLC25A51 and pRS415-SLC25A52 in DKO strains.
Extended Data Figure 5. Kinetics and selectivity of NAD+ transport by human SLC25A51 expressed in yeast mitochondria.
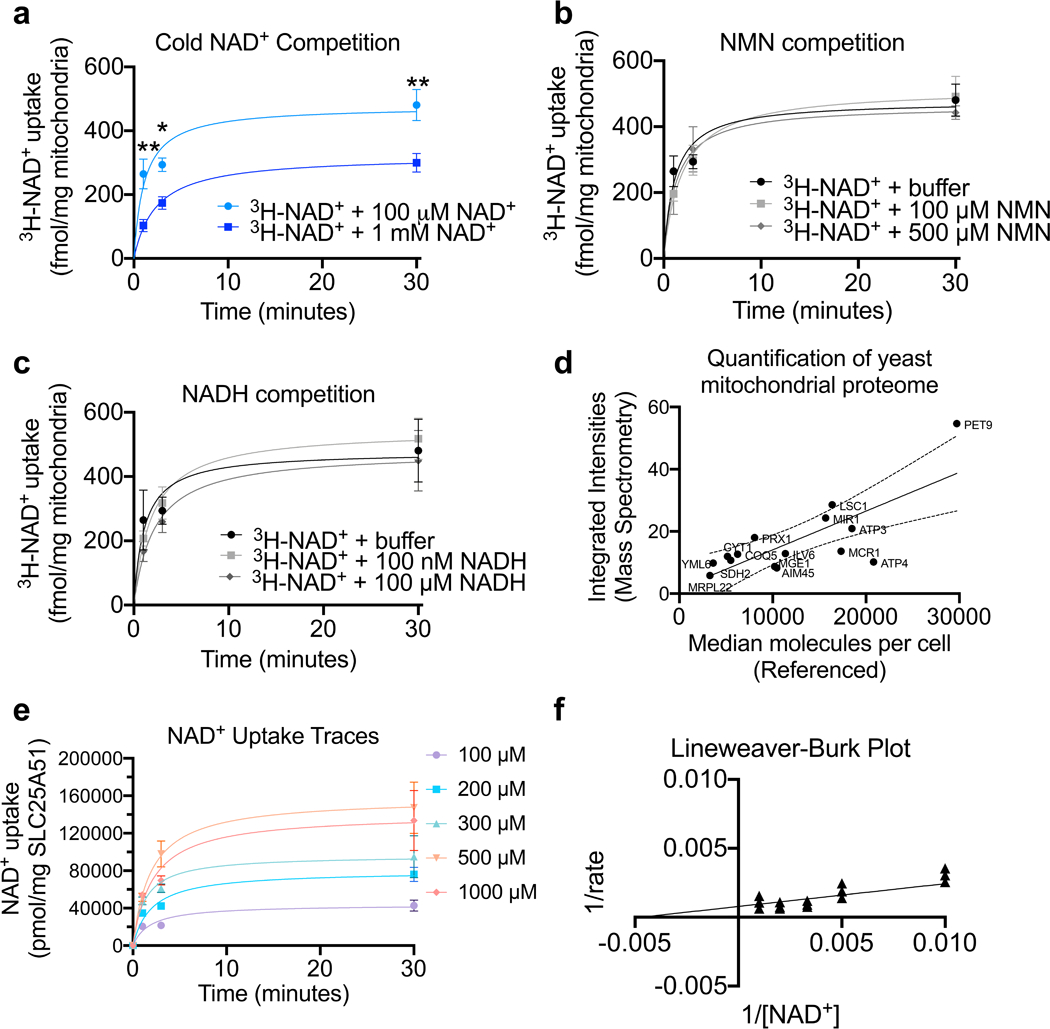
a, Co-incubation with excess unlabeled NAD+ (n=5 independent experiments for 1mM NAD+) b, supraphysiological levels of NMN (100 μM, n=4 independent experiments; 500 μM, n=5 independent experiments), or c, NADH (n=3 independent experiments) with 3H-NAD+ to measure uptake competition in mitochondria from DKO yeast expressing SLC25A51. d, Proportional relationship between integrated peak intensities from mass spectrometry of mitochondrial samples compared to a known meta dataset of absolute protein abundances; used to quantitate SLC25A51 abundance in yeast samples. e, Uptake measured with indicated NAD+ concentrations; calculated from specific activity (n=3 independent experiments, mean ± SEM). f, Lineweaver-Burk plot based on a non-linear fit with datapoints overlaid (n=3 independent experiments). P values were determined by two-way ANOVA with multiple comparisons analysis using Sidak’s method. *P<0.05 and **P<0.01 vs 100 μM cold NAD+.
Extended Data Table 1. Essential mitochondrial solute carrier family 25 genes determined by genome-wide CRISPR/Cas9 screens examining cellular viability.
Table includes essential gene name, number of cell lines in which gene is essential, number of cell lines tested, corresponding citation of study utilizing genome-wide CRISPR/Cas9 screens to determine essential genes, annotation (Uniprot), and tissue expression profile (Human Protein Atlas 20). #SLC25A51 was not tested in Hart et al. Cell, 2015. Refs. 6, 7, 22, 23.
| Essential SLC25A Genes | Cell lines where gene is essential/ Cell lines tested | Citation | Annotation | Distribution of Expression in Tissues |
|---|---|---|---|---|
| SLC25A1 | (2/4) | Wang et al. Science, 2015 | Mitochondrial Tricarboxylate Transport Protein | All tissues |
| (1/1) | Bertomeu et al. MCB, 2017 | |||
| SLC25A3 | (1/4) | Wang et al. Science, 2015 | Mitochondrial Phosphate Carrier Protein | All tissues; Enriched in Heart and Skeletal Muscle |
| (1/1) | Bertomeu et al. MCB, 2017 | |||
| (2/2) | Blomen et al. Science, 2015 | |||
| (2/5) | Hart et al. Cell, 2015 | |||
| SLC25A5 | (1/2) | Blomen et al. Science, 2015 | ADP/ATP translocase 2 | All tissues |
| SLC25A10 | (5/5) | Hart et al. Cell, 2015 | Mitochondrial Dicarboxylate Carrier | All tissues; Enriched in liver |
| SLC25A14 | (1/4) | Wang et al. Science, 2015 | Mitochondrial Uncoupling Protein 5 | All tissues |
| SLC25A19 | (1/1) | Bertomeu et al. MCB, 2017 | Mitochondrial Thiamine Pyrophosphate Carrier | All tissues; Enriched in testis |
| (2/2) | Blomen et al. Science, 2015 | |||
| (2/5) | Hart et al. Cell, 2015 | |||
| SLC25A22 | (2/5) | Hart et al. Cell, 2015 | Mitochondrial Glutamate Carrier 1 | All tissues; Enriched in brain and pancreas |
| SLC25A25 | (1/5) | Hart et al. Cell, 2015 | Calcium-binding Mitochondrial Carrier Protein SCaMC-2 | All tissues |
| SLC25A26 | (1/4) | Wang et al. Science, 2015 | Mitochondrial S-Adenosylmethionine Carrier Protein | All tissues |
| (1/1) | Bertomeu et al. MCB, 2017 | |||
| (2/2) | Blomen et al. Science, 2015 | |||
| (3/5) | Hart et al. Cell, 2015 | |||
| SLC25A28 | (4/5) | Hart et al. Cell, 2015 | Mitoferrin-2 | All tissues |
| SLC25A29 | (1/5) | Hart et al. Cell, 2015 | Mitochondrial Basic Amino Acids Transporter | All tissues; Enhanced in thyroid gland |
| SLC25A31 | (1/5) | Hart et al. Cell, 2015 | ADP/ATP translocase 4 | Enriched in testis |
| SLC25A32 | (1/4) | Wang et al. Science, 2015 | Mitochondrial Folate Carrier | All tissues |
| SLC25A39 | (1/5) | Hart et al. Cell, 2015 | Unannotated; Heme biosynthetic process and transmembrane transport | All tissues |
| SLC25A41 | (1/5) | Hart et al. Cell, 2015 | Unannotated; ATP transmembrane transporter activity | Detected in some; Enriched in brain and testis |
| SLC25A42 | (2/5) | Hart et al. Cell, 2015 | Mitochondrial Coenzyme A Transporter | All tissues; Enriched in liver |
| SLC25A43 | (1/4) | Wang et al. Science 2015 | Unannotated; ATP transmembrane transporter activity | All tissues |
| SLC25A45 | (1/4) | Wang et al. Science, 2015 | Unannotated; Acyl carnitine transmembrane and ATP transmembrane transporter activity | All tissues; Enriched in pancreas |
| (3/5) | Hart et al. Cell, 2015 | |||
| SLC25A51* | (3/4) | Wang et al. Science, 2015 | Unannotated; No prediction | All tissues |
| (1/1) | Bertomeu et al. MCB, 2017 | |||
Extended Data Table 2. Initial NAD+ Uptake Rates Calculated from Specific Activity in Isolated Mitochondria.
P values were determined by unpaired, two-tailed Student’s t-test.
| n | Initial Rates (pmol/min/mg mitochondria) | Std deviation | P value vs WT | P value vs DKO | P value vs A51 | |
|---|---|---|---|---|---|---|
| Wildtype | 4 | 7.6 | ± 1.5 | |||
| DKO | 4 | −0.08 | ± 1.8 | 0.0006 | ||
| DKO + SLC25A51 | 4 | 12.1 | ±2.8 | 0.0315 | 0.0003 | |
| DKO + SLC25A52 | 3 | 4.3 | ± 1.5 | 0.0385 | 0.0180 | 0.0082 |
| DKO + SLC25A51 + 100 nM NADH | 3 | 14 | ±3.4 | 0.0196 | 0.0008 | 0.4660 |
| DKO + SLC25A51 + 100 uM NADH | 3 | 10 | ±2.3 | 0.1504 | 0.0011 | 0.3434 |
| DKO + SLC25A51 + 100 uM NMN | 4 | 12.7 | ±6.2 | 0.8193 | 0.0040 | 0.0474 |
| DKO + SLC25A51 + 500 pM NMN | 5 | 15 | ± 10.4 | 0.2114 | 0.0261 | 0.6212 |
Supplementary Material
Acknowledgments
We thank all members of the Baur and Cambronne labs, V. Moiseenkova-Bell, A. Ellington, E. Marcotte, R. Goodman, I. Heiland, M. Whorton, E. Gouaux, and J. Dixon for constructive discussions and suggestions, and M. Blair, Q. Chen, V. Annamalai, X. Yu, A. Slepian, and CBRS UT Austin Proteomics Facility for technical support. This work was supported by grants from the National Institutes of Health (R01DK098656 to J.A.B., DP2GM126897 to X.A.C., TL1TR001880, T32AR53461, and F32HL145923 to T.S.L.) and the Norwegian Research Council (250395/F20 to M.Z.).
Footnotes
Competing Interests J.D.R. declares that he is a co-founder of Toran Therapeutics. The remaining authors declare no competing interests.
References
- 1.Palmieri F et al. Molecular identification and functional characterization of Arabidopsis thaliana mitochondrial and chloroplastic NAD+ carrier proteins. J Biol Chem 284, 31249–31259, doi: 10.1074/jbc.M109.041830 (2009). [DOI] [PMC free article] [PubMed] [Google Scholar]
- 2.Todisco S, Agrimi G, Castegna A & Palmieri F. Identification of the mitochondrial NAD+ transporter in Saccharomyces cerevisiae. J Biol Chem 281, 1524–1531, doi: 10.1074/jbc.M510425200 (2006). [DOI] [PubMed] [Google Scholar]
- 3.Berger F, Ramirez-Hernandez MH & Ziegler M. The new life of a centenarian: signalling functions of NAD(P). Trends Biochem Sci 29, 111–118, doi: 10.1016/j.tibs.2004.01.007 (2004). [DOI] [PubMed] [Google Scholar]
- 4.Yang H et al. Nutrient-sensitive mitochondrial NAD+ levels dictate cell survival. Cell 130, 1095–1107, doi:S0092–8674(07)00973–7 [pii] 10.1016/j.cell.2007.07.035 (2007). [DOI] [PMC free article] [PubMed] [Google Scholar]
- 5.VanLinden MR et al. Subcellular Distribution of NAD+ between Cytosol and Mitochondria Determines the Metabolic Profile of Human Cells. J Biol Chem 290, 27644–27659, doi: 10.1074/jbc.M115.654129 (2015). [DOI] [PMC free article] [PubMed] [Google Scholar]
- 6.Wang T et al. Identification and characterization of essential genes in the human genome. Science 350, 1096–1101, doi: 10.1126/science.aac7041 (2015). [DOI] [PMC free article] [PubMed] [Google Scholar]
- 7.Bertomeu T et al. A High-Resolution Genome-Wide CRISPR/Cas9 Viability Screen Reveals Structural Features and Contextual Diversity of the Human Cell-Essential Proteome. Mol Cell Biol 38, doi: 10.1128/MCB.00302-17 (2018). [DOI] [PMC free article] [PubMed] [Google Scholar]
- 8.Yoshino J, Baur JA & Imai SI NAD(+) Intermediates: The Biology and Therapeutic Potential of NMN and NR. Cell Metab 27, 513–528, doi: 10.1016/j.cmet.2017.11.002 (2018). [DOI] [PMC free article] [PubMed] [Google Scholar]
- 9.Cambronne XA et al. Biosensor reveals multiple sources for mitochondrial NAD(+). Science 352, 1474–1477, doi: 10.1126/science.aad5168 (2016). [DOI] [PMC free article] [PubMed] [Google Scholar]
- 10.Pittelli M et al. Inhibition of nicotinamide phosphoribosyltransferase: cellular bioenergetics reveals a mitochondrial insensitive NAD pool. J Biol Chem 285, 34106–34114, doi:M110.136739 [pii] 10.1074/jbc.M110.136739 (2010). [DOI] [PMC free article] [PubMed] [Google Scholar]
- 11.Sims CA et al. Nicotinamide mononucleotide preserves mitochondrial function and increases survival in hemorrhagic shock. JCI insight 3, doi: 10.1172/jci.insight.120182 (2018). [DOI] [PMC free article] [PubMed] [Google Scholar]
- 12.Titus SA & Moran RG Retrovirally mediated complementation of the glyB phenotype. Cloning of a human gene encoding the carrier for entry of folates into mitochondria. J Biol Chem 275, 36811–36817, doi: 10.1074/jbc.M005163200 (2000). [DOI] [PubMed] [Google Scholar]
- 13.Spaan AN et al. Identification of the human mitochondrial FAD transporter and its potential role in multiple acyl-CoA dehydrogenase deficiency. Mol Genet Metab 86, 441–447, doi: 10.1016/j.ymgme.2005.07.014 (2005). [DOI] [PubMed] [Google Scholar]
- 14.Berger F, Lau C, Dahlmann M & Ziegler M. Subcellular compartmentation and differential catalytic properties of the three human nicotinamide mononucleotide adenylyltransferase isoforms. J Biol Chem 280, 36334–36341, doi:M508660200 [pii] 10.1074/jbc.M508660200 (2005). [DOI] [PubMed] [Google Scholar]
- 15.Davila A et al. Nicotinamide adenine dinucleotide is transported into mammalian mitochondria. eLife 7, doi: 10.7554/eLife.33246 (2018). [DOI] [PMC free article] [PubMed] [Google Scholar]
- 16.Fletcher RS et al. Nicotinamide riboside kinases display redundancy in mediating nicotinamide mononucleotide and nicotinamide riboside metabolism in skeletal muscle cells. Molecular metabolism 6, 819–832, doi: 10.1016/j.molmet.2017.05.011 (2017). [DOI] [PMC free article] [PubMed] [Google Scholar]
- 17.Nikiforov A, Dolle C, Niere M & Ziegler M. Pathways and subcellular compartmentation of NAD biosynthesis in human cells: from entry of extracellular precursors to mitochondrial NAD generation. J Biol Chem 286, 21767–21778, doi: 10.1074/jbc.M110.213298 (2011). [DOI] [PMC free article] [PubMed] [Google Scholar]
- 18.Hikosaka K et al. Deficiency of nicotinamide mononucleotide adenylyltransferase 3 (nmnat3) causes hemolytic anemia by altering the glycolytic flow in mature erythrocytes. J Biol Chem 289, 14796–14811, doi: 10.1074/jbc.M114.554378 (2014). [DOI] [PMC free article] [PubMed] [Google Scholar]
- 19.Yamamoto M et al. Nmnat3 Is Dispensable in Mitochondrial NAD Level Maintenance In Vivo. PLoS One 11, e0147037, doi: 10.1371/journal.pone.0147037 (2016). [DOI] [PMC free article] [PubMed] [Google Scholar]
- 20.Uhlen M et al. Proteomics. Tissue-based map of the human proteome. Science 347, 1260419, doi: 10.1126/science.1260419 (2015). [DOI] [PubMed] [Google Scholar]
- 21.Sallin O et al. Semisynthetic biosensors for mapping cellular concentrations of nicotinamide adenine dinucleotides. eLife 7, doi: 10.7554/eLife.32638 (2018). [DOI] [PMC free article] [PubMed] [Google Scholar]
- 22.Blomen VA et al. Gene essentiality and synthetic lethality in haploid human cells. Science 350, 1092–1096, doi: 10.1126/science.aac7557 (2015). [DOI] [PubMed] [Google Scholar]
- 23.Hart T et al. High-Resolution CRISPR Screens Reveal Fitness Genes and Genotype-Specific Cancer Liabilities. Cell 163, 1515–1526, doi: 10.1016/j.cell.2015.11.015 (2015). [DOI] [PubMed] [Google Scholar]
- 24.Agerholm M et al. Perturbations of NAD(+) salvage systems impact mitochondrial function and energy homeostasis in mouse myoblasts and intact skeletal muscle. Am J Physiol Endocrinol Metab 314, E377–E395, doi: 10.1152/ajpendo.00213.2017 (2018). [DOI] [PubMed] [Google Scholar]
- 25.Frederick DW et al. Loss of NAD Homeostasis Leads to Progressive and Reversible Degeneration of Skeletal Muscle. Cell Metab 24, 269–282, doi: 10.1016/j.cmet.2016.07.005 (2016). [DOI] [PMC free article] [PubMed] [Google Scholar]
- 26.Rustin P et al. Fluxes of nicotinamide adenine dinucleotides through mitochondrial membranes in human cultured cells. J Biol Chem 271, 14785–14790 (1996). [DOI] [PubMed] [Google Scholar]
- 27.Agrimi G et al. Deletion or overexpression of mitochondrial NAD+ carriers in Saccharomyces cerevisiae alters cellular NAD and ATP contents and affects mitochondrial metabolism and the rate of glycolysis. Appl Environ Microbiol 77, 2239–2246, doi: 10.1128/AEM.01703-10 (2011). [DOI] [PMC free article] [PubMed] [Google Scholar]
- 28.Floyd BJ et al. Mitochondrial Protein Interaction Mapping Identifies Regulators of Respiratory Chain Function. Mol Cell 63, 621–632, doi: 10.1016/j.molcel.2016.06.033 (2016). [DOI] [PMC free article] [PubMed] [Google Scholar]
- 29.Dolle C, Niere M, Lohndal E & Ziegler M. Visualization of subcellular NAD pools and intra-organellar protein localization by poly-ADP-ribose formation. Cellular and molecular life sciences : CMLS 67, 433–443, doi: 10.1007/s00018-009-0190-4 (2010). [DOI] [PMC free article] [PubMed] [Google Scholar]
- 30.Trammell SA & Brenner C. Targeted, LCMS-based Metabolomics for Quantitative Measurement of NAD(+) Metabolites. Comput Struct Biotechnol J 4, e201301012, doi: 10.5936/csbj.201301012 (2013). [DOI] [PMC free article] [PubMed] [Google Scholar]
- 31.Zhang Q, Piston DW & Goodman RH Regulation of corepressor function by nuclear NADH. Science 295, 1895–1897, doi: 10.1126/science.1069300 (2002). [DOI] [PubMed] [Google Scholar]
- 32.Zhao Y et al. SoNar, a Highly Responsive NAD+/NADH Sensor, Allows High-Throughput Metabolic Screening of Anti-tumor Agents. Cell Metab 21, 777–789, doi: 10.1016/j.cmet.2015.04.009 (2015). [DOI] [PMC free article] [PubMed] [Google Scholar]
- 33.Ho B, Baryshnikova A & Brown GW Unification of Protein Abundance Datasets Yields a Quantitative Saccharomyces cerevisiae Proteome. Cell Syst 6, 192–205 e193, doi: 10.1016/j.cels.2017.12.004 (2018). [DOI] [PubMed] [Google Scholar]
- 34.Malecki MJ et al. Leukemia-associated mutations within the NOTCH1 heterodimerization domain fall into at least two distinct mechanistic classes. Mol Cell Biol 26, 4642–4651, doi: 10.1128/MCB.01655-05 (2006). [DOI] [PMC free article] [PubMed] [Google Scholar]
- 35.Eller JM et al. Flow Cytometry Analysis of Free Intracellular NAD(+) Using a Targeted Biosensor. Curr Protoc Cytom 88, e54, doi: 10.1002/cpcy.54 (2019). [DOI] [PMC free article] [PubMed] [Google Scholar]
- 36.Wang L et al. Peak Annotation and Verification Engine for Untargeted LC-MS Metabolomics. Anal Chem 91, 1838–1846, doi: 10.1021/acs.analchem.8b03132 (2019). [DOI] [PMC free article] [PubMed] [Google Scholar]
- 37.Adusumilli R & Mallick P. Data Conversion with ProteoWizard msConvert. Methods Mol Biol 1550, 339–368, doi: 10.1007/978-1-4939-6747-6_23 (2017). [DOI] [PubMed] [Google Scholar]
- 38.Su X, Lu W & Rabinowitz JD Metabolite Spectral Accuracy on Orbitraps. Anal Chem 89, 5940–5948, doi: 10.1021/acs.analchem.7b00396 (2017). [DOI] [PMC free article] [PubMed] [Google Scholar]
- 39.Chong J, Wishart DS & Xia J. Using MetaboAnalyst 4.0 for Comprehensive and Integrative Metabolomics Data Analysis. Curr Protoc Bioinformatics 68, e86, doi: 10.1002/cpbi.86 (2019). [DOI] [PubMed] [Google Scholar]
- 40.Amberg DC, Burke DJ & Strathern JN High-efficiency transformation of yeast. CSH Protoc 2006, doi: 10.1101/pdb.prot4145 (2006). [DOI] [PubMed] [Google Scholar]
- 41.Meisinger C, Pfanner N & Truscott KN Isolation of yeast mitochondria. Methods Mol Biol 313, 33–39, doi: 10.1385/1-59259-958-3:033 (2006). [DOI] [PubMed] [Google Scholar]
- 42.Izawa T & Unger AK Isolation of Mitochondria from Saccharomyces cerevisiae. Methods Mol Biol 1567, 33–42, doi: 10.1007/978-1-4939-6824-4_3 (2017). [DOI] [PubMed] [Google Scholar]
- 43.Bricker DK et al. A mitochondrial pyruvate carrier required for pyruvate uptake in yeast, Drosophila, and humans. Science 337, 96–100, doi: 10.1126/science.1218099 (2012). [DOI] [PMC free article] [PubMed] [Google Scholar]
Associated Data
This section collects any data citations, data availability statements, or supplementary materials included in this article.
Supplementary Materials
Data Availability Statement
The authors declare that the data supporting the findings of this study are available within the paper and its supplementary information files.