Abstract
MeCP2 (methyl CpG binding protein 2) is a key component of constitutive heterochromatin, which plays important roles in chromosome maintenance and transcriptional silencing1-3. Mutations in MeCP2 cause Rett syndrome (RTT)3-5, a postnatal progressive neurodevelopmental disorder associated with severe mental disability and autism-like symptoms that manifests in girls during early childhood. Heterochromatin, long considered a dense and relatively static structure1,2, is now understood to exhibit properties consistent with a liquid-like condensate6,7. Here we report that MeCP2 is a dynamic component of heterochromatin condensates in cells, is stimulated by DNA to form liquid-like condensates, contains multiple domains that contribute to condensate formation, manifests physicochemical properties that selectively concentrate heterochromatin cofactors compared to components of transcriptionally active condensates, and when altered by RTT-causing mutations is disrupted in its ability to form condensates. We propose that MeCP2 enhances heterochromatin/euchromatin separation through its condensate partitioning properties and that condensate disruption may be a common consequence of RTT patient mutations.
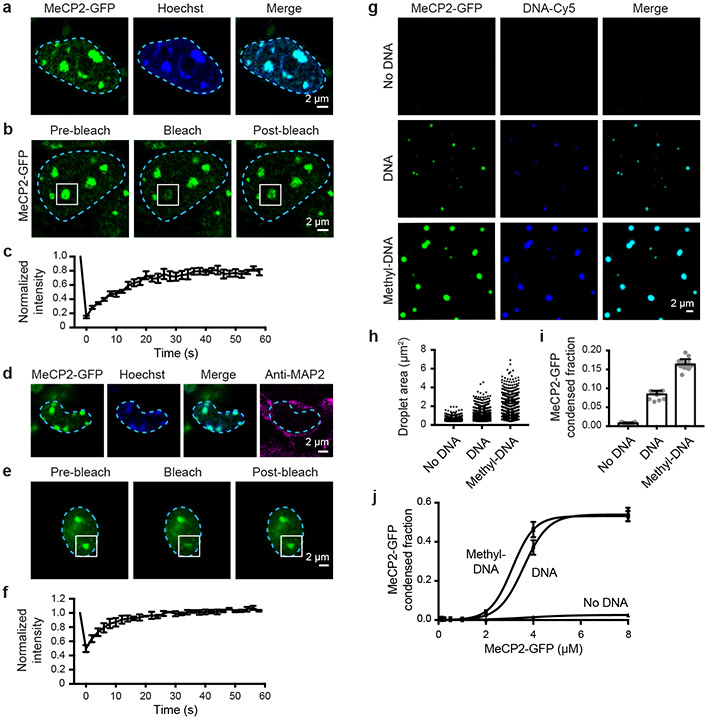
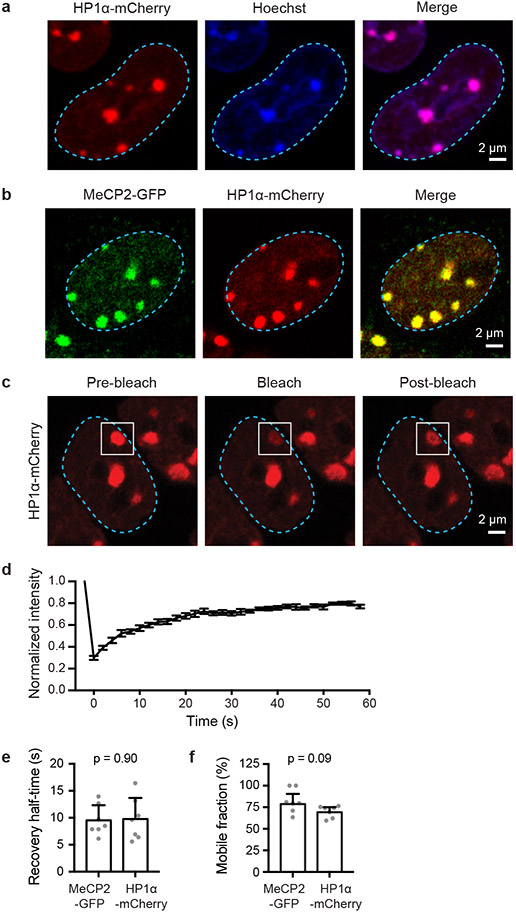
MeCP2 and HP1 proteins are key regulators of heterochromatin1-4. Recent studies have shown that HP1 proteins are dynamic components of heterochromatin in vivo and can form phase-separated condensates in vitro, arguing that heterochromatin is a dynamic liquid-like condensate6,7. To confirm that MeCP2 is also a dynamic component of heterochromatin, we used live-cell fluorescence microscopy to image both MeCP2 and HP1α, endogenously tagged with fluorescent proteins, in murine embryonic stem cells (mESCs) (Fig. 1a-c, Extended Data Fig. 1). The results showed that MeCP2-GFP and HP1α-mCherry occur in nuclear bodies that overlap Hoechst-dense heterochromatin foci (Fig. 1a, Extended Data Fig. 1a) and that the two proteins occur in the same heterochromatin condensates (Extended Data Fig. 1b). Fluorescence recovery after photobleaching (FRAP) of MeCP2-GFP and HP1α-mCherry puncta revealed recovery on the timescale of seconds (Fig. 1b, c, Extended Data Fig. 1c-f), consistent with characteristics of liquid-like condensates. These results show that MeCP2 is a dynamic component of heterochromatin condensates in live mESCs.
Figure 1. MeCP2 forms condensates in vivo and in vitro.
a. Live-cell images of endogenous-tagged MeCP2-GFP and Hoechst staining in mESCs.
b. Live-cell images of FRAP experiments with endogenous-tagged MeCP2-GFP mESCs.
c. FRAP curves for experiments in Fig. 1b. Photobleaching occurs at t = 0 s. Mean±SD, n=7 cells.
d. Fixed-cell images of endogenous-tagged MeCP2-GFP brain sections from chimeric mice.
e. Images of FRAP experiments performed on acute brain slices from endogenous-tagged MeCP2-GFP chimeric mice.
f. FRAP curves for experiments in Fig. 1e. Photobleaching occurs at t = 0 s. Mean±SEM, n=3 cells.
g. Droplet experiments examining MeCP2 droplet formation with DNA. MeCP2-GFP at 2 μM was mixed with 160 nM unmethylated DNA (DNA), methylated DNA (methyl-DNA), or no DNA in droplet formation buffers with 100 mM NaCl.
h. Droplet areas for experiments in Fig. 1g. Fields per condition n=15.
i. MeCP2-GFP condensed fraction for experiments in Fig. 1g. Mean±SD. Fields per condition n=15.
j. MeCP2-GFP condensed fraction curves for experiments examining MeCP2 droplet formation with DNA. MeCP2-GFP was mixed with 160 nM DNA, methyl-DNA, or no DNA in droplet formation buffers with 100 mM NaCl. Mean±SD. Fields per condition n=15.
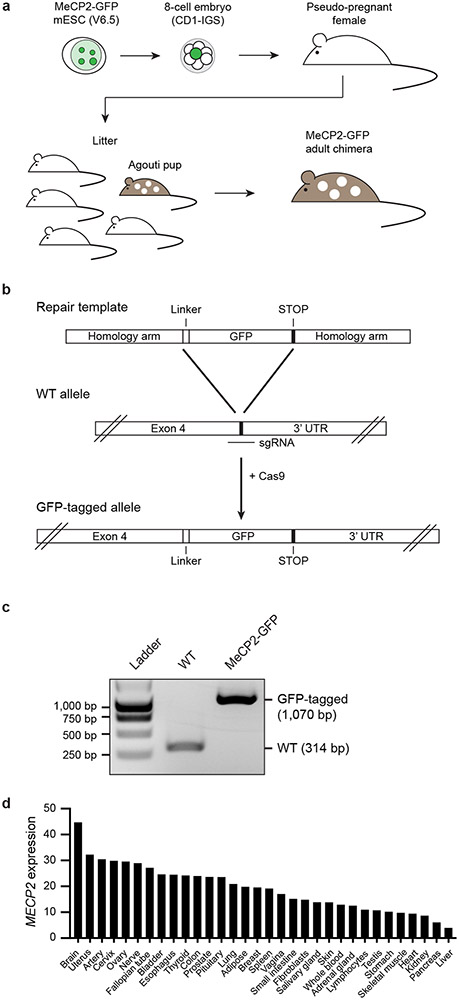
To determine whether MeCP2 is a dynamic component of heterochromatin in mammalian tissues, we generated mice expressing GFP-tagged MeCP2 protein from the endogenous locus (Extended Data Fig. 2a-c). MeCP2 is reported to be expressed in all cell types (Extended Data Fig. 2d); we studied neurons because MeCP2 is highly abundant in these cells8 and mutations in MECP2 cause neurodevelopmental disorders3-5. Imaging of MAP2-positive neurons revealed that MeCP2-GFP occurs in Hoechst-dense heterochromatin foci (Fig. 1d). FRAP of MeCP2-GFP puncta revealed rapid and complete recovery on the timescale of seconds (Fig. 1e, f). These results indicate that MeCP2 is a dynamic component of liquid-like heterochromatin condensates in murine brain cells.
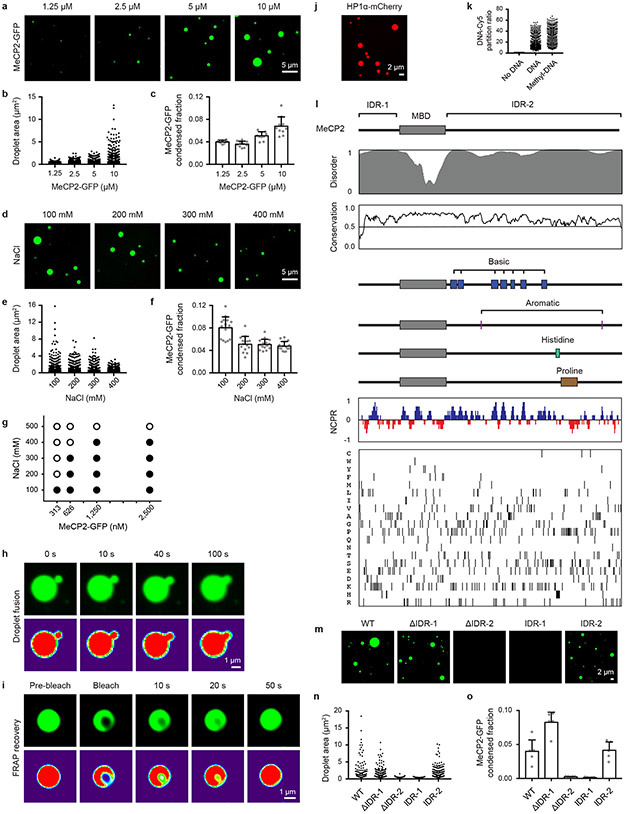
To investigate whether MeCP2 has physicochemical properties that may contribute to heterochromatin condensates in cells, we examined purified MeCP2-GFP fusion protein using in vitro droplet assays. MeCP2-GFP formed spherical droplets that displayed properties consistent with phase-separated liquid condensates, including sensitivity to protein and salt concentration, droplet fusion behavior, and dynamic rearrangement of molecules measured using FRAP (Extended Data Fig. 3a-i). Purified HP1α-mCherry also formed droplets (Extended Data Fig. 3j), consistent with prior findings6,7. MeCP2 binds to DNA3,4, so we studied the effects of DNA on MeCP2 droplet formation. When DNA was added to physiologically relevant concentrations of MeCP2-GFP, MeCP2-GFP formed droplets (Fig. 1g). With the addition of methylated DNA, which MeCP2 binds with higher affinity3,4, larger droplets were formed (Fig. 1g, h), and these droplets contained a larger fraction of MeCP2 (Fig. 1i) and increased levels of DNA (Extended Data Fig. 3k). These results were observed across a range of MeCP2 concentrations (Fig. 1j). These observations suggest that DNA can cause crowding of MeCP2 and thus lower the threshold for condensate formation, analogous to the manner in which enhancer DNA elements crowd transcription factors to lower the threshold for formation of transcriptional condensates9.
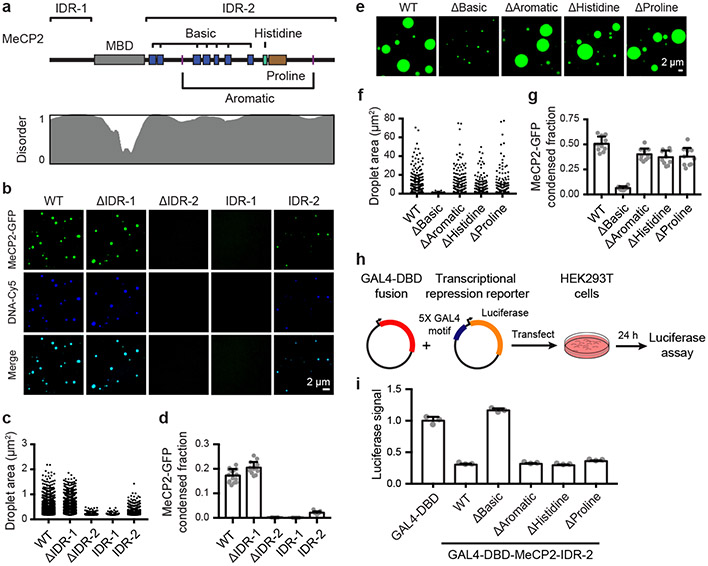
We used droplet assays to identify domains of MeCP2 that contribute to condensate formation. Intrinsically disordered regions (IDRs) can participate in condensate formation10, and MeCP2 contains two conserved IDRs that flank its structured methyl-DNA binding domain (MBD) (Fig. 2a, Extended Data Fig. 3l). Droplet formation assays were conducted using physiologically relevant concentrations of recombinant MeCP2-GFP domain deletion mutant proteins in the presence of DNA. While mutant proteins lacking the N-terminal IDR (ΔIDR-1) formed droplets, those lacking the C-terminal IDR (ΔIDR-2) did not (Fig. 2b-d). Furthermore, IDR-1 alone did not form droplets, whereas IDR-2 alone did form droplets, albeit with diminished size and number relative to both full-length and ΔIDR-1 proteins (Fig. 2b-d). Similar results were observed when MeCP2-GFP domain deletion mutant proteins were examined in droplet assays in the absence of DNA (Extended Data Fig. 3m-o). These results indicate that MeCP2’s C-terminal IDR, which has been implicated in various functions including heterochromatin association11, chromatin compaction12, co-repressor recruitment13, and transcriptional repression14, contributes to condensate formation. Furthermore, the results indicate that the MBD also contributes to condensate formation because DNA binding lowers the threshold for condensate formation.
Figure 2. MeCP2 features that contribute to condensate formation.
a. Schematic of MeCP2 protein indicating the MBD, IDR-1, IDR-2, and sequence features within IDR-2 previously implicated in condensate formation for other proteins. Contribution of IDR-2 sequence features to condensate formation was examined using deletion mutants that remove the basic patches (ΔBasic), aromatic residues (ΔAromatic), histidine-rich patch (ΔHistidine), and proline-rich patch (ΔProline). Predicted protein disorder is displayed below.
b. Droplet experiments examining ability of MeCP2 deletion mutants to form droplets with DNA. MeCP2-GFP deletion mutants at 2 μM were mixed with 40 nM DNA in droplet formation buffers with 100 mM NaCl.
c. Droplet areas for experiments in Fig. 2b. Fields per condition n=15.
d. MeCP2-GFP condensed fraction for experiments in Fig. 2b. Mean±SD. Fields per condition n=15.
e. Droplet experiments examining ability of MeCP2 IDR-2 sequence feature deletion mutants to form droplets. MeCP2-GFP IDR-2 sequence feature deletion mutants at 10 μM were added to droplet formation buffers with 150 mM NaCl and 10% PEG-8000.
f. Droplet areas for experiments in Fig. 2e. Fields per condition n=10.
g. MeCP2-GFP condensed fraction for experiments in Fig. 2e. Mean±SD. Fields per condition n=10.
h. Schematic of transcriptional repression reporter assay used to examine the ability of MeCP2 IDR-2 sequence features to contribute to transcriptional repression.
i. Normalized luciferase signals for reporter assay examining ability of MeCP2 IDR-2 sequence features to contribute to transcriptional repression. Luciferase signal was normalized to GAL4-DBD alone. Mean±SD, n=3 biologically independent samples per condition.
Specific sequence features within IDRs have been found to contribute to condensate formation10; several of these features occur within MeCP2’s IDR-2 (Fig. 2a, Extended Data Fig. 3l), leading us to investigate whether these contribute to MeCP2 condensate behaviors. We found that deletion of basic patches within IDR-2 disrupted MeCP2 droplet formation, while deletion mutants removing aromatic residues, a histidine-rich patch, and a proline-rich patch remained capable of droplet formation (Fig. 2e-g). Droplet formation correlated with ability to repress transcription, a key MeCP2 function14, in a transcriptional repression reporter assay (Fig. 2h, i). These results suggest that the basic patches in MeCP2’s C-terminal IDR, some of which are disrupted in RTT15, play especially important roles in MeCP2 condensate formation.
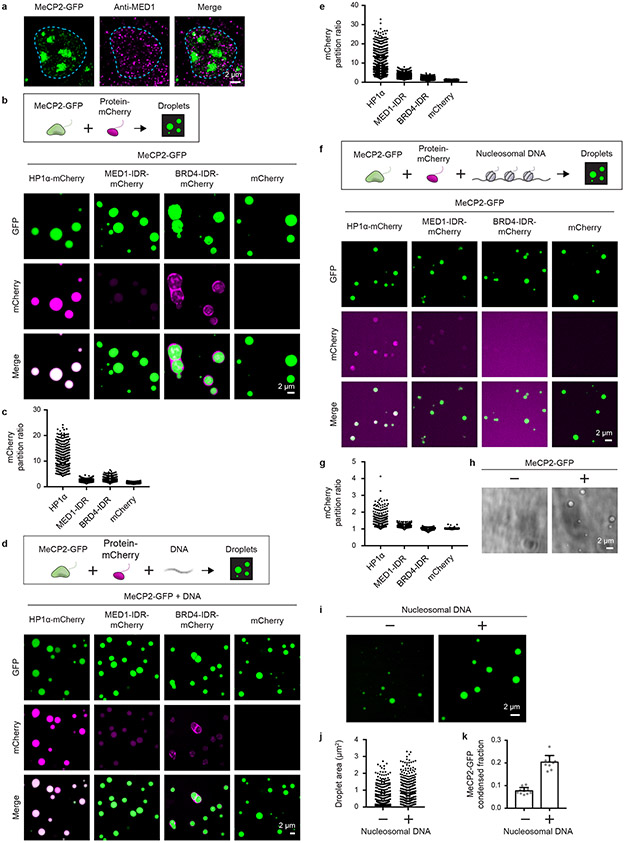
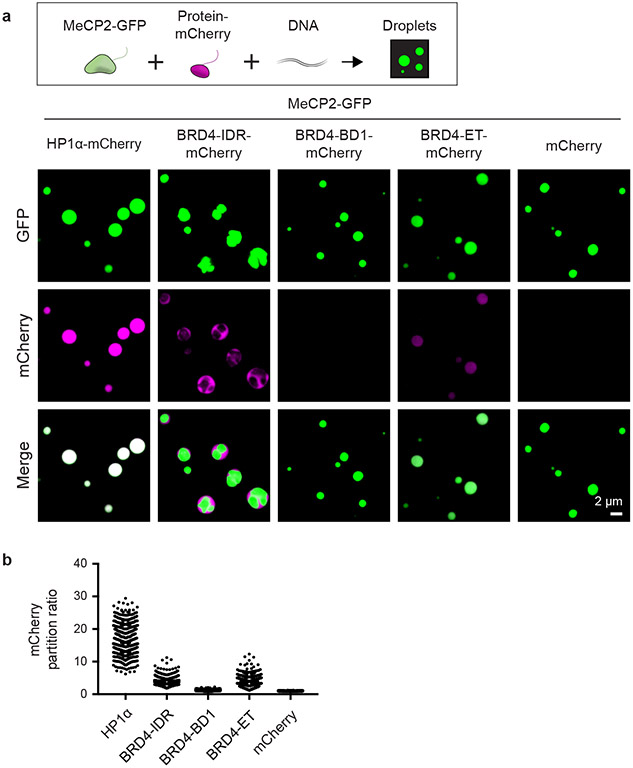
Active transcriptional condensates16,17 do not overlap heterochromatin condensates (Extended Data Fig. 4a). While separation of euchromatin and heterochromatin can be attributed to different DNA-binding factors and differential association with nuclear lamina18, it is possible that the condensate properties of specific proteins might also contribute to the separation of these distinct compartments19. To investigate this possibility, we tested whether condensates formed by MeCP2 preferentially incorporate and concentrate HP1α compared to key components of euchromatic transcriptional condensates, such as MED1 and BRD4. We found that MeCP2-GFP droplets incorporated and concentrated HP1α-mCherry to a substantially greater extent than MED1 and BRD4 IDRs (Extended Data Fig. 4b-g). Similar results were obtained in the presence or absence of DNA (Extended Data Fig. 4b-e), and in the presence of nucleosomal DNA, albeit with less efficiency (Extended Data Fig. 4f, g). Nucleosomal DNA alone did not form droplets under these conditions (Extended Data Fig. 4h), though it enhanced MeCP2 droplet formation (Extended Data Fig. 4i-k). Notably, when combined with MeCP2-GFP in the presence or absence of DNA, BRD4-IDR-mCherry was enriched in a distinct droplet phase that did not coalesce with the MeCP2-GFP droplet phase, although the two phases appeared adjacent and touching (Extended Data Fig. 4b, d, Extended Data Fig. 5). These results suggest that MeCP2 condensates may contribute to selective partitioning of components of heterochromatin and active euchromatin. There is some evidence for MeCP2 occupancy of euchromatin8,15,20, but MeCP2 levels in active euchromatin may not be sufficient to form condensates that facilitate partitioning of heterochromatin components.
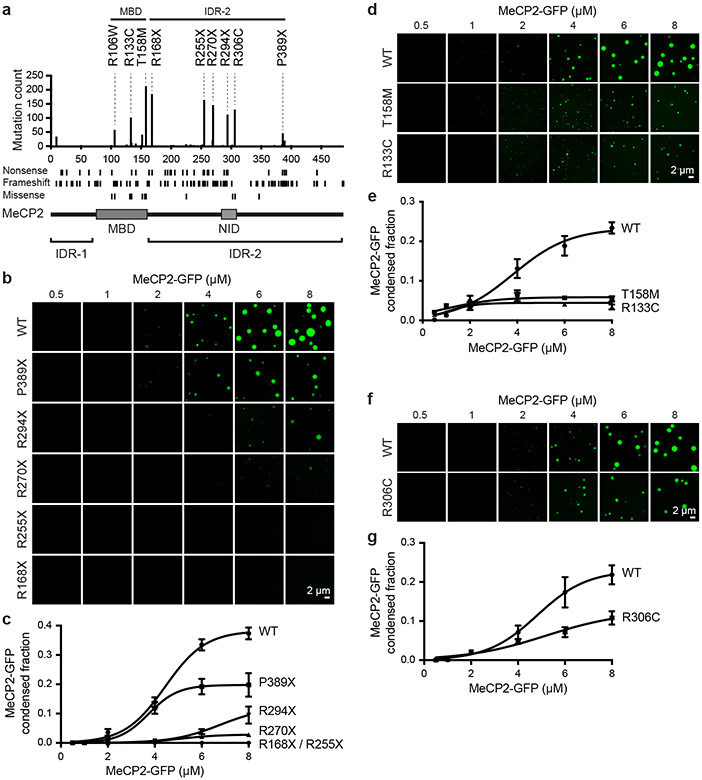
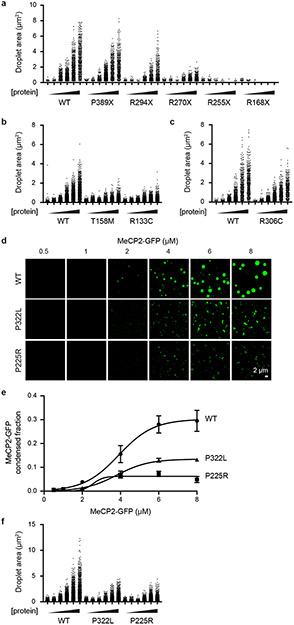
RTT patient mutations occur predominantly in MeCP2’s MBD and IDR-2 (Fig. 3a), which both contribute to condensate formation. To examine whether patient mutations in these domains disrupt the ability of MeCP2 to form condensates, we examined MeCP2-GFP proteins with RTT patient mutations using droplet formation assays (Fig. 3b-g, Extended Data Fig. 6). Patient missense mutations affecting the MBD reduced the ability of MeCP2 to form droplets (Fig. 3d, e, Extended Data Fig. 6b). Similarly, patient mutations that truncate IDR-2 disrupted the ability of MeCP2 to form droplets, with mutations that truncated a greater portion of IDR-2 having a greater disruptive impact on droplet formation (Fig. 3b, c, Extended Data Fig. 6a). These results suggest that condensate disruption may be a common consequence of RTT patient mutations.
Figure 3. RTT patient mutations disrupt MeCP2 condensate formation.
a. Schematic of MeCP2 protein with bar chart displaying the number of MECP2 coding mutations in female Rett syndrome patients found in RettBASE database for each amino acid position. Positions of nonsense, frameshift, and missense mutations are shown below.
b. Droplet experiments examining effects of RTT patient truncation mutations that disrupt IDR-2 on MeCP2 droplet formation. MeCP2-GFP WT and RTT IDR-2 mutants (R168X, R255X, R270X, R294X, P389X) at indicated concentrations were mixed with 40 nM methylated DNA in droplet formation buffers with 100 mM NaCl.
c. MeCP2-GFP condensed fraction as a function of MeCP2-GFP concentration for experiments in Fig. 3b. Mean±SD. Fields per condition n=15.
d. Droplet experiments examining the effects of RTT patient missense mutations that disrupt the MBD on MeCP2 droplet formation. MeCP2-GFP WT and RTT MBD mutants (R133C and T158M) at indicated concentrations were mixed with 20 nM methylated DNA in droplet formation buffers with 100 mM NaCl.
e. MeCP2-GFP condensed fraction as a function of MeCP2-GFP concentration for experiments in Fig. 3d. Mean±SD. Fields per condition n=15.
f. Droplet experiments examining effect of RTT patient missense mutation R306C on MeCP2 droplet formation. MeCP2-GFP WT and RTT R306C mutant at indicated concentrations were mixed with 20 nM methylated DNA in droplet formation buffers with 100 mM NaCl.
g. MeCP2-GFP condensed fraction as a function of MeCP2-GFP concentration for experiments in Fig. 3f. Mean±SD. Fields per condition n=15.
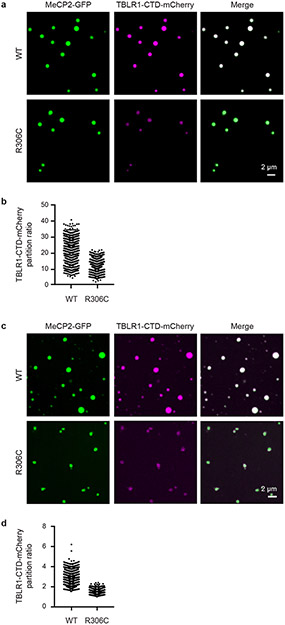
The observation that RTT patient missense mutations occur frequently in the MBD while truncation mutations occur frequently in IDR-2 (Fig. 3a) is consistent with expectations of a condensate model. Missense mutations in the structured MBD reduce condensate formation because DNA binding lowers the threshold for formation, while deletion mutations abrogate the multi-valent interactions that contribute to IDR-mediated condensate formation. Nonetheless, there are RTT patient missense mutations in IDR-2, so we investigated whether three of these (P225R, R306C, and P322L) disrupt condensate formation. All three mutations reduced the ability of MeCP2 to form droplets in vitro (Fig. 3f, g, Extended Data Fig. 6c-f). The R306C mutation was previously shown to disrupt an interaction between MeCP2’s NCoR-interaction domain (NID) and TBLR1, a subunit of the NCoR co-repressor complex13,21. We therefore examined the ability of R306C mutant condensates to incorporate the C-terminal domain of TBLR1 (TBLR1-CTD), which directly interacts with the NID21. WT MeCP2 droplets readily enriched TBLR1-CTD-mCherry, whereas R306C mutant droplets showed less enrichment (Extended Data Fig. 7), suggesting that MeCP2 condensates can contribute to NID-mediated NCoR recruitment, a key MeCP2 function previously shown to be disrupted in RTT13,21. These results suggest that RTT patient missense mutations in IDR-2 contribute to condensate disruption.
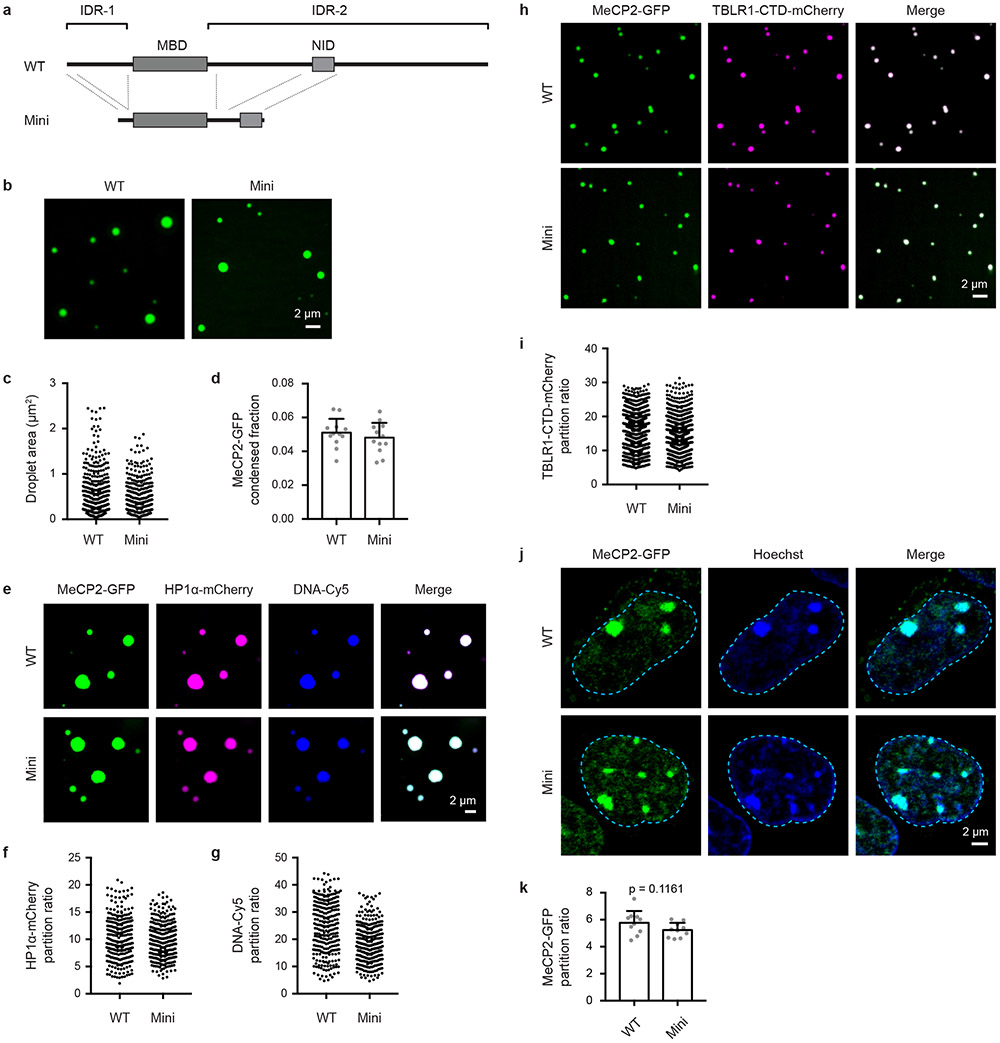
A minimal MeCP2 fragment (Mini), which removes most of IDR-2 but retains the NID (and thus R306) (Extended Data Fig. 8a), can partially rescue RTT phenotypes in a murine model of RTT22. This observation led us to investigate whether MeCP2 Mini protein is capable of droplet formation. MeCP2 Mini was capable of forming droplets (Extended Data Fig. 8b-d) that could enrich DNA and HP1α-mCherry (Extended Data Fig. 8e-g), as well as TBLR1-CTD-mCherry (Extended Data Fig. 8h, i). Furthermore, live-cell imaging of mESCs expressing endogenously tagged MeCP2-GFP WT and Mini showed that both proteins partitioned similarly into heterochromatin condensates (Extended Data Fig. 8j, k). These results show that MeCP2 Mini retains condensate formation capabilities and suggest that the capability to form condensates may contribute to MeCP2 Mini’s partial rescue of RTT phenotypes.
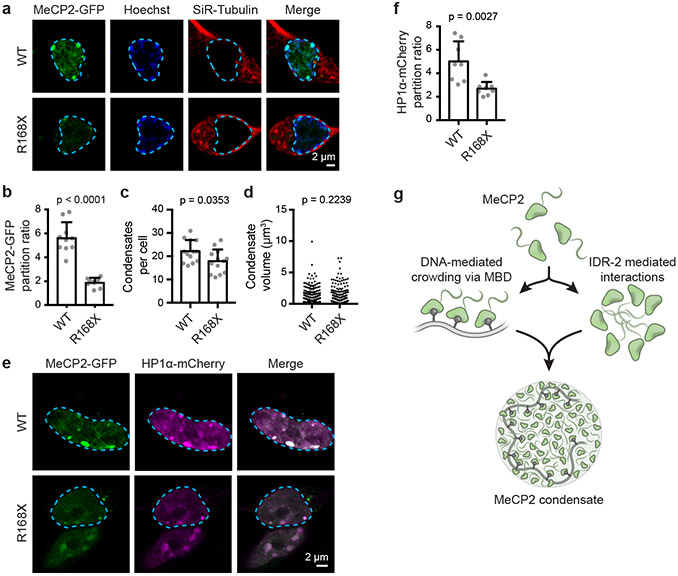
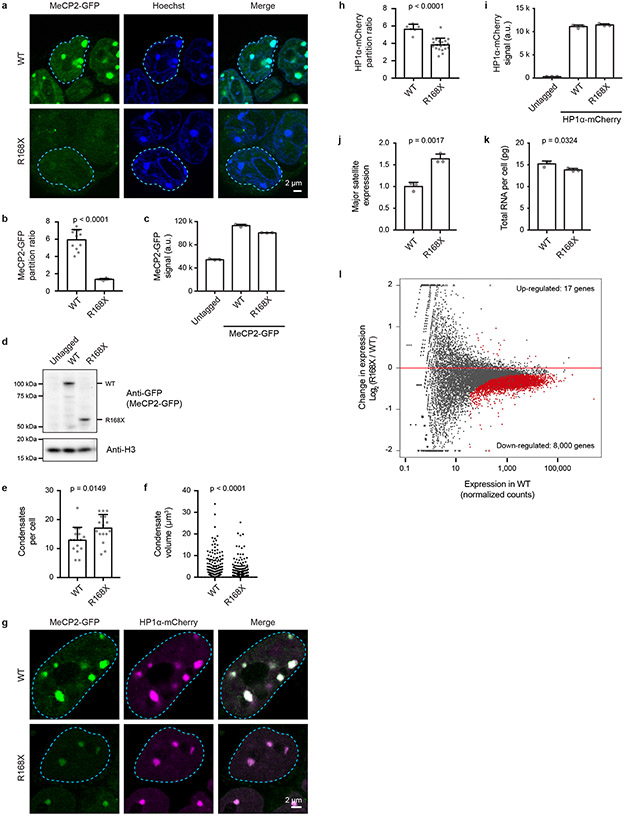
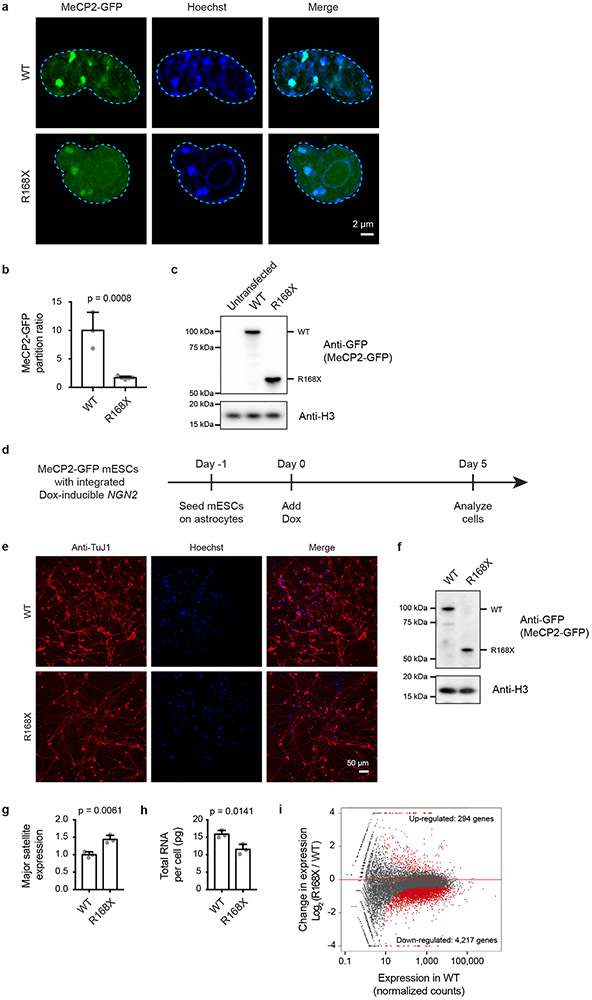
To explore the possibility that patient mutations causing IDR-2 loss lead to deficiencies in condensate incorporation in living cells, we focused on the common R168X patient mutation, which completely deletes IDR-2 and corresponds to the ΔIDR-2 deletion mutant used to examine MeCP2’s condensate-forming ability in vitro (Fig. 2b-d, Extended Data Fig. 3m-o). We examined mESCs expressing endogenously tagged MeCP2-GFP WT and R168X-GFP mutant proteins (Extended Data Fig. 9). Live-cell imaging showed a striking reduction in the ability of mutant protein to partition into heterochromatin condensates (Extended Data Fig. 9a, b). Reduced partitioning was not a simple consequence of decreased mutant protein abundance (Extended Data Fig. 9c, d), as partitioning into heterochromatin condensates was not rescued by overexpression of the R168X mutant (Extended Data Fig. 10a-c). Reduced partitioning of MeCP2 into heterochromatin condensates was also observed in R168X mutant neurons (Fig. 4a, b, Extended Data Fig. 10d-f). These results indicate that mutations that occur in RTT patients reduce MeCP2’s condensate interactions in cells.
Figure 4. R168X mutant MeCP2 displays reduced partitioning into heterochromatin condensates and causes disease-relevant cellular phenotypes in neurons.
a. Live-cell images of endogenous-tagged MeCP2-GFP WT and R168X mutant proteins with Hoechst and SiR-Tubulin staining in neurons.
b. Partition ratios of MeCP2-GFP proteins at heterochromatin condensates for experiments in Fig. 4a. Mean±SD, n=10 cells per condition. Two-tailed Student’s t-test: p<0.0001, t=8.8921, df=18.
c. Number of heterochromatin condensates per cell in endogenous-tagged MeCP2-GFP WT and R168X mutant neurons. Mean±SD, n=13 cells per condition. Two-tailed Student’s t-test: p=0.0353, t=2.2314, df=24.
d. Heterochromatin condensate volumes in endogenous-tagged MeCP2-GFP WT and R168X mutant neurons. Mean±SD, condensates per condition: WT (n=311), R168X (n=252). Two-tailed Student’s t-test: p=0.2239, t=1.2176, df=561.
e. Live-cell images of endogenous-tagged MeCP2-GFP (WT or R168X mutant) and HP1α-mCherry in neurons.
f. Partition ratios of HP1α-mCherry at heterochromatin condensates for experiments in Fig. 4e. Mean±SD, n=8 cells per condition. Two-tailed Student’s t-test: p=0.0027, t=3.6444, df=14.
g. Model of interactions contributing to MeCP2 condensate formation with DNA.
RTT is associated with various cellular phenotypes, including altered chromatin architecture23, disrupted cofactor recruitment13,15, and widespread transcriptional dysregulation8,20,24. R168X mutant mESCs showed evidence of each of these disease-associated cellular phenotypes. R168X mutant mESCs displayed changes in chromatin architecture, as heterochromatin condensates increased in number (Extended Data Fig. 9e) but decreased in volume (Extended Data Fig. 9f).
Mutant cells showed reduced ability to partition HP1α cofactor into heterochromatin condensates (Extended Data Fig. 9g, h), which was not due to reduced HP1α abundance (Extended Data Fig. 9i), consistent with the ability of MeCP2 condensates to selectively partition and concentrate HP1α in vitro (Extended Data Fig. 4b-g). R168X mutant mESCs displayed evidence of widespread transcriptional dysregulation with loss of heterochromatin-associated repetitive element silencing (Extended Data Fig. 9j), reduced total RNA abundance (Extended Data Fig. 9k), and broad downregulation of euchromatic genes (Extended Data Fig. 9l). These RTT-associated cellular phenotypes were also observed in R168X mutant neurons (Fig. 4c-f, Extended Data Fig. 10g-i). Thus, the loss of the IDR-2 domain, which plays a major role in condensate formation, produced a range of cellular phenotypes associated with RTT.
We propose a condensate model for MeCP2 (Fig. 4g) that incorporates our conventional understanding of the mechanisms by which MeCP2 dysregulation contributes to cellular phenotypes, but adds the view that large numbers of MeCP2 molecules, using multiple weak and dynamic interactions, form membraneless bodies that can concentrate and compartmentalize additional components engaged in heterochromatin function. A recent study also reported that MeCP2 exhibits condensate properties that may be relevant to its interaction with histone H125. Our results suggest a link between RTT mutations, altered MeCP2 condensate properties, and disease-associated cellular phenotypes. MeCP2’s MBD and IDR-2 domains are both required for efficient condensate formation, and because multiple RTT mutations in these domains disrupt condensate formation, condensate disruption may be a common pathway for disease pathology caused by mutations in both domains. RTT mutations can also reduce MeCP2 protein levels26, which may contribute to condensate disruption, as condensates can be highly sensitive to protein concentration10. RTT mutations are a leading cause of intellectual disability in females, yet evidence in animal models indicates that some symptoms may be reversible if a suitable therapy were developed22,27,28. We suggest that new approaches to pharmacological modification of condensate behaviors29,30, if developed to selectively impact heterochromatin condensates, might provide therapeutic benefits for patients with RTT.
Methods
Cell culture
V6.5 murine embryonic stem cells (ESCs) were a gift from R. Jaenisch, and were authenticated by STR analysis compared to commercially acquired cells of the same line. MeCP2-GFP Mini (ΔNIC, Tillotson et al., Nature 2017) murine ESCs were a gift from A. Bird, and were not subject to authentication.
ESCs were cultured in 2i/LIF media on tissue culture treated plates coated with 0.2% gelatin (Sigma G1890). ESCs were grown in a humidified incubator with 5% CO2 at 37 °C. Cells were passaged every 2-3 days by dissociation using TrypLE Express (Gibco 12604). The dissociation reaction was quenched using serum/LIF media. Cells were tested regularly for mycoplasma using the MycoAlert Mycoplasma Detection Kit (Lonza LT07-218) and found to be negative.
The composition of N2B27 media is as follows: DMEM/F12 (Gibco 11320) supplemented with 0.5X N2 supplement (Gibco 17502), 0.5X B27 supplement (Gibco 17504), 2 mM L-glutamine (Gibco 25030), 1X MEM non-essential amino acids (Gibco 11140), 100 U/mL penicillin-streptomycin (Gibco 15140), 0.1 mM 2-mercaptoethanol (Sigma M7522).
The composition of 2i/LIF media is as follows: N2B27 media, 3 μM CHIR99021 (Stemgent 04-0004), 1 μM PD0325901 (Stemgent 04-0006), and 1000 U/mL leukemia inhibitor factor (LIF) (ESGRO ESG1107).
The composition of serum/LIF media is as follows: KnockOut DMEM (Gibco 10829) supplemented with 15% fetal bovine serum (Sigma F4135), 2 mM L-glutamine (Gibco 25030), 1X MEM non-essential amino acids, 100 U/mL penicillin-streptomycin (Gibco 15140), 0.1 mM 2-mercaptoethanol (Sigma M7522), and 1000 u/mL leukemia inhibitor factor (LIF) (ESGRO ESG1107).
HEK293T cells were purchased from ATCC (ATCC CRL-3216) and cultured in DMEM (Gibco 11995-073) with 10% fetal bovine serum (Sigma F4135), 100 U/mL Penicillin-Streptomycin (Gibco 15140), 2 mM L-glutamine (Gibco 25030). Cells were not subject to authentication. Cells were tested regularly for mycoplasma using the MycoAlert Mycoplasma Detection Kit (Lonza LT07-218) and found to be negative.
Genome editing
The CRISPR/Cas9 system was used to generate genetically modified ESC lines. Target-specific sequences were cloned into a plasmid containing sgRNA backbone, a codon-optimized version of Cas9, and mCherry or BFP. For generation of the MeCP2-mEGFP and HP1a-mCherry endogenously tagged lines, homology directed repair templates were cloned into pUC19 using NEBuilder HiFi DNA Master Mix (NEB E2621S). The homology repair template consisted of mEGFP or mCherry cDNA sequence flanked on either side by 800 bp homology arms amplified from genomic DNA using PCR. The following sgRNA sequences with PAM sequence in parentheses were used for CRISPR/Cas9 targeting:
sgRNA_Mecp2_C-term: GTAAAGTCAGCTAACTCTCT (CGG)
sgRNA_Mecp2_R168: gAGGTGGTTTCTGCTCTCTCC (TGG)
sgRNA_Cbx5_C-term: gAAGAAAGCGCGAAGAGCTAA (AGG)
To generate genetically modified cell lines, 750,000 cells were transfected with 833 ng Cas9 plasmid and 1,666 ng non-linearized homology repair template using Lipofectamine 3000 (Invitrogen L3000). Cells were sorted 48 hours after transfection for the presence of either mCherry or BFP fluorescence proteins encoded on the Cas9 plasmid to enrich for transfected cells. This population was allowed to expand for 1 week before sorting a second time for the presence of GFP or mCherry. 40,000 GFP of mCherry positive cells were plated in serial dilution in a 6-well plate and allowed to expand for a week before individual colonies were manually picked into a 96-well plate. 24 colonies were screened for successful targeting using PCR genotyping to confirm insertion. PCR genotyping was performed using Phusion polymerase (Thermo Scientific F531S). Products were amplified according to kit recommendations and visualized on a 1% agarose gel. The following primers were used for PCR genotyping:
MeCP2-GFP_fwd: AGCAGCATCTGCAAAGAAGAG
MeCP2-GFP_rev: CAGAGCCCTACCCATAAGGAG
HP1α-mCherry_fwd: AACGTGAAGTGTCCACAGATTG
HP1α-mCherry_rev: TTATGGATGCGTTTAGGATGG
MeCP2-GFP_R168X_fwd: AGACACCTCCTTGGACCCTAA
MeCP2-GFP_R168X_rev: ACCCTTTTCACCTGAACACCT
Neuronal differentiation
Neurons were derived from mESCs by expression of NGN2 to induce neuronal differentiation31,32. A doxycycline-inducible NGN2 expression construct with a puromycin-resistance gene was integrated into mESCs using the PiggyBac transposon system. ESCs with successful integration of the expression construct were selected with puromycin (Gibco A1113803). Prior to induction of neuronal differentiation, mESCs were seeded in 2i/LIF media onto a layer of mouse astrocytes grown on either tissue culture treated plates or 35 mm glass plates (MatTek P35G-1.5-20-C) coated with poly-L-ornithine (Sigma P4957) and laminin (Corning 354232). 24 hours after seeding mESCs, NGN2 expression was induced by changing to N2B27 media with 2 μg/mL doxycycline (Sigma D9891). Media was changed daily with 2 μg/mL doxycycline in N2B27 media. Neurons were harvested for experiments 5 days after induction of NGN2 expression, and neuronal status was confirmed by immunofluorescence staining for TuJ1 (Covance MMS-435P).
Live-cell imaging
Cells were grown on 35 mm glass plates (MatTek P35G-1.5-20-C) coated with poly-L-ornithine (Sigma P4957) for 30 minutes at 37 °C followed by coating with laminin (Corning 354232) for 2 hours at 37 °C, and imaged in 2i/LIF media using an LSM880 confocal microscope with Airyscan detector (Zeiss). Cells were imaged on a 37 °C heated stage supplemented with 37 °C humidified air. Additionally, the microscope was enclosed in an incubation chamber heated to 37 °C. ZEN Black Edition v. 2.3 (Zeiss) software was used for acquisition. Images were acquired with the Airyscan detector in super-resolution (SR) mode with a Plan-Apochromat 63x/1.4 oil objective. Raw Airyscan images were processed using ZEN v. 2.3.
In order to quantify MeCP2 condensate volumes, Z-stack images were taken using the ZEN v. 2.3 software. Cells were treated with SiR-Hoechst (also known as SiR-DNA dye) (Cytoskeleton CY-SC007) to stain DNA or SiR-Tubulin (Cytoskeleton CY-SC002) to stain tubulin to facilitate cell identification and microscope focusing. Far-red (SiR-DNA) signal was used to determine the upper-and lower-Z boundaries of the nucleus. Then, images were taken in both 488 nm channel (MeCP2-GFP) and the 643 nm channel (Sir-DNA) at 0.19 micron steps up through the nucleoplasm. Images are the result of a single Airyscan image, processed using the ZEN v. 2.3 software. Heterochromatin condensate volumes were calculated using a custom script (www.github.com/jehenninger/MECP2_neuron) in Python v. 3.4.3. To calculate heterochromatin condensate volumes, the SiR-DNA signal was used to define nuclear-boundaries for a given cells. Heterochromatin condensates were identified as signal dense objects within the nuclear boundary with an empirical cutoff of 2.35 standard deviations above the mean signal. Once identified the volume of each heterochromatin condensate was quantified.
Fluorescence recovery after photobleaching (FRAP) was used to investigate dynamic internal rearrangement and internal-external exchange of molecules within heterochromatin foci, which are properties expected for liquid-like condensates33. FRAP was performed on LSM880 Airyscan microscope with 488 nm and 561 nm lasers. Bleaching was performed at 100% laser power and images were collected every two seconds. Each image utilizes the LSM880 Airyscan averaging capacity and is the averaged result of two images. The combined image was then processed using ZEN v. 2.3. FIJI/ImageJ (v. 2.0.0-rc-65) was used to calculate intensity values in images. Recovery after photobleaching was calculated by first subtracting background values, and then quantifying fluorescence intensity lost within the bleached condensate normalized to signal within a condensate in a separate, neighboring cell to account for image acquisition photobleaching. Post-bleach image taken 12 seconds post-photobleaching.
Partition ratios were used to quantify the ability of a protein to partition into heterochromatin condensates relative to the nucleoplasm in live-cell imaging experiments. A partition ratio for each cell was calculated as the ratio of the average pixel intensity within heterochromatin condensates relative to the average pixel intensity within 8-12 non-heterochromatic nucleoplasmic regions. Heterochromatin condensates and the nucleoplasm were defined using Hoechst staining. A single focal plane was analyzed for each cell and cells with 2 or more heterochromatin condensates were used for analysis.
Immunofluorescence microscopy
Murine ESCs were plated onto glass coverslips in preparation for immunostaining. After 24 hours, cells were fixed with 4% paraformaldehyde in PBS, washed 3 times with PBS, and then permeabilized with 0.5% triton-X100 in PBS for 10 min at room temperature. Cells were then washed 3 times with PBS, blocked for 1 hour in 4% IgG-free BSA (Jackson ImmunoResearch 001-000-162) in PBS, and then stained over night with the indicated antibody in 4% IgG-free BSA at room temperature in a humidified chamber. Cells were then washed 3 times with PBS. Secondary antibodies were added to cells in 4% IgG-free BSA and incubated for 1 hour at room temperature. Cells were then washed twice in PBS. Cells were stained with Hoechst dye (Molecular Probes H3570) in PBS or water for 5 minutes, and then mounted in Vectashield mounting media (Vector Laboratories H-1000). Imaging was performed on an RPI spinning disk confocal at 100X magnification using the MetaMorph software v. 7.10.3.279 (Molecular Devices). Primary antibodies: anti-MAP2 (Invitrogen MA5-12823) and anti-MED1 (Abcam ab64965). Secondary antibodies: anti-mouse Alexa Fluor 568 (Invitrogen A11031) and antirabbit Alexa Fluor 555 (Invitrogen A21428).
Overexpression
To examine the ability of MeCP2-GFP WT and R168X mutant proteins to partition into heterochromatin condensates when present at high levels in cells, the proteins were overexpressed in cells with N-terminal GFP fusions by transfection of expression constructs. 750,000 murine ESCs were transfected with 2.5 μg MeCP2-GFP WT or R168X mutant expression plasmid using Lipofectamine 3000 (Invitrogen L3000). The following day, cells were dissociated and seeded onto poly-L-ornithine and laminin-coated 35 mm glass-bottom dishes (MatTek P35G-1.5-20-C) for live-cell imaging the next day.
Flow cytometry
Relative expression levels of endogenous-tagged proteins were examined using flow cytometry. Murine ESCs were dissociated using TrypLE Express (Gibco 12604) and the dissociation reaction was quenched using serum/LIF media. Cells were resuspended in single cell suspension in PBS and passed through a cell strainer (Corning 352235). Cells were analyzed using a LSRII flow cytometer (BD) and data was analyzed using FlowJo v.10 (BD). Standard forward and side scatter gating was used to exclude debris and isolate singlet cells. Example flow cytometry gating strategy is shown in Supplementary Figure 2. Mean fluorescence intensity was quantified for the singlet population, to determine the relative levels of endogenous-tagged fluorescent fusion proteins (MeCP2-GFP and HP1α-mCherry).
Western blot
Western blot was used to confirm expression of MeCP2-GFP WT and R168X proteins. Cell lysates were prepared by resuspending cell pellets in 2X Laemmli buffer and incubating at room temperature for 20 minutes. Lysates were then sonicated using a probe sonicator and boiled at 95 °C for 10 minutes. Samples were run on a 4-12% Bis-Tris polyacrylamide gel (Bio-Rad 3450125) using XT MOPS running buffer (Bio-Rad 1610788) at 80 V for 20 minutes, followed by 150 V until dye front reached the end of the gel. Protein was wet transferred to a 0.45 μm PVDF membrane (Millipore IPVH00010) in ice-cold transfer buffer (25 mM Tris, 192 mM glycine, 20% methanol) at 250 mA for 2 hours at 4 °C. After transfer, the membrane was blocked with 5% non-fat milk in TBS for 1 hour at room temperature, then incubated with 1:1,000 anti-GFP (Takara Bio 632381) or 1:1,000 anti-Histone H3 (Cell Signaling Technology 4499) antibody in 5% non-fat milk in TBST overnight at 4 °C. Primary antibodies were validated by their respective vendors. After washing with TBST, the membrane was incubated with 1:10,000 HRP-conjugated anti-Mouse IgG (GE Healthcare NXA931V) or anti-Rabbit IgG (GE Healthcare NA934V) secondary antibody diluted in 5% non-fat milk in TBST for 2 hours at room temperature. After washing with TBST, the membrane was developed with chemiluminescent HRP substrate (Millipore WBKLS0100) and imaged using a CCD camera. Images were captured and analyzed using Image Lab software v. 6.0.1 (Bio-Rad).
Chimeric mouse generation
To generate endogenous MeCP2-GFP tagged chimeric mice, we injected endogenous MeCP2-GFP tagged mESCs grown on irradiated murine embryonic fibroblasts (MEF) into 8-cell embryos or blastocysts and implanted into pseudo-pregnant female CD1-IGS mice. Chimeric mice were identified based on the color of the fur and female chimeras were used for imaging experiments at 10-weeks of age. Mouse studies were observational in nature, and not subject to randomization or blinding. Imaging experiments using mouse brain tissues were performed with a sample size of 3 cells, which is in line with other studies of condensates in cells16. All experiments using mice were carried out with approval from the MIT Committee on Animal Care (CAC) under protocol number 1019-059-22. Experiments were carried out under the supervision of the Division of Comparative medicine (DCM) at MIT, which provides centralized management of the animal facility at the Whitehead Institute for Biomedical Research. The mouse facility conforms to federal guidelines (Animal Welfare Assurance Number A3125-01), and MIT is accredited by the Assessment and Accreditation of Laboratory Animal Care (AAALAC). Routine bedding, food, and water changes were performed by DCM. Mice were housed in a centrally controlled environment with a 12-hour light/12-hour dark cycle, temperature of 68-72 °F, and humidity of 30-50%.
Brain slice immunofluorescence microscopy
Adult female endogenous MeCP2-GFP chimeric mice were perfused with 10% formalin to fix brain tissues. Following fixation, mouse brains were incubated at 4 °C in 30% sucrose for 3 days. Brains were then sectioned using cryostat (Leica CM3050 S). Brain sections were then placed on a slide and stored at −20 °C. For immunofluorescence, brain sections were allowed to warm to room temperature, fixed with 4% PFA for 10 minutes, and immunofluorescence was performed as described in the above immunofluorescence microscopy methods section.
In order to determine size and number of heterochromatin condensates in mouse neurons, brain sections taken from endogenous-tagged MeCP2-GFP mice (described above) were stained with anti-MAP2 to indicate neuronal cells. Sections were then imaged with 0.2-micron Z-stacks using MetaMorph v. 7.10.3.279 (Molecular Devices). In MAP2-positive cells, endogenous MeCP2-GFP signal was used to determine size and number of heterochromatin condensates using FIJI/ImageJ v. 2.0.0-rc-65 3D object counter with automatic threshold determination.
Brain slice FRAP
Organotypic brain slices were obtained from adult endogenous MeCP2-GFP chimeric mice, based on a slight modification of a previously described method34. Following decapitation, the brain was extracted and placed into ice-cold dissection medium composed of hibernate A (BrainBits HA), 2% B27 supplement (Gibco 17504), 2 mM L-glutamine (Gibco 25030), and 1% penicillin/streptomycin (Gibco 15140). The cerebellum and midbrain were removed and the remaining cerebral hemispheres were separated and sliced coronally at 250 μm thickness using a McIlwain tissue chopper (Ted Pella MTC/2E). The slices were gently separated from each other in chilled dissection medium and transferred onto glass-bottom dishes in culture medium containing Neurobasal A (Gibco 10888022) with 2% B27 supplement, 2 mM L-glutamine, and 1% penicillin/streptomycin. Imaging was performed immediately after brain slice preparation. FRAP experiment was performed using the Andor Revolution spinning disk confocal with the FRAPPA module (Andor Technology). Bleaching was performed using 5-7 pulses of 20 micro-second dwell time and images were collected every second. Fluorescence intensity was measured using FIJI/ImageJ v. 2.0.0-rc-65 and analyzed as described above. Post-bleach image taken 12 seconds post-photobleaching.
Protein purification
Human cDNA was cloned into a modified version of a T7 pET expression vector. The base vector was engineered to include sequences encoding a N-terminal 6xHis followed by either mEGFP or mCherry and a 14 amino acid linker sequence “GAPGSAGSAAGGSG.” cDNA sequences, generated by PCR, were inserted in-frame after the linker sequence using NEBuilder HiFi DNA Assembly Master Mix (NEB E2621S). Mutant cDNA sequences were generated by PCR and inserted into the same base vector as described above. All expression constructs were subject to Sanger sequencing to confirm sequence identity. The following human proteins were used in experiments:
MeCP2 full length (WT): residues 1-486
MeCP2 ΔIDR-1: residues 78-486
MeCP2 ΔIDR-2 (R168X): residues 1-167
MeCP2 IDR-1: residues 1-77
MeCP2 IDR-2: residues 168-486
MeCP2 ΔBasic: residues 1-486, removing IDR-2 basic patches (residues 170-181, 184-194, 246-258, 263-274, 282-289, 301-310, and 340-348)
MeCP2 ΔAromatic: residues 1-486, removing IDR-2 aromatic residues (F226 and Y450)
MeCP2 ΔHistidine: residues 1-486, removing IDR-2 histidine-rich domain (residues 366-372)
MeCP2 ΔProline: residues 1-486, removing IDR-2 proline-rich domain (residues 376-405)
MeCP2 R133C: residues 1-486, R133C
MeCP2 T158M: residues 1-486, T158M
MeCP2 P225R: residues 1-486, P225R
MeCP2 R255X: residues 1-254
MeCP2 R270X: residues 1-269
MeCP2 R294X: residues 1-293
MeCP2 R306C: residues 1-486, R306C
MeCP2 P322L: residues 1-486, P322L
MeCP2 P389X: residues 1-288
MeCP2 Mini: same as ΔNIC mutant from Tillotson et al., Nature 2017
HP1a: residues 1-191
MED1 IDR: residues 948-1574
BRD4 IDR: residues 674-1351
BRD4 Bromo domain 1: residues 40-168
BRD4 ET domain: residues 600-683
TBLR1-CTD: residues 134-514
For protein expression, plasmids were transformed into LOBSTR cells (gift from I. Cheeseman) and grown as follows. A fresh bacterial colony was inoculated into LB media containing kanamycin and chloramphenicol and grown overnight at 37 °C. Cells were diluted 1:30 in 500 mL prewarmed LB with freshly added kanamycin and chloramphenicol and grown 1.5 hours at 37 °C. To induce expression, IPTG was added to the bacterial culture at 1 mM final concentration and growth continued for 4 hours. Induced bacteria were then pelleted by centrifugation and bacterial pellets were stored at −80 °C until ready to use.
The 500 mL cell pellets were resuspended in 15ml of Lysis Buffer (50mM Tris-HCl pH 7.5, 500 mM NaCl, and 1X cOmplete protease inhibitors) followed by sonication of ten cycles of 15 seconds on, 60 seconds off. Lysates were cleared by centrifugation at 12,000 x g for 30 minutes at 4 °C, added to 1 mL of pre-equilibrated Ni-NTA agarose, and rotated at 4 °C for 1.5 hours. The slurry was centrifuged at 3,000 rpm for 10 minutes, washed with 10 volumes of lysis buffer and proteins were eluted by incubation for 10 or more minutes rotating with lysis buffer containing 50 mM imidazole, 100 mM imidazole, or 3 X 250 mM imidazole followed by centrifugation and gel analysis. Fractions containing protein of the correct size were dialyzed against two changes of buffer containing 50 mM Tris-HCl pH 7.5, 125 mM or 500 mM NaCl, 10% glycerol and 1 mM DTT at 4 °C. Protein concentration of purified proteins was determined using the Pierce BCA Protein Assay Kit (Thermo Scientific 23225). Recombinant proteins were stored in 10% glycerol, 50 mM Tris-HCl pH 7.5, 125 mM or 500 mM NaCl, 1 mM DTT. Amicon Ultra Centrifugal filters (30K or 50K MWCO, Millipore) were used to concentrate proteins to desired working concentrations.
In vitro droplet assay
In vitro droplet assays were used to investigate the physicochemical properties of condensate-associated proteins33,35. In vitro droplet assays containing DNA were performed by adding recombinant protein to Buffer D (10% glycerol, 50 mM Tris-HCl pH 7.5, 1 mM DTT) containing DNA at the indicated concentration. In vitro droplet assays containing nucleosomal arrays were performed by diluting purified nucleosomes to desired concentration in buffer containing 6 mM MgCl2, 2% glycerol, 50 mM Tris-HCl pH 7.5 and 1 mM DTT. Recombinant protein was mixed with buffer containing 2% glycerol, 50 mM Tris-HCl pH 7.5 and 1 mM DTT, and then combined with the diluted nucleosomes to initiate droplet formation. In vitro droplet assays containing PEG-8000 were induced by adding recombinant proteins to droplet formation buffer composed of 10% glycerol, 50 mM Tris-HCl pH 7.5, 1 mM DTT and NaCl ranging from 0 mM to 500 mM, with 10% PEG-8000 added. For phase diagram generation (Extended Data Fig. 3g) droplet formation buffer was modified to contain 5% PEG-8000. Droplet assays were performed in 8-tube PCR strip. The indicated protein amount was added to droplet formation buffers and the solution was mixed by pipetting. The reaction was incubated for 10 minutes at room temperature in the 8-well PCR strip, and then loaded onto either a custom slide chamber created from a glass coverslip mounted on two parallel strips of double-sided tape mounted on a glass microscopy slide, or a well of a glass-bottom 384-well plate (CellVis P384-1.5H-N). Reactions were incubated for 20 minutes in the imaging vessel to allow droplets in solution to settle on the glass imaging surface. The reaction was then imaged on an Andor Revolution spinning disk confocal microscope using an Andor iXion+ EM-CCD camera with a 100x or 150x objective using MetaMorph v. 7.10.3.279 (Molecular Devices). Images presented are of droplets that have settled on the glass coverslip or the glass bottom of the 384-well plate.
To analyze in-vitro phase separation imaging experiments, custom Python v. 3.4.3 scripts (www.github.com/jehenninger/in_vitro_droplet_assay) were used to identify droplets and characterize their size and shape. For any particular experimental condition, intensity thresholds based on the peak of the histogram and size thresholds (2 or 9 pixels per z-slice) were employed to segment the image. Droplet identification was performed on the 488 nm channel (MeCP2-GFP) and areas and aspect ratios were determined. Hundreds of droplets, identified in between 5-15 independent fields of view from each reaction, were quantified. Exact number of visual fields and droplets used for visualization and quantification are reported in the associated figure legends of relevant panels or in the methods below. To calculate the condensed fraction, the sum total of the intensities in all droplets of a given field (I-in) and the sum total intensity in the bulk dilute phase outside the droplets were calculated for each channel. Condensed fraction was computed as (I-in)/((I-in)+(I-out)). To calculate the partition ratio, the average intensity of each droplet (C-in) and the average intensity of the bulk dilute phase outside the droplet (C-out) was calculated for each channel. The partition coefficient was computed as (C-in)/(C-out). In Fig. 1, Fig 3, and Extended Data Fig. 6, the condensed fraction curves were fitted to the data using a logistic curve36 in Prism v. 7.0a (GraphPad).
For in vitro droplet FRAP, droplets were formed as described above. The experiment was performed using the Andor Revolution spinning disk confocal microscope with FRAPPA module (Andor Technology). Bleaching was performed using 1 pulse of 20 second dwell time and images were collected every second. Fluorescence intensity was measured using FIJI/ImageJ v. 2.0.0-rc-65 and analyzed as described above.
To generate a phase diagram for MeCP2, MeCP2-GFP droplets formation reactions were performed in a range of NaCl and protein concentration. Ten independent fields of view were captured for each condition, and droplets were identified as described above. An average partition ratio threshold of >1.85 was used to determine if a given condition formed droplets.
Droplet numbers
For relevant figure panels, the number of droplets analyzed per condition are indicated below.
Fig. 1h, Extended Data Fig. 3k: No DNA (n=592), DNA (n=1,395), methyl-DNA (n=1,130).
Fig. 2c: WT (n=1,419), ΔIDR-1 (n=1,084), ΔIDR-2 (n=208), IDR-1 (n=112), IDR-2 (n=626).
Fig. 2f: WT (n=273), ΔBasic (n=538), ΔAromatic (n=210), ΔHistidine (n=274), ΔProline (n=193).
Extended Data Fig. 3b: MeCP2-GFP 1.25 μM (n=1,767), 2.5 μM (n=1,041), 5 μM (n=834), 10 μM (n=483).
Extended Data Fig. 3e: NaCl 100 mM (n=685), 200 mM (n=603), 300 mM (n=521), 400 mM (n=930).
Extended Data Fig. 3n: WT (n=106), ΔIDR-1 (n=228), ΔIDR-2 (n=89), IDR-1 (n=51), IDR-2 (n=247).
Extended Data Fig. 4c: HP1α-mCherry (n=476), MED1-IDR-mCherry (n=561), BRD4-IDR-mCherry (n=462), mCherry (n=413).
Extended Data Fig. 4e: HP1α-mCherry (n=1,221), MED1-IDR-mCherry (n=1,156), BRD4-IDR-mCherry (n=1,124), mCherry (n=1,143).
Extended Data Fig. 4g: HP1α-mCherry (n=456), MED1-IDR-mCherry (n=331), BRD4-IDR-mCherry (n=338), mCherry (n=402).
Extended Data Fig. 4j: No poly-nucleosomes (n=599), Poly-nucleosomes (n=351).
Extended Data Fig. 5b: HP1α-mCherry (n=496), BRD4-IDR-mCherry (n=484), BRD4-BD1-mCherry (n=596), BRD4-ET-mCherry (n=451), mCherry (n=398).
Extended Data Fig. 6a: WT 0.5 μM (n=24), WT 1 μM (n=35), WT 2 μM (n=390), WT 4 μM (n=752), WT 6 μM (n=733), WT 8 μM (n=508), P389X 0.5 μM (n=36), P389X 1 μM (n=49), P389X 2 μM (n=315), P389X 4 μM (n=680), P389X 6 μM (n=578), P389X 8 μM (n=509), R294X 0.5 μM (n=30), R294X 1 μM (n=47), R294X 2 μM (n=14), R294X 4 μM (n=200), R294X 6 μM (n=545), R294X 8 μM (n=516), R270X 0.5 μM (n=58), R270X 1 μM (n=44), R270X 2 μM (n=12), R270X 4 μM (n=158), R270X 6 μM (n=549), R270X 8 μM (n=541), R255X 0.5 μM (n=39), R255X 1 μM (n=53), R255X 2 μM (n=21), R255X 4 μM (n=7), R255X 6 μM (n=1), R255X 8 μM (n=7), R168X 0.5 μM (n=42), R168X 1 μM (n=19), R168X 2 μM (n=3), R168X 4 μM (n=1), R168X 6 μM (n=1), R168X 8 μM (n=1).
Extended Data Fig. 6b: WT 0.5 μM (n=346), WT 1 μM (n=1,304), WT 2 μM (n=1,442), WT 4 μM (n=1,117), WT 6 μM (n=1,027), WT 8 μM (n=946), T158M 0.5 μM (n=2,274), T158M 1 μM (n=1,561), T158M 2 μM (n=3,798), T158M 4 μM (n=2,085), T158M 6 μM (n=1,723), T158M 8 μM (n=1,165), R133C 0.5 μM (n=2,577), R133C 1 μM (n=1,465), R133C 2 μM (n=2,305), R133C 4 μM (n=1,937), R133C 6 μM (n=1,380), R133C 8 μM (n=764).
Extended Data Fig. 6c: WT 0.5 μM (n=31), WT 1 μM (n=90), WT 2 μM (n=1,237), WT 4 μM (n=672), WT 6 μM (n=536), WT 8 μM (n=537), R306C 0.5 μM (n=23), R306C 1 μM (n=221), R306C 2 μM (n=1,236), R306C 4 μM (n=520), R306C 6 μM (n=507), R306C 8 μM (n=465). Extended Data Fig. 6f: WT 0.5 μM (n=1,580), WT 1 μM (n=1,700), WT 2 μM (n=1,042), WT 4 μM (n=1,202), WT 6 μM (n=1,293), WT 8 μM (n=971), P322L 0.5 μM (n=934), P322L 1 μM (n=1,688), P322L 2 μM (n=2,719), P322L 4 μM (n=4,782), P322L 6 μM (n=1,395), P322L 8 μM (n=2,731), P225R 0.5 μM (n=1,378), P225R 1 μM (n=2,061), P225R 2 μM (n=1,632), P225R 4 μM (n=4,510), P225R 6 μM (n=2,876), P225R 8 μM (n=3,015).
Extended Data Fig. 7b: MeCP2-GFP WT (n=719), MeCP2-GFP R306C (n=707).
Extended Data Fig. 7d: MeCP2-GFP WT (n=1,103), MeCP2-GFP R306C (n=535).
Extended Data Fig. 8c: MeCP2-GFP WT (n=459), MeCP2-GFP Mini (n=363).
Extended Data Fig. 8f, g: MeCP2-GFP WT (n=288), MeCP2-GFP Mini (n=341).
Extended Data Fig. 8i: MeCP2-GFP WT (n=1,109), MeCP2-GFP Mini (n=910).
Fluorescent DNA production
Fluorescent DNA for droplet assays was produced by amplifying plasmid DNA using oligonucleotide primers with 5’-Cy5 fluorophore modifications (Integrated DNA Technologies). Amplification of plasmid templates was performed using Phusion polymerase (Thermo Scientific F531S). Fluorescent PCR products were gel purified using the Monarch gel extraction kit (NEB T1020S). The 376 bp DNA sequence used in droplet assays is: TGTAAAACGACGGCCAGTGGATCCTAGGCTTAATTTGCATTGCAGTACATTTGCATGCATGATATTTGCATTAAGCTTGATTTGCATGTTTCAGAATTTGCATCGGCTAGCATTTGCATGGGCTAGAATTTGCATGCCGGATAATTTGCATGGCGATTCATTTGCATGCCAAATCATTTGCATGCATGAACATTTGCATGGCTTACAATTTGCATGAAACATAATTTGCATCGATCGAAATTTGCATGTAGCCGAATTTGCATGTAGCTAAATTTGCATGAAATCGGATTTGCATGTAGCAATATTTGCATCTAGCCTAATTTGCATACCCTAGCATTTGCATTAGATTCGGCGGCCGCGTCATAGCTGTTTCCTG
To generate methylated DNA template for in vitro droplet assays, Cy5-labeled fluorescent PCR product produced as described above was treated with M.SssI methyltransferase (NEB M0226L). The reaction was performed in 50 μL and contained 160 μM s-adenosylmethionine (SAM), 1 μL of M.SssI, and 4 μg of DNA. Contents were incubated for 4 hours at 37 °C, and then M.SssI was heat-inactivated for 20 minutes at 65 °C. Resulting methylated templates were purified using the NEB Monarch DNA and PCR cleanup kit (NEB T1030S). Methylation of templates was verified by methyl-specific restriction digestion using ClaI (NEB R0197S).
Poly-nucleosome purification
Poly-nucleosome arrays were purified from mESCs using a modified protocol adapted from Loyola et al., Mol Cell 200637. Briefly, nuclei were isolated from mESCs by resuspending cells in a hypotonic buffer BC50 (HEPES pH 7.5, 50 mM NaCl) + 5 mM MgCl2 + 0.05% NP-40 and douncing with a Kontes glass dounce (15 strokes with each pestle A then B). The nuclei were then digested with a limited amount of micrococcal nuclease and then the samples were centrifuged at maximum speed for 10 min. To purify poly-nucleosome arrays, the supernatant was loaded on a sucrose gradient and centrifuged for 20 hours in a swinging bucket rotor (Sorvall SW28) at 18,000 rpm. The sucrose gradients (28 mL each) were 5-15% in a base buffer of HEPES pH 7.5 and 200 mM NaCl. Individual fractions corresponding to poly-nucleosome arrays were collected. To determine the length distribution of the poly-nucleosome arrays in each faction, DNA was purified from each fraction and analyzed on an agarose gel. Fractions containing nucleosomal arrays ranging between 7-20 nucleosomes in length were pooled and dialyzed against buffer BC50 + 5mM MgCl2. Purified poly-nucleosomes were stored in liquid nitrogen until ready to use in droplet assays.
MeCP2 IDR-2 sequence features
Specific sequence features within protein IDRs have been found to contribute to condensate formation36,38-43. Sequence features within MeCP2 IDR-2 were identified and deletion mutants were used to examined for their ability to contribute to droplet formation in vitro and transcriptional repression in a reporter assay. Basic patches in IDR-2 were defined as previously described42. Briefly, net charge per residue (NCPR) along MeCP2 protein sequence was computed using a sliding window of 5 residues and a step size of 1 residue using localCIDER (v.0.1.14)44. Stretches of 4 or more consecutive windows having a NCPR > +0.35 per window were considered to be basic patches. MeCP2 IDR-2 contained 7 basic patches corresponding to residues 170-181, 184-194, 246-258, 263-274, 282-289, 301-310, and 340-348. Two aromatic residues (residues F226 and Y450) are present in IDR-2. A histidine-rich domain (residues 366-372) and a proline-rich domain (residues 376-405) in IDR-2 were defined based on UniProt annotations.
Transcriptional repression reporter assay
A transcriptional repression reporter assay was used to examine the ability of MeCP2 IDR-2 sequence feature deletion mutants to repress transcription. Plasmids expressing MeCP2 IDR-2 sequence feature deletion mutants as fusions with the GAL4 DNA-binding domain (GAL4-DBD) from a SV40 promoter were co-transfected with a transcriptional repression reporter plasmid, containing an array of five GAL4 DNA binding sequence motifs located upstream of a chicken beta-actin promoter driven Firefly luciferase gene. To control for transfection efficiency, a plasmid expressing Renilla luciferase under the control of the SV40 promoter was also cotransfected. HEK293T cells were transfected using Lipofectamine 3000 (Invitrogen L3000), 24 hours after plating in a 96-well white flat bottom plate (Corning 3917). 24 hours after transfection, expression of the transcriptional repression reporter Firefly luciferase and control Renilla luciferase were assays using the Dual-Glo Luciferase Assay System (Promega E2940) and measured using a plate reader. Luciferase activity was calculated for each condition by dividing the Firefly luciferase signal by the Renilla luciferase signal, and was normalized to the GAL4-DBD alone condition. Assay was performed with three biologically independent samples per condition.
Gene expression analysis
RT-qPCR was used to quantify expression of heterochromatin-associated major satellite repeats. RNA was harvested using the RNeasy Mini Plus kit (QIAGEN 74134). A reverse transcriptase reaction was then performed using SuperScript III (Invitrogen 18080). RT-qPCR reactions were performed using Power SYBR Green PCR Master Mix (Applied Biosystems 43676) and measured using a QuantStudio 5 Real-Time PCR System (Applied Biosystems). Major satellite expression level was calculated using the delta-delta Ct method using Gapdh as a control and normalized to expression level in the WT condition. The following primers were used.
MajorSat_for: TGGAATATGGCGAGAAAACTG
MajorSat_rev: AGGTCCTTCAGTGGGCATTT
Gapdh_for: AACTTTGGCATTGTGGAAGG
Gapdh_rev: CACATTGGGGGTAGGAACAC
RNA-seq was used to profile expression of genes. RNA was harvested from 2 million cell aliquots using the RNeasy Mini Plus kit (QIAGEN 74134). Amount of RNA extracted was quantified using a Nanodrop spectrophotometer (Thermo Scientific). A fixed amount of ERCC RNA Spike-In (Invitrogen 4456740) was added to each sample for use in cell number normalization45. Samples were treated with DNA-free DNA Removal Kit (Invitrogen AM1906) prior to library preparation using the KAPA RNA HyperPrep Kit with RiboErase (KAPA Biosystems K8562) and sequencing on a HiSeq2500 (Illumina).
RNA-seq reads were mapped using STAR aligner (v. 2.6.1a)46 to the murine RefSeq mm9 reference with ERCC spike-in reference sequences added. Alignment was performed using ENCODE long RNA-seq pipeline default parameters: --outFilterType BySJout, --outSAMattributes NH HI AS NM MD, --outFilterMultimapNmax 20, --outFilterMismatchNmax 999, --outFilterMismatchNoverReadLmax 0.05, --alignIntronMin 20, --alignIntronMax 1000000, --alignMatesGapMax 1000000, --alignSJoverhangMin 8, --alignSJDBoverhangMin 1, --sjdbScore 1. Gene expression values were quantified using RSEM (v. 1.2.31) with default parameters47. Differential expression analysis was performed using DESeq2 (v. 1.24.0) with default parameters48. Spike-in cell number normalization was performed by using ERCC spike-ins to estimate size factors used for DESeq2 library normalization. DESeq2 uses a two-tailed Wald test to identify differentially expressed genes, and the default multiple test adjusted p-value cutoff of 0.1 was used to determine differentially expressed genes.
Bioinformatic analysis
MECP2 gene expression values in transcripts per million (TPM) from RNA-seq of human tissues were acquired from the Genotype-Tissue Expression (GTEx) project release v. 7. In instances where multiple regions of the same tissue were assayed, the highest expression value was used to represent the tissue. TPM values greater than 1 were considered to be expressed. The GTEx Project was supported by the Common Fund of the Office of the Director of the National Institutes of Health, and by NCI, NHGRI, NHLBI, NIDA, NIMH, and NINDS.
Rett syndrome patient mutation data was acquired from RettBASE49. Coding mutations associated with female patients with Rett syndrome were used for analysis. A histogram of mutation count along the length of the protein was plotted and the type of mutation (nonsense, frameshift, missense) was indicated.
Predicted disorder values along the length of human MeCP2 protein was determined using PONDR VLS2 algorithm. Higher values indicate greater predicted disorder.
Protein sequence conservation along the length of human MeCP2 protein was determined by extracting protein sequences in UniProt that shared at least 50% identity with human MeCP2 sequence (UniRef50_Q9Z2D6). Extracted sequences were subject to multiple sequence alignment using Clustal Omega (v. 1.2.4). Alignments were scored for protein sequence conservation along the length of human MeCP2 using Jensen-Shannon divergence50 . Higher values indicated greater conservation.
Statistics and Reproducibility
Relevant statistical information for each experiment are included in the associated figure legends. For t-tests, data was assumed to be normal. For RNA-seq analysis, a two-sided Wald test was used to identify differentially expressed genes and p-values were adjusted for multiple comparison.
Experiments with representative images conducted in this study were repeated multiple times independently with similar results. Live-cell imaging of endogenously tagged mESCs and neurons (Fig. 1a, 4a, 4e, Extended Data Fig. 1a, 1b, 9a, 9g) was performed at least three times, on different days with cells plated independently. Live-cell imaging of endogenously tagged MeCP2-Mini mESCs (Extended Data Fig. 8j) was performed twice. Live-cell imaging of overexpressed MeCP2-GFP in mESCs (Extended Data Fig. 10a) was performed at least three times. Immunofluorescence in mouse brain cells (Fig. 1d) was performed on two brain sections. Immunofluorescence in mESCs (Extended Data Fig. 4a) was performed twice.
Immunofluorescence in differentiated neurons (Extended Data Fig. 10e) was performed twice. FRAP experiments in mESCs (Fig. 1b, Extended Data Fig. 1c) were performed independently at least twice. FRAP experiments on mouse brain sections (Fig. 1e) was performed on three brain slices. FRAP experiments on MeCP2 droplets (Extended Data Fig. 3i) were performed on 10 individual droplets. Droplet fusion (Extended Data Fig. 3h) was observed more than 10 times. PCR genotyping of MeCP2-GFP tagged ESCs (Extended Data Fig. 2c) was performed twice. Droplet experiments in Fig. 1g, 2b, 2e, 3b, 3d, 3f, Extended Data Fig. 3a, 3d, 3j, 3m, 4b, 4d, 4f, 4h, 4i, 5a, 6d, 7a, 7c, 8b, 8e, 8h were performed at least two times independently. Western blots (Extended Data Fig. 9d, 10c, 10f) were performed twice.
Extended Data
Extended Data Figure 1. MeCP2 and HP1α are dynamic components of heterochromatin condensates.
a. Live-cell images of endogenous-tagged HP1α-mCherry and Hoechst staining in mESCs.
b. Live-cell images of endogenous-tagged MeCP2-GFP and HP1α-mCherry in mESCs.
c. Live-cell images of FRAP experiments with endogenously tagged HP1α-mCherry mESCs.
d. FRAP curves for experiments in Extended Data Fig. 1c. Photobleaching occurs at t = 0 s. Mean±SEM, n=7 cells.
e. Half-time of photobleaching recovery for MeCP2-GFP and HP1α-mCherry at heterochromatin condensates in imaging experiments in Fig. 1b and Extended Data Fig. 1c. Mean±SEM, n=7 cells per condition. Two-tailed Student’s t-test: p=0.90, t=0.13, df=12.
f. Mobile fractions of MeCP2-GFP and HP1α-mCherry within heterochromatin condensates in imaging experiments in Fig. 1b and Extended Data Fig. 1c, determined by FRAP analysis. Mean±SEM, n=7 cells per condition. Two-tailed Student’s t-test: p=0.09, t=1.87, df=12.
Extended Data Figure 2. Generation of endogenous-tagged MeCP2-GFP chimeric mice.
a. Schematic of MeCP2-GFP chimeric mouse generation using endogenous-tagged MeCP2-GFP mESCs. Endogenous-tagged MeCP2-GFP mESCs derived from V6.5 background were injected into embryos from CD1-IGS mice and multiple embryos were implanted into pseudo-pregnant female mice. Chimeric pups were distinguished from non-chimeric littermates by agouti coat color. MeCP2-GFP tagged adult chimeric mice were used for experiments.
b. Schematic of strategy used to generate endogenous-tagged MeCP2-GFP mESCs.
c. PCR genotyping of endogenous-tagged MeCP2-GFP mESCs. For gel source data, see Supplementary Figure 1.
d. MECP2 expression values in transcripts per million (TPM) measured by RNA-seq for various human tissues surveyed by GTEx. Tissues are ordered based on expression level. TPM values greater than 1 are considered to be expressed.
Extended Data Figure 3. MeCP2 forms phase-separated droplets in vitro.
a. Droplet experiments examining effect of MeCP2 concentration. MeCP2-GFP was added to droplet formation buffers with 100 mM NaCl and 10% PEG-8000.
b. Droplet areas for experiments in Extended Data Fig. 3a. Fields per condition n=10.
c. MeCP2-GFP condensed fraction for experiments in Extended Data Fig. 3a. Mean±SD. Fields per condition n=10.
d. Droplet experiments examining effect of salt concentration. MeCP2-GFP at 10 μM was added to droplet formation buffers with indicated NaCl concentrations and 10% PEG-8000.
e. Droplet areas for experiments in Extended Data Fig. 3d. Fields per condition n=15.
f. MeCP2-GFP condensed fraction for experiments in Extended Data Fig. 3d. Mean±SD. Fields per condition n=15.
g. Phase diagram of MeCP2 droplet formation. MeCP2-GFP was added to droplet formation buffers with indicated NaCl concentrations and 5% PEG-8000. Filled-in circles indicate conditions with droplets. Fields per condition n=10.
h. Droplet experiments showing MeCP2 droplet fusion. MeCP2-GFP at 10 μM was added to droplet formation buffers with 100 mM NaCl and 10% PEG-8000.
i. Droplet experiments showing MeCP2 droplet FRAP. Conditions same as in Extended Data Fig. 3h. Photobleaching at t=0 s.
j. Droplet experiments examining HP1α. HP1α-mCherry at 10 μM was added to droplet formation buffers with 100 mM NaCl and 10% PEG-8000.
k. DNA-Cy5 partition ratios in MeCP2-GFP droplets for experiments in Fig. 1g. Fields per condition n=15.
l. Expanded schematic of MeCP2 protein (Fig. 2a) with protein sequence conservation, net charge per residue (NCPR), and residue plots.
m. Droplet experiments examining MeCP2 deletion mutants. MeCP2-GFP deletion mutants at 10 μM were added to droplet formation buffers with 100 mM NaCl and 10% PEG-8000.
n. Droplet areas for experiments in Extended Data Fig. 2m. Fields per condition n=5.
o. MeCP2-GFP condensed fraction for experiments in Extended Data Fig. 2m. Mean±SD. Fields per condition n=5.
Extended Data Figure 4. MeCP2 condensates preferentially concentrate HP1α compared to components of transcriptional condensates.
a. Immunofluorescence images of heterochromatin condensates (MeCP2-GFP) and transcriptional condensates (Anti-MED1) in mESCs.
b. Droplet experiments examining ability of MeCP2 condensates to preferentially concentrate HP1α compared to components of transcriptional condensates. MeCP2-GFP at 7.5 μM was mixed with HP1α-mCherry, MED1-IDR-mCherry, BRD4-IDR-mCherry, or mCherry at 7.5 μM in droplet formation buffers with 150 mM NaCl and 10% PEG-8000.
c. mCherry partition ratios in MeCP2-GFP droplets for experiments in Extended Data Fig. 4b. Fields per condition n=15.
d. Droplet experiments with naked DNA examining ability of MeCP2 condensates to preferentially concentrate HP1α compared to components of transcriptional condensates. Conditions same as in Extended Data Fig. 4b, but with addition of 160 nM DNA.
e. mCherry partition ratios in MeCP2-GFP droplets for experiments in Extended Data Fig. 4d. Fields per condition n=15.
f. Droplet experiments with nucleosomal DNA examining ability of MeCP2 condensates to preferentially concentrate HP1α compared to components of transcriptional condensates. MeCP2-GFP at 5 μM was mixed with HP1α-mCherry, MED1-IDR-mCherry, BRD4-IDR-mCherry, or mCherry at 5 μM and 6 nM poly-nucleosomes in droplet formation buffers with 100 mM NaCl and 3 mM MgCl2.
g. mCherry partition ratios in MeCP2-GFP droplets for experiments in Extended Data Fig. 4f. Fields per condition n=10.
h. Brightfield images examining droplet formation with nucleosomal DNA alone and with MeCP2. Poly-nucleosomes at 6 nM were mixed with 5 μM MeCP2-GFP or no MeCP2-GFP in droplet formation buffers with 100 mM NaCl and 3 mM MgCl2.
i. Droplet experiments examining MeCP2 droplet formation with nucleosomal DNA. Conditions same as in Extended Data Fig. 4h.
j. Droplet areas for experiments in Extended Data Fig. 4i. Fields per condition n=10.
k. MeCP2-GFP condensed fraction for experiments in Extended Data Fig. 4i. Mean±SD. Fields per condition n=10.
Extended Data Figure 5. MeCP2 condensate partitioning of BRD4 domains.
a. Droplet experiments examining ability of MeCP2 condensates to preferentially incorporate and concentrate HP1α compared to BRD4 domains in the presence of naked DNA. BRD4-IDR, bromodomain 1 (BD1), and extra-terminal (ET) domain were examined. MeCP2-GFP at 7.5 μM was mixed with either HP1α-mCherry, BRD4-IDR-mCherry, BRD4-BD1-mCherry, BRD4-ET-mCherry, or mCherry each at 7.5 μM and 160 nM methylated DNA in droplet formation buffers with 150 mM NaCl and 10% PEG-8000.
b. mCherry partition ratios in MeCP2-GFP droplets for experiments in Extended Data Fig. 5a. Fields per condition n=15.
Extended Data Figure 6. RTT patient mutations disrupt MeCP2 condensate formation.
a. Droplet areas for experiments in Fig. 3b. Fields per condition n=15.
b. Droplet areas for experiments in Fig. 3d. Fields per condition n=15.
c. Droplet areas for experiments in Fig. 3f. Fields per condition n=15.
d. Droplet experiments examining effects of RTT patient missense mutations that disrupt IDR-2 on MeCP2 droplet formation. MeCP2-GFP WT and RTT IDR-2 mutants (P225R and P322L) at indicated concentrations were mixed with 20 nM methylated DNA in droplet formation buffers with 100 mM NaCl.
e. MeCP2-GFP condensed fraction as a function of MeCP2-GFP concentration for experiments in Extended Data Fig. 6d. Mean±SD. Fields per condition n=15.
f. Droplet areas for experiments in Extended Data Fig. 6d. Fields per condition n=15.
Extended Data Figure 7. TBLR1 partitioning into MeCP2 droplets is disrupted by RTT mutation R306C.
a. Droplet experiments examining ability of MeCP2 WT and R306C mutant condensates to enrich TBLR1-CTD. MeCP2-GFP WT or R306C mutant at 6 μM was mixed with TBLR1-CTD-mCherry at 10 μM in droplet formation buffers with 125 mM NaCl and 10% PEG-8000.
b. TBLR1-CTD-mCherry partition ratios in MeCP2-GFP WT and R306C mutant droplets for experiments in Extended Data Fig. 7a. Fields per condition n=15.
c. Droplet experiments examining ability of MeCP2 WT and R306C mutant condensates to enrich TBLR1-CTD. MeCP2-GFP WT or R306C mutant at 10 μM was mixed with TBLR1-CTD-mCherry at 4 μM in droplet formation buffers with 125 mM NaCl.
d. TBLR1-CTD-mCherry partition ratios in MeCP2-GFP WT and R306C mutant droplets for experiments in Extended Data Fig. 7c. Fields per condition n=12.
Extended Data Figure 8. MeCP2 Mini forms droplets in vitro and partitions into heterochromatin condensates in mESCs.
a. Schematic of MeCP2 protein with a minimal MeCP2 protein (Mini) (Tillotson et al., Nature 2017) that retains the MBD and NID displayed below.
b. Droplet experiments examining ability of Mini MeCP2 to form droplets. MeCP2-GFP WT and Mini at 4 μM were added to droplet formation buffers with 125 mM NaCl and 10% PEG-8000.
c. Droplet areas for experiments in Extended Data Fig. 8b. Fields per condition n=12.
d. MeCP2-GFP condensed fraction for experiments in Extended Data Fig. 8b. Mean±SD. Fields per condition n=12.
e. Droplet experiments examining ability of MeCP2 WT and Mini to form droplets with HP1α and DNA. MeCP2-GFP WT or Mini at 7.5 μM was mixed with 7.5 μM HP1α-mCherry and 160 nM DNA in droplet formation buffers with 150 mM NaCl and 10% PEG-8000.
f. HP1α-mCherry partition ratios in MeCP2-GFP WT and Mini droplets for experiments in Extended Data Fig. 8e. Fields per condition n=15.
g. DNA-Cy5 partition ratios in MeCP2-GFP WT and Mini droplets for experiments in Extended Data Fig. 8e. Fields per condition n=15.
h. Droplet experiments examining ability of MeCP2 WT and Mini condensates to enrich TBLR1-CTD. MeCP2-GFP WT or Mini at 4 μM was mixed with TBLR1-CTD-mCherry at 10 μM in droplet formation buffers with 125 mM NaCl and 10% PEG-8000.
i. TBLR1-CTD-mCherry partition ratios in MeCP2-GFP WT and Mini droplets for experiments in Extended Data Fig. 8h. Fields per condition n=12.
j. Live-cell microscopy of endogenous-tagged MeCP2-GFP WT and Mini proteins with Hoechst staining in mESCs.
k. Partition ratios of MeCP2-GFP proteins at heterochromatin condensates for experiments in Extended Data Fig. 8j. Mean±SD, n=10 cells per condition. Two-tailed Student’s t-test: p=0.1161, t=1.6509, df=18.
Extended Data Figure 9. R168X mutant MeCP2 displays reduced partitioning into heterochromatin condensates and causes disease-relevant cellular phenotypes in mESCs.
a. Live-cell images of endogenous-tagged MeCP2-GFP WT and R168X mutant proteins with Hoechst staining in mESCs.
b. Partition ratios of MeCP2-GFP proteins at heterochromatin condensates for experiments in Extended Data Fig. 9a. Mean±SD, cells per condition: WT (n=11), R168X (n=10). Two-tailed Student’s t-test: p<0.0001, t=12.13, df=19.
c. MeCP2-GFP signal in endogenous-tagged MeCP2-GFP WT and R168X mutant mESCs measured by flow cytometry. Mean±SD, n=3 biologically independent samples per condition.
d. Western blot of endogenous-tagged MeCP2-GFP WT and R168X mutant mESCs. Anti-H3 was used as a processing control. For gel source data, see Supplementary Figure 1.
e. Number of heterochromatin condensates per cell in endogenous-tagged MeCP2-GFP WT and R168X mutant mESCs. Mean±SD, n=16 cells per condition. Two-tailed Student’s t-test: p=0.0149, t=2.5832, df=30.
f. Heterochromatin condensate volumes in endogenous-tagged MeCP2-GFP WT and R168X mutant mESCs. Mean±SD, condensates per condition: WT (n=206), R168X (n=273). Two-tailed Student’s t-test: p<0.0001, t=4.2065, df=477.
g. Live-cell images of endogenous-tagged MeCP2-GFP (WT or R168X mutant) and HP1α-mCherry in mESCs.
h. Partition ratios of HP1α-mCherry at heterochromatin condensates for experiments in Extended Data Fig. 9g. Mean±SD, cells per condition: WT (n=6), R168X (n=20). Two-tailed Student’s t-test: p<0.0001, t=5.7136, df=24.
i. HP1α-mCherry signal in endogenous-tagged MeCP2-GFP (WT or R168X mutant) and HP1α-mCherry mESCs measured by flow cytometry. Mean±SD, n=3 biologically independent samples per condition.
j. Normalized major satellite repeat expression in endogenous-tagged MeCP2-GFP WT and R168X mutant mESCs. Mean±SD, n=3 biologically independent samples per condition. Two-tailed Student’s t-test: p=0.0017, t=7.5436, df=4.
k. Total RNA per cell in endogenous-tagged MeCP2-GFP WT and R168X mutant mESCs. Mean±SD, n=3 biologically independent samples per condition. Two-tailed Student’s t-test: p=0.0324, t=3.2154, df=4.
l. RNA-seq comparing endogenous-tagged MeCP2-GFP WT and R168X mutant mESCs. Differentially expressed genes (red dots) were determined by two-tailed Wald test with multiple test adjusted p-value<0.1. For both conditions, n=3 biologically independent samples.
Extended Data Figure 10. R168X mutant in mESCs and neurons.
a. Live-cell images of mESCs overexpressing either WT or R168X mutant MeCP2-GFP.
b. Partition ratios of MeCP2-GFP proteins at heterochromatin condensates relative to the nucleoplasm for experiments in Extended Data Fig. 10a. Mean±SD, cells per condition: WT (n=3), R168X (n=5). Two-tailed Student’s t-test: p=0.0008, t=6.1529, df=6.
c. Western blot of mESCs overexpressing either WT or R168X mutant MeCP2-GFP. Anti-H3 was used as a processing control. For gel source data, see Supplementary Figure 1.
d. Schematic of generation of mESC-derived neurons. Endogenous-tagged MeCP2-GFP WT and R168X mESCs were modified for Dox-inducible NGN2 expression using the PiggyBac system. Prior to neuronal differentiation, mESCs were seeded on astrocytes. Neuronal differentiation was induced by adding doxycycline to drive NGN2 expression. Five days after induction of NGN2 expression, neurons were analyzed.
e. Fixed-cell immunofluorescence images of neurons derived from MeCP2-GFP WT and R168X mutant mESCs. Anti-TuJ1 staining was used to distinguish neurons.
f. Western blot of endogenous-tagged MeCP2-GFP WT and R168X mutant neurons. Anti-H3 was used as a loading control. For gel source data, see Supplementary Figure 1.
g. Normalized major satellite repeat expression in endogenous-tagged MeCP2-GFP WT and R168X mutant neurons. Mean±SD, n=3 biologically independent samples per condition. Two-tailed Student’s t-test: p=0.0061, t=5.3004, df=4.
h. Total RNA per cell in endogenous-tagged MeCP2-GFP WT and R168X neurons. Mean±SD, n=3 biologically independent samples per condition. Two-tailed Student’s t-test: p=0.0141, t=4.1676, df=4.
i. RNA-seq comparing endogenous-tagged MeCP2-GFP WT and R168X mutant neurons. Differentially expressed genes (red dots) were identified using a two-tailed Wald test with multiple test adjusted p-value<0.1. For both conditions, n=3 biologically independent samples.
Supplementary Material
Acknowledgements
We thank Adrian P. Bird for sharing Mecp2 mutant cell lines; Danny Reinberg for sharing purified poly-nucleosomes; Phillip A. Sharp for discussions; Doug Richardson and the Harvard Center for Biological Imaging; Wendy Salmon and the Whitehead W.M. Keck Microscopy Facility; and Ruth Flannery, Jesse Drotar, and Nick Rosenau and the Whitehead Genetically Engineered Models Center for technical support. The work was supported by NIH grant R01 GM123511 (R.A.Y.), NSF grant PHY1743900 (R.A.Y.), NIH grant 2 R01 MH104610-20 (R.J., R. A.Y.), NIH grant R37 CA084198 (R.J.), Hope Funds for Cancer Research Fellowship (A.D.), NIH grant T32 5T32DK007191-45 (J.M.P.), NSF Graduate Research Fellowship (A.V.Z.), and NIH grant K99/R00 MH113813 (X.S.L.).
Footnotes
Competing interests
R.A.Y. is a founder and shareholder of Syros Pharmaceuticals, Camp4 Therapeutics, Omega Therapeutics, and Dewpoint Therapeutics. R.J. is an advisor/co-founder of Fate Therapeutics, Fulcrum Therapeutics, Omega Therapeutics, and Dewpoint Therapeutics. T.I.L. is a shareholder of Syros Pharmaceuticals and a consultant to Camp4 Therapeutics. All other authors declare no competing interests.
Additional information
Supplementary information is available for this paper. Correspondence and requests for materials should be addressed to R.A.Y. (young@wi.mit.edu) and R.J. (jaenisch@wi.mit.edu). Reprints and permissions information is available at www.nature.com/reprints.
Code availability
Custom code used for analysis of images from in vitro droplet assays is available at www.github.com/jehenninger/in_vitro_droplet_assay. Custom code used for analysis of heterochromatin condensate volumes is available at www.github.com/jehenninger/MECP2_neuron.
Data availability
Relevant data supporting the findings of this study are available within the paper and Supplementary Information files. RNA-seq datasets generated in this study have been deposited in the Gene Expression Omnibus under accession code GSE139033. Uncropped gel images can be found in Supplementary Figure 1. Additional data are available from the corresponding author upon reasonable request. The following publicly available data were used in this study: GTEx v. 7 RNA-seq Median Gene TPMs by Tissue (www.gtexportal.org), RettBASE MECP2 Variant List (mecp2.chw.edu.au/mecp2/mecp2_home.php), and UniProt Cluster ID: UniRef50_Q9Z2D6 (www.uniprot.org/uniref/UniRef50_Q9Z2D6).
References
- 1.Janssen A, Colmenares SU & Karpen GH Heterochromatin: guardian of the genome. Annu. Rev. Cell Dev. Biol 34, 265–288 (2018). [DOI] [PubMed] [Google Scholar]
- 2.Allshire RC & Madhani HD Ten principles of heterochromatin formation and function. Nat. Rev. Mol. Cell Biol 19, 229–244 (2018). [DOI] [PMC free article] [PubMed] [Google Scholar]
- 3.Lyst MJ & Bird A Rett syndrome: a complex disorder with simple roots. Nat. Rev. Genet 16, 261–274 (2015). [DOI] [PubMed] [Google Scholar]
- 4.Ip JPK, Mellios N & Sur M Rett syndrome: insights into genetic, molecular and circuit mechanisms. Nat. Rev. Neurosci 19, 368–382 (2018). [DOI] [PMC free article] [PubMed] [Google Scholar]
- 5.Amir RE et al. Rett syndrome is caused by mutations in X-linked MECP2, encoding methyl-CpG-binding protein 2. Nat. Genet 23, 185–188 (1999). [DOI] [PubMed] [Google Scholar]
- 6.Larson AG et al. Liquid droplet formation by HP1α suggests a role for phase separation in heterochromatin. Nature 547, 236–240 (2017). [DOI] [PMC free article] [PubMed] [Google Scholar]
- 7.Strom AR et al. Phase separation drives heterochromatin domain formation. Nature 547, 241–245 (2017). [DOI] [PMC free article] [PubMed] [Google Scholar]
- 8.Skene PJ et al. Neuronal MeCP2 is expressed at near histone-octamer levels and globally alters the chromatin state. Mol. Cell 37, 457–468 (2010). [DOI] [PMC free article] [PubMed] [Google Scholar]
- 9.Shrinivas K et al. Enhancer features that drive formation of transcriptional condensates. Mol. Cell 75, 549–561 (2019). [DOI] [PMC free article] [PubMed] [Google Scholar]
- 10.Shin Y & Brangwynne CP Liquid phase condensation in cell physiology and disease. Science 357, eaaf4382 (2017). [DOI] [PubMed] [Google Scholar]
- 11.Kumar A et al. Analysis of protein domains and Rett syndrome mutations indicate that multiple regions influence chromatin-binding dynamics of the chromatin-associated protein MECP2 in vivo. J. Cell Sci 121, 1128–1137 (2008). [DOI] [PMC free article] [PubMed] [Google Scholar]
- 12.Georgel PT et al. Chromatin compaction by human MeCP2. Assembly of novel secondary chromatin structures in the absence of DNA methylation. J. Biol. Chem 278, 32181–32188 (2003). [DOI] [PubMed] [Google Scholar]
- 13.Lyst MJ et al. Rett syndrome mutations abolish the interaction of MeCP2 with the NCoR/SMRT co-repressor. Nat. Neurosci 16, 898–902 (2013). [DOI] [PMC free article] [PubMed] [Google Scholar]
- 14.Nan X, Campoy FJ & Bird A MeCP2 is a transcriptional repressor with abundant binding sites in genomic chromatin. Cell 88, 471–481 (1997). [DOI] [PubMed] [Google Scholar]
- 15.Baker SA et al. An AT-hook domain in MeCP2 determines the clinical course of Rett syndrome and related disorders. Cell 152, 984–996 (2013). [DOI] [PMC free article] [PubMed] [Google Scholar]
- 16.Sabari BR et al. Coactivator condensation at super-enhancers links phase separation and gene control. Science 361, eaar3958 (2018). [DOI] [PMC free article] [PubMed] [Google Scholar]
- 17.Boija A et al. Transcription factors activate genes through the phase-separation capacity of their activation domains. Cell 175, 1842–1855 (2018). [DOI] [PMC free article] [PubMed] [Google Scholar]
- 18.van Steensel B & Belmont AS Lamina-associated domains: links with chromosome architecture, heterochromatin, and gene repression. Cell 169, 780–791 (2017). [DOI] [PMC free article] [PubMed] [Google Scholar]
- 19.Gibson BA et al. Organization of chromatin by intrinsic and regulated phase separation. Cell 179, 470–484 (2019). [DOI] [PMC free article] [PubMed] [Google Scholar]
- 20.Chahrour M et al. MeCP2, a key contributor to neurological disease, activates and represses transcription. Science 320, 1224–1229 (2008). [DOI] [PMC free article] [PubMed] [Google Scholar]
- 21.Kruusvee V et al. Structure of the MeCP2–TBLR1 complex reveals a molecular basis for Rett syndrome and related disorders. Proc. Natl. Acad. Sci 114, E3243–E3250 (2017). [DOI] [PMC free article] [PubMed] [Google Scholar]
- 22.Tillotson R et al. Radically truncated MeCP2 rescues Rett syndrome-like neurological defects. Nature 550, 398–401 (2017). [DOI] [PMC free article] [PubMed] [Google Scholar]
- 23.Linhoff MW, Garg SK & Mandel G A high-resolution imaging approach to investigate chromatin architecture in complex tissues. Cell 163, 246–255 (2015). [DOI] [PMC free article] [PubMed] [Google Scholar]
- 24.Li Y et al. Global transcriptional and translational repression in human-embryonic-stem cell-derived Rett syndrome neurons. Cell Stem Cell 13, 446–458 (2013). [DOI] [PMC free article] [PubMed] [Google Scholar]
- 25.Wang L et al. Rett syndrome-causing mutations compromise MeCP2-mediated liquid–liquid phase separation of chromatin. Cell Res. 30, 393–407 (2020). [DOI] [PMC free article] [PubMed] [Google Scholar]
- 26.Brown K et al. The molecular basis of variable phenotypic severity among common missense mutations causing Rett syndrome. Hum. Mol. Genet 25, 558–570 (2016). [DOI] [PMC free article] [PubMed] [Google Scholar]
- 27.Guy J, Gan J, Selfridge J, Cobb S & Bird A Reversal of neurological defects in a mouse model of Rett syndrome. Science 315, 1143–1147 (2007). [DOI] [PMC free article] [PubMed] [Google Scholar]
- 28.Giacometti E, Luikenhuis S, Beard C & Jaenisch R Partial rescue of MeCP2 deficiency by postnatal activation of MeCP2. Proc Natl Acad Sci USA 104, 1931–1936 (2007). [DOI] [PMC free article] [PubMed] [Google Scholar]
- 29.Wheeler RJ et al. Small molecules for modulating protein driven liquid-liquid phase separation in treating neurodegenerative disease. bioRxiv 10.1101/721001 (2019). [DOI] [Google Scholar]
- 30.Klein IA et al. Partitioning of cancer therapeutics in nuclear condensates. Science 368, 1386–1392 (2020). [DOI] [PMC free article] [PubMed] [Google Scholar]
- 31.Thoma EC et al. Ectopic expression of neurogenin 2 alone is sufficient to induce differentiation of embryonic stem cells into mature neurons. PLoS One 7, e38651 (2012). [DOI] [PMC free article] [PubMed] [Google Scholar]
- 32.Zhang Y et al. Rapid single-step induction of functional neurons from human pluripotent stem cells. Neuron 78, 785–798 (2013). [DOI] [PMC free article] [PubMed] [Google Scholar]
- 33.Alberti S, Gladfelter A & Mittag T Considerations and challenges in studying liquid-liquid phase separation and biomolecular condensates. Cell 176, 419–434 (2019). [DOI] [PMC free article] [PubMed] [Google Scholar]
- 34.Jang S et al. Long-term culture of organotypic hippocampal slice from old 3xTg-AD mouse: an ex vivo model of Alzheimer’s disease. Psychiatry Investig. 15, 205–213 (2018). [DOI] [PMC free article] [PubMed] [Google Scholar]
- 35.Alberti S et al. A user’s guide for phase separation assays with purified proteins. J. Mol. Biol 420, 4806–4820 (2018). [DOI] [PMC free article] [PubMed] [Google Scholar]
- 36.Wang J et al. A molecular grammar governing the driving forces for phase separation of prion-like RNA binding proteins. Cell 174, 688–699 (2018). [DOI] [PMC free article] [PubMed] [Google Scholar]
- 37.Loyola A, Bonaldi T, Roche D, Imhof A & Almouzni G PTMs on H3 variants before chromatin assembly potentiate their final epigenetic state. Mol. Cell 24, 309–316 (2006). [DOI] [PubMed] [Google Scholar]
- 38.Li P et al. Phase transitions in the assembly of multivalent signalling proteins. Nature 483, 336–340 (2012). [DOI] [PMC free article] [PubMed] [Google Scholar]
- 39.Martin EW et al. Valence and patterning of aromatic residues determine the phase behavior of prion-like domains. Science 367, 694–699 (2020). [DOI] [PMC free article] [PubMed] [Google Scholar]
- 40.Lu H et al. Phase-separation mechanism for C-terminal hyperphosphorylation of RNA polymerase II. Nature 558, 318–323 (2018). [DOI] [PMC free article] [PubMed] [Google Scholar]
- 41.Zamudio AV et al. Mediator condensates localize signaling factors to key cell kdentity genes. Mol. Cell 76, 753–766 (2019). [DOI] [PMC free article] [PubMed] [Google Scholar]
- 42.Pak CW et al. Sequence determinants of intracellular phase separation by complex coacervation of a disordered protein. Mol. Cell 63, 72–85 (2016). [DOI] [PMC free article] [PubMed] [Google Scholar]
- 43.Dao TP et al. ALS-linked mutations affect UBQLN2 oligomerization and phase separation in a position- and amino acid-dependent manner. Structure 27, 937–951 (2019). [DOI] [PMC free article] [PubMed] [Google Scholar]
- 44.Holehouse AS, Das RK, Ahad JN, Richardson MOG & Pappu RV CIDER: resources to analyze sequence-ensemble relationships of intrinsically disordered proteins. Biophys. J 112, 16–21 (2017). [DOI] [PMC free article] [PubMed] [Google Scholar]
- 45.Lovén J et al. Revisiting global gene expression analysis. Cell 151, 476–482 (2012). [DOI] [PMC free article] [PubMed] [Google Scholar]
- 46.Dobin A et al. STAR: ultrafast universal RNA-seq aligner. Bioinformatics 29, 15–21 (2013). [DOI] [PMC free article] [PubMed] [Google Scholar]
- 47.Li B & Dewey CN RSEM: accurate transcript quantification from RNA-Seq data with or without a reference genome. BMC Bioinformatics 12, 323 (2011). [DOI] [PMC free article] [PubMed] [Google Scholar]
- 48.Anders S & Huber W Differential expression analysis for sequence count data. Genome Biol. 11, R106 (2010). [DOI] [PMC free article] [PubMed] [Google Scholar]
- 49.Christodoulou J, Grimm A, Maher T & Bennetts B RettBASE: the IRSA MECP2 variation database - a new mutation database in evolution. Hum. Mutat 21, 466–472 (2003). [DOI] [PubMed] [Google Scholar]
- 50.Capra JA & Singh M Predicting functionally important residues from sequence conservation. Bioinformatics 23, 1875–1882 (2007). [DOI] [PubMed] [Google Scholar]
Associated Data
This section collects any data citations, data availability statements, or supplementary materials included in this article.
Supplementary Materials
Data Availability Statement
Relevant data supporting the findings of this study are available within the paper and Supplementary Information files. RNA-seq datasets generated in this study have been deposited in the Gene Expression Omnibus under accession code GSE139033. Uncropped gel images can be found in Supplementary Figure 1. Additional data are available from the corresponding author upon reasonable request. The following publicly available data were used in this study: GTEx v. 7 RNA-seq Median Gene TPMs by Tissue (www.gtexportal.org), RettBASE MECP2 Variant List (mecp2.chw.edu.au/mecp2/mecp2_home.php), and UniProt Cluster ID: UniRef50_Q9Z2D6 (www.uniprot.org/uniref/UniRef50_Q9Z2D6).


