

Abstract
Recent advances in single-cell RNA sequencing (scRNA-seq) enable characterization of transcriptomic profiles with single-cell resolution and circumvent averaging artifacts associated with traditional bulk RNA sequencing (RNA-seq) data. Here, we propose SCDC, a deconvolution method for bulk RNA-seq that leverages cell-type specific gene expression profiles from multiple scRNA-seq reference datasets. SCDC adopts an ENSEMBLE method to integrate deconvolution results from different scRNA-seq datasets that are produced in different laboratories and at different times, implicitly addressing the problem of batch-effect confounding. SCDC is benchmarked against existing methods using both in silico generated pseudo-bulk samples and experimentally mixed cell lines, whose known cell-type compositions serve as ground truths. We show that SCDC outperforms existing methods with improved accuracy of cell-type decomposition under both settings. To illustrate how the ENSEMBLE framework performs in complex tissues under different scenarios, we further apply our method to a human pancreatic islet dataset and a mouse mammary gland dataset. SCDC returns results that are more consistent with experimental designs and that reproduce more significant associations between cell-type proportions and measured phenotypes.
Keywords: single-cell RNA sequencing, bulk RNA sequencing, gene expression deconvolution, ENSEMBLE, batch effect
Introduction
Bulk RNA sequencing (RNA-seq) has been the method of choice for profiling transcriptomic variations under different conditions such as disease states [1–3]. However, in complex tissues with multiple heterogeneous cell types, bulk RNA-seq measures the average gene expression levels by summing over the population of cells in the tissue and variability in cell-type compositions confounds with analysis such as detecting differential gene expression [4]. While multiple statistical and computational methods have been developed for cell-type decomposition of bulk RNA-seq data [5–7], most of these have limitations. Many require a priori knowledge, either of gene expression profiles of purified cell types [6, 7] or of cell-type compositions [5]. Methods that do not take these information as input instead require a list of pre-selected marker genes [8, 9]. Finally, completely unsupervised approaches based on non-negative matrix factorization suffer from low deconvolution accuracy and have identifiability and multicollinearity issues [10].
Recent advances in single-cell RNA sequencing (scRNA-seq) circumvent averaging artifacts associated with the traditional bulk RNA-seq data by enabling characterization of transcriptomic profiles at the single-cell level [11]. While scRNA-seq data has greatly increased resolution in the characterization of transcriptomic heterogeneity, its relatively high cost and technical challenges pose difficulties in generating scRNA-seq data across a large population of samples [12, 13]. Association testing performed on single-cell data from a small number of subjects has only limited statistical power. Large collaborations, on the other hand, have successfully sequenced an enormous number of bulk samples [14, 15], making cell-type decomposition on bulk RNA-seq data aided by scRNA-seq an appealing analysis scheme.
Several methods exploiting single-cell expression reference datasets have been developed for bulk gene expression deconvolution [16–20]. Specifically, both Bseq-SC [16] and DWLS [20] first use scRNA-seq data to build a cell-type specific gene expression signature matrix with or without requiring a set of pre-selected marker genes, respectively. They then apply a support vector regression-based deconvolution framework adapted from CIBERSORT [7] or a weighted least square approach to estimate cell compositions. MuSiC [17] proposes a weighted non-negative least squares (W-NNLS) regression framework utilizing all genes shared between the bulk and the single-cell data, while weighting each gene by cross-subject and cross-cell variations. Empirical evidence suggests that this leads to higher deconvolution accuracy. Recently developed methods, Bisque [19] and CIBERSORTx [18], perform additional gene expression transformations to explicitly account for the technical variation in either the single-cell signature matrix or the observed bulk expression. Supplementary Table S1 gives a summary of the existing deconvolution methods utilizing scRNA-seq data.
Despite this progress, to the best of our knowledge, all existing methods reconstruct the gene expression signature matrix using only one single-cell reference. These methods therefore cannot use additional scRNA-seq data of the same tissue from the same model organism that may be available from other studies and laboratories (Supplementary Table S2 and Supplementary Figure S1). These methods also cannot take advantage of the extensive transcriptomic reference maps at the cellular level that have been generated by multiple large consortia, including the Human Cell Atlas [21] and the Mouse Cell Atlas [22]. Borrowing information from existing data could potentially boost the performance of and increase the robustness of deconvolution. This has been demonstrated by [23], who showed that leveraging heterogeneity across multiple reference datasets could increase deconvolution accuracy and reduce biological and technical biases for microarray data. For scRNA-seq data, however, significant batch effect prevails across data collected from different sources and as we demonstrate later, the naive pooling of multiple scRNA-seq datasets to build a ‘mega’ reference profile performs poorly. One potential solution is to correct for the batch effect in the data. However, existing batch correction methods for scRNA-seq data either adopt a dimension reduction technique for visualization and clustering [24, 51] or change the scale of the original gene expression measurements [25, 52, 53], both of which make subsequent deconvolution difficult—perhaps even infeasible.
Here, we introduce a new framework, SCDC, to leverage multiple scRNA-seq reference sets for bulk gene expression deconvolution. Specifically, when multiple scRNA-seq reference sets are available, SCDC adopts an ENSEMBLE method to integrate deconvolution results across datasets; it implicitly addresses the problem of batch-effect confounding by giving higher weights to the scRNA-seq data that are more closely related to the bulk RNA-seq data. We benchmark our method against existing methods using pseudo-bulk samples generated in silico, whose true underlying cell type identities are known. We also evaluate the performance of SCDC on an RNA-seq dataset of paired single cells and bulk samples, the latter of which have experimentally controlled cell-type proportions as ground truths. SCDC is shown to outperform existing methods by integrating multiple scRNA-seq datasets; even with only one single-cell dataset, SCDC yields enhanced deconvolution accuracy. To further demonstrate the ENSEMBLE method, SCDC is applied to two real datasets, human pancreatic islets and mouse mammary glands, using multiple scRNA-seq inputs. We show that, compared to existing methods, SCDC returns results that are more consistent with experimental designs and that reproduce more significant associations between cell-type proportions and measured phenotypes. SCDC is available as an open-source R package at http://meichendong.github.io/SCDC.
Results
Overview of SCDC’s deconvolution via ENSEMBLE
Figure 1 gives an overview of SCDC. The same set of bulk RNA-seq samples can be deconvoluted using different single-cell reference datasets. Empirically, we show that this may return distinct cell-type proportion estimations, due to both intrinsic biological variation and technical noise (Supplementary Table S2 and Supplementary Figure S1) [26]. It is further shown that naively pooling all available single cells from different sources suffers from the prevalent batch effects and the biological heterogeneity that are present in the data (Supplementary Table S3). To resolve this discrepancy while making full use of all available scRNA-seq reference datasets, SCDC adopts an ENSEMBLE method to combine the deconvolution results from individual datasets. The weights for each dataset are selected via optimization, with higher weights assigned to single-cell reference datasets that better recapitulate the true underlying gene expression profiles of the bulk samples.
Fig. 1.
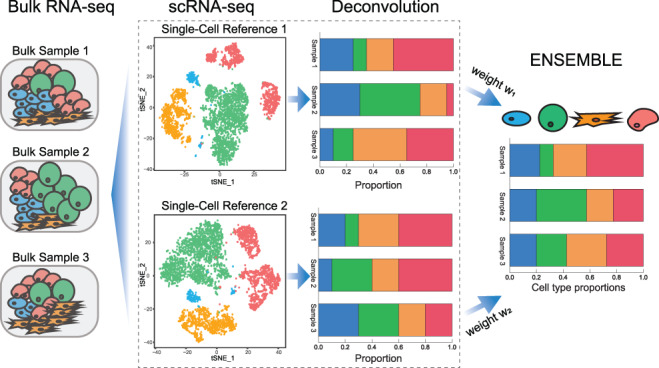
Overview of deconvolution via ENSEMBLE by SCDC. When multiple single-cell reference datasets are available, batch effect confounding is avoided by performing deconvolution on each scRNA-seq reference set separately. SCDC then integrates the deconvolution results with dataset-specific optimized weights, which are used to derive the final cell-type proportions.
In the following, we begin by giving a review of the existing regression-based deconvolution framework [16–20]. We then describe the model for SCDC, leaving algorithmic details to the Methods section and Supplemental Information. Consider an observed bulk gene expression matrix  for
for  genes across
  samples, each containing
  different cell types. The goal of deconvolution is to find two non-negative matrices
  and
and  such that
 |
where each column of  represents the mixing proportions of the
  cell types of one sample and each column of the ‘basis’ matrix
  represents the average gene expression levels in each type of cells. As described earlier, different methods have been developed to integrate both bulk-tissue and single-cell gene expression measurements for deconvolution [16–20]. These methods obtain
 |
where each matrix is estimated as the final output.
In the presence of multiple scRNA-seq datasets, one can adopt the aforementioned deconvolution strategies to each single-cell dataset  separately to obtain the predicted gene expression level
  , the estimated basis matrix
  and the estimated cell-type proportion matrix
  . Empirical evidence suggests that, depending on the scRNA-seq data adopted, the estimates of
  can differ drastically and that naively pooling all the single-cell data with or without batch-effect correction leads to overall bad and unstable performance (Supplementary Table S2 and Supplementary Table S3). To make full use of all available single-cell data and to give higher weights to the reference that more closely recapitulates the true underlying cell compositions, we propose SCDC, an ENSEMBLE method to integrate all deconvolution results as
  with different weights
  (
( ), which are optimized via:
 |
(1) |
However, the above objective function cannot be minimized given that the actual cell-type proportions  are unknown. To overcome this problem, SCDC adopts a ‘surrogate’ metric on the observed
  to substitute on the unknown
  . That is, we instead optimize the weights via
 |
(2) |
Intuitively, if a single-cell reference data truly recapitulates the cellular expression profiles of the bulk samples, it should provide high-quality estimates of both  and
and  . Empirically, we show that the estimation errors on
  are positively correlated with those on
  (Supplementary Figure S1), confirming that a reference set that leads to higher deconvolution accuracy also has lower residuals of
  from the regression. We also show that the
  norm of the difference in the above equations can be replaced by other dissimilarity measurements such as correlation or
  norm of the difference (Supplementary Figure S1). For optimization of weights
  , SCDC, by default, adopts a numerical method based on grid search to maximize the Spearman correlation between
  and
and  . Given
  , one can subsequently adopt a regression-based framework, in a similar fashion to csSAM [5], to derive a more accurate estimate of the basis matrix
  .
.
Performance on simulated data
To assess the performance of SCDC, we carried out extensive simulation studies, which also illustrate the ENSEMBLE method by SCDC in more details. In these simulations, pseudo-bulk samples were generated in silico by aggregating well-characterized single cells from existing scRNA-seq studies. The known cell-type proportions of these samples were used as ground truths; the deconvolution accuracy was assessed by Pearson correlation and mean absolute deviation (mAD) between the actual and the deconvoluted cell-type proportions. Figure 2A gives an outline of the simulation setup. We started with a scenario where bulk RNA-seq data was paired with scRNA-seq data generated from the same study on the same subjects (Figure 2B). We then moved onto a more difficult case where the bulk RNA-seq data was generated from a different source than the scRNA-seq data (Figure 2C).
Fig. 2.
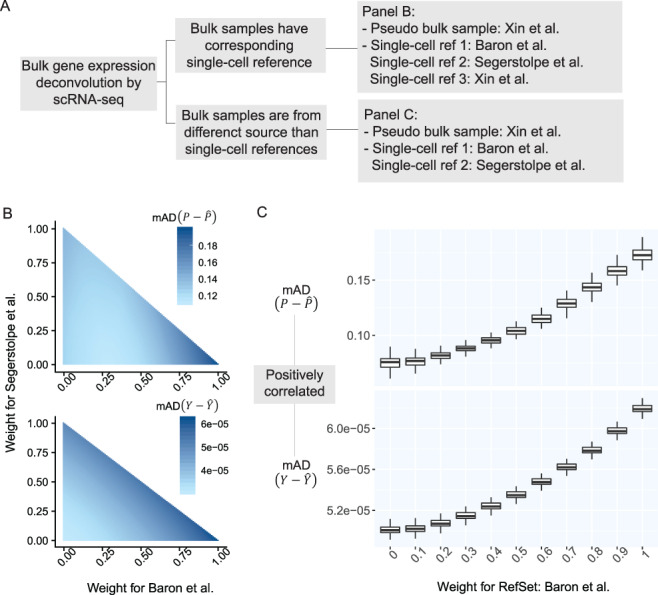
Prediction errors of Y serve as a surrogate for the estimation errors of P. (A) Outline of simulation setup, where single cells of human pancreatic islets are aggregated to generate pseudo-bulk samples, whose cell-type proportions are known. We examine the results of deconvolution via ENSEMBLE, both with and without paired single-cell reference dataset. (B) mAD  and mAD
  with three varying dataset-specific weights for deconvolution of bulk samples with paired scRNA-seq. The two metrics agreed on the assignment of the optimal weights, which were around
  . (C) mAD
 and mAD
 with two varying dataset-specific weights for deconvolution of bulk samples without paired scRNA-seq. The two metrics are highly correlated with varying weights for reference dataset from [16].
In Figure 2B, pseudo-bulk samples were constructed by aggregating well characterized single cells of four cell types human pancreatic alpha, beta, delta and gamma cells from [27]. A total of 100 simulations were run. Within each run, 100 pseudo-bulk samples were generated by sampling single cells without replacement from a randomly selected subject. For deconvolution, we further adopted three scRNA-seq datasets of human pancreatic islets: [16, 27, 28], the last of which is from the same source as the pseudo-bulk samples. In Figure 2B, we demonstrate how different weights for the three scRNA-seq reference sets (only two weights are shown since the three sum up to one) lead to different deconvolution results accuracies, as measured by the mAD of  (top panel) and the mAD of
  (bottom panel), respectively. We show that the two metrics, given varying weights for the three single-cell reference datasets, are highly correlated, indicating that the measurement error of
  serves as a good proxy to that of
  . This signifies the feasibility of the ENSEMBLE framework by SCDC when the true underlying
  remains unknown. Indeed, our findings further reveal that SCDC was able to derive a set of optimal weights with the highest one being close to one, which corresponds to the single-cell data from the same source as the bulk samples. The same pattern is observed when we switch the source of the pseudo-bulk samples (Supplementary Figure S2).
Figure 2C shows results from another set of simulations. These simulations are similar to the previously described set, but there was no scRNA-seq reference set from the same source as the pseudo-bulk samples. For pseudo-bulk samples generated from [16] and [27], the scRNA-seq dataset from [28] is weighted most heavily by SCDC (Figure 2C, Supplementary Table S2C), potentially due to the high sequencing depth and full-transcript coverage by the Smart-seq2 protocol [29] that was adopted.
Performance on mixtures of three cell lines
While we have successfully demonstrated that SCDC allows accurate deconvolution of pseudo-bulk samples, the in silico reconstruction procedure is over simplified and does not mimic how real bulk RNA-seq samples are collected and sequenced. Therefore, we carried out a set of well controlled experiments, where cell lines were mixed at a fixed ratio, followed by both bulk and single-cell RNA-seq. These known cell-type proportions served as ground truths to benchmark SCDC against existing methods without bias. Specifically, human breast cancer cell lines MDA-MB-468, MCF-7 and human fibroblast cells were independently cultured and then mixed at a fixed ratio of  . This was followed by traditional bulk RNA-seq as well as scRNA-seq by 10X Genomics. More experimental details are available in the Methods section. Single-cell clustering was performed using the Seurat pipeline [24] with t-SNE visualization shown in Figure 3A (see details in Supplemental Information). The cell-type ratio by scRNA-seq is
  , close to but slightly different from the experimental setup due to either the inaccuracy of counting cells when making the mixture or the sampling bias of scRNA-seq.
Fig. 3.
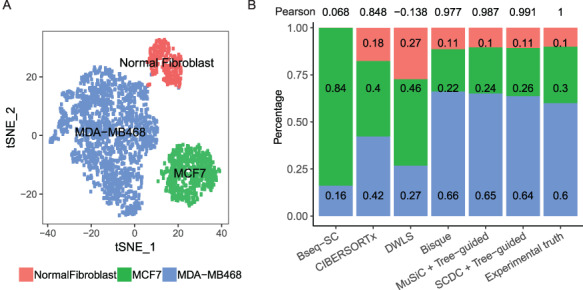
Performance assessment on bulk and single-cell RNA-seq of cell line mixtures with experimentally controlled proportions. (A) Visualization by t-SNE after single-cell clustering. The cells are clustered into three groups, MDA-MB-468, MCF-7 and normal fibroblast cells, in a ratio close to 6:3:1. (B) Benchmark of deconvolution results for the bulk RNA-seq sample, produced by different methods. Among all benchmarked methods, the proportions estimated by SCDC using the tree-guided approach has the highest Pearson correlation (0.99) with the ground truth.
To deconvolute the bulk RNA-seq sample, we adopted the scRNA-seq dataset that was generated from the same mixture, which was the only available reference set. As such, this reduced to a one-subject and one-reference deconvolution problem (see Supplemental Information for details), and the ENSEMBLE step was therefore not needed. In this case, we carried out direct comparisons of SCDC without ENSEMBLE against existing methods. Given one single-cell reference dataset, SCDC largely follows the W-NNLS framework proposed by MuSiC but also differs in several ways. First, SCDC starts by scaling the raw single-cell read-count matrix by a gene- and subject-specific maximal variance weight (MVW) so that residuals from genes with larger weights have smaller impact on cell-type composition estimation. Second, SCDC does not take cell-type memberships as granted; instead, it removes potentially misclassified cells and doublets using a first-pass SCDC run to improve robustness. Third, it allows single-subject scRNA-seq input, in which cross-subject variance cannot be directly estimated. (Refer to Methods for more details.) However, since MDA-MB-468 and MCF-7 are both human breast cancer cell lines with relatively similar transcriptomic profiles, deconvolution of the bulk mixture by SCDC in a single run fails to estimate the correct relative proportions. To solve this issue, we applied the tree-guided deconvolution procedure proposed by MuSiC [17] to separate the closely related cell types. Refer to Supplemental Information for details.
The estimated cell-type proportions by SCDC with the tree-guided approach are  , close to the ratio of
  with a Pearson correlation of
  Figure 3B. We also benchmarked SCDC against Bseq-SC [16], CIBERSORTx [18], Bisque [19], DWLS [20] and MuSiC [17] and showed that, even without ENSEMBLE, SCDC achieved the highest correlation coefficient. This is consistent with the simulations results shown in Supplementary Table S2: overall, SCDC achieved the most accurate deconvolution results when only one single-cell reference set was available.
Performance on human pancreatic islet data
To demonstrate the proposed ENSEMBLE framework when multiple reference datasets are available, we used SCDC to deconvolute 77 bulk RNA-seq samples of human pancreatic islets, of which 51 are from healthy individuals and 26 are from diabetic individuals [30]. Two scRNA-seq reference datasets were adopted, each harvesting six cell types of interest: alpha, beta, delta, gamma, acinar and ductal cells [16, 28]. To allow the basis matrix  to reflect the potentially different gene expression patterns between the cases and controls, we performed the ENSEMBLE weight selection procedures separately for the samples from the two classes. The final ENSEMBLE weights for the two reference datasets were derived using least absolute deviation (LAD) regression and grid search method. Supplementary Table S4 shows the final weights for the single-cell reference from [16], which vary from 0.17 to 0.40 for the healthy samples and 0.33 to 0.48 for the diabetic samples. Figure 4A shows the cell-type proportions estimated with ENSEMBLE (using weights selected by grid search method to maximize Spearman correlation) compared to the cell-type proportions estimated using single reference sets without ENSEMBLE. SCDC recovered the proportions of beta cells that were grossly underestimated previously [16] at much higher levels, in concordance with the previous reports that adult human islet consists of around 50% beta cells [31–33]. In addition, our results suggested that the beta cell proportions were slightly higher in the healthy donors than in the diabetic donors, although the difference was insignificant (
 = 0.1007).
Fig. 4.
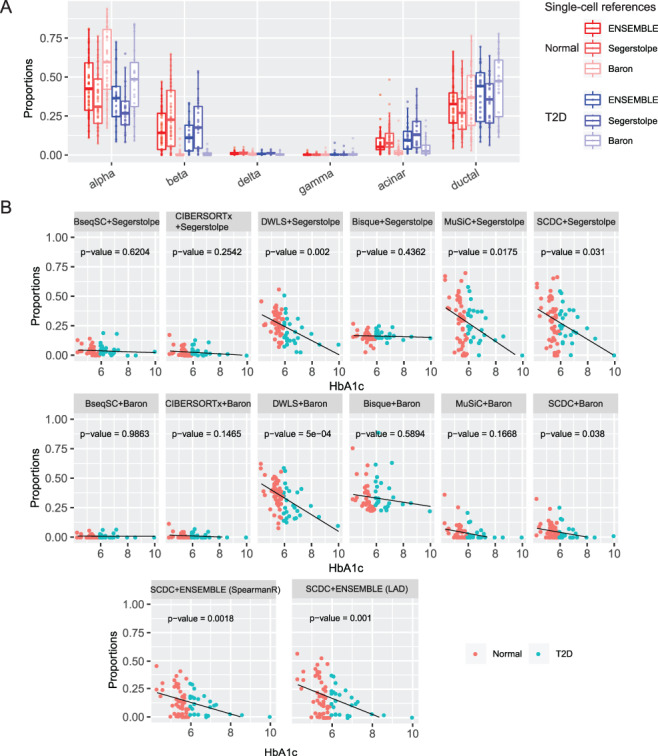
Gene expression deconvolution of human pancreatic islet samples. (A) Estimated pancreatic islet cell-type composition in healthy and type 2 diabetic (T2D) human samples. The boxplot shows discrepancies in the deconvoluted proportions across different reference datasets. The ENSEMBLE method recovered the grossly underestimated beta cell proportions by deconvolution using only scRNA-seq data from [16]. (B) Association of beta cell proportions and HbA1c levels by a linear model: beta cell proportion  HbA1c + age + BMI + sex. Each benchmarked method was applied using reference datasets from [16] and [28] separately. The ENSEMBLE method by SCDC is additionally applied using both reference datasets simultaneously. Bisque, CIBERSORTx and BseqSC fail to recover the previously reported negative correlations; SCDC with ENSEMBLE returns more significant
  -values, compared to single-reference deconvolution.
To evaluate the performance of SCDC and to compare against other existing methods, we sought to replicate previous findings on the negative correlation between the levels of hemoglobin A1c (HbA1c, an important biomarker for type 2 diabetes) and the beta cell functions [34, 35]. We constructed a linear model using the estimated cell-type proportions as the response variable and the other covariates (age, gender, BMI and HbA1c) as predictors. With only one single-cell reference, DWLS [20] returned the smallest  -values, while Bisque [19], CIBERSORTx [18] and BseqSC [16] failed to detect the association, regardless which scRNA-seq reference dataset was adopted (Figure 4B). MuSiC [17] returned insignificant associations for the scRNA-seq reference dataset from [16] (Figure 4B). Without ENSEMBLE, SCDC returned significant
  -values of 0.031 and 0.038 from each deconvolution; with ENSEMBLE, SCDC led to more significant associations between the HbA1c levels and the beta cell proportions, with
  -values of 0.001 and 0.0018 with weights estimated from LAD and grid search, respectively (Supplementary Table S5, Figure 4B). In sum, the cell-type proportion estimates via ENSEMBLE more accurately reproduced the previously reported association between the two orthogonal measurements.
Performance on mouse mammary gland data
We further illustrate the performance of SCDC on a dataset of mouse mammary gland. Figure 5A gives an overview of the experimental design. For this experiment, mouse mammary glands were harvested from two 12-week-old FVB/NJ mice, FVB3 and FVB4. Bulk RNA-seq was performed on the fresh frozen tissues. Meanwhile, single-cell suspension was prepared for the two samples; both scRNA-seq by 10X Genomics and bulk RNA-seq were performed on the pooled cell suspensions. (Refer to Methods for details on experimental setup including animal model, cell suspension preparation, library preparation and sequencing.) To illustrate the ENSEMBLE method for deconvolution, we adopted another single-cell reference dataset of mouse mammary glands from Tabula Muris [36], generated by the microfluidic droplet-based method (see Key Resources Table). For clarity, the scRNA-seq data generated at the Perou Lab will be denoted as ‘Perou’ and the scRNA-seq data from Tabula Muris will be denoted as ‘T. Muris’; the bulk RNA-seq data generated from the fresh frozen tissue will be denoted as ‘fresh frozen’ and the bulk RNA-seq data from the pooled suspended cells will be denoted as ‘10X bulk’. We aimed to use SCDC to deconvolute each of the two bulk RNA-seq samples using the two scRNA-seq reference sets.
Fig. 5.
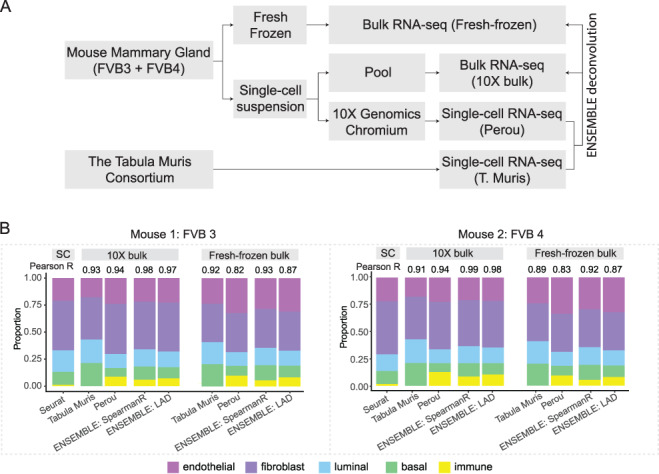
Gene expression deconvolution of mouse mammary gland samples. (A) Flowchart of experimental design. Mouse mammary glands from two replicates, FVB3 and FVB4, were processed in two ways to generate both fresh-frozen bulk samples and single-cell suspensions. The single-cell suspensions were further divided into two parts: one for scRNA-seq by 10X Genomics and the other for pooled bulk RNA-seq. To deconvolute the bulk samples through ENSEMBLE, another scRNA-seq dataset of mouse mammary gland from the Tabula Muris Consortium was adopted. (B) Bulk gene expression deconvolution with and without ENSEMBLE. Pearson correlation of the cell-type proportions estimated by deconvolution and by scRNA-seq are shown. The ENSEMBLE method using LAD or grid search method results in higher correlations for both bulk samples of the two replicates.
Following bioinformatic pre-processing (refer to Methods for details), we first adopted Seurat [24] to perform single-cell clustering for the two scRNA-seq datasets, Perou and T. Muris, and then applied additional quality control (QC) procedures (outlined in the Methods section). The final cell types of interest consisted of immune, endothelial, fibroblast, luminal cells and basal cells; t-SNE visualization is shown in Supplementary Figure S3. As with the example of the three-cell-line mixture, we observed cell types with transcriptomic profiles that were highly similar (Supplementary Figure S4A); we therefore adopted a tree-guided approach for deconvolution [17] in order to distinguish the closely related cell types (Supplementary Figure S4B,C). This two-step deconvolution approach was applied using the Perou and T. Muris scRNA-seq references, respectively. Through ENSEMBLE, SCDC chose dataset-specific weights, which are shown in Table S6. As expected, a higher weight was assigned to the Perou reference dataset, which was from the same source as the bulk samples.
Figure 5B shows the final deconvolution results, both with and without ENSEMBLE, of the two bulk samples. The figure also includes Pearson correlations between the cell-type proportions estimated by scRNA-seq and those estimated by deconvolution. We found that the ENSEMBLE method produced higher correlation coefficients than approaches that use only one scRNA-seq dataset as reference (Figure 5B). This finding demonstrates the advantage of integrating data through SCDC. We also found that, compared to the fresh frozen bulk samples, the deconvoluted cell-type proportions from the 10X bulk samples were more highly correlated with the scRNA-seq fractions (Figure 5B). While the decrease of correlation coefficient from around 0.98 to around 0.92 is reassuring due to the order of the experiments, it also strikingly indicates a potential cell type-specific bias introduced by the 10X Genomics protocol, for it has been previously reported that adipocyte cells tend to get lost during the single-cell library preparation step [37]. As such, cell-type proportions from the single-cell experiment do not necessarily reflect those in the bulk tissues due to the sampling bias and the technical artifacts that are associated with the library preparation and sequencing step of scRNA-seq [38]. This makes in silico deconvolution a compelling approach to unbiased recovery of true underlying cell-type composition.
Discussion
Here, we propose a method for deconvoluting bulk RNA-seq data accurately by exploiting multiple scRNA-seq reference datasets through ENSEMBLE. We show that such data integration leads to higher deconvolution accuracy via both extensive simulations and experimental validations. Existing batch correction methods for scRNA-seq data either do not return a batch-corrected gene expression matrix (but rather components for dimension reduction) [24] or return one with a drastically different range of measurements (between zero and one) [25], making subsequent modeling based on read count/TPM/CPM challenging. In our benchmark analysis, we systematically investigated how batch-effect correction affects deconvolution accuracy by including an optional pre-processing step to correct for batch effect in scRNA-seq data using MNN [25]. Given our observations of unstable performances of the existing deconvolution methods on batch-corrected data (Supplementary Table S3), the utility of scRNA-seq batch-effect correction on improving deconvolution accuracy remains unclear. SCDC does not directly address this nontrivial issue; rather, it opts to integrate deconvolution results derived separately from each available scRNA-seq dataset with different weights, so as to reflect the degree of similarity between the bulk data and the reference data. SCDC let the data decide whether a reference data is close to the bulk data or not. Similarly, for bulk RNA-seq data, which are also subject to batch factors, SCDC can select an optimal combination of scRNA-seq reference sets for each sample separately to achieve more accurate cell-type decomposition.
While in this paper we have focused on integrating results from multiple scRNA-seq datasets, the same framework can be applied to integrate results from different deconvolution methods. In Supplementary Table S2, we showed that no one method universally performed better than the others across all simulation setups. To address this instability issue, SCDC’s weighting principle can be applied similarly, where different weights are assigned to different deconvolution methods.
For weight optimization, we would ideally hope that the sets of weights selected by different methods offered by SCDC always agree with each other. However, sometimes, the performances of candidate reference datasets could resemble in one metric but diverge in another metric (Supplementary Figure S2C, S2F). When significant discrepancies exist among the sets of weights selected by different existing metrics, we introduce an optional metric to aid the users to choose a set of weights in the spirit of meta analysis [39, 40]. Specifically, we propose to use the proportions of inverse sum of squared errors (SSEs) between  and
and  from reference datasets to weight them such that higher weights are assigned to references with higher estimation accuracy of
  . More details can be found in Supplemental Information.
Identifying cell-type composition of disease-relevant tissues allows identification of cellular targets for treatment and offers a better understanding of disease mechanism. For downstream analysis following deconvolution, hypothesis testing on differential gene expression in a case-control setting needs to account for the variability of cell-type composition. As [5] have described, differential gene expression analysis in the presence of cellular heterogeneity can be performed through the following testing schemes: (i) whole tissue differences (i.e. testing on  ); (ii) differences in cell-type compositions (i.e. testing on
  ); (iii) differences in cell type-specific gene expression patterns (i.e. testing on
  for each cell type
  ); (iv) differences in cell type-specific gene expression patterns while accounting for cell-type proportions (i.e. testing on
  for each cell type
  ); and (v) an omnibus test across all cell types (i.e. testing on
  across all cell types simultaneously). All of these testing schemes (except for the testing on
  by traditional methods developed for bulk RNA-seq data) must be adapted when scRNA-seq data is used to aid deconvolution: neither
  nor
nor  is pre-known, and one must take into consideration their estimation uncertainties through deconvolution.The questions of how to jointly perform differential testing when multiple scRNA-seq datasets are available and how to jointly model both bulk and single-cell RNA-seq data [41] with high computational efficiency require further investigation.
Methods
Contact for reagent and resource sharing
Further information and requests for resources and reagents should be directed to and will be fulfilled by Charles M. Perou (chuck_perou@med.unc.edu), Fei Zou (feizou@email.unc.edu) and Yuchao Jiang (yuchaoj@email.unc.edu)
Experimental model and subject details
Cell-line mixture
MCF-7 and MDA-MB-468 cells were purchased from ATCC. Human dermal fibroblasts were isolated from skin. All cell lines were maintained independently in culture medium DMEM (Gibco) supplemented with 10% FBS (Millipore) and 1% penicillin-streptomycin (Gibco) and grown in incubators maintained at 37 C with 5%
  . Cells were mixed together so that MCF-7 cells comprised 60% of the mixture, MDA-MB-468 cells comprised 30% of the mixture and dermal fibroblasts comprised 10% of the mixture.
Animal model
All animal studies were performed with approval and in accordance with the guidelines of the Institutional Animal Care and Use Committee (IACUC) at the University of North Carolina at Chapel Hill. Female FVB/NJ mice were obtained in collaboration with the UNC Lineberger Comprehensive Cancer Center (LCCC) Mouse Phase I Unit (MP1U). Animals were cared for according to the recommendations of the Panel on Euthanasia of the American Veterinary Medical Association. Mice were housed in a climate controlled Department of Laboratory Animal Medicine facility with a 12-h light:dark cycle and ad libitum access to food and water [42]. The mammary glands were harvested at 12 weeks for FVB/NJ mice.
Method Details
Cell suspension preparation
The FVB/NJ mammary glands were placed in 10 ml of a digestion medium containing EpiCulttrademark-B Mouse Medium Kit (#05610, StemCell Technologies), Collagenase/Hyaluronidase (#07912, StemCell Technologies) and 1% penicillin-streptomycin (Gibco). The mammary gland was digested overnight in a thermocycler maintained at 37 C with continuous rotation. The cell pellets retrieved from these suspensions were treated with a 1:4 solution of hanks balanced salt solution and ammonium chloride to remove the RBCs. After RBC removal, the cell suspensions were trypsinized with 0.05% Trypsin and a mix of Dispase and DNAse. A portion of this cell suspension was stained with trypan blue and counted using the Countess Automated Cell Counter (Invitrogen). Based on the counting, the cells were diluted to the appropriate cell stock concentration for running on the 10X Chromium machine. Based on the 10X Genomics pre-defined cell stock concentrations, each experiment was run to retrieve
  5000 cells after the single-cell experiment. The remaining cell stock solution was used for making bulk mRNA seq libraries.
Single-cell library construction, sequencing and bioinformatics pipeline
The cell suspensions were loaded on a 10X Genomics Chromium instrument to generate single-cell gel beads in emulsion (GEMs) for targeted retrieval of approximately 5000 cells. scRNA-Seq libraries were prepared following the Single Cell  Reagent Kits v2 User Guide (Manual Part # CG00052 Rev A) using the following Single Cell
  Reagent Kits v2: Chromiumtrademark Single Cell
  Library & Gel Bead Kit v2 PN-120237, Single Cell
  Chip Kit v2 PN-120236, and i7 Multiplex Kit PN-120262” (10X Genomics). Libraries were run on an Illumina HiSeq 4000 as 2
  150 paired-end reads. The Cell Ranger Single Cell Software Suite (version 1.3) was used to perform sample de-multiplexing, barcode and unique molecular identifiers processing and single-cell
  gene counting. All scRNAseq data by 10X Genomics are available at GEO database (GSE136148).
Bulk mRNA-seq pre-processing
RNA was isolated using the RNeasy Mini Kit (#74104, Qiagen) according to manufacturer protocol. mRNA quality was assessed using the Agilent Bioanalyzer and libraries for mRNA-seq were made using total RNA and the Illumina TruSeq mRNA sample preparation kit. Paired end (2 50bp) sequencing was performed on the Illumina HiSeq 2000/2500 sequencer at the UNC High Throughput Sequencing Facility (HTSF). Resulting fastq files were aligned to the mouse mm10 reference genome using the STAR aligner algorithm [43]. Resulting BAM files were sorted and indexed using Samtools [44] and QC was performed using Picard [45]. Transcript read counts were determined using Salmon [46]. Genes with zero read counts across all samples were removed. All bulk mRNAseq data is available at GEO database (GSE136148).
Clustering QC of scRNA-seq data
To construct the basis matrix  from the single-cell reference dataset, SCDC takes as input gene expression measurements and cluster memberships of all cells that are sequenced by scRNA-seq. While much efforts have been devoted to cell type clustering by scRNA-seq, it has been shown that different approaches can potentially generate varying single-cell cluster assignments [47]. To make SCDC robust to single-cell clustering, a QC procedure is performed as a first step to remove cells with questionable cell-type assignments, as well as cells with low library preparation and sequencing quality. Specifically, each single cell is treated as a ‘bulk’ sample and its cell-type composition can be derived by a first-pass run of SCDC. For well classified cells with good quality, the estimated proportions should be sparse and contain a single non-zero estimate close to one; for questionable cells such as doublets, the estimated proportions would not result in a unique cluster assignment (Supplementary Figure S5A). Therefore, we remove cells whose estimated cell-type proportions have a maximum less than a user-defined threshold (Supplementary Figure S5B). After this initial QC step of the single-cell input, the Pearson correlation of the actual and the deconvoluted cell-type proportions is improved for simulation runs, especially when pseudo-bulk samples and reference datasets are from different sources (Supplementary Table S2).
Construction of basis matrix differs from MuSiC
For deconvolution using each single-cell reference dataset, SCDC estimates cell-type proportions following the W-NNLS framework proposed by MuSiC [17], but differs in the way of calculating the basis matrix. The contribution of each subject to the construction of a basis matrix may vary according to the data quality (Supplementary Figure S6). Hence, MVW per gene is calculated to reflect the data quality [48]. In detail, using scRNA-seq data, SCDC first estimates  , which captures the cross-cell variation for gene
  of cell type
  within individual
  . Within-subject variance for subject
  is then calculated as
  and the MVW
  is given by:
 |
SCDC proceeds to scale the raw single-cell read count matrix by  . Under this construction, genes with larger variance will have larger variance weights. Larger variance weights ensure that residuals from such genes will have smaller impact on estimation of cell-type composition [48]. To control for excessively large or small variance weights, we set the bottom 15% of variance weights to be the 15th percentile variance weight, and similarly, the top 15% of variance weights are replaced by the 85th percentile variance weight. The rest of the estimation procedure largely follows MuSiC. The performances of SCDC and MuSiC were compared via simulations by Pearson correlation and mAD between
  and
and  shown in Supplementary Table S2.
ENSEMBLE: a linear combination of deconvolution results
Assume  single-cell reference datasets are available for the tissue of interest. For each reference dataset
  , SCDC deconvolutes the bulk gene expression data as a matrix decomposition problem. Let
  and
and  denote the cell-type proportion matrix and the basis matrix using the
  th reference dataset, respectively. The bulk gene expression
  can be deconvoluted into the form of
  with a reference-specific error term
  . The predicted gene expression levels from the
  reference dataset is
  . In the ENSEMBLE step, SCDC aims to solve for equation (2). As we stated in the Result session, we make the assumption that the solutions for equations (1) and (2) are approximately equivalent based on the concordance between the metrics on the cell-type proportions (Pearson correlation and mAD between
  and
and  ) and the metrics on the gene expression levels (Spearman correlation and mAD between
  and
and  ) via simulations (Figure 2, Supplementary Figure S2). See Supplemental Information for equation details. In practice, SCDC, by default, chooses the
  norm of
  as the criteria for ENSEMBLE weight selection.
For optimization, we can redirect the problem to LADs regression with constraints on the weights  :
:
 |
LAD regression does not have an analytical solving method [49], hence we applied the method adopted by [50]. While solving for  ’s, an LAD regression with no constraint is first fit. Any negative
  is set to zero, and the estimates are finally scaled to satisfy the constraint. Since the re-scaling step can be problematic, SCDC additionally adopts another numerical method via grid search to determine the optimal ENSEMBLE weights. Supplementary Figure S7 summarizes the computing time of SCDC with the number of single-cell reference datasets ranging from two to five. A total of 100 simulations are performed. For each simulation, the number of pseudo-bulk samples is set to 50, and the step size in grid search is fixed at 0.05. We show that with less than four references, both grid search and LAD can finish within
  200 seconds. As the number of reference datasets increases, the grid search can take longer to run while the computing time for LAD remains nearly constant. Regardless, the optimal weights selected by LAD and by grid search generally agree with each other, as demonstrated in real data analysis (Supplementary Table S4, Supplementary Table S6).
Data and software availability
SCDC is compiled as an open-source R package available at http://meichendong.github.io/SCDC, together with vignettes and toy examples for demonstration. Raw and processed bulk and single-cell RNA-seq data generated in this study are available at GEO with accession number GSE136148. Other data that we adopted include the following: (i) scRNA-seq data of human pancreatic islets from [16] with GEO accession number GSE84133, from [28] with GEO accession number GSE81608 and from [27] with EMBL-EBI ArrayExpress accession number E-MTAB-5061; (ii) bulk RNA-seq of human pancreatic islet from [30] with GEO accession GSE50244; and (iii) scRNA-seq of mouse mammary gland from Tabula Muris Consortium [36] with GSE accession number GSE106273.
Key Points
Bulk RNA sequencing measures average gene expression levels across a population of cells and in complex tissues, the variability in cell-type compositions confounds with analysis such as detecting differential gene expression.
Single-cell RNA sequencing circumvents the averaging artifacts by enabling characterization of transcriptomic profiles at the single-cell level and has been adopted to aid bulk gene expression deconvolution.
While multiple methods exploiting scRNA-seq data for bulk gene expression deconvolution have been developed, they are restricted to only one single-cell reference, while borrowing information from other existing data could potentially boost the performance of and increase the robustness of deconvolution.
We propose SCDC, a deconvolution method for bulk RNA-seq data that leverages cell-type specific gene expression profiles from multiple scRNA-seq reference datasets.
SCDC adopts an ENSEMBLE method to integrate deconvolution results across datasets and gives higher weights to single-cell reference data that are more closely related to the bulk RNA-seq data, implicitly addressing the problem of batch-effect confounding.
Supplementary Material
Funding
National Institutes of Health (grants T32 ES007018 to E.U., R01 HL129132 to Y.L., R01 GM105785 and P30 ES010126 to F.Z., P01 CA142538, R35 GM118102 and UL1 TR002489 to Y.J.); National Cancer Institute Breast SPORE (program P50 CA5822 and R01 CA148761 to C.M.P.); Breast Cancer Research Foundation (to C.M.P.); a developmental award from the UNC Lineberger Comprehensive Cancer Center (2017T109 to Y.J.); and a pilot award from the UNC Computational Medicine Program (to Y.J.).
Author Contributions
F.Z. and Y.J. initiated and envisioned the study. M.D., F.Z. and Y.J. formulated the model. M.D. implemented the algorithm and performed simulation studies. A.T. and C.M.P. envisioned and performed the cell-line mixing and normal mammary gland experiments. All authors performed real data analysis. M.D. and Y.J. wrote the manuscript, which was further edited and approved by all authors.
Conflict of Interest
C.M.P. is an equity stock holder and consultant for of BioClassifier LLC. He is also listed as an inventor on patents on the Breast PAM50 Subtyping assay. The other authors declare that they have no competing interests.
Meichen Dong is a PhD candidate in the Department of Biostatistics at the University of North Carolina at Chapel Hill.
Aatish Thennavan is a PhD candidate in the Curriculum in Bioinformatics and Computational Biology at the University of North Carolina at Chapel Hill.
Eugene Urrutia is a postdoctoral research fellow in the Department of Biostatistics at the University of North Carolina at Chapel Hill.
Yun Li is an Associate Professor in the Departments of Genetics, Biostatistics and Computer Science at the University of North Carolina at Chapel Hill.
Charles M. Perou is the May Goldman Shaw Distinguished Professor of Molecular Oncology and co-director of the Computational Medicine Program at the University of North Carolina at Chapel Hill.
Fei Zou is a Professor in the Departments of Biostatistics and Genetics at the University of North Carolina at Chapel Hill.
Yuchao Jiang is an Assistant Professor in the Departments of Biostatistics and Genetics at the University of North Carolina at Chapel Hill.
References
- 1. Robinson MD, McCarthy DJ, Smyth GK. edger: a bioconductor package for differential expression analysis of digital gene expression data. Bioinformatics 2010; 26(1): 139–40. [DOI] [PMC free article] [PubMed] [Google Scholar]
- 2. Love MI, Huber W, Anders S. Moderated estimation of fold change and dispersion for RNA-seq data with deseq2. Genome Biol 2014; 15(12): 550 10.1186/s13059-014-0550-8 [DOI] [PMC free article] [PubMed] [Google Scholar]
- 3. Ritchie ME, Phipson B, Wu D, et al. limma powers differential expression analyses for rna-sequencing and microarray studies. Nucleic Acids Res 2015; 43(7): e47–7. [DOI] [PMC free article] [PubMed] [Google Scholar]
- 4. Cobos FA, Jo V, Mestdagh P, et al. Computational deconvolution of transcriptomics data from mixed cell populations. Bioinformatics 2018; 34(11): 1969–79. [DOI] [PubMed] [Google Scholar]
- 5. Shen-Orr SS, Tibshirani R, Khatri P, et al. Cell type–specific gene expression differences in complex tissues. Nat Methods 2010; 7(4): 287. [DOI] [PMC free article] [PubMed] [Google Scholar]
- 6. Gong T, Szustakowski JD. DeconRNAseq: a statistical framework for deconvolution of heterogeneous tissue samples based on mRNA-seq data. Bioinformatics 2013; 29(8): 1083–5. [DOI] [PubMed] [Google Scholar]
- 7. Newman AM, Liu CL, Green MR, et al. Robust enumeration of cell subsets from tissue expression profiles. Nat Methods 2015; 12(5): 453. [DOI] [PMC free article] [PubMed] [Google Scholar]
- 8. Zhong Y, Wan Y-W, Pang K, et al. Digital sorting of complex tissues for cell type-specific gene expression profiles. BMC Bioinformatics 2013; 14(1): 89. [DOI] [PMC free article] [PubMed] [Google Scholar]
- 9. Becht E, Giraldo NA, Lacroix L, et al. Estimating the population abundance of tissue-infiltrating immune and stromal cell populations using gene expression. Genome Biol 2016; 17(1): 218. [DOI] [PMC free article] [PubMed] [Google Scholar]
- 10. Wang N, Gong T, Clarke R, et al. Undo: a bioconductor r package for unsupervised deconvolution of mixed gene expressions in tumor samples. Bioinformatics 2014; 31(1): 137–9. [DOI] [PMC free article] [PubMed] [Google Scholar]
- 11. Saliba A-E, Westermann AJ, Gorski SA, et al. Single-cell rna-seq: advances and future challenges. Nucleic Acids Res 2014; 42(14): 8845–60. [DOI] [PMC free article] [PubMed] [Google Scholar]
- 12. Stegle O, Teichmann SA, Marioni JC. Computational and analytical challenges in single-cell transcriptomics. Nat Rev Genet 2015; 16(3): 133. [DOI] [PubMed] [Google Scholar]
- 13. Ziegenhain C, Vieth B, Parekh S, et al. Comparative analysis of single-cell RNA sequencing methods. Mol Cell 2017; 65(4): 631–43. [DOI] [PubMed] [Google Scholar]
- 14. Edgar R, Domrachev M, Lash AE. Gene expression omnibus: NCBI gene expression and hybridization array data repository. Nucleic Acids Res 2002; 30(1): 207–10. [DOI] [PMC free article] [PubMed] [Google Scholar]
- 15. Weinstein JN, Collisson EA, Mills GB, Shaw KR, Ozenberger BA, Ellrott K, Shmulevich I, Sander C, Stuart JM. Cancer Genome Atlas Research Network. The cancer genome atlas pan-cancer analysis project. Nature genetics. 2013; 45(10):1113. [DOI] [PMC free article] [PubMed] [Google Scholar]
- 16. Baron M, Veres A, Samuel L, et al. A single-cell transcriptomic map of the human and mouse pancreas reveals inter- and intra-cell population structure. Cell Syst 2016; 3(4): 346–360.e4. ISSN 2405-4712. doi https://doi.org/10.1016/j.cels.2016.08.011. URL http://www.sciencedirect.com/science/article/pii/S2405471216302666. [DOI] [PMC free article] [PubMed] [Google Scholar]
- 17. Wang X, Park J, Susztak K, et al. Bulk tissue cell type deconvolution with multi-subject single-cell expression reference. Nat Commun 2019; 10(1): 380. [DOI] [PMC free article] [PubMed] [Google Scholar]
- 18. Newman AM, Steen CB, Liu CL, et al. Determining cell type abundance and expression from bulk tissues with digital cytometry. Nat Biotechnol 2019; 37, 773–782. [DOI] [PMC free article] [PubMed] [Google Scholar]
- 19. Jew B, Alvarez M, Rahmani E, et al. Accurate estimation of cell composition in bulk expression through robust integration of single-cell information. bioRxiv 2019. 669911 https://www.biorxiv.org/content/early/2019/06/15/669911. [DOI] [PMC free article] [PubMed] [Google Scholar]
- 20. Tsoucas D, Dong R, Chen H, et al. Accurate estimation of cell-type composition from gene expression data. Nat Commun 2019; 10(1): 2975. [DOI] [PMC free article] [PubMed] [Google Scholar]
- 21. Regev A, Teichmann SA, Lander ES, Amit I, Benoist C, Birney E, Bodenmiller B, Campbell P, Carninci P, Clatworthy M, Clevers H. Science forum: the human cell atlas. Elife. 2017. 6: e27041. [DOI] [PMC free article] [PubMed] [Google Scholar]
- 22. Han X, Wang R, Zhou Y, Fei L, Sun H, Lai S, Saadatpour A, Zhou Z, Chen H, Ye F, Huang D. Mapping the mouse cell atlas by microwell-seq. Cell. 2018. 172(5):1091-107. [DOI] [PubMed] [Google Scholar]
- 23. Vallania F, Tam A, Lofgren S, et al. Leveraging heterogeneity across multiple datasets increases cell-mixture deconvolution accuracy and reduces biological and technical biases. Nat Commun 2018; 9(1): 4735. [DOI] [PMC free article] [PubMed] [Google Scholar]
- 24. Butler A, Hoffman P, Smibert P, et al. Integrating single-cell transcriptomic data across different conditions, technologies, and species. Nat Biotechnol 2018; 36: 411–420. ISSN 1087-0156. doi: 10.1038/nbt.4096 URL https://www.nature.com/articles/nbt.4096. [DOI] [PMC free article] [PubMed] [Google Scholar]
- 25. Haghverdi L, Lun ATL, Morgan MD, et al. Batch effects in single-cell rna-sequencing data are corrected by matching mutual nearest neighbors. Nat Biotechnol 2018; 36(5): 421. [DOI] [PMC free article] [PubMed] [Google Scholar]
- 26. Yuchao Jiang NR. Zhang, and Mingyao Li. Scale: modeling allele-specific gene expression by single-cell rna sequencing. Genome Biol 2017; 18(1): 74. [DOI] [PMC free article] [PubMed] [Google Scholar]
- 27. Xin Y, Kim J, Okamoto H, et al. RNA sequencing of single human islet cells reveals type 2 diabetes genes. Cell Metab 2016; 24(4): 608–15. [DOI] [PubMed] [Google Scholar]
- 28. Segerstolpe A, Palasantza A, Eliasson P, et al. Single-cell transcriptome profiling of human pancreatic islets in health and type 2 diabetes. Cell Metab 2016; 24(4): 593–607. ISSN 1550-4131. doi https://doi.org/10.1016/j.cmet.2016.08.020. URL http://www.sciencedirect.com/science/article/pii/S1550413116304363. [DOI] [PMC free article] [PubMed] [Google Scholar]
- 29. Picelli S, Faridani OR, Björklund AK, et al. Full-length rna-seq from single cells using smart-seq2. Nat Protoc 2014; 9(1): 171. [DOI] [PubMed] [Google Scholar]
- 30. Fadista J, Vikman P, Laakso EO, et al. Global genomic and transcriptomic analysis of human pancreatic islets reveals novel genes influencing glucose metabolism. Proc Natl Acad Sci U S A 2014; 111(38): 13924–9. ISSN 0027-8424. doi10.1073/pnas.1402665111. URL http://www.pnas.org/content/111/38/13924. [DOI] [PMC free article] [PubMed] [Google Scholar]
- 31. Steiner DJ, Kim A, Miller K, et al. Pancreatic islet plasticity: interspecies comparison of islet architecture and composition. Islets 2010; 2(3): 135–45. [DOI] [PMC free article] [PubMed] [Google Scholar]
- 32. Cabrera O, Berman DM, Kenyon NS, et al. The unique cytoarchitecture of human pancreatic islets has implications for islet cell function. Proc Natl Acad Sci 2006; 103(7): 2334–9. [DOI] [PMC free article] [PubMed] [Google Scholar]
- 33. Brissova M, Fowler MJ, Nicholson WE, et al. Assessment of human pancreatic islet architecture and composition by laser scanning confocal microscopy. J Histochem Cytochem 2005; 53(9): 1087–97. [DOI] [PubMed] [Google Scholar]
-
34.
Kanat M, Winnier D, Norton L, et al. The relationship between
 -cell function and glycated hemoglobin: results from the veterans administration genetic epidemiology study. Diabetes Care 2011; 34(4): 1006–10. [DOI] [PMC free article] [PubMed] [Google Scholar]
 -
35.
Hou X, Liu J, Song J, et al. Relationship of hemoglobin a1c with
 cell function and insulin resistance in newly diagnosed and drug naive type 2 diabetes patients. J Diabetes Res 2016; 2016: 8797316
10.1155/2016/8797316. [DOI] [PMC free article] [PubMed] [Google Scholar]
cell function and insulin resistance in newly diagnosed and drug naive type 2 diabetes patients. J Diabetes Res 2016; 2016: 8797316
10.1155/2016/8797316. [DOI] [PMC free article] [PubMed] [Google Scholar] - 36. Tabula Muris Consortium, et al. Single-cell transcriptomics of 20 mouse organs creates a tabula muris. Nature 2018; 562(7727): 367. [DOI] [PMC free article] [PubMed] [Google Scholar]
- 37. Nguyen QH, Pervolarakis N, Kessenbrock K Experimental considerations for single cell rna sequencing approaches. Front Cell Dev Biol 2018; 6(108): 108. doi: 10.3389/fcell.2018.00108. [DOI] [PMC free article] [PubMed] [Google Scholar]
- 38. Hwang B, Lee JH, Bang D. Single-cell RNA sequencing technologies and bioinformatics pipelines. Exp Mol Med 2018; 50(8): 96. [DOI] [PMC free article] [PubMed] [Google Scholar]
- 39. DerSimonian R, Laird N. Meta-analysis in clinical trials revisited. Contemp Clin Trials 2015; 45:139–45. [DOI] [PMC free article] [PubMed] [Google Scholar]
- 40. Michael Borenstein LV, Hedges J, Higgins PT, et al. Introduction to Meta-analysis. John Wiley & Sons, 2011. [Google Scholar]
- 41. Zhu L, Lei J, Devlin B, et al. A unified statistical framework for single cell and bulk rna sequencing data. Ann Appl Stat 2018; 12(1): 609. [DOI] [PMC free article] [PubMed] [Google Scholar]
- 42. Qin Y, Sundaram S, Essaid L, et al. Weight loss reduces basal-like breast cancer through kinome reprogramming. Cancer Cell Int 2016; 16(1): 26. [DOI] [PMC free article] [PubMed] [Google Scholar]
- 43. Alexander Dobin CA, Davis FS, et al. Star: ultrafast universal rna-seq aligner. Bioinformatics 2013; 29(1): 15–21. [DOI] [PMC free article] [PubMed] [Google Scholar]
- 44. Li H, Handsaker B, Wysoker A, et al. The sequence alignment/map format and samtools. Bioinformatics 2009; 25(16): 2078–9. [DOI] [PMC free article] [PubMed] [Google Scholar]
- 45. Picard , 2019. . URL http://broadinstitute.github.io/picard/.
- 46. Patro R, Duggal G, Love MI, Irizarry RA, Kingsford C. Salmon provides fast and bias-aware quantification of transcript expression. Nature methods, 2017; 14(4): 417. [DOI] [PMC free article] [PubMed] [Google Scholar]
- 47. Huh R, Yang Y, Jiang Y, Shen Y, Li Y. SAME-clustering: Single-cell Aggregated Clustering via Mixture Model Ensemble. Nucleic Acids Research, 2019. 10.1093/nar/gkz959. [DOI] [PMC free article] [PubMed] [Google Scholar]
- 48. Wilson DR, Jin C, Ibrahim JG, Sun W. ICeD-T Provides Accurate Estimates of Immune Cell Abundance in Tumor Samples by Allowing for Aberrant Gene Expression Patterns. Journal of the American Statistical Association, 2019. 14: 1–1. [DOI] [PMC free article] [PubMed] [Google Scholar]
- 49. Vanderbei RJ. Linear Programming. Heidelberg: Springer; 2015. [Google Scholar]
- 50. Osorio F, Wolodzko T, Osorio F. Package ’l1pack’. 2017.
- 51. Welch JD, Kozareva V, Ferreira A. et al. Single-cell multiomic integration compares and contrasts features of brain cell identity. Cell, 2019; 177(7): 1873–1887. [DOI] [PMC free article] [PubMed] [Google Scholar]
- 52. Stuart T, Butler A, Hoffman P, Hafemeister C, Papalexi E, Mauck III WM, Hao Y, Stoeckius M, Smibert P, Satija R. Comprehensive Integration of Single-Cell Data. Cell. 2019; 177(7): 1888–1902. [DOI] [PMC free article] [PubMed] [Google Scholar]
- 53. Deng Y, Bao F, Dai Q. et al. Scalable analysis of cell-type composition from single-cell transcriptomics using deep recurrent learning. Nat Methods. 2019. 16: 311–314. doi: 10.1038/s41592-019-0353-7. [DOI] [PMC free article] [PubMed] [Google Scholar]
Associated Data
This section collects any data citations, data availability statements, or supplementary materials included in this article.
Supplementary Materials
Data Availability Statement
SCDC is compiled as an open-source R package available at http://meichendong.github.io/SCDC, together with vignettes and toy examples for demonstration. Raw and processed bulk and single-cell RNA-seq data generated in this study are available at GEO with accession number GSE136148. Other data that we adopted include the following: (i) scRNA-seq data of human pancreatic islets from [16] with GEO accession number GSE84133, from [28] with GEO accession number GSE81608 and from [27] with EMBL-EBI ArrayExpress accession number E-MTAB-5061; (ii) bulk RNA-seq of human pancreatic islet from [30] with GEO accession GSE50244; and (iii) scRNA-seq of mouse mammary gland from Tabula Muris Consortium [36] with GSE accession number GSE106273.
Key Points
Bulk RNA sequencing measures average gene expression levels across a population of cells and in complex tissues, the variability in cell-type compositions confounds with analysis such as detecting differential gene expression.
Single-cell RNA sequencing circumvents the averaging artifacts by enabling characterization of transcriptomic profiles at the single-cell level and has been adopted to aid bulk gene expression deconvolution.
While multiple methods exploiting scRNA-seq data for bulk gene expression deconvolution have been developed, they are restricted to only one single-cell reference, while borrowing information from other existing data could potentially boost the performance of and increase the robustness of deconvolution.
We propose SCDC, a deconvolution method for bulk RNA-seq data that leverages cell-type specific gene expression profiles from multiple scRNA-seq reference datasets.
SCDC adopts an ENSEMBLE method to integrate deconvolution results across datasets and gives higher weights to single-cell reference data that are more closely related to the bulk RNA-seq data, implicitly addressing the problem of batch-effect confounding.