

SUMMARY
In multicellular eukaryotes, RNA polymerase (Pol) II pauses transcription ~30–50 bp after initiation. While the budding yeast Saccharomyces has its transcription mechanisms mostly conserved with other eukaryotes, it appears to lack this fundamental promoter-proximal pausing. However, we now report that nearly all yeast genes, including constitutive and inducible genes, manifest two distinct transcriptional stall sites that are brought on by acute environmental signaling (e.g., peroxide stress). Pol II first stalls at the pre-initiation stage before promoter clearance, but after DNA melting and factor acquisition, and may involve inhibited dephosphorylation. The second stall occurs at the +2 nucleosome. It acquires most, but not all, elongation factor interactions. Its regulation may include Bur1/Spt4/5. Our results suggest that a double Pol II stall is a mechanism to downregulate essentially all genes in concert.
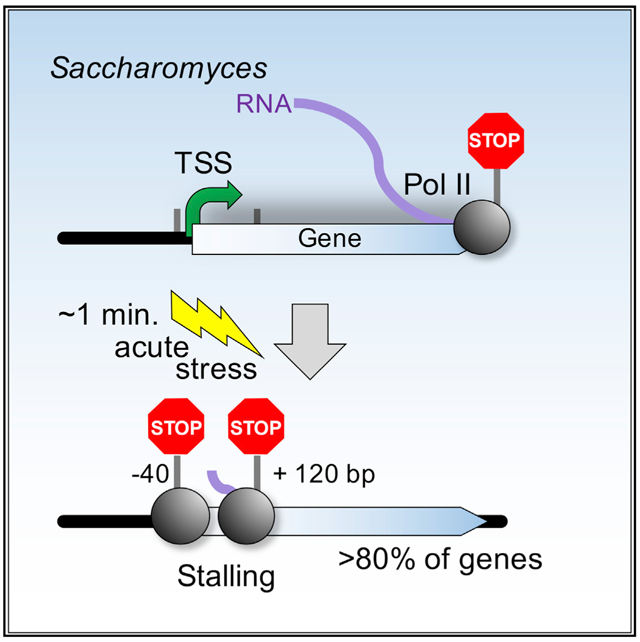
Graphical Abstract
In Brief
Unlike metazoans, transcription in budding yeast proceeds rapidly from start to end. However, Badjatia et al. now show that acute stress causes Pol II to stall at two primary locations at the 5′ ends of most yeast genes. Stalling may facilitate rapid gene silencing, which promotes stress-induced gene-specific reprogramming.
INTRODUCTION
In principle, two distinct strategies may regulate genes via transcription: gene specific and global. Gene-specific regulation occurs through well-defined mechanisms involving site-specific DNA binding transcription factors (TFs), which differ from the general transcription initiation factors (GTFs) such as TBP, TFIIA, TFIIB, and so forth. Global control coordinately impacts all genes. Its existence is more enigmatic and is the focus of this study. There are no TFs or even universal mechanisms known to directly regulate all genes. One mammalian-specific global mechanism is thought to involve a small noncoding RNA (called B2) that is produced in response to acute stress and inhibits productive formation of the transcription preinitiation complex (PIC) (Allen et al., 2004; Espinoza et al., 2004). Another mechanism in multicellular eukaryotes involves RNA polymerase (Pol) II pausing of transcription about 30–50 bp downstream of nearly all transcription start sites (TSSs) (Adelman and Lis, 2012; Core and Adelman, 2019; Guo and Price, 2013). Pausing may act as a form of global negative regulation that is intrinsic to normal cells, wherein a small fraction of Pol II moves productively through this regulatory point, but most terminate and recycle (Darzacq et al., 2007; Krebs et al., 2017; Price, 2018; Steurer et al., 2018). A pause could ensure that early initiation events are properly completed before releasing Pol II into the gene body.
Pausing is typically associated with DSIF, NELF, p-TEFb, and Gdown1, all of which regulate the pausing process positively or negatively (Chen et al., 2018; Jonkers and Lis, 2015). However, NELF-independent pausing has been observed in S. pombe (Booth et al., 2016) and at stress-responsive genes in C. elegans (Maxwell et al., 2014). These global processes work in the context of gene-specific pause release (Danko et al., 2013; Lagha et al., 2013; Rahl et al., 2010; Veloso et al., 2014; Zeitlinger et al., 2007). For example, heat shock directs the TF HSF1 to promote more productive clearing of paused Pol II at the heat shock protein (HSP)70 gene (Lis et al., 2000). Similarly, c-Myc is responsible for pause release at its target genes in embryonic stem cells (Rahl et al., 2010). Beyond gene-specific enhanced release, there is little evidence of a concerted regulation (as opposed to occurrence) of pausing across all genes. Pause release may be slowed in response to acute oxidative stress (via peroxide: 0.2–0.3 mM H2O2) in mammalian cells (Giannakakis et al., 2015; Nilson et al., 2017), but its mechanism has not been investigated. General pausing creates a global mechanism to inhibit transcription, whereas gene-specific release creates a mechanism to selectively enhance transcription. Both potentially operate through the same regulatory point. Whereas pausing is understood to be the global default, with gene-specific release, there may be biological systems where global pausing is not the default but is induced to occur. This could be gene specific or global. To our knowledge, environmentally linked global repression of essentially all genes through simultaneous pausing of Pol II at all genes has not been previously described.
The budding yeast Saccharomyces cerevisiae is a model for studying the global and specific reprogramming of genes, because it evolved in environments having acute stress. Consequently, they reprogram their genomes rapidly (within minutes) in response to acute external stimuli. This includes sudden changes in the temperature, pH, nutrient availability, oxidative conditions, and so forth (de Nadal et al., 2011; Morano et al., 2012). More than 90% of all yeast genes are transcriptionally active in rich YPD media, making a study on global gene control mechanisms in YPD applicable to essentially all genes.
Budding yeast appears to lack promoter-proximal pausing that would provide a framework for global regulation that had been demonstrated in multicellular eukaryotes. Moreover, acute sublethal stress like hydrogen peroxide (H2O2) or heat shock causes only a small fraction of all genes to change their steady-state mRNA levels (~10% increase and ~5% decrease in expression). They do so through TFs acting specifically on environmental stress-response (ESR) genes (Causton et al., 2001; Delaunay et al., 2000; Gasch et al., 2000, 2017; Kuge et al., 1997; Marinho et al., 2014; Morano et al., 2012; Yamamoto et al., 2005). It would, therefore, appear that there may not be a global regulatory response in yeast affecting all genes in the face of acute stress and that most genes simply remain active and unperturbed. This is supported by a generally unchanging occupancy level of GTFs at promoters in response to stress (Reja et al., 2015; Vinayachandran et al., 2018). However, a lack of global regulation is complicated by the notion of mRNA buffering, in which changes in mRNA synthesis are counterbalanced by changes in mRNA degradation, resulting in constant mRNA levels (Blevins et al., 2019; Sun et al., 2012, 2013; Timmers and Tora, 2018). Perplexingly, some of our previous observations hinted at stress-induced genomic changes occurring more broadly than simply at the stress-response genes (Vinayachandran et al., 2018). In particular, acute stress caused the transient relocation of the RSC remodeler from the +1/+2 nucleosomal region of gene bodies into promoter regions, including those that are not evidently stress responsive at the steady-state mRNA level. Therefore, we were led to further investigate other changes taking place globally at all genes, including at constitutive and seemingly nonresponsive genes.
In this study, we rapidly reprogrammed the yeast genome using peroxide as a stress. We used chromatin immunoprecipitation (ChIP)-exo to track the redistribution of Pol II throughout gene bodies. Remarkably, most (and not just stress-specific) genes accumulated Pol II at their 5′ ends in what appears to be a general stress-induced stalled state. We use the term “stalling” instead of “pausing,” as the latter involves the NELF complex, which is absent in Saccharomyces. The high resolution of ChIP-exo resolved two stall regions (at promoters and ~200 bp downstream); and permanganate chromtain immunoprecipitation sequencing (PIP-seq), which measures melted DNA, revealed that they are transcriptionally engaged. ChIP-exo further showed that GTF loading and Pol II phosphorylation were normal at the first stall and that elongation factor loading was normal at the second stall. We used 4-thiouracil labeling of nascent RNA to demonstrate a loss of transcription downstream of the stall at nearly all genes, despite reports of steady-state mRNA being generally unchanged (Causton et al., 2001; Gasch et al., 2000). To provide insight into the origins of stalling, we rapidly depleted promoter and early elongation factors and examined their effect on Pol II stalling. Together, these findings reveal a process to globally downregulate transcription (but not PIC assembly) through two distinctly regulated parts of the transcription cycle. This may allow for rapid and coordinated reprogramming of the genome.
RESULTS
Acute stress causes Pol II to stall at the 5′ ends of genes
In light of our previous findings that some proteins, including RSC and Pol II, relocate along genes in response to acute stress (Vinayachandran et al., 2018), we conducted a detailed time course of Pol II binding along gene bodies in response to acute oxidative stress (0.3 mM H2O2). Binding was monitored by ChIP-exo, which uses formaldehyde crosslinking to instantaneously trap protein-DNA interactions in vivo, and an exonuclease to mark crosslinking sites at near-base-pair resolution (Rhee and Pugh, 2011; Rossi et al., 2018). To gain a global view that encompassed entire genes, Pol II binding was plotted as a heatmap aligned by the midpoint between each gene transcript start and end (n = 5,171). Genes were sorted by length (Figure 1A) and then grouped by previously defined ribosomal protein (RP), SAGAdom, and TFIIDdom gene classes (Figure 1B). RP genes form a distinctly regulated stress-repressed group (Warner, 1999). Whereas TFIID regulates all gene classes, the SAGAdom class is generally stress induced and relatively more regulated by the SAGA complex compared to the TFIIDdom class (Huisinga and Pugh, 2004). The latter is relatively more enriched with constitutive genes. Although some studies have challenged this classification (Bonnet et al., 2014; Petrenko et al., 2019; Warfield et al., 2017), conclusions from a more recent study are akin to a less stringent version of the SAGAdom and TFIIDdom gene classifications (Donczew et al., 2020).
Figure 1. RNA Pol II accumulates at the 50′ end of genes upon acute oxidative stress.

(A) Illustration of gene-length order in heatmap “bell plots.”
(B) Time course for treatment of yeast cells with 0.3 mM H2O2. 50′ ends of Rpb3 ChIP-exo tags are plotted relative to each transcription unit TSS-TES midpoint. Rows are sorted by transcription unit length and grouped by class: ribosomal protein (RP) genes, SAGAdom genes (SAGA), and TFIIDdom genes (TFIID). All rows across datasets are linked. Datasets are normalized using total tag count.
(C) Composite plots comparing the datasets shown in (B) at the TSS (left) and TES (right) of SAGAdom and TFIIDdom genes, respectively. Only tail-to-tail (convergently transcribed, sharing the same termination region) genes are shown at the bottom right. Midpoints of micrococcal nuclease (MNase) ChIP-seq paired-end reads for nucleosomes are indicated in filled gray plots. Datasets are normalized using total tag counts.
(D) Top: calculation of the stalling ratio, where “L” denotes the indicated genomic interval in base pairs. Middle: boxplot for the SR of Pol II and negative controls at SAGAdom and TFIIDdom genes, before and after 6 min of treatment with 0.3 mM H2O2. Calculations are based on three independent replicates. Percentile values are indicated by the key. Bottom: heatmaps of Pol II at 0 and 6 min post-treatment of yeast cells with 0.3 mM H2O2. 5′ ends of Rpb3 ChIP-exo tags were plotted. Rows are sorted by high to low stalling ratio (SR) and grouped by SAGAdom and TFIIDdom gene class. All rows across datasets are linked. Datasets are normalized using total tag count.
See also Figure S1.
In the absence of stress, Pol II was normally distributed throughout gene bodies, with higher enrichment at terminators (Figure 1B, 0 min) (Rhee and Pugh, 2012). This distribution indicates that dissociation of the terminated complex may be a rate-limiting step during transcription. After just 1 min of oxidative stress, there was widespread enrichment of Pol II at the 5′ ends of genes (stalling, as demonstrated later), reflecting a new rate-limiting step. Stalling was maximal at 6 min of peroxide stress and then gradually diminished over the next 2 h, but it did not fully dissipate (Figure 1C, left panels). Since peroxides are unstable and highly reactive with proteins, this sustained stress response may be due to accumulated nonlethal cellular damage.
Pol II was rapidly and highly depleted downstream of the stall region, including at the transcription end site (TES) region (Figure 1C, right panels), suggesting that Pol II was not stalling beyond the 5′ stall region. Similar stalling patterns were obtained with other Pol II subunits (Figure S1A, left), albeit with differing ChIP efficiencies. Stalling was also at the stress-repressed RP genes (Figure S1A, right) and at noncoding transcription units (cryptic unstable transcripts [CUTs], stable unannotated transcripts [SUTs], an Xrn1-sensitive unstable transcripts [XUTs]; Figure S1B). Noncoding transcription units are often present in a head-to-head arrangement (shared promoter region) with protein coding genes. Pol II stalling at the divergent TSSs of these upstream coding genes gives the impression of Pol II accumulation at either side of the TSS of the noncoding genes. Such an accumulation is less apparent in Figure 1, because both gene starts and ends are present at varying distances upstream of the TSS of protein coding genes, which caused the upstream peak to be more diffuse. Hence, coupled with the loss of Pol II signal at the TES, a “hill” rather than a precise peak of Pol II signal is observed upstream of the TSS for protein coding genes in response to stress.
Stalling was observed under other acute stress conditions, indicating that stalling is a general phenomenon brought on by acute stress. These included centrifugation before crosslinking (possible hypoxia) and acute heat shock at 37°C (Vinayachandran et al., 2018) and at 42°C (from 25°C) (Figure S1C). The similarity between 37°C and 42°C, compared to the other conditions, suggests that stalling is qualitatively defined by the type of stress and that its magnitude is independent of the severity of the stress, at least for heat shock.
To address the extent to which all genes were undergoing stalling upon stress, we sorted genes based on their stalling ratio (SR), which measured promoter-proximal Pol II density relative to its density in the remainder of the gene body (Figure 1D). We found that 85% of SAGAdom and 83% of TFIIDdom genes showed a statistically significant increased SR upon stress. Stalling was observed at genes whose steady-state mRNA levels were undergoing repression (RP) or activation (SAGAdom) or were generally unchanging (TFIIDdom) in response to oxidative stress as defined previously (Causton et al., 2001; Gasch et al., 2000).
Stalling occurs at promoters and between +1/+2 nucleosomes
We observed two peaks of stress-induced Pol II stalling at the 5′ ends of genes. The first resided just upstream of the TSS, whereas the second was 100–200 bp downstream of the TSS (Figure 1C, left panels). The second stall site occurs between the +1 and +2 nucleosomal dyads, where Pol II enters the second nucleosome. These results suggest that yeast may have two early elongation regulatory points: one linked to transcription initiation and the other linked to early elongation events. Stress may slow movement through these regulatory points, resulting in Pol II stalling.
At SAGAdom genes, the first stall was ~40 bp upstream of the TSS (Figure 1C, top left panel), which is where the GTFs assemble into a PIC. At TFIIDdom genes, the first stall was closer to the TSS but was not well resolved from the second stall (Figure 1C, bottom left panel). It is well established in yeast that after Pol II forms a PIC, wherein the DNA is melted and having one strand in the Pol II active site, Pol II scans downstream to encounter the observed TSS (Murakami et al., 2015; Tomko et al., 2017). This is where processive transcription initiates (Giardina and Lis, 1993; Kuehner and Brow, 2006). Since SAGAdom genes undergo longer Pol II scanning compared to TFIIDdom genes (Rhee and Pugh, 2012), this places the first stall site at the point of DNA melting and PIC formation, before stable initiation downstream. Thus, acute stress may inhibit Pol II scanning.
Stalling results in a loss of nascent transcription
The rapid stress-induced accumulation of Pol II at the 5′ end of most genes, concomitant with the loss of interactions along gene bodies (Figure 1), suggests a global downregulation of transcription under acute stress. Contradicting this is the general lack of change in steady-state mRNA levels upon peroxide or other acute stresses, even after sufficient time has allowed for mRNA turnover (Causton et al., 2001; Gasch et al., 2017, 2000). The contradiction may not reside in the assays per se, since Pol II ChIP-exo data accurately reflect steady-state mRNA levels (Rhee and Pugh, 2012; Vinayachandran et al., 2018). Instead, mRNA buffering may offer one reconciliation (Blevins et al., 2019; Sun et al., 2012, 2013; Timmers and Tora, 2018). Accordingly, any decrease in transcription is compensated by increased mRNA stability. To circumvent potential mRNA buffering and connect our Pol II ChIP results with transcriptional output, we measured nascent mRNA synthesis using 4-thiouracil (4-tU) pulse labeling. Selective purification of 4-tU labeled transcripts distinguishes them from pre-existing transcripts. Cells were simultaneously treated with 4-tU and with or without peroxide. Consistent with our ChIP-exo results, we found that nascent mRNA levels of nearly all (~95%) Pol II-transcribed genes were reduced by >2-fold after peroxide treatment (Figure 2A, blue/black relative to yellow). Thus, acute stress results in global inhibition of transcription, which, we suggest, occurs via promoter-proximal stalling at two locations along gene bodies.
Figure 2. Nascent transcription is reduced upon acute peroxide stress.

(A) The heatmap panel indicates FPKM values of 4-tU-labeled nascent RNA for 6 min with or without treatment with 0.3 mM H2O2 for SAGAdom and TFIIDdom genes. The boxplot indicates FPKM aggregated values for untreated and peroxidetreated cells for all protein coding genes. Percentile values are indicated by the key.
(B) The cartoon depicts Pol II engaged in a transcription bubble. Composite plots are indicated for PIP-seq reads at the TSSs of all coding genes (except RP), filtered for T (or A as a negative control) at −1 from the sequenced Read_1 5′ end, under normal (left panel) and stress (right panel) conditions. Single-stranded non-template DNA is highlighted in blue. 5′ ends of Pol II ChIP-exo reads are indicated in gray.
Stalled Pol II is present in an open DNA complex
The stalled Pol II, as measured by ChIP, does not distinguish whether Pol II is actually engaged with a melted DNA template or is simply within crosslinkable distance of unmelted DNA. For example, the first stall at the promoter may be either an open (melted) or a closed (unmelted) complex. Similarly, the second stall may simply be a consequence of the +1/+2 linker DNA region being near the promoter in 3D space and, therefore, crosslinking to Pol II at the first stall position. If Pol II were in an open complex that is stalled, it might not be amenable to assays (such as PRO-seq or NET-seq) that measure nascent transcripts, because Pol II might not be transcriptionally active in a stalled state, which these assays require. Additionally, being stalled at the promoter (particularly upstream of the TSS) means that any RNA that is produced would be too short to map to the reference genome (typically requiring >20 nt).
To address whether Pol II is engaged with open DNA, we turned to PIP-seq, a single-nucleotide resolution assay that measures genomic locations of single-stranded DNA (by permanganate reactivity of unpaired or melted thymidine) in combination with ChIP. This was used to monitor melted PIC “bubbles” in yeast and paused Pol II complexes in mammalian cells (Lai and Pugh, 2017; Vinayachandran et al., 2018). After ChIP, piperidine is used to cleave the DNA just 3′ to the oxidized thymidine. As a result, PIP-seq data are enriched for reads that begin immediately downstream of a thymine base (i.e., a “T” is present at the −1 nucleotide position relative to the 5′ end of the sequencing read). Indeed, a “T” enrichment is necessary to distinguish ChIP enrichment of melted DNA from just ChIP enrichment. As shown in Figure 2B (right panel), Pol II PIP-seq mirrored the two stress-induced stall sites as observed through ChIP-exo. As a control, this did not occur where the nucleotide at the −1 position was an “A.” Therefore, we conclude that stalled Pol II is engaged with melted DNA.
PIP-seq can also measure transcriptional engagement. The RNA-DNA hybrid in the Pol II active sites protects the template strand from permanganate reactivity, whereas the non-template (sense) strand is sensitive to permanganate (Lai and Pugh, 2017) (Figure 2B, diagram). We observed more Pol II PIP-seq tags on the non-template stand (indicated in blue) than on the template strand (indicated in red) at the second stall site (Figure 2B, right panel in the region +100 to +200 from the TSS), indicating that the second stall involves transcriptionally engaged Pol II. Strand bias was also seen, and expected, throughout gene bodies (both panels) and at termination regions of adjacent upstream genes (left panel). Strand bias was not observed for sequencing reads that lacked “T” at the −1 position. The strand bias was absent at the first stall site, likely due to the absence of RNA in the PIC. Thus, Pol II at the first stress-induced stall is engaged with melted promoter DNA and is not engaged with RNA. However, Pol II at the second stall site and beyond is transcriptionally engaged. These observations indicate that the first and second stall sites are distinct.
Promoter stalling is not due to loss of promoter binding factors
The notion of stalling as a means of globally downregulating transcription raises the question as to whether it is also accompanied by a change in PIC assembly. Previous studies have implicated TFIIH in Pol II promoter escape (Akoulitchev et al., 1995; Kugel and Goodrich, 1998; Wong et al., 2014), and a more recent study has shown that an inactive Kin28 subunit of TFIIH causes Pol II to accumulate ~170 bp downstream of the TSS (Rodríguez-Molina et al., 2016). Therefore, we examined whether Pol II stalling at promoters might be attributed to a loss in TFIIH association. Heatmaps of TFIIH (Kin28 and Ssl2 subunits) at SAGAdom and TFIIDdom genes showed that their occupancy positively correlated with the Pol II stalling ratio (Figure 3A), meaning that TFIIH was not impaired in association with stalled Pol II at promoters. This was true for all other GTFs that we assayed (Figure 3A). The presence of PICs and TFIIH supports the notion that these GTFs are required for the promoter melting that is observed with stalled Pol II there. In fact, the stalling at promoters resulted in slightly higher GTF occupancy (Figure 3B). Promoter stalling, therefore, might inhibit GTF dissociation that is expected to normally occur when Pol II rapidly clears the promoter.
Figure 3. Promoter Stalling Is Not due to Loss of Promoter Binding Factors.

(A) Heatmaps of various PIC subunits (and capping enzyme Cet1) at 0 and 6 min post-treatment of yeast cells with 0.3 mM H2O2. 5′ ends of ChIP-exo tags were plotted. Rows are sorted by high to low stalling ratio (SR) and grouped by class: SAGAdom (SAGA) and TFIIDdom genes (TFIID). All rows across datasets are linked. Datasets are normalized using total tag count.
(B) Strand-separated composites of PIC subunit occupancy at the TSS. Data from the non-transcribed strand are plotted on an inverted scale. Midpoints of MNase ChIP-seq reads for nucleosomes are indicated as filled gray plots. Datasets are normalized using total tag count.
Post-translational modifications of the Pol II carboxyl-terminal domain (CTD) orchestrate the assembly of a multitude of factors during transcription (Bataille et al., 2012; Buratowski, 2009; Eick and Geyer, 2013; Harlen and Churchman, 2017; Jeronimo et al., 2013; Komarnitsky et al., 2000), which might be altered upon oxidative stress. While Kin28–the kinase that phosphorylates serines 5 and 7 (S5P and S7P) within the heptad repeats of the CTD (Hsin and Manley, 2012)–was not lost upon oxidative stress, its activity, nonetheless, might be inhibited by stress, resulting in a stalled Pol II that is underphosphorylated. This would be consistent with a previous observation that Kin28 inhibition results in stalling (Rodríguez-Molina et al., 2016). Therefore, we mapped S5P and S7P at SAGAdom and TFIIDdom genes (Figure 4A). These composite plots showed that, in the absence of stress, S5P was enriched at promoters as expected, including when normalized to Pol II occupancy (compare Figures 4A and 1C). This is consistent with the Pol II CTD being phosphorylated at promoters (Harlen and Churchman, 2017). In the presence of acute stress, S5P and S7P levels increased where Pol II accumulated at the first and second stall site (Figure 4A), indicating that stalling was not due to a failure to phosphorylate the CTD. Phosphorylation levels normalized to Pol II occupancy did not appreciably change under acute stress (Figure 4B), meaning that CTD phosphorylation appeared approximately normal.
Figure 4. CTD S5P and S7P are maintained at stalled Pol II.

(A) Composite plots comparing Pol II CTD S5P and S7P at the TSSs of SAGAdom and TFIIDdom genes, respectively, at 0 and 6 min post-treatment with 0.3 mM H2O2. 5′ ends of ChIP-exo tags were plotted. Midpoints of paired-end MNase ChIP-seq reads for nucleosomes are indicated in filled gray plots. Datasets are normalized using total tag count.
(B) Boxplot for the fold change in the TSS-proximal (−50 to +250 bp from the TSS) occupancy of S5P and S7P normalized to Pol II (Rpb3) upon 6 min of treatment with 0.3 mM H2O2. Calculations are based on three independent replicates of CTD S5P and S7P and Rpb3 ChIP-exo. Percentile values are indicated by the key.
We next examined whether Pol II stalling might be attributed to a loss in another promoter-proximal event: mRNA capping. Since mRNA is not produced at the first stall site, we opted to measure the binding of the capping enzyme subunit Cet1 by ChIP-exo (Figures 3A and 3B). However, like the GTFs, its binding was not impaired by stalling (but was enhanced), meaning that stalling is not likely due to an inability of the capping enzyme to bind Pol II. Notably, however, the presence of the capping enzyme at the promoter-stalled Pol II indicates that it associates with the PIC before productive transcription initiation and before the emergence of the nascent mRNA. However, it also is at the second stall site.
Gene induction can overload the stall but not bypass it
In response to acute stress, transcription at RP genes is repressed, whereas at other genes, it is induced. However, most genes are unchanged. When genes are repressed by acute stress, does the Pol II that pre-existed in promoter regions in the unstressed state simply stall? Alternatively, is Pol II rapidly dismantled and/or prevented from assembling, thereby making stalling moot? For RP genes, acute peroxide stress did not result in an immediate loss of Pol II at RP genes (Figure 1A; Figure S1A, right panel, 1-min time point compared to all others). Instead, stalling was observed within 1 min, with a Pol II occupancy level that was commensurate with its gene-body pre-stress levels. Only afterward did Pol II occupancy drop to background levels, with a half-life of about 3 min. Thus, at least for RP genes, stalling is more rapidly imposed than regulated changes in the assembly/disassembly of Pol II.
More generally, Pol II occupancy was less correlated with GTF occupancy (defined by TFIIB/Sua7, TFIIH/Ssl2, and TFIIH/Kin28) in the pre-stressed state than at 6 min of stress (Figure 5A). Less correlation occurs because, under normal conditions, Pol II rapidly escapes from promoter regions and is not there long enough to be efficiently captured and thus correlated, compared to the stress-induced stalled state. However, stress-induced Pol II occupancy at the stall region did correlate more strongly with stress-induced PIC assembly than with pre-stress PIC assembly. This suggests that Pol II stalling at 6 min occurs at a level defined by its reprogrammed state and not by its pre-existing state. Thus, while pre-existing Pol II may stall rapidly (exemplified by RP), stalling continues into the reprogrammed state at a level defined by reprogrammed GTF occupancy. Apparently, stress-induced genes do not escape the stall but, instead, just intensify PIC and Pol II loading, which results in more Pol II transiting the stall region and more gene expression. This was most evident when examining genes that are the most stress induced (highest increase in Ssl2 at 6 min of peroxide stress; Figure 5B, upper panels). They showed high Pol II stalling at 6 min but then displayed broad gene body coverage by 30 min, which is concordant with their increased expression. Where PIC assembly did not change with stress (Figure 5B, lower panels), Pol II levels that occurred across gene bodies at 30 min of stress were generally at pre-stress levels, after undergoing initial stalling. Thus, constitutive genes transiently stall then return to normal.
Figure 5. Increased PIC occupancy leads to more Pol II stalling early and more Pol II elongation later in the stress response.

(A) Heatmap representing Pearson correlation coefficient (r2) for TSS-proximal (−250 bp to +250 bp from the TSS) occupancy of PIC components and Pol II before and after 6 min of treatment with 0.3 mM H2O2.
(B) Heatmap distributions of Kin28 and Pol II at genes with increased PIC (top) or no change in PIC (bottom) occupancy upon stress. 5′ ends of ChIP-exo tags were plotted relative to transcription unit midpoints. Rows are sorted by unit length. Datasets are normalized using total tag count. Boxplots for the gene body occupancy of Pol II before and after 30 min of treatment with 0.3 mM H2O2 for genes indicated in the top and bottom heatmaps. Percentile values are indicated by the key. A ratio between Ssl2 tag counts from ±250 bp from the TSS in unstressed versus stressed cells was used to identify the top 300 genes in Ssl2 occupancy change upon stress (Ssl26min/Ssl20min) and 300 genes that had the highest Ssl2 occupancy (Ssl20min) but also little or no change in Ssl2 upon stress (Ssl26min/Ssl20min = 0.8–1.2).
Elongation factors are recruited to stalled Pol II
We next focused on the second stall region located 100–200 bp downstream of the TSS. The early stage of transcription elongation is accompanied by COMPASS-mediated histone H3K4 methylation at the first 3–4 nucleosomes downstream of the TSS (Shilatifard, 2012; Zhang et al., 2011). Since Pol II stalls broadly over the +1/+2 linker region, we examined whether COMPASS recruitment was impaired. Indeed, we saw rapid peroxide-induced reduction in COMPASS occupancy monitored by ChIP-exo through its Set1 and Swd3 subunits, which normally accumulated ~500 bp downstream of the TSS in unstressed cells (Figure S2A). Thus, if COMPASS travels with Pol II, it does not stably associate with chromatin until Pol II has passed beyond the second stall site. Alternatively, an inability to recruit COMPASS might be linked to stalling. These possibilities remain to be explored.
We considered the possibility that stalling is a form of termination, as seen in unstressed conditions at the ends of genes, but occurring at the stall site. We tracked termination at the ends of genes through ChIP-exo of the termination factor Pcf11. In unstressed cells, Pcf11 accumulated downstream of the TES, along with Pol II (Figure S2B). Upon peroxide stress, Pcf11, along with Pol II, disappeared at the ends of genes, but we did not observe a general accumulation of Pcf11 at either of the two stall sites where Pol II accumulates. Thus, Pcf11-mediated termination was not a predominant basis for stalling.
Since transcription elongation factors play a key role in productive transcription elongation (Battaglia et al., 2017; Rahl et al., 2010; Shetty et al., 2017; Vinayachandran et al., 2018; Zhou et al., 2012), Pol II stalling may be a consequence of their impaired recruitment. Therefore, we examined the gene-body distribution of several elongation factors in response to oxidative stress, including DSIF (Spt4 and Spt5), FACT (Spt16 and Pob3), Elf1, Bur1, and Spt6 (Figures 6 and S3). In unstressed cells, each factor loaded at a particular distance downstream of the TSS. However, they exhibited increased occupancy where Pol II stalled. These elongation factors, therefore, appear to be loading at their normal locations and coreside with Pol II. Thus, stalling is not likely due to their impaired recruitment. We cannot exclude the possibility that their function is impaired when Pol II stalls.
Figure 6. Recruitment of elongation factors to stalled Pol II.

Heatmaps show the distribution of Spt5, Spt16, and Elf1 relative to transcription unit midpoints at 0 and 6 min post-treatment with 0.3 mM H2O2. 5′ ends of ChIP-exo tags were plotted. Rows are sorted by unit length and grouped by class: Ribosomal protein genes (RP), SAGAdom (SAGA), and TFIIDdom genes (TFIID). All rows across datasets are linked. Composite plots for SAGAdom and TFIIDdom genes aligned by TSS are indicated. Midpoints of MNase ChIP-seq reads for nucleosome are indicated as gray-filled plots. See also Figures S2 and S3.
Spt4/Spt5 depletion results in Pol II stalling
Given the role of DSIF (Spt4/5) in pausing in multicellular organisms, we examined its role more closely. In yeast cells, the role of Spt4/5 in Pol II pausing or stalling is not clear. In S. pombe and D. melanogaster, spt4− or auxin-induced degradation of Spt5 leads to global decreases of Pol II and nascent RNA along gene bodies relative to an accumulation in the first 500 bp of genes (Booth et al., 2016; Henriques et al., 2018; Shetty et al., 2017). Therefore, we examined Spt4/5 at the second stall region. We first asked whether Spt4/5 was associated with closed versus open DNA using permanganate reactivity that is selective for single-stranded DNA as a measure of melted DNA. Spt5 PIP-seq revealed that its presence at the stall site is associated with melted DNA, indicating that it is associated with transcriptionally engaged Pol II (Figure 7A). To test whether Spt4/5 might be involved in Pol II stalling in S. cerevisiae, we examined Pol II stalling in unstressed cells, where Spt4 or Spt5 was rapidly depleted from the nucleus. Spt4 was depleted using auxin-induced degradation combined with anchor away (relocation from nucleus to cytoplasm). The effectiveness of anchor away is demonstrated in Figure S4 for Spt4. Spt5 had been previously demonstrated to be successfully anchored away, based on cessation of growth (Crickard et al., 2016), which we confirmed (see Figure 7D). In the parental control strain lacking the depletion tags, Pol II displayed a normal non-stalled distribution upon addition of the depletion reagents, indicating that these reagents were not causing Pol II stalling (Figure S5). However, upon Spt5 or Spt4 depletion, we observed Pol II stalling at the second stall region and further downstream, but not at the first stall site (Figures 7B and 7C). This effect was more pronounced upon Spt5 depletion than with Spt4. Thus, depletion of Spt4/5 also results in stalling in the vicinity of where Pol II normally stalls during stress. Whether the two are mechanistically equivalent was not discernible from these experiments.
Figure 7. Spt5/Spt4 nuclear depletion largely phenocopies peroxide-induced Pol II stalling.

(A) Bar graph indicating relative distribution of nucleotides at the −1 position relative to the 5′ end of Read_1. Below are composite plots of Spt5 PIP-seq reads (filtered for T or A at −1 from Read_1 5′ ends) under normal and stress conditions aligned by TSSs of all coding genes (except RP). Non-template (transcribed) strands are highlighted in blue, and template strands are highlighted in red. 5′ ends of Spt5 ChIP-exo reads are indicated in gray.
(B) Distribution of Pol II by ChIP-exo upon Mock Spt5 depletion or upon depletion of Spt5 or Spt4 from the nucleus (30 min with rapamycin; Spt4 depletion additionally contained indoleacetic acid). Tag 5′ ends were plotted relative to transcription unit midpoints. Rows are sorted by unit length and grouped by gene class: ribosomal protein (RP), SAGAdom (SAGA), and TFIIDdom (TFIID). All rows across datasets are linked.
(C) Composite plots from data in (B) are compared to plots of Pol II stalling (6 min of 0.3 mM peroxide) aligned by TSSs of SAGAdom and TFIIDdom genes.
(D) Effect of Spt4/5 depletion and oxidative stress on growth rate. Growth time course is given for the indicated strains in each panel, in response to 0.3 mM hydrogen peroxide (“+ Peroxide stress”) or mock controls (“None” or “-”). Strains were either depleted of the indicated protein using rapamycin anchor away (blue and red traces) or had no deletion (black and green traces). Values indicated in red reflect growth rates upon peroxide treatment relative to mock controls, calculated using the LINEST function in Excel for ln OD600 (optical density 600) values measured in the linear range of the spectrophotometer (empirically determined to be below OD600 = 1.1). Actual values from left to right are (no rapamycin, plus rapamycin): 0.507, 0.521, 0.654, 0.764, 0.938, and 0.852. See also Figures S4-S7.
We examined the consequence of oxidative stress on growth rates and found that 0.3 mM peroxide resulted in slower growth (Figure 7D, AB001 strain). Although not necessarily linked to Pol II stalling, slower growth is an expected outcome of Pol II stalling. Surprisingly, placing a depletion tag on either Spt4 or Spt5 diminished the peroxide growth inhibition, regardless of whether they were subjected to depletion by rapamycin. The diminished response was strongest for Spt5 and only partial for Spt4. Spt5 is essential for growth, so its depletion was accompanied by a reduced growth rate, which was not much altered by peroxide. Spt4 is nonessential, so its depletion had no impact on growth rate. We speculate that the presence of the depletion tags on Spt4/5 might impair its ability to be downregulated by peroxide stress. If true, mutant Spt4/5 might remain active during peroxide stress. Speculatively, this might keep Pol II from stalling and result in less inhibited growth.
Spt4/5 is regulated through phosphorylation by Bur1, which is a kinase and elongation factor (Keogh et al., 2003; Liu et al., 2009; Zhou et al., 2009). Therefore, we depleted Bur1 from the nucleus under nonstressed conditions and found that it also caused partial Pol II stalling near the second site and downstream (Figure S6). In contrast, depletion of a different elongation factor, FACT (Spt16 and Pob3), had no effect on stalling. Bur1 also feeds into the recruitment of the Spt6 elongation factor (Dronamraju and Strahl, 2014), so we depleted Spt6. It too resulted in partial Pol II stalling near the second stall site and downstream, similar to Bur1 depletion. Thus, Spt4/5/6 and Bur1 may work together to escort Pol II through the second stall region, with this process becoming impaired during acute stress.
Since Pol II CTD S5P accumulates at the promoter (the first stall site), but is dephosphorylated as Pol II exits the promoter, we examined whether depletion of CTD phosphatases might affect stalling at the first site. We depleted the CTD phosphatases Fcp1and Ssu72 (Figures S6 and S7). Compared to no depletion, we observed limited Pol II enrichment at the first stall site but not at the second stall site (comparing Pol II occupancy at the TSS region relative to its surrounding regions). Thus, diminished activity of multiple CTD phosphatases, if it occurs during acute stress, might each contribute partially to Pol II stalling at promoters. Their contribution would be consistent with CTD dephosphorylation being normally involved in promoter escape, as part of the phosphorylation/dephosphorylation cycle.
DISCUSSION
Our study suggests that nearly all genes in Saccharomyces have two early elongation regulatory points in their transcription cycle: one at their promoter and a second located approximately between the +1 and +2 genic nucleosome midpoints. Many events occur at these regulatory points, some of which are reciprocal, such as CTD phosphorylation and dephosphorylation. They may become at least partially rate limiting during transcription in response to acute stress. As a result, initiation and elongation factors along with other events, become highly concentrated at fixed distances from genomic reference points such as the TSS. When placed in the context of other studies, our study provides more granularity of detail in the events that unfold during initiation and early elongation.
We suggest that the promoter regulatory point (first stall position) is accompanied by normal PIC assembly, Pol II CTD S5 and S7 phosphorylation, promoter DNA melting, and CAP binding complex assembly, among other events. These other events do not include promoter scanning and elongation factor loading. Under normal transcription-promoting growth conditions, we suggest that Pol II rapidly transitions through the first stall site, upon which CTD S5 and S7 are dephosphorylated. Pol II then scans the promoter region, wherein it begins processive transcription at the TSS. This interpretation is consistent with the notion that dephosphorylation occurs upon promoter escape. Thus, promoter escape may involve a cycle of CTD phosphorylation and dephosphorylation.
Another 100–200 bp downstream, our data suggest that Pol II encounters a second regulatory point in the region between the +1/+2 nucleosome dyads, as Pol II enters the +2 nucleosome. This is the region where many elongation factors load, including Bur1/2, Spt4/5, Spt6, Elf1, and FACT. The inter-related functions of at least Bur1/2/Spt4/5/6 may drive Pol II through this potential regulatory checkpoint. Depletion of these factors, but not other elongation factors, results in varying levels of stalling in this region. Although similar, this may or may not be mechanistically equivalent to peroxide-mediated stalling. Depletion of elongation factors does not cause stalling at the first stall site. Acute stress allows Bur1/Spt4/5/6 to load normally, but stress signaling might inhibit their activity (but not Pol II S5 and S7 phosphorylation) so that Pol II stalls as it enters the +2 nucleosome. Stress signaling could be mediated by a phosphorylation cascade in that Cak1 is a kinase that phosphorylates Bur1 (Yao and Prelich, 2002), which phosphorylates Spt5. However, it seems equally reasonable that it could be mediated by a dephosphorylation cascade. These and other possibilities require further investigation. Beyond the second stall region, downstream factor assembly events do not appreciably occur until Pol II moves through the stall. These include the loading (or retention) of the PAF and COMPASS complexes. We find no evidence of Pol II stalling downstream of the second stall region.
An important observation and implication of these findings is that essentially all genes undergo the same stress-sensing transcriptional regulatory points. Sensing acute stress, an initiating Pol II undergoes essentially two mechanistically distinct types of stalls that serve to rapidly suppress nascent transcription. Superimposed on these potential checkpoints are environment-sensing gene-specific activation and repression mechanisms that are designed into classes of genes (e.g., so called ESR and RP, respectively). Gene-specific activation does not bypass the stall, but it does load more Pol II and, thus, more Pol II transiting the stall region. Conversely, gene-specific repression initially involves a stall, which is then followed by PIC dissociation. “Constitutive” genes, which are neither activated nor repressed by site-specific mechanisms but transiently inhibited by stalling, keep their PIC and other pre-stall assembly processes intact. As cells physiologically adjust to the stress, they return to normal as the stall dissipates.
What this study reveals is that, although gene-specific control occurs by TF-directed PIC assembly, global control of all genes can be mediated by Pol II pausing/stalling in response to acute stress (e.g., peroxide). In multicellular organisms, global negative regulation through pausing occurs at a single site and occurs in unstressed cells. Pausing involves at least NELF and DSIF, as well as release by P-TEFb. This release can be gene specific (Rahl et al., 2010). Pause release results in elevated transcription. In comparison, in budding yeast, Pol II normally moves rapidly through its two stall sites, unless this is inhibited by acute stress. Budding yeast lacks NELF but contains DSIF, which might explain the location of the yeast stall sites compared to metazoan pause sites. NELF is thought to be responsible for pausing being located 30–50 bp downstream of the TSS (Lee et al., 2008). DSIF might function somewhat differently in systems lacking NELF to mediate a different type of Pol II slow down. We do not see evidence for stalling being related to Pcf11-mediated premature termination. We cannot exclude a role for other early termination pathways.
Although two Pol II stall sites may be candidate checkpoints for proper or coordinated initiation and post-initiation events, they also might be a simple means to rapidly depress transcription of all genes with a single input signal. This would allow Pol II to resume transcription at most genes once favorable conditions allow; in essence, picking up where it left off. This would also allow for rapid reprogramming of cells, like yeast, that are exposed to rapidly changing environmental conditions.
STAR★METHODS
RESOURCE AVAILABILITY
Lead contact
Further information and requests for resources should be directed to and will be fulfilled by the Lead Contact, B. Franklin Pugh (fp265@cornell.edu)
Materials availability
All dual-tag depletion yeast strains generate in this study will be made available upon request following publication.
Data and code availability
All primary sequencing data and processed data described in this manuscript have been deposited in the NCBI Gene Expression Omnibus under the accession numbers GEO: GSE151348 and GSE147927. Coordinate files used in the analyses can be found at https://github.com/CEGRcode/2020-Badjatia_peroxide_stress. GUI ScriptManager v.012 used for analysis of all data is available for download at: https://github.com/CEGRcode/scriptmanager.
EXPERIMENTAL MODEL AND SUBJECT DETAILS
Saccharomyces cerevisiae TAP-tagged strains in BY4741 background and depletion strains in W303 background used in this study are listed in the Key Resources Table. Cells were grown in yeast peptone dextrose (YPD) media at 25°C.
KEY RESOURCES TABLE
| REAGENT or RESOURCE | SOURCE | IDENTIFIER |
|---|---|---|
| Antibodies | ||
| Pol II CTD S7P Antibody, clone 4E12 | Millipore | Cat# 04-1570; RRID: AB_10618152 |
| Pol II CTD S5P Antibody, clone 3E8 | Millipore | Cat# 04-1572; RRID: AB_10615822 |
| Pol II Antibody, 8WG16 | Santa Cruz Biotechnology | Cat# sc-56767; RRID: AB_785522 |
| Rabbit IgG | Sigma | Cat# i5006; RRID: AB_1163659 |
| Chemicals, Peptides, and Recombinant Proteins | ||
| Hydrogen Peroxide | Sigma-Aldrich | H1009 |
| Dynabeads M-270 Epoxy | Invitrogen | 14302D |
| Dynabeads Protein A | Invitrogen | 10001D |
| Dynabeads Protein G | Invitrogen | 10003D |
| 4-thiouracil | Sigma-Aldrich | 440736 |
| EZ-Link HPDP Biotin | ThermoFisher | AM1907 |
| mMACS Streptavidin kit | Miltenyi Biotec | Cat# 130-074-101 |
| RiboMinus Transcriptome Isolation Kit, yeast | Invitrogen | K155003 |
| Rapamycin | Sigma-Aldrich | 553210-5MG |
| Indole-3-acetic acid | Sigma-Aldrich | I2886-5G |
| NEBNext Ultra II Directional RNA Library Prep Kit | NEB | E7760S |
| Deposited Data | ||
| Primary sequencing data | NCBI Gene Expression Omnibus | GSE151348 |
| Primary sequencing data | NCBI Gene Expression Omnibus | GSE147927 |
| Experimental Models: Organisms/Strains | ||
| Yeast TAP Tagged ORFs Collection | Horizon Discovery | YSC1177 |
| yAB001 (Parent Strain) | Pugh Lab | Available upon request |
| yAB032 (Spt4-depl) | Pugh Lab | Available upon request |
| yAB035 (Spt16-depl) | Pugh Lab | Available upon request |
| yAB036 (Pob3-depl) | Pugh Lab | Available upon request |
| yAB034 (Spt6-depl) | Pugh Lab | Available upon request |
| yAB023B (Ssu72-depl) | Pugh Lab | Available upon request |
| yAB025 (Fcp1-depl) | Pugh Lab | Available upon request |
| yHM002 (Bur1-depl) | Pugh Lab | Available upon request |
| Software and Algorithms | ||
| Bwa-mem (v0.7.9a) | Li, 2013 | N/A |
| HISAT2 | Pertea et al., 2016 | N/A |
| Collection of scripts used for data analyses | https://github.com/CEGRcode/scriptmanager | N/A |
METHOD DETAILS
Cell growth
Saccharomyces cerevisiae TAP-tagged strains in BY4741 background were purchased from Open Biosystems. Cell cultures were grown in 50-100 mL of yeast peptone dextrose (YPD) media at 25°C in a shaking incubator to an OD600 = 0.7-0.8. For inducing peroxide stress, 10 mM of hydrogen peroxide was added to the cultures to a final concentration of 0.3 mM. The cells were incubated at 25°C in a shaking incubator for indicated times before room temperature formaldehyde (Fisher Scientific, 37%) was added to 1% v/v final concentration. Cells were crosslinked for 15 minutes, after which formaldehyde was quenched by adding 2.5 M glycine to a final concentration of 125 mM for 5 minutes. For hypoxia-like conditions, non-crosslinked cells were harvested at 4°C for 5 min. and crosslinked with 1%v/v final concentration of formaldehyde for 15 minutes in 1 mL of ST buffer (100 mM NaCl and 10 mM Tris, pH 7.5) before quenching with 125 mM of glycine. For 37°C, data were downloaded from (Vinayachandran et al., 2018). For 42°C heat shock, 50 mL of YPD at 60°C was added to 50 mL of cell culture at an OD600 = 0.7-0.8 and placed in a 42°C shaker for 6 minutes. The cells were then crosslinked with cold formaldehyde to 1% v/v final concentration in a 25°C shaker for 15 min. before quenching with 125 mM of glycine. Cells were harvested by centrifugation at 3000 g for 5 minutes at 4°C. Cell pellets were washed with ST buffer (10 mM Tris-HCl, pH 7.5 and 50 mM NaCl) with protease inhibitor mixture (1X, Roche), flash frozen and stored at −80°C until used. At least two independent biological replicates were performed for each experiment unless otherwise mentioned.
Cell Lysis
Harvested cells were lysed in 0.75 mL of cold FA Lysis buffer (50 mM HEPES- KOH, pH 7.5, 150 mM NaCl, 2 mM EDTA, 1% Triton, 0.1% sodium deoxycholate) supplemented with complete protease inhibitor (CPI, Roche) and 0.5 mL volume of of 0.5 mm zirconia/silica beads by bead beating in a Mini-Beadbeater-96 machine (Biospec) for three cycles of 3 min. Samples were chilled on ice for 5 minutes between each cycle. Lysates were transferred to a 1.5 mL microcentrifuge tube and centrifuged at 16,000 x g for 3 minutes at 4°C to pellet the chromatin. The supernatant was removed and the pellets were resuspended in 500- 750 mL of FA Lysis Buffer and transferred to a 15 mL polystyrene conical tube. The samples were then sonicated in a Bioruptor (Diagenode) for 8-10 cycles with 30 s on/off intervals to obtain DNA fragments 100 to 500 bp in size.
ChIP-exo
Antibodies against Pol II CTD S7P (4E12, Cat. # 04-1570) and S5P (3E8, Cat. # 04-1572) were from Millipore. Antibody to Pol II (8WG16, Cat. # sc-56767) was from Santa Cruz Biotechnology. Typically, a 50 mL culture equivalent at OD600 = 0.8 of yeast chromatin was incubated overnight at 4°C with antibody conjugated beads. For TAP-tagged strains, 10 μL bed volume of IgG- Dynabeads was used. For immunoprecipitation with specific antibody, 10 μL of Protein A/G Mag Dynabeads conjugated with 3-5 μg of appropriate antibody was used. ChIP-exo 5.0 was performed exactly as described (Rossi et al., 2018).
PIP-seq
Cells were formaldehyde crosslinked as described above. Cell pellets were washed once with PBS and then resuspended in 1 mL of PBS. 100 μL of 100 mM Potassium Permanganate (KMnO4) in PBS was added to the resuspended cells for oxidation to achieve a final concentration of 10 mM. Cells were gently mixed by pipetting for 1 minute. Reaction was stopped by adding 500 μL of PBS containing 0.8 M β-mercaptoethanol and 40 mM EDTA. Cells were washed with PBS and then lysed and sonicated as described above. Chromatin was immunoprecipitated using specific antibodies or IgG for TAP-tagged strains as described. Immunoprecipitated chromatin on resin was washed sequentially with FA Lysis Buffer, NaCl Buffer, LiCl Buffer, and 10 mM Tris-HCl, pH 8.0 at 4°C. Subsequently, it was subjected to the A-tailing reaction, then first adaptor ligation and kinase reaction and finally the fill-in reaction exactly as ChIP-exo 5.0 (Rossi et al., 2018). After this, DNA was eluted from the resin, and reverse cross-linking and Proteinase K treatment were performed. DNA was purified using 1.8x volume of AMPure magnetic beads (Beckman Coulter) following manufacturer’s instructions. The sample was eluted from the AMPure beads in 90 μL of water. 10 μL of piperidine was added to each sample and incubated at 90°C for 30 minutes. 300 μL of water was added to bring the final volume to ~400 μL for isobutanol-ether extractions. Piperidine was then removed by isobutanol (2X) and ether (2X) extractions and the DNA was ethanol precipitated as previously described (Gilmour and Fan, 2009). After ethanol precipitation, the DNA pellet was resuspended in 20 μL of water and the second adaptor ligation was performed as in ChIP-exo 5.0. The ligation reaction was then purified with AMPure beads (1.8 × volume) and resuspended in 20 μL of water. The samples were amplified by PCR, gel purified and sequenced.
Preparation of 4-ThioU RNA from cells and library preparation
Newly synthesized RNA was labeled with 4-thiouracil as described (Baptista and Devys, 2018). 100 mL of S. cerevisiae or 50 mL of S. pombe was grown in YPD medium at 25°C and 30°C respectively to an OD600 = 0.7-0.8. Cells were labeled with 5 mM 4-thiouracil (Sigma-Aldrich) in DMSO for 6 minutes. For induction of peroxide stress, S. cerevisiae cells were treated with 0.3 mM of hydrogen peroxide right before the addition of 4-thiouracil and then incubated for 6 minutes at 25°C. After incubation, S. cerevisiae and S. pombe were mixed in a 3:1 ratio. Cells were pelleted at 3000 x g for 2 minutes, flash-frozen in liquid N2, and then stored at −80°C until further use. Total RNA was extracted using hot acidic phenol (Collart and Oliviero, 1993). RNA was treated with DNase I (Roche, 5 μl) along with 10 μL of 10X DNase I buffer (Roche) in a total reaction volume of 100 μL for 30 min at 37°C. DNA-free RNA was extracted by Phenol-chloroform purification followed by ethanol precipitation. The concentration was adjusted to 2 μg/μl in DEPC-treated water. 200 μg of total RNA was subjected to thiol-specific biotinylation and then purified using Streptavidin magnetic beads as described (Baptista and Devys, 2018). Purified 4- thioU labeled RNA was depleted of rRNA using RiboMinus™ Transcriptome Isolation Kit, yeast (Invitrogen). rRNA-depleted newly synthesized RNA was used to generate strand-specific libraries for next-generation sequencing following the manufacturers protocol of the NEBNext Ultra II Directional RNA Library Prep Kit (NEB).
Dual-tag depletion system
A double depletion system was developed by engineering the anchor away and auxin induced degradation systems in a single epitope tag (D-tag). The D-tag is used to deplete a target protein in the nucleus by the addition of rapamycin and auxin. These strains also contained a second epitope-tagged protein for localization purposes (L-tag). CRISPR-Cas9 was used to generate the strains. Most strains used in this study had a C-terminal Rpb3 L-tag which contains the TAP tag for chromatin immunoprecipitation. The Rpb3 L-tag strain (yAB020) was then used to generate various dual tag strains by introducing a C-terminal D-tag in the gene of interest. The following strains were used to deplete specified proteins: yAB032 (Spt4-depl), yAB035 (Spt16-depl), yAB036 (Pob3-depl), yAB034 (Spt6-depl), yAB023B (Ssu72-depl), yAB025 (Fcp1-depl), and yHM002 (Bur1-depl). To induce depletion of the D-tag protein, rapamycin and Indole-3-acetic acid was added at a final concentration of 1 mg/ml and 1 mM respectively to 50 mL of S. cerevisiae culture at 25°C for 30 min. before 1% v/v formaldehyde was added to crosslink the cells. Cell harvest, lysis chromatin isolation and ChIP-exo library preparation was done as described above.
Anchor-away
Spt5 anchor away strain was provided by Joe Reese (Penn State University), and had been verified for Spt5 depletion from nucleus (anchor-away) upon addition of rapamycin (Crickard et al., 2016). To anchor away Spt5, 1mg/ml of rapamycin was added to 50 mL of S. cerevisiae culture at 25°C for 30 min. before 1% v/v formaldehyde was used to crosslink the cells. Cell harvest, lysis chromatin isolation and ChIP-exo library preparation was done as described above. Pol II ChIP was performed using the Pol II antibody (8WG16, Cat. # sc-56767).
Cell growth assays
yAB032 and corresponding parental strain (yAB001) along with Spt5 anchor away strain were grown in 200 mL YPD at 25°C in a shaking incubator until OD600 of cultures reached between 0.4-0.6. Cultures were then split into 4 flasks for further treatments. FRB tagged proteins (Spt4 and Spt5) were first depleted from the nucleus for 30 minutes at 25°C by addition of rapamycin (1mg/ml final concentration). OD600 were recorded for all samples (t = 0). Peroxide stress was then administered by adding hydrogen peroxide (0.3 mM final concentration). All cultures were further grown and OD600 were recorded every hour, for 6 hours in total. Appropriate controls were also included in the experiment to assess effects specific for rapamycin and peroxide treatment.
DNA sequencing and Bioinformatics
DNA sequencing was performed using the paired end mode on a NextSeq 500 or 550 to produce 2 × 40bp reads. Sequenced reads were aligned to the SacCer3 genome using bwa-mem (v0.7.9a) (Li, 2013). Aligned reads were filtered using Picard73 and samtools74 to remove PCR duplicates (i.e., where the 5′ coordinates-strand of Read-1 and Read-2 were identical to another read pair), and non-uniquely mapping reads. Analysis was performed on the GUI ScriptManager v.012, which is available for download at: https://github.com/CEGRcode/scriptmanager. Unless otherwise mentioned, data was normalized based on total tag count. Other normalization methods lead to the same conclusions. Heatmaps and composite plots were generated using Tag Pileup feature. For ChIP-exo analyses, 5′ ends of tags were shifted in the 3′ direction by 6 bp to reflect the point of crosslinking, and strand information was removed using the following setting in the ScriptManager v.012: Read 1, Combined strands, 6 bp tag shift, 1 bp bin size, sliding window 11 (TSS- or TES-aligned heatmaps) or 21 (transcript midpoint-aligned heatmaps). Untagged BY4741 was used as a negative control for each experiment. Except where indicated, biological replicates were used to validate the findings. For MNase ChIP-seq data the following settings were used: Read Midpoint; Combined strands, 0 bp tag shift, 1 bp bin size, sliding window 21. TSS and TES locations were from Xu et al. (2009). SAGAdom and TFIIDdom genes were defined based on Huisinga and Pugh (2004). The composite images were constructed in Prism 7. Sequenced nascent RNA seq reads were aligned using HISAT2 using the default parameters and Stringtie was used to create lists of gene transcripts and expression levels (FPKM) (Pertea et al., 2016).
QUANTIFICATION AND STATISTICAL ANALYSIS
Stalling Ratio (SR) calculation and significance testing
Stalling ratio (SR) was defined as the number of tags per base pair in a TSS-proximal region (−50 to +250 bp from the TSS) divided by the number of tags per base pair in the gene body (TSS+251 bp to TES+50 bp). A significant increase in SR upon oxidative stress was defined by the following criteria. SR was calculated per gene for three biological replicates at zero minutes and 6 minutes after oxidative stress. The average and standard error (n = 3) was calculated for each gene. A gene was determined to have a significant increase in stalling upon stress if the average stalling ratio at 6 minutes minus one standard error was greater than the average stalling ratio at time 0.
Normalized FPKM calculation and box-plot generation for tU-labeled nascent RNA
In order to normalize the RNA-seq FPKM values of the untreated and peroxide treated cells, the reads of the S. pombe spike-in were set to be equal, and the FPKM values were adjusted accordingly. Normalized FPKM values of all SAGA and TFIID dominated genes were used to generate the boxplot in Figure 2, displaying the 95th, 75th, 50th, 25th and 5th percentile.
Supplementary Material
Highlights.
Acute stress causes promoter-proximal Pol II stalling at most yeast genes
Pol II maintains an open bubble but stops transcribing
Stalling occurs at two locations: at promoters and at +2 nucleosomes
Stalling precedes stress-induced gene reprogramming
ACKNOWLEDGMENTS
We thank Dr. Joseph Reese for generously providing the Spt5 depletion cell line used in this study; Prashant Kuntala for GEO submission; Joshua D. Mairose, Thomas R. Blanda, and Ann V. Basting for generating datasets; and Daniela James for running the sequencer. This work was supported by NIH grants GM059055 and ES013768 to B.F.P.
Footnotes
DECLARATION OF INTERESTS
B.F.P. is an owner of and has a financial interest in Peconic, which uses the ChIP-exo technology (U.S. Patent 20100323361A1) implemented in this study and could potentially benefit from the outcomes of this research. All other authors declare no competing interests.
SUPPLEMENTAL INFORMATION
Supplemental Information can be found online at https://doi.org/10.1016/j.celrep.2020.108640.
REFERENCES
- Adelman K, and Lis JT (2012). Promoter-proximal pausing of RNA polymerase II: emerging roles in metazoans. Nat. Rev. Genet 13, 720–731. [DOI] [PMC free article] [PubMed] [Google Scholar]
- Akoulitchev S, Mäkelä TP, Weinberg RA, and Reinberg D (1995). Requirement for TFIIH kinase activity in transcription by RNA polymerase II. Nature 377, 557–560. [DOI] [PubMed] [Google Scholar]
- Allen TA, Von Kaenel S, Goodrich JA, and Kugel JF (2004). The SINE-encoded mouse B2 RNA represses mRNA transcription in response to heat shock. Nat. Struct. Mol. Biol 11, 816–821. [DOI] [PubMed] [Google Scholar]
- Baptista T, and Devys D (2018). Saccharomyces cerevisiae Metabolic Labeling with 4-thiouracil and the Quantification of Newly Synthesized mRNA As a Proxy for RNA Polymerase II Activity. J. Vis. Exp (140), 57982. [DOI] [PMC free article] [PubMed] [Google Scholar]
- Bataille AR, Jeronimo C, Jacques PE, Laramée L, Fortin ME, Forest A, Bergeron M, Hanes SD, and Robert F (2012).A universal RNA polymerase II CTD cycle is orchestrated by complex interplays between kinase, phosphatase, and isomerase enzymes along genes. Mol. Cell 45, 158–170. [DOI] [PubMed] [Google Scholar]
- Battaglia S, Lidschreiber M, Baejen C, Torkler P, Vos SM, and Cramer P (2017). RNA-dependent chromatin association of transcription elongation factors and Pol II CTD kinases. eLife 6, e25637. [DOI] [PMC free article] [PubMed] [Google Scholar]
- Blevins WR, Tavella T, Moro SG, Blasco-Moreno B, Closa-Mosquera A, Diez J, Carey LB, and Albà MM (2019). Extensive post-transcriptional buffering of gene expression in the response to severe oxidative stress in baker’s yeast. Sci. Rep 9, 11005. [DOI] [PMC free article] [PubMed] [Google Scholar]
- Bonnet J, Wang CY, Baptista T, Vincent SD, Hsiao WC, Stierle M, Kao CF, Tora L, and Devys D (2014). The SAGA coactivator complex acts on the whole transcribed genome and is required for RNA polymerase II transcription. Genes Dev. 28, 1999–2012. [DOI] [PMC free article] [PubMed] [Google Scholar]
- Booth GT, Wang IX, Cheung VG, and Lis JT (2016). Divergence of a conserved elongation factor and transcription regulation in budding and fission yeast. Genome Res. 26, 799–811. [DOI] [PMC free article] [PubMed] [Google Scholar]
- Buratowski S (2009). Progression through the RNA polymerase II CTD cycle. Mol. Cell 36, 541–546. [DOI] [PMC free article] [PubMed] [Google Scholar]
- Causton HC, Ren B, Koh SS, Harbison CT, Kanin E, Jennings EG, Lee TI, True HL, Lander ES, and Young RA (2001). Remodeling of yeast genome expression in response to environmental changes. Mol. Biol. Cell 12, 323–337. [DOI] [PMC free article] [PubMed] [Google Scholar]
- Chen FX, Smith ER, and Shilatifard A (2018). Born to run: control of transcription elongation by RNA polymerase II. Nat. Rev. Mol. Cell Biol 19, 464–478. [DOI] [PubMed] [Google Scholar]
- Collart MA, and Oliviero S (1993). Preparation of yeast RNA. Curr. Protoc. Mol. Biol 23, 13.12.1–13.12.5. [DOI] [PubMed] [Google Scholar]
- Core L, and Adelman K (2019). Promoter-proximal pausing of RNA polymerase II: a nexus of gene regulation. Genes Dev. 33, 960–982. [DOI] [PMC free article] [PubMed] [Google Scholar]
- Crickard JB, Fu J, and Reese JC (2016). Biochemical Analysis of Yeast Suppressor of Ty 4/5 (Spt4/5) Reveals the Importance of Nucleic Acid Interactions in the Prevention of RNA Polymerase II Arrest. J. Biol. Chem 291, 9853–9870. [DOI] [PMC free article] [PubMed] [Google Scholar]
- Danko CG, Hah N, Luo X, Martins AL, Core L, Lis JT, Siepel A, and Kraus WL (2013). Signaling pathways differentially affect RNA polymerase II initiation, pausing, and elongation rate in cells. Mol. Cell 50, 212–222. [DOI] [PMC free article] [PubMed] [Google Scholar]
- Darzacq X, Shav-Tal Y, de Turris V, Brody Y, Shenoy SM, Phair RD, and Singer RH (2007). In vivo dynamics of RNA polymerase II transcription. Nat. Struct. Mol. Biol 14, 796–806. [DOI] [PMC free article] [PubMed] [Google Scholar]
- de Nadal E, Ammerer G, and Posas F (2011). Controlling gene expression in response to stress. Nat. Rev. Genet 12, 833–845. [DOI] [PubMed] [Google Scholar]
- Delaunay A, Isnard AD, and Toledano MB (2000). H2O2 sensing through oxidation of the Yap1 transcription factor. EMBO J. 19, 5157–5166. [DOI] [PMC free article] [PubMed] [Google Scholar]
- Donczew R, Warfield L, Pacheco D, Erijman A, and Hahn S (2020). Two roles for the yeast transcription coactivator SAGA and a set of genes redundantly regulated by TFIID and SAGA. eLife 9, e50109. [DOI] [PMC free article] [PubMed] [Google Scholar]
- Dronamraju R, and Strahl BD (2014). A feed forward circuit comprising Spt6, Ctk1 and PAF regulates Pol II CTD phosphorylation and transcription elongation. Nucleic Acids Res. 42, 870–881. [DOI] [PMC free article] [PubMed] [Google Scholar]
- Eick D, and Geyer M (2013). The RNA polymerase II carboxy-terminal domain (CTD) code. Chem. Rev 113, 8456–8490. [DOI] [PubMed] [Google Scholar]
- Espinoza CA, Allen TA, Hieb AR, Kugel JF, and Goodrich JA (2004). B2 RNA binds directly to RNA polymerase II to repress transcript synthesis. Nat. Struct. Mol. Biol 11, 822–829. [DOI] [PubMed] [Google Scholar]
- Gasch AP, Spellman PT, Kao CM, Carmel-Harel O, Eisen MB, Storz G, Botstein D, and Brown PO (2000). Genomic expression programs in the response of yeast cells to environmental changes. Mol. Biol. Cell 11, 4241–4257. [DOI] [PMC free article] [PubMed] [Google Scholar]
- Gasch AP, Yu FB, Hose J, Escalante LE, Place M, Bacher R, Kanbar J, Ciobanu D, Sandor L, Grigoriev IV, et al. (2017). Single-cell RNA sequencing reveals intrinsic and extrinsic regulatory heterogeneity in yeast responding to stress. PLoS Biol. 15, e2004050. [DOI] [PMC free article] [PubMed] [Google Scholar]
- Giannakakis A, Zhang J, Jenjaroenpun P, Nama S, Zainolabidin N, Aau MY, Yarmishyn AA, Vaz C, Ivshina AV, Grinchuk OV, et al. (2015). Contrasting expression patterns of coding and noncoding parts of the human genome upon oxidative stress. Sci. Rep 5, 9737. [DOI] [PMC free article] [PubMed] [Google Scholar]
- Giardina C, and Lis JT (1993). DNA melting on yeast RNA polymerase II promoters. Science 261, 759–762. [DOI] [PubMed] [Google Scholar]
- Gilmour DS, and Fan R (2009). Detecting transcriptionally engaged RNA polymerase in eukaryotic cells with permanganate genomic footprinting. Methods 48, 368–374. [DOI] [PubMed] [Google Scholar]
- Guo J, and Price DH (2013). RNA polymerase II transcription elongation control. Chem. Rev 113, 8583–8603. [DOI] [PMC free article] [PubMed] [Google Scholar]
- Harlen KM, and Churchman LS (2017). The code and beyond: transcription regulation by the RNA polymerase II carboxy-terminal domain. Nat. Rev. Mol. Cell Biol 18, 263–273. [DOI] [PubMed] [Google Scholar]
- Henriques T, Scruggs BS, Inouye MO, Muse GW, Williams LH, Burkholder AB, Lavender CA, Fargo DC, and Adelman K (2018). Widespread transcriptional pausing and elongation control at enhancers. Genes Dev. 32, 26–41. [DOI] [PMC free article] [PubMed] [Google Scholar]
- Hsin JP, and Manley JL (2012). The RNA polymerase II CTD coordinates transcription and RNA processing. Genes Dev. 26, 2119–2137. [DOI] [PMC free article] [PubMed] [Google Scholar]
- Huisinga KL, and Pugh BF (2004). A genome-wide housekeeping role for TFIID and a highly regulated stress-related role for SAGA in Saccharomyces cerevisiae. Mol. Cell 13, 573–585. [DOI] [PubMed] [Google Scholar]
- Jeronimo C, Bataille AR, and Robert F (2013). The writers, readers, and functions of the RNA polymerase II C-terminal domain code. Chem. Rev 113, 8491–8522. [DOI] [PubMed] [Google Scholar]
- Jonkers I, and Lis JT (2015). Getting up to speed with transcription elongation by RNA polymerase II. Nat. Rev. Mol. Cell Biol 16, 167–177. [DOI] [PMC free article] [PubMed] [Google Scholar]
- Keogh MC, Podolny V, and Buratowski S (2003). Bur1 kinase is required for efficient transcription elongation by RNA polymerase II. Mol. Cell. Biol 23, 7005–7018. [DOI] [PMC free article] [PubMed] [Google Scholar]
- Komarnitsky P, Cho EJ, and Buratowski S (2000). Different phosphorylated forms of RNA polymerase II and associated mRNA processing factors during transcription. Genes Dev. 14, 2452–2460. [DOI] [PMC free article] [PubMed] [Google Scholar]
- Krebs AR, Imanci D, Hoerner L, Gaidatzis D, Burger L, and Schübeler D (2017). Genome-wide Single-Molecule Footprinting Reveals High RNA Polymerase II Turnover at Paused Promoters. Mol. Cell 67, 411–422.e4. [DOI] [PMC free article] [PubMed] [Google Scholar]
- Kuehner JN, and Brow DA (2006). Quantitative analysis of in vivo initiator selection by yeast RNA polymerase II supports a scanning model. J. Biol. Chem 281, 14119–14128. [DOI] [PubMed] [Google Scholar]
- Kuge S, Jones N, and Nomoto A (1997). Regulation of yAP-1 nuclear localization in response to oxidative stress. EMBO J. 16, 1710–1720. [DOI] [PMC free article] [PubMed] [Google Scholar]
- Kugel JF, and Goodrich JA (1998). Promoter escape limits the rate of RNA polymerase II transcription and is enhanced by TFIIE, TFIIH, and ATP on negatively supercoiled DNA. Proc. Natl. Acad. Sci. USA 95, 9232–9237. [DOI] [PMC free article] [PubMed] [Google Scholar]
- Lagha M, Bothma JP, Esposito E, Ng S, Stefanik L, Tsui C, Johnston J, Chen K, Gilmour DS, Zeitlinger J, and Levine MS (2013). Paused Pol II coordinates tissue morphogenesis in the Drosophila embryo. Cell 153, 976–987. [DOI] [PMC free article] [PubMed] [Google Scholar]
- Lai WK, and Pugh BF (2017). Genome-wide uniformity of human ‘open’ pre-initiation complexes. Genome Res. 27, 15–26. [DOI] [PMC free article] [PubMed] [Google Scholar]
- Lee C, Li X, Hechmer A, Eisen M, Biggin MD, Venters BJ, Jiang C, Li J, Pugh BF, and Gilmour DS (2008). NELF and GAGA factor are linked to promoter-proximal pausing at many genes in Drosophila. Mol. Cell. Biol 28, 3290–3300. [DOI] [PMC free article] [PubMed] [Google Scholar]
- Li H (2013). Aligning sequence reads, clone sequences and assembly contigs with BWA-MEM, Vol 1303 arXiv, arXiv:1303.3997v1 [q-bio.GN] https://arxiv.org/abs/1303.3997. [Google Scholar]
- Lis JT, Mason P, Peng J, Price DH, and Werner J (2000). P-TEFb kinase recruitment and function at heat shock loci. Genes Dev. 14, 792–803. [PMC free article] [PubMed] [Google Scholar]
- Liu Y, Warfield L, Zhang C, Luo J, Allen J, Lang WH, Ranish J, Shokat KM, and Hahn S (2009). Phosphorylation of the transcription elongation factor Spt5 by yeast Bur1 kinase stimulates recruitment of the PAF complex. Mol. Cell. Biol 29, 4852–4863. [DOI] [PMC free article] [PubMed] [Google Scholar]
- Marinho HS, Real C, Cyrne L, Soares H, and Antunes F (2014). Hydrogen peroxide sensing, signaling and regulation of transcription factors. Redox Biol. 2, 535–562. [DOI] [PMC free article] [PubMed] [Google Scholar]
- Maxwell CS, Kruesi WS, Core LJ, Kurhanewicz N, Waters CT, Lewarch CL, Antoshechkin I, Lis JT, Meyer BJ, and Baugh LR (2014). Pol II docking and pausing at growth and stress genes in C. elegans. Cell Rep. 6, 455–466. [DOI] [PMC free article] [PubMed] [Google Scholar]
- Morano KA, Grant CM, and Moye-Rowley WS (2012). The response to heat shock and oxidative stress in Saccharomyces cerevisiae. Genetics 190, 1157–1195. [DOI] [PMC free article] [PubMed] [Google Scholar]
- Murakami K, Mattei PJ, Davis RE, Jin H, Kaplan CD, and Kornberg RD (2015). Uncoupling Promoter Opening from Start-Site Scanning. Mol. Cell 59, 133–138. [DOI] [PMC free article] [PubMed] [Google Scholar]
- Nilson KA, Lawson CK, Mullen NJ, Ball CB, Spector BM, Meier JL, and Price DH (2017). Oxidative stress rapidly stabilizes promoter-proximal paused Pol II across the human genome. Nucleic Acids Res. 45, 11088–11105. [DOI] [PMC free article] [PubMed] [Google Scholar]
- Pertea M, Kim D, Pertea GM, Leek JT, and Salzberg SL (2016). Transcript-level expression analysis of RNA-seq experiments with HISAT, StringTie and Ballgown. Nat. Protoc 11, 1650–1667. [DOI] [PMC free article] [PubMed] [Google Scholar]
- Petrenko N, Jin Y, Dong L, Wong KH, and Struhl K (2019). Requirements for RNA polymerase II preinitiation complex formation in vivo. eLife 8, e43654. [DOI] [PMC free article] [PubMed] [Google Scholar]
- Price DH (2018). Transient pausing by RNA polymerase II. Proc. Natl. Acad. Sci. USA 115, 4810–812. [DOI] [PMC free article] [PubMed] [Google Scholar]
- Rahl PB, Lin CY, Seila AC, Flynn RA, McCuine S, Burge CB, Sharp PA, and Young RA (2010). c-Myc regulates transcriptional pause release. Cell 141, 432–445. [DOI] [PMC free article] [PubMed] [Google Scholar]
- Reja R, Vinayachandran V, Ghosh S, and Pugh BF (2015). Molecular mechanisms of ribosomal protein gene coregulation. Genes Dev. 29, 1942–1954. [DOI] [PMC free article] [PubMed] [Google Scholar]
- Rhee HS, and Pugh BF (2011). Comprehensive genome-wide protein-DNA interactions detected at single-nucleotide resolution. Cell 147, 1408–1419. [DOI] [PMC free article] [PubMed] [Google Scholar]
- Rhee HS, and Pugh BF (2012). Genome-wide structureand organization of eukaryotic pre-initiation complexes. Nature 483, 295–301. [DOI] [PMC free article] [PubMed] [Google Scholar]
- Rodríguez-Molina JB, Tseng SC, Simonett SP, Taunton J, and Ansari AZ (2016). Engineered Covalent Inactivation of TFIIH-Kinase Reveals an Elongation Checkpoint and Results in Widespread mRNA Stabilization. Mol. Cell 63, 433–44. [DOI] [PMC free article] [PubMed] [Google Scholar]
- Rossi MJ, Lai WKM, and Pugh BF (2018). Simplified ChIP-exo assays. Nat. Commun 9, 2842. [DOI] [PMC free article] [PubMed] [Google Scholar]
- Shetty A, Kallgren SP, Demel C, Maier KC, Spatt D, Alver BH, Cramer P, Park PJ, and Winston F (2017). Spt5 Plays Vital Roles in the Control of Sense and Antisense Transcription Elongation. Mol. Cell 66, 77–88.e5. [DOI] [PMC free article] [PubMed] [Google Scholar]
- Shilatifard A (2012). The COMPASS family of histone H3K4 methylases: mechanisms of regulation in development and disease pathogenesis. Annu. Rev. Biochem 81, 65–95. [DOI] [PMC free article] [PubMed] [Google Scholar]
- Steurer B, Janssens RC, Geverts B, Geijer ME, Wienholz F, Theil AF, Chang J, Dealy S, Pothof J, van Cappellen WA, et al. (2018). Live-cell analysis of endogenous GFP-RPB1 uncovers rapid turnover of initiating and promoter-paused RNA Polymerase II. Proc. Natl. Acad. Sci. USA 115, E4368–E4376. [DOI] [PMC free article] [PubMed] [Google Scholar]
- Sun M, Schwalb B, Schulz D, Pirkl N, Etzold S, Larivière L, Maier KC, Seizl M, Tresch A, and Cramer P (2012). Comparative dynamic transcriptome analysis (cDTA) reveals mutual feedback between mRNA synthesis and degradation. Genome Res. 22, 1350–1359. [DOI] [PMC free article] [PubMed] [Google Scholar]
- Sun M, Schwalb B, Pirkl N, Maier KC, Schenk A, Failmezger H, Tresch A, and Cramer P (2013). Global analysis of eukaryotic mRNA degradation reveals Xrn1-dependent buffering of transcript levels. Mol. Cell 52, 52–62. [DOI] [PubMed] [Google Scholar]
- Timmers HTM, and Tora L (2018). Transcript Buffering: A Balancing Act between mRNA Synthesis and mRNA Degradation. Mol. Cell 72, 10–17. [DOI] [PubMed] [Google Scholar]
- Tomko EJ, Fishburn J, Hahn S, and Galburt EA (2017). TFIIH generates a six-base-pair open complex during RNAP II transcription initiation and start-site scanning. Nat. Struct. Mol. Biol 24, 1139–1145. [DOI] [PMC free article] [PubMed] [Google Scholar]
- Veloso A, Kirkconnell KS, Magnuson B, Biewen B, Paulsen MT, Wilson TE, and Ljungman M (2014). Rate of elongation by RNA polymerase II is associated with specific gene features and epigenetic modifications. Genome Res. 24, 896–905. [DOI] [PMC free article] [PubMed] [Google Scholar]
- Vinayachandran V, Reja R, Rossi MJ, Park B, Rieber L, Mittal C, Mahony S, and Pugh BF (2018). Widespread and precise reprogramming of yeast protein-genome interactions in response to heat shock. Genome Res. 28, 357–366. [DOI] [PMC free article] [PubMed] [Google Scholar]
- Warfield L, Ramachandran S, Baptista T, Devys D, Tora L, and Hahn S (2017). Transcription of Nearly All Yeast RNA Polymerase II-Transcribed Genes Is Dependent on Transcription Factor TFIID. Mol. Cell 68, 118–129.e5. [DOI] [PMC free article] [PubMed] [Google Scholar]
- Warner JR (1999). The economics of ribosome biosynthesis in yeast. Trends Biochem. Sci 24, 437–40. [DOI] [PubMed] [Google Scholar]
- Wong KH, Jin Y, and Struhl K (2014). TFIIH phosphorylation of the Pol II CTD stimulates mediator dissociation from the preinitiation complex and promoter escape. Mol. Cell 54, 601–612. [DOI] [PMC free article] [PubMed] [Google Scholar]
- Xu Z, Wei W, Gagneur J, Perocchi F, Clauder-Münster S, Camblong J, Guffanti E, Stutz F, Huber W, and Steinmetz LM (2009). Bidirectional promoters generate pervasive transcription in yeast. Nature 457, 1033–1037. [DOI] [PMC free article] [PubMed] [Google Scholar]
- Yamamoto A, Mizukami Y, and Sakurai H (2005). Identification of a novel class of target genes and a novel type of binding sequence of heat shock transcription factor in Saccharomyces cerevisiae. J. Biol. Chem 280, 11911–11919. [DOI] [PubMed] [Google Scholar]
- Yao S, and Prelich G (2002). Activation of the Bur1-Bur2 cyclin-dependent kinase complex by Cak1. Mol. Cell. Biol 22, 6750–6758. [DOI] [PMC free article] [PubMed] [Google Scholar]
- Zeitlinger J, Stark A, Kellis M, Hong JW, Nechaev S, Adelman K, Levine M, and Young RA (2007). RNA polymerase stalling at developmental control genes in the Drosophila melanogaster embryo. Nat. Genet 39, 1512–1516. [DOI] [PMC free article] [PubMed] [Google Scholar]
- Zhang L, Ma H, and Pugh BF (2011). Stable and dynamic nucleosome states during a meiotic developmental process. Genome Res. 21, 875–884. [DOI] [PMC free article] [PubMed] [Google Scholar]
- Zhou K, Kuo WH, Fillingham J, and Greenblatt JF (2009). Control of transcriptional elongation and cotranscriptional histone modification by the yeast BUR kinase substrate Spt5. Proc. Natl. Acad. Sci. USA 106, 6956–6961. [DOI] [PMC free article] [PubMed] [Google Scholar]
- Zhou Q, Li T, and Price DH (2012). RNA polymerase II elongation control. Annu. Rev. Biochem 81, 119–143. [DOI] [PMC free article] [PubMed] [Google Scholar]
Associated Data
This section collects any data citations, data availability statements, or supplementary materials included in this article.
Supplementary Materials
Data Availability Statement
All primary sequencing data and processed data described in this manuscript have been deposited in the NCBI Gene Expression Omnibus under the accession numbers GEO: GSE151348 and GSE147927. Coordinate files used in the analyses can be found at https://github.com/CEGRcode/2020-Badjatia_peroxide_stress. GUI ScriptManager v.012 used for analysis of all data is available for download at: https://github.com/CEGRcode/scriptmanager.