Abstract
How organisms are able to maintain robust homeostasis has in recent years received increased attention by the use of combined control engineering and kinetic concepts, which led to the discovery of robust controller motifs. While these motifs employ kinetic conditions showing integral feedback and homeostasis for step-wise perturbations, the motifs’ performance differ significantly when exposing them to time dependent perturbations. One type of controller motifs which are able to handle exponentially and even hyperbolically growing perturbations are based on derepression. In these controllers the compensatory reaction, which neutralizes the perturbation, is derepressed, i.e. its reaction rate is increased by the decrease of an inhibitor acting on the compensatory flux. While controllers in this category can deal well with different time-dependent perturbations they have the disadvantage that they break down once the concentration of the regulatory inhibitor becomes too low and the compensatory flux has gained its maximum value. We wondered whether it would be possible to bypass this restriction, while still keeping the advantages of derepression kinetics. In this paper we show how the inclusion of multisite inhibition and the presence of positive feedback loops lead to an amplified controller which is still based on derepression kinetics but without showing the breakdown due to low inhibitor concentrations. By searching for the amplified feedback motif in natural systems, we found it as a part of the plant circadian clock where it is highly interlocked with other feedback loops.
Introduction
The concept of homeostasis [1], defined by Cannon in 1929 [2], is fundamental to our understanding how organisms, including our body, work [3]. According to Cannon homeostasis refers to the automatic, self-regulating processes that keep steady states within certain, but narrow limits, despite internal or environmental perturbations [1–3]. Although (negative) feedback is recognized as a central part in homeostatic regulation [1, 4, 5], it is not the only dynamic component. The ‘homeostatic response’ may also include features such as anticipatory mechanisms [6], feedforward loops [7], or positive feedbacks [3, 8, 9].
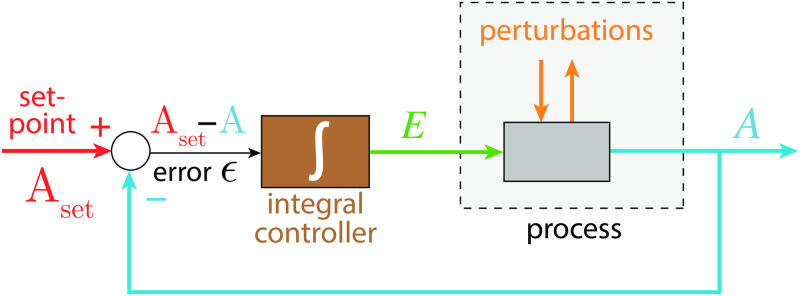
In control engineering robust regulation of a variable A with set-point Aset can be achieved by so-called integral control [10], which is able to (precisely) correct for step-wise perturbations acting on a controlled variable A [10] (Fig 1).
Fig 1. Scheme of a negative feedback with integral control regulating variable A.
The difference between the set-point Aset and the actual value of A (the error ϵ) is integrated over time and fed back into the process which generates A. This procedure ensures that A will precisely reach Aset for step-wise perturbations. Colors correspond to molecular reactions shown later.
While in engineering integral control began to be applied in the beginning of the twentieth century with the power steering of ships [11], its usage in physiology/biology first appeared once cybernetics [12–14] made the analogies between engineered and biological systems more explicit. Physiological models during this first era showed the dynamical processes, loops, integrated errors, etc. mostly in terms of flow diagrams, transfer functions, as engineered systems are described [15, 16]. By the turn of the century, when the molecular biology behind physiological processes became better understood researchers began to describe the control process in terms of their reaction kinetics, such as in integral rein control [17] (focussing on that physiological controllers come in antagonistic pairs; see also the later analogous notion of inflow/outflow controllers [18]), in the integral feedback formulation of robust bacterial chemotaxis [19, 20], or in the integral control approach of blood calcium homeostasis [21].
It became evident that certain kinetic conditions within a negative feedback loop, such as zero-order kinetics [18–20, 22–24], autocatalysis [25–27], or second-order (bimolecular/antithetic) kinetics [28, 29] can lead to robust adaptation [30, 31] by integral control where an intrinsic integration of the error between set-point and the actual value of the controlled variable is automatically performed. When these feedback motifs were investigated towards time-dependent perturbations, it turned out that controller performances can differ significantly, either due to the structure of the feedback loop or due to the kinetics of how the integral controller is implemented [32, 33].
Feedback structures which have been found to perform well when exposed to different time-dependent perturbations are based on derepression kinetics [32].
Fig 2 shows one of the motifs (motif 2) with derepression kinetics acting as an inflow controller [18]. Reactions are color-coded and relate to the scheme in Fig 1. This motif, unlike those not using derepression, is able to adapt perfectly to exponentially increasing perturbations. Motif 2 can even balance hyperbolically increasing disturbances with doubling times which decrease exponentially [32]. In Fig 2 k1 represents a (time-dependent or constant) perturbation and k2 is the maximum fully derepressed compensatory flux. E is subject to an enzymatic zero-order degradation described by the rate parameters k3 (Vmax) and KM, while k4 represents a zero-order synthesis rate with respect to E. KI is an inhibition constant.
Fig 2. Inflow controller based on derepression kinetics (motif 2, Ref. [18]).
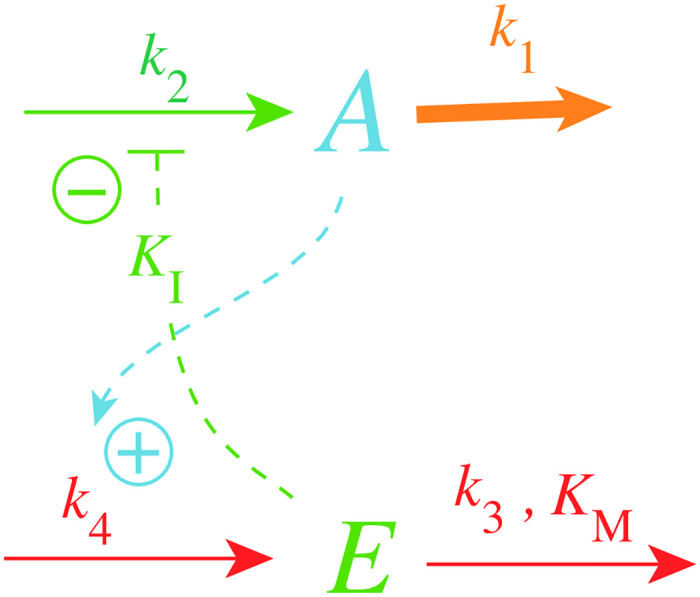
Red color: reactions determining the set-point; orange: perturbation; blue: A-signaling; green: E-signaling.
The rate equations of the motif 2 controller are:
| (1) |
| (2) |
where k2/(1 + (E/KI)) describes the compensatory flux, which opposes the perturbing flux k1 A. For step-wise changes in k1 and for low KM values (KM ≪ E), E/(KM + E)≈1 and the steady state value in A is described by the set-point (setting and solving for Ass)
| (3) |
which will also be defended against time-dependent (increasing) k1 values (see later).
Metaphorically speaking, the activation of the compensatory flux by derepression is somewhat like the static takeoff of an airliner, when the plane stands still at the beginning of the runway, but having engines in full thrust with the breaks on. When the brakes are released the plane starts to accelerate and rapidly reaches takeoff speed.
The controller in Fig 2 reaches its maximum compensatory flux when E ≤ KI; any further increase in the perturbation k1 cannot be opposed and will lead to the controller’s breakdown. This is illustrated in Fig 3 for different KI values with k1 increasing exponentially. The k1 value at breakdown, , can be estimated by setting E = KI and solving for k1 from Eq 1 with , i.e.,
| (4) |
Fig 3. Behavior of the motif 2 zero-order controller (Fig 2) upon an exponential increase of k1 and the influence of KI.
Left panel shows k1 as a function of time. Phase 1: k1 = k1,p1 = 2.0 and constant. The controller is at steady-state at its set-point Aset = 5.0. Phase 2: k1 starts to increase exponentially at time tp1 = 10.0 according to the inset Equation. Right panel shows the controller’s A and E values for different KI’s, where A1 is A when KI = 10.0, A2 is A when KI = 1.0, A3 is A when KI = 0.1, and A4 is A when KI = 1 × 10⁻³. The other rate constants are: k2 (max compensatory rate) = 1 × 10⁵, k3 = 5 × 10³, k4 = 1 × 10³, KM = 1 × 10⁻⁶. Initial concentrations: A1-A4 = 5.0, E1 = 1 × 10⁵, E2 = 1 × 10⁴, E3 = 1 × 10³, and E4 = 10.0. Controller starts to break down when k1 is reaching 1 × 10⁴ indicated by the red arrows in the left panel.
The curves Ai and Ei in the right panel show the different A and E values when KI takes the values 10.0 (A1), 1.0 (A2), 0.1 (A3), and 1 × 10⁻³ (A4). While the controller’s “lifetime” (the time span until the controller breaks down) is practically not affected by the different KI values, the controller’s “aggressiveness”, i.e. its ability to rapidly respond to perturbations and to keep A at Aset, is improved with decreasing KI values.
Goal of this work
While motif 2 and related controllers based on derepression can keep the controlled variable A at its set-point even for rapidly increasing time-dependent perturbations [32, 33] (Fig 3), they suffer from breakdown once the controller variable E becomes close to or lower than KI. We wondered whether it would be possible to circumvent this restriction to a controller where the control species’ concentration increases with increasing perturbation strength, while still keeping the controller properties based on derepression. Using the motif 2 controller as an example, we show that implementation of a positive feedback loop based on autocatalysis combined with multisite inhibition kinetics can avoid controller breakdown by low E values, but still shows the properties of a controller based on derepression.
Materials and methods
Computations were carried out by using the Fortran subroutine LSODE [34]. Plots were generated with gnuplot (www.gnuplot.info) and slightly edited with Adobe Illustrator (adobe.com). To make notations simpler, concentrations of compounds are denoted by compound names without square brackets. Time derivatives are generally indicated by the ‘dot’ notation. Concentrations and rate parameter values are given in arbitrary units (au). In the Supporting Information a set of MATLAB (mathworks.com) scripts are provided for illustration in comparison with corresponding Fortran calculations (S1 Matlab).
Results and discussion
Effect of multisite inhibition on controller performance
In this section we investigate the effect of multisite inhibition. In mechanistic terms, we consider an enzyme or transporter, which is responsible for the compensatory flux [33]. In multisite inhibition E can bind to the enzyme or transporter at multiple sites with different binding constants KI. To make things more straightforward, we assume that one, two, or four molecules of E can bind to the enzyme/transporter, but always with the same binding constant KI. In this case, Eq 1 is replaced by (see for example Ref [35])
| (5) |
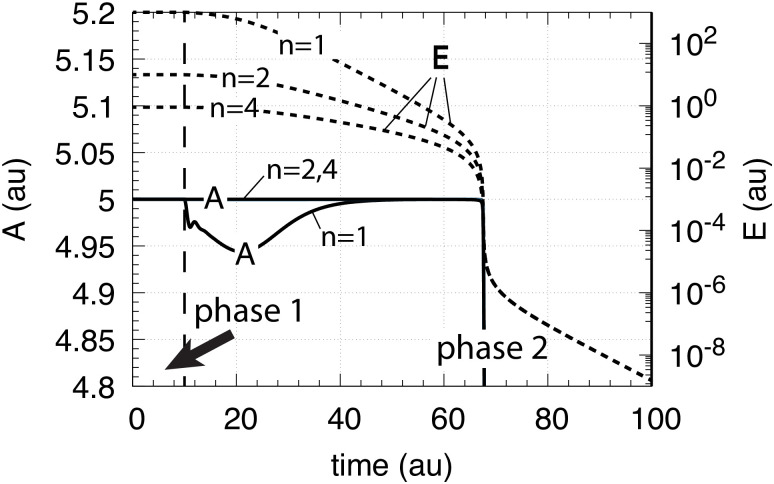
where n is the number of inhibiting E molecules (n = 1, 2, or 4). Taking Fig 3 with KI = 0.1 as a starting point, Fig 4 shows the results when n is changed from 1 to 2 and to 4.
Fig 4. Behavior of the motif 2 zero-order controller (Fig 2) upon an exponential increase of k1 (left panel Fig 3 and the influence of multisite inhibition (Eq 5)).
Phase 1: the controller is at its set-point/steady state with constant k1 = 2.0. Phase 2: Response of the controller with the different n values upon the exponential increase of k1. Rate constants are: KI = 0.1, k2(max compensatory rate) = 1 × 10⁵, k3 = 5 × 10³, k4 = 1 × 10³, KM = 1 × 10⁻⁶. Initial concentrations: A = 5.0 (for all n), E (n = 2) = 9.9, E (n = 4) = 0.9.
From Fig 4 it is clearly seen that multisite inhibition improves the controller’s performance, i.e., makes the controller more aggressive by showing a more rapid response and by keeping A closer to the controller’s set-point. However, despite the better responsiveness of the controller when using multisite inhibition, the “lifetime” of the controller is not improved, i.e., the breakdown occurs at the same time/ value as in Fig 3.
Increasing controller lifetime by increasing the maximum compensatory flux
Eq 4 indicates that increasing the maximum compensatory flux k2 will increase and thereby increase the lifetime of the controller (upon increasing values of k1). To automate this we have added a new variable C, shown in Fig 5, which is activated by derepression from E, but with the effect to increase k2.
Fig 5. Increasing controller lifetime by an E-dependent increase of the maximum compensatory flux k2.
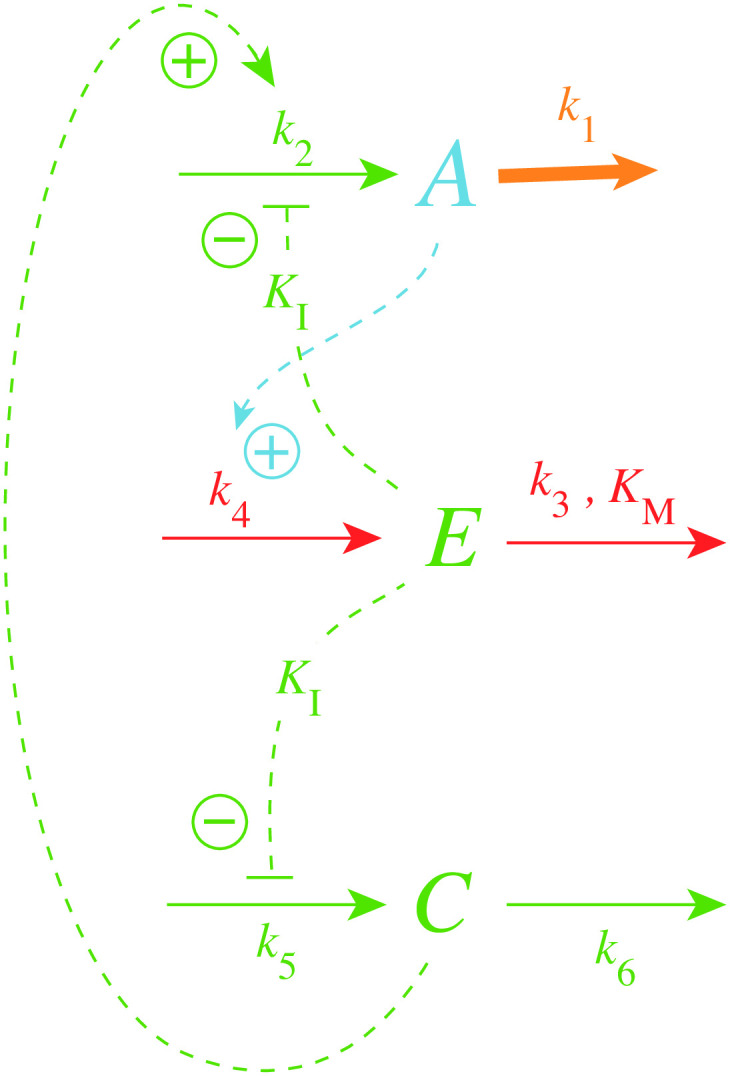
For the sake of simplicity the inhibition constant of the derepression of C by E is assumed to be the same (KI) as for the E-induced derepression of the compensatory flux. The rate equations for this controller are
| (6) |
| (7) |
Note that the rate equation for E remains unaltered. We also keep the multisite inhibition of the compensatory flux by E, but consider only a single E-binding site for the inhibition of the zero-order generation (k5) of C. Fig 6 shows the lifetime of controllers with n = 4 and with different k5 and k6 values when k1 increases exponentially as indicated in the left panel of Fig 3. As a reference, the blue solid and dashed lines show respectively the A3 and E3 values from the results of Fig 4 with n = 4, i.e., in the absence of C. For high k5/k6 ratios the lifetime of the controller is clearly increased (see traces A1, E1 and A2, E2), while for a ratio of one (k5 = k6 = 0.1, traces A4, E4) the lifetime of the controller is slightly reduced.
Fig 6. Activation of the compensatory flux for reaction scheme of Fig 5 and corresponding Eqs 6, 2 and 7 with n = 4.
Left panel: Concentrations of A and E as a function of time with different k5/k6 rate constants. Blue curves A3 and E3 correspond to the calculations without C (Fig 4 with n = 4). Right panel: Concentrations of C with different k5/k6 rate constants as a function of time. Phase 1: the controller is at steady state at its set-point Aset = 5.0 at constant k1 = 2.0. Phase 2: k1 increases exponentially according to the inset in the left panel of Fig 3. k5 and k6 values and initial concentrations for the different Ai, Ei, Ci curves: i = 1, k5 = 10.0, k6 = 0.01, A0 = 5.0, E0 = 2.412, C0 = 39.81; i = 2, k5 = 1.0, k6 = 0.1, A0 = 5.0, E0 = 0.9, C0 = 1.0; i = 3, no C (Fig 4 with n = 4); i = 4, k5 = k6 = 0.1, A0 = 5.0, E0 = 0.531, C0 = 0.158. Other rate constant values: k2 = 1 × 10⁵, k3 = 5 × 10³, k4 = 1 × 10³, KM = 1 × 10⁻⁶, KI = 0.1.
Opposing E decrease by positive feedback
While the inclusion of C increases the compensatory flux k2 C/(1 + (E/KI)n) and leads to an improvement in the controller’s lifetime, the controller still suffers from the general limitation that once E is driven down to values approaching KI, i.e., the controller breaks down when (setting E = KI)
| (8) |
(Fig 6). We found, that this trend can be circumvented by including a positive feedback in the generation of C without loosing the dynamic properties of the motif 2 controller. The positive feedback in C can be generated by first-order or second-order autocatalysis.
Fig 7 shows the scheme for both first-order and second-order autocatalysis.
Fig 7. Inclusion of autocatalysis in the generation of C.
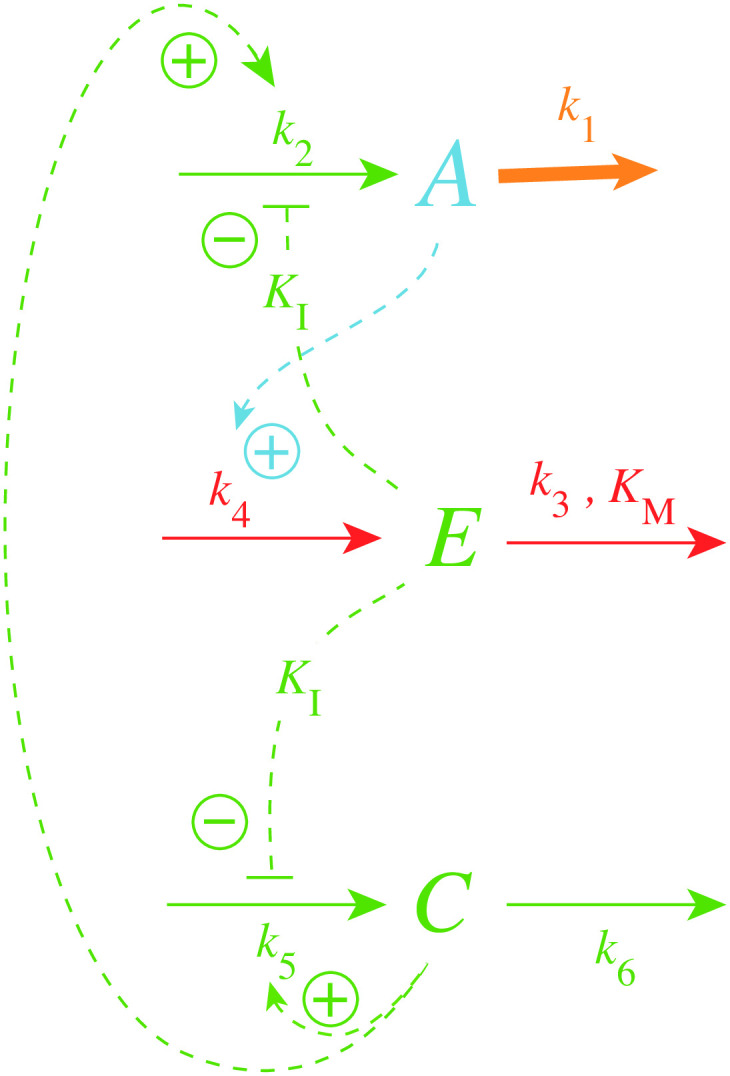
In case of first-order autocatalysis Eq 7 is changed to
| (9) |
while for the second-order case both the synthesis and degradation terms are second-order with respect to C
| (10) |
Note that for step-wise changes in k1 E becomes homeostatic controlled in addition to A, because in Eqs 9 or 10 implies that
| (11) |
independent of the perturbation k1.
Comparing the influence of first-order and second-order autocatalysis in C on controller performance
We have tested the influence of the first-order and second-order autocatalytic terms on the controller performance for n = 4. Considered were step-wise changes in k1, together with linear, exponential, and hyperbolic increases of k1. For all these perturbation types the controllers with both first-order and second-order autocatalysis show robust homeostasis and defend their set-points Aset = k3/k4 successfully. It is interesting to note that E no longer decreases, but approaches a steady state during the time-dependent increase of k1! We show here the results for exponentially and hyperbolically increasing k1 values. The controller’s behavior for step-wise and linear changes are described in S1 Text.
First-order autocatalysis in C
The controller is described by Eqs 2, 6 and 9. The perturbation k1 increases exponentially as described in the left panel of Fig 3.
Fig 8, left panel, shows that C follows the exponential increase in k1 closely, while the right panel shows that E goes into a steady state with A kept at its set-point Aset = k3/k4 = 5.0. The steady state value in E can be calculated from Eq 9 by noting that this equation can be written as
| (12) |
Inserting into Eq 12 the value of d ln C/dt (which is equal to and using L’Hôpital’s rule) together with the values of the other rate constants and solving for E, gives
| (13) |
in agreement with the numerical calculation.
Fig 8. Controller performance with first-order autocatalysis in C (Eq 9) and exponential increase of k1.
Phase 1: the controller is at steady state at its set-point Aset = 5.0 with constant k1 = 2.0. Initial concentrations: A0 = 5.0, E0 = 0.9, C0 = 1.0. Phase 2: k1 increases exponentially (left panel of Fig 3), k2 = 1 × 10⁵, k3 = 5 × 10², k4 = 1 × 10², k5 = 10.0, and k6 = 1.0. KM = 1 × 10⁻⁶, KI = 0.1, n = 4 (Eq 6). Left panel: k1 and C as a function of time; right panel: A and E as a function of time.
One of the characteristic properties of the motif 2 derepression controller is its capability to tackle rapidly increasing perturbations, like hyperbolic growth [32]. While exponential growth in k1 has a constant doubling time the doubling time in hyperbolic growth decreases exponentially and k1 will (formally) reach infinity at a certain time point. We wondered whether the controller based on rate Eqs 2, 6 and 9 would still show this property.
In Eq 14 k1 increases hyperbolically according to
| (14) |
where k1,p1 is the constant value of k1 during phase 1 (k1 = 2.0 as in the previous calculations), while tp1 is the duration of phase 1 (here 1 time unit). When time t reaches 21.25 (the infinity limit) the value of k1 goes formally to infinity. Fig 9 shows the behavior of the controller close to the infinity limit. In the calculation t and k1 reach 21.249997 and 1.4 × 10⁷, respectively. During the last 0.25 time units k1 increases by approximately 5-orders of magnitude. Despite this rapid increase in k1 the controller is able to maintain homeostasis, but finally breaks down before the infinity limit is reached.
Fig 9. Controller performance with first-order autocatalysis in C (Eq 9) and hyperbolic increase of k1.
Phase 1 (not shown): the controller is at steady state at its set-point Aset = 5.0 with constant k1 = 2.0. Phase 1 lasts 1 time unit. Initial concentrations: A0 = 5.0, E0 = 0.9, C0 = 1.0. Phase 2: k1 increases in a hyperbolic fashion (Eq 14), k2 = 1 × 10⁵, k3 = 5 × 10⁵, k4 = 1 × 10⁵, k5 = 10.0, and k6 = 1.0. KM = 1 × 10⁻⁶, KI = 0.1, n = 4 (Eq 6). Left panel: k1 and C as a function of time just before k1 reaches the infinity limit; right panel: corresponding A and E concentrations as a function of time.
It is interesting to note that in case of hyperbolic growth the first-order autocatalytic growth in C (left panel, Fig 9) is not able to maintain a constant E, i.e., E decreases, but A is still kept at its set-point (right panel, Fig 9).
Second-order autocatalysis in C
We asked the question, how would the controller respond when the autocatalytic generation of C becomes second-order (Eq 10), with other words, when the generation of C is itself due to hyperbolic growth (S2 Text)?
Fig 10 shows the results when C is subject to second-order autocatalysis and k1 increases exponentially. Although there is no apparent change in A in comparison with Fig 8 now E itself is under homeostatic control, besides A. E’s set-point can be calculated by setting Eq 10 to zero, which leads to
| (15) |
Inserting the rate constant values from Fig 10 into Eq 15 gives a value for Eset of 0.9 in agreement with the numerical values for Ess.
Fig 10. Controller performance with second-order autocatalysis in C (Eq 10) and exponential increase of k1.
Phase 1: the controller is at steady state at its set-point Aset = 5.0 with constant k1 = 2.0. Initial concentrations: A0 = 5.0, E0 = 0.9, C0 = 1.0. Phase 2: k1 increases exponentially (left panel of Fig 3), k2 = 1 × 10⁵, k3 = 5 × 10², k4 = 1 × 10², k5 = 10.0, and k6 = 1.0. KM = 1 × 10⁻⁶, KI = 0.1, n = 4 (Eq 6). Left panel: k1 and C as a function of time; right panel: corresponding A and E concentrations as a function of time.
Fig 11 shows the controller’s behavior when k1 increases hyperbolically with the same second-order autocatalysis as in Fig 10. However, while the controller is still able to keep A at its theoretical set-point, the value of Ess shows now an offset below Eset (Eq 15).
Fig 11. Controller performance with second-order autocatalysis in C (Eq 10) and hyperbolic increase of k1 (Eq 14).
Phase 1 (not shown): the controller is at steady state at its set-point Aset = 5.0 with constant k1 = 2.0. Phase 1 lasts 1 time unit. Initial concentrations: A0 = 5.0, E0 = 0.9, C0 = 1.0. Phase 2: k1 increases hyperbolically. Rate constant values: k2 = 1 × 10⁵, k3 = 5 × 10², k4 = 1 × 10², k5 = 10.0, and k6 = 1.0. KM = 1 × 10⁻⁶, KI = 0.1, n = 4 (Eq 6). Left panel: k1 and C as a function of time just before k1 reaches the infinity limit (blue dashed line). At time 21.249997 k1 = 1.4 × 10⁷, C = 5.4 × 10⁶. Right panel: A and E concentrations as a function of time.
In the case when k1 increases hyperbolically, we wondered how well motif 2 would perform without the help of C in comparison with controllers that have first- or second-order autocatalysis in C?
An answer to this question is given in Fig 12, which shows the performance of a single motif 2 controller without C in comparison with controllers having first- and second-order autocatalysis in C. Since the motif 2 controller without C is subject to the limitation described by Eq 4, this controller breaks down earlier in comparison with those controllers having autocatalysis in C. The second-order autocatalytic controller performs best and keeps A longest at its set-point before breakdown occurs near the infinity limit.
Fig 12. Behavior of motif 2 controller (Fig 2) in comparison with a controller including first-order and second-order autocatalysis in C (Fig 7).
Rate constants for all three controllers: k2 = 1 × 10⁵, k3 = 5 × 10⁵, k4 = 1 × 10⁵, KM = 1 × 10⁻⁶, KI = 0.1, n = 4. Additional rate constants for the autocatalytic controllers: k5 = 10.0, and k6 = 1.0. Initial concentrations: A0 = 5.0, E0 = 0.9, C0 = 1.0 (when autocatalysis in C is included).
Oscillatory homeostats
This section is inspired by the fact that in physiology many cellular compounds or tissues show oscillatory behaviors [36–40], but are also under a homeostatic regulation. For example, circadian oscillations regulate hormones, blood glucose, and adapt organisms to the light/dark and seasonal changes on earth [41–46]. Another interesting example is the homeostatic stabilization of complex neural oscillations [47].
The motif 2 controller (Fig 2) becomes oscillatory when degradations with respect to A and E become zero-order. The resulting oscillator can maintain robust homeostasis [48] of <A>, where
| (16) |
and integration is taken over a certain time interval τ.
This oscillator is identical to Goodwin’s 1963 oscillator [49–51], although Goodwin was probably not aware of the oscillator’s homeostatic property. The promotion of oscillations by zero-order kinetics have also been recognized by Kurosawa and Iwasa [52] in an alternative version of Goodwin’s equations [53].
In case of motif 2, the oscillatory reaction scheme is shown in Fig 13 with the altered rate equation in A:
| (17) |
When KM ≪ A and n = 1, Eqs 2 and 17 can be combined into a quasi-harmonic form [48]
| (18) |
Fig 13. Motif 2 becomes an oscillatory homeostat whenKM ≪ E (condition for integral control) and, in addition, KM ≪ A.
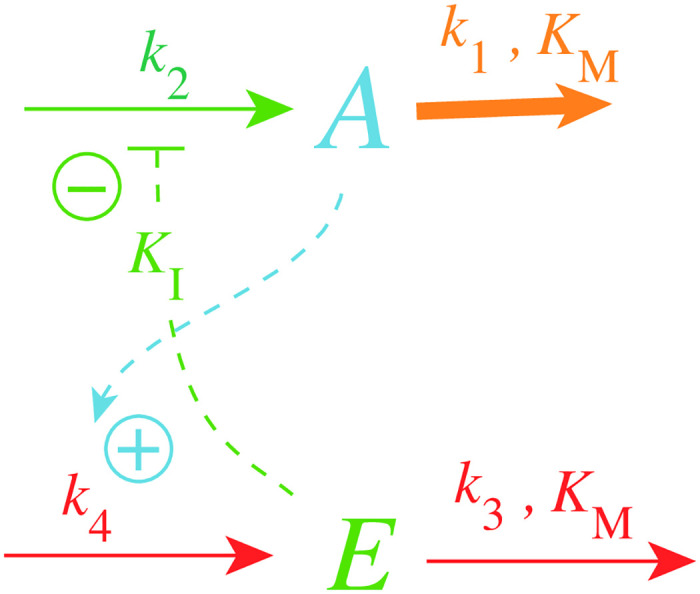
The resulting oscillator is identical to Goodwin’s equations/oscillator from 1963 [49].
When the values of k1 and k2 are close to each other, the resulting oscillations are practically harmonic (sinusoidal) and the period P of the oscillator can be estimated as
| (19) |
with
| (20) |
Table 1 shows three examples of numerically calculated periods Pnum in comparison with the corresponding harmonic periods Pharm. It may be noted that when k1 and k2 become significantly different, the resulting oscillations become highly nonlinear and Pharm can only qualitatively indicate the period’s dependence on rate constants and <E>.
Table 1. Harmonic and numerical periods.
| k1 | k2 | Pharm | Pnum |
|---|---|---|---|
| 9 × 10⁻³ | 1 × 10⁻² | 22.0 | 22.1 |
| 9 × 10⁻² | 0.1 | 7.01 | 6.99 |
| 0.9 | 1.0 | 2.21 | 2.22 |
KI = 0.1, KM = 1 × 10⁻⁸, k2 = k4 = 1.0, A0 = 0.96, E0 = 3.3 × 10⁻³.
Fig 14 shows, as a reference, the behavior of the oscillatory m2 controller (Fig 13) when k1 increases exponentially. The value of <A> is at the controller’s set-point (5.0) and kept there, until, as in the non-oscillatory case (Fig 3), the controller breaks down when E values become too low.
Fig 14. Response of oscillatory motif 2 (Fig 13) when k1 increases exponentially in phase 2 by the growth law described in the left panel of Fig 3.
Phase 1: k1 is at 2.0; phase 2: At time t = 80 k1 starts to increase exponentially. At the end of phase 2 k1 is 1.8 × 10⁶. Left panel: values of A, <A>, and E as a function of time. Right panel: Calculated period as a function of time. Rate constants: k2 = 1.0 × 10⁵, k3 = 5.0, k4 = 1.0, KI = 1.0, KM = 1.0 × 10⁻⁶, n = 4. Initial concentrations: A0 = 1.56, E0 = 20.55. The rate equations are given by Eqs 2 and 17.
In the case when C is included to improve controller performance (Fig 15), the resulting controller shows an increased lifetime. This is shown in Fig 16.
Fig 15. Inclusion of C in the oscillatory m2 controller.
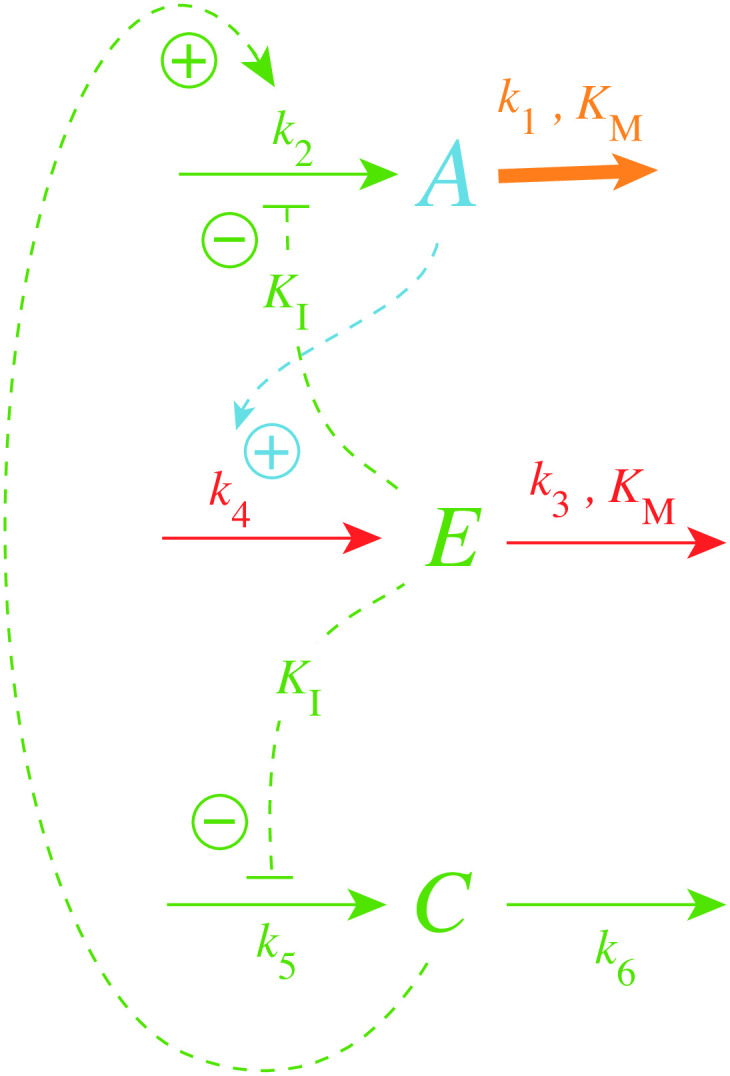
Fig 16. Response of oscillatory motif 2 containing C (Fig 15) when k1 increases exponentially in phase 2 by the growth law described in the left panel of Fig 3.
Rate equations for A, E, and C are given by Eqs 17, 2 and 7, respectively. Phase 1: k1 is kept constant at 2.0; phase 2: At time t = 80 k1 starts to increase exponentially. At the end of phase 2 k1 is 1.8 × 10⁶. Controller breakdown occurs just after 160 time units (data not shown). Left panel: values of A, <A>, and E as a function of time. Right panel: Calculated period as a function of time. Rate constants: k2 = 1.0 × 10⁵, k3 = 5.0, k4 = 1.0, k5 = 50.0, k6 = 1.0, KI = 1.0, KM = 1.0 × 10⁻⁶, n = 4. Initial concentrations: A0 = 1.56, E0 = 20.55, C0 = 1.0.
The presence of C had no significant effect on the period (Fig 16, right panel) which decreased practically in the same manner as in Fig 14 when C is absent. Despite the controller’s increased lifetime in the presence of C, the controller will also in this case, due to the decrease in E, eventually break down as in the nonoscillatory case (Fig 6).
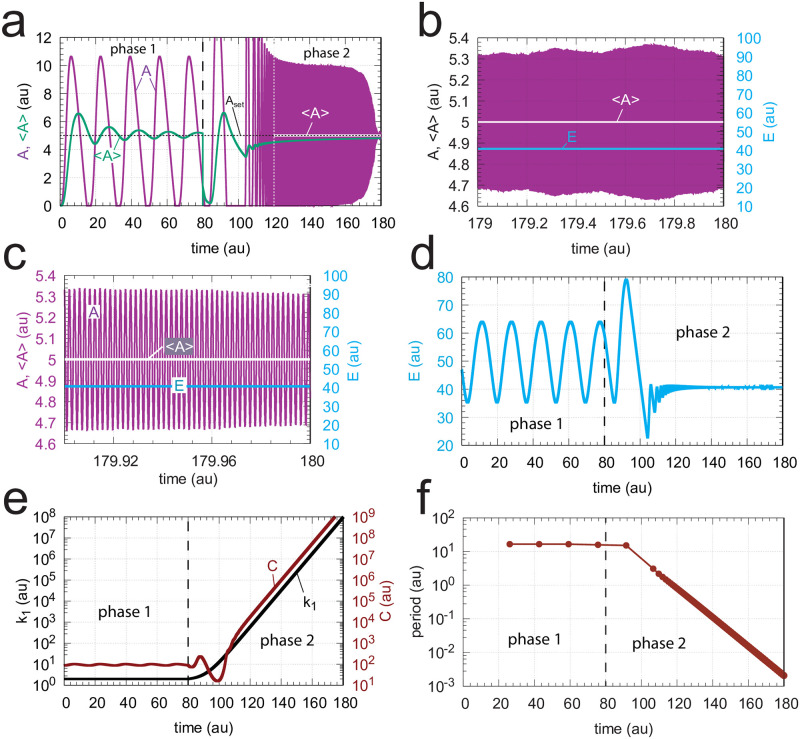
When C is generated by first-order autocatalysis (described by Eq 9) the controller is able to defend Aset for an extended time period (Fig 17a–17c) and keeps <E> constant (Fig 17d). After an induction period, the controller is able to follow the exponentially increasing k1 by C (Fig 17e) and thereby becoming capable to defend Aset. Fig 17f shows the exponential decrease of the calculated period. Since in phase 2 <E> is now kept at a constant level the controller will remain operative as long as C can be increased and the activation of A by C is maintained.
Fig 17. Response of oscillatory m2 controller with first-order autocatalytic generation of C and exponential increase of k1.
Phase 1 (0-80 time units): k1 = 2.0. Phase 2 (80-180 time units): k1 increases exponentially as shown in the left panel of Fig 3. Rate equations are given by Eqs 17, 2 and 9. (a) A (in purple) and overall <A> (in green) as a function of time. The white outlined <A> is the <A> value calculated from 120 (white vertical line) to 180 time units showing that <A>= Aset = 5.0. (b) A, <A>, and E for the time interval 179.0-180.0. (c) A, <A>, and E for the time interval 179.9-180.0. (d) E as a function of time. (e) k1 and C as a function of time. (f) The period as a function of time. Rate constants: k2 = 1 × 10⁵, k3 = 5.0, k4 = 1.0, k5 = 5.0 (phase 1), k5 = 50.0 (phase 2), k6 = 0.1 (phase 1), k6 = 1.0 (phase 2), KI = 1.0, KM = 1 × 10⁻⁶. Initial concentrations: A0 = 2.684, E0 = 61.55, C0 = 86.21, n = 4.
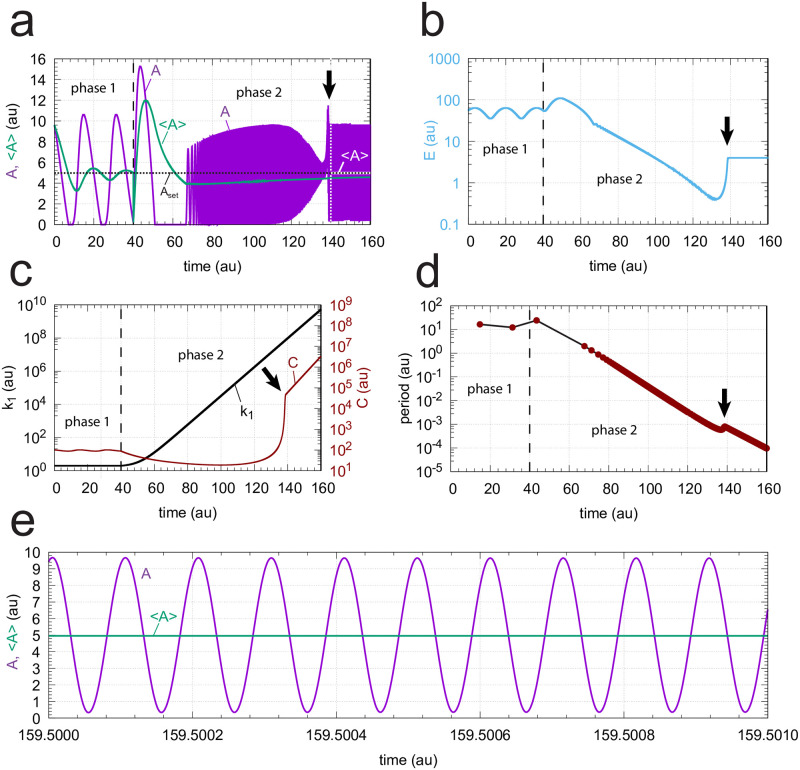
When C is generated by second-order autocatalysis (Eq 10) the resulting controller is, as for first-order autocatalysis, able to defend Aset. Fig 18 shows the case when k1 increases exponentially. We found that an increase of k2 by one order of magnitude during phase 2 was beneficial for the controller’s homeostatic behavior. To avoid overcompensation, k5 was decreased by one order of magnitude during phase 2. Fig 18a shows the time profiles of A and <A>. Once the controller is able to follow the increasing k1 values (indicated by the downward arrows in the different panels) <A> is at Aset, as indicated in panel a by the white outlined <A>.
Fig 18. Response of oscillatory m2 controller with second-order autocatalytic generation of C and exponential increase of k1.
Phase 1 (0-40 time units): k1 = 2.0. Phase 2 (40-160 time units): k1 increases exponentially as shown in the left panel of Fig 3. Rate equations are given by Eqs 17, 2 and 10. Downward arrows indicate the starting point when the controller is able to compensate for the increasing k1 values. (a) A (in purple) and overall <A> (in green) as a function of time. The white outlined <A> is the <A> value calculated from 140 (white vertical line) to 160 time units showing that <A>= Aset = 5.0. (b) E as a function of time. (c) k1 and C as a function of time. (d) The period as a function of time. (e) High frequency oscillations near the end of phase 2. <A> is calculated for the time interval from 159.500 to 159.501 showing that <A> (4.9989) is close to Aset = 5.0. Rate constants: k2 = 1 × 10⁵ (phase 1), k2 = 1 × 10⁶ (phase 2), k3 = 5.0, k4 = 1.0, k5 = 5 × 10⁻² (phase 1), k5 = 1 × 10⁻³ (phase 2), k6 = 1 × 10⁻³, KI = 1.0, KM = 1 × 10⁻⁶. Initial concentrations: A0 = 9.6, E0 = 55.4, C0 = 101.0, n = 4.
In Fig 18b E is shown as a function of time going into a steady state once control over the increasing k1 values have been taken. The takeover of control is most clearly seen in Fig 18c when after the induction period C is able to follow the increasing k1. Fig 18d shows that the period is decreasing exponentially in line with the exponential increase of k1. Fig 18e shows the high frequency oscillations in A near the end of phase 2 having a period of approximately 10−4 time units. Calculating the A-average over the 10−3 time units shows that <A> is at Aset = 5.0.
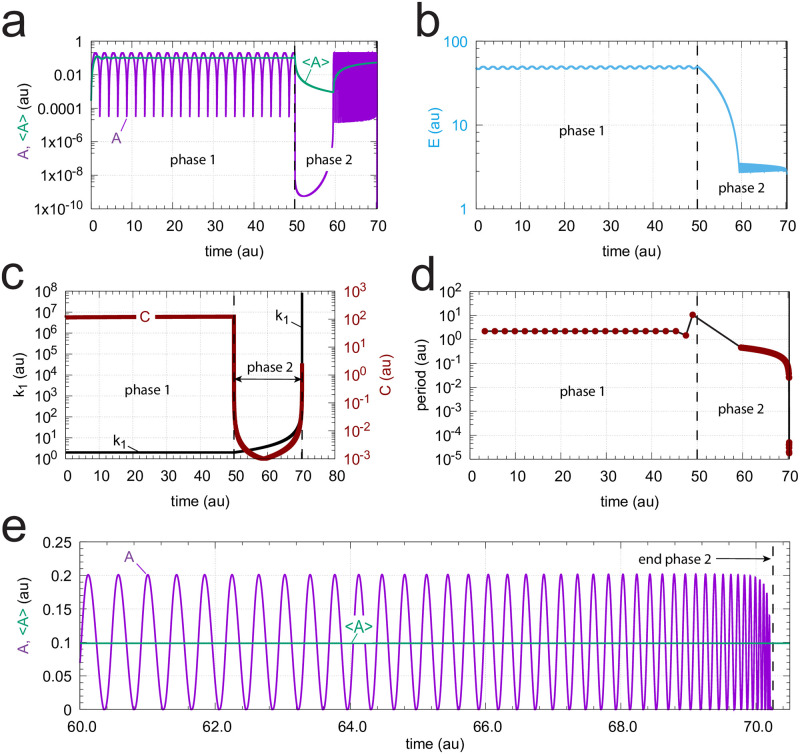
Finally we have tested a controller with second-order autocatalytic generation of C when k1 increases hyperbolically according to Eq 14. We found that a reduction of the unperturbed period in phase 1 to approximately 2 time units gave a good illustration of an operational controller under these conditions. The reduced period was achieved by increasing k4 to 50.0. This led to a decrease in Aset (= k3/k4) to 0.1. Fig 19a shows a semilogarithmic plot of A and <A> as a function of time. At time t = 50.0 k1 starts to grow (Eq 14) with kp,1 = 2.0. The infinity limit is reached at 70.25 time units. Also here we observe an induction period in which the controller adapts to the increasing k1. At about 60 time units the controller is able to oppose the increasing k1 values. At the same time <E> goes into a steady state (Fig 19b) and C is able to follow k1 (Fig 19c). The period decreases in a corresponding manner as k1 increases (Fig 19d), and the controller is able to defend Aset. Fig 19e shows that <A> = 0.0997 when <A> is determined between 60 time units and close to the infinity limit.
Fig 19. Response of oscillatory m2 controller with second-order autocatalytic generation of C and hyperbolic increase of k1.
Rate equations are given, as in Fig 18, by Eqs 17, 2 and 10. Phase 1 (0-50 time units): k1 = 2.0. Phase 2 (50-70.24999992 time units) k1 increases hyperbolically (Eq 14) from 2.0 to 5.8673 × 10⁸. Aset = 0.1. (a) A and average <A> as a function of time. Aset = 0.1. (b) Concentration of E as a function of time. (c) k1 and C time profiles. (d) The period as a function of time. (e) Concentration of A and calculated <A> (= 0.0997) during phase 2 (time interval 60.0-70.24999992) when oscillations are present. Rate constants: k2 = 1 × 10⁵ (phase 1), k2 = 1 × 10⁶ (phase 2), k3 = 5.0, k4 = 50.0, k5 = 5 × 10⁻² (phase 1), k5 = 1 × 10³ (phase 2), k6 = 1 × 10⁻³ (phase 1), k6 = 1.57 × 10² (phase 2), KI = 1.0, KM = 1 × 10⁻⁶. Initial concentrations: A0 = 2.736 × 10⁻⁴, E0 = 4.793 × 101, C0 = 1.489 × 10², n = 4.
Period homeostasis with respect to step-wise perturbations in k1
Since in some oscillatory physiologies, like circadian rhythms, period homeostasis is observed with respect to certain step-wise environmental perturbations, for example in temperature or pH [54, 55], we wondered whether it would be possible to include an additional variable to one of the above oscillatory controllers which would give homeostasis not only in <A> but also in the oscillator’s period. We have previously shown [48] how the basic oscillatory m2 motif (Fig 13) can show period homeostasis by the addition of controller variables that keep E and the chemical fluxes through E at a constant level. Here we show that we can do the same by taking, as an example, the controller described in Fig 15 (including autocatalytic formation of C).
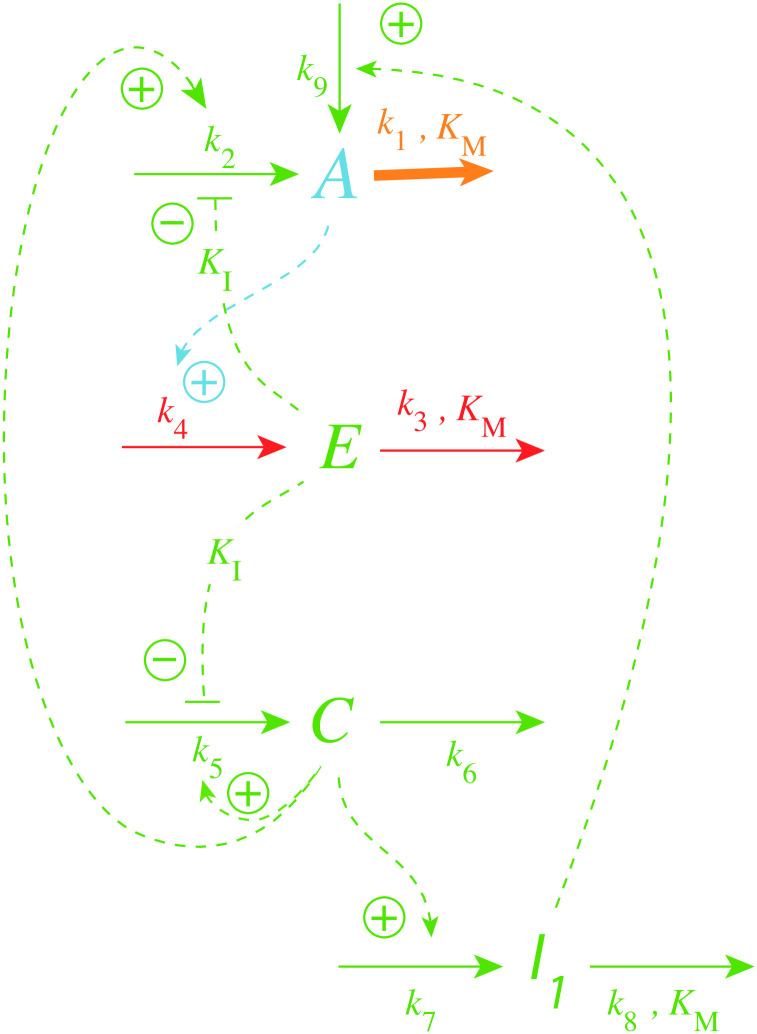
Fig 20 shows the controller’s reaction scheme with the additional variable I1, which keeps <C> and thereby <E> under homeostatic control. The rate equations are:
| (21) |
| (22) |
| (23) |
| (24) |
Fig 20. Reaction scheme of oscillatory m2 controller with autocatalytic generation of C and period homeostasis with respect to step-wise perturbations in k1.
I1 acts as an additional inflow controller with the property to keep <C> at a constant level. The two compensatory fluxes
| (25) |
and
| (26) |
act together such that <A>, <E>, and <C> are under homeostatic control, which leads to regulated fluxes through A, E, and C such that the period of the oscillator becomes constant.
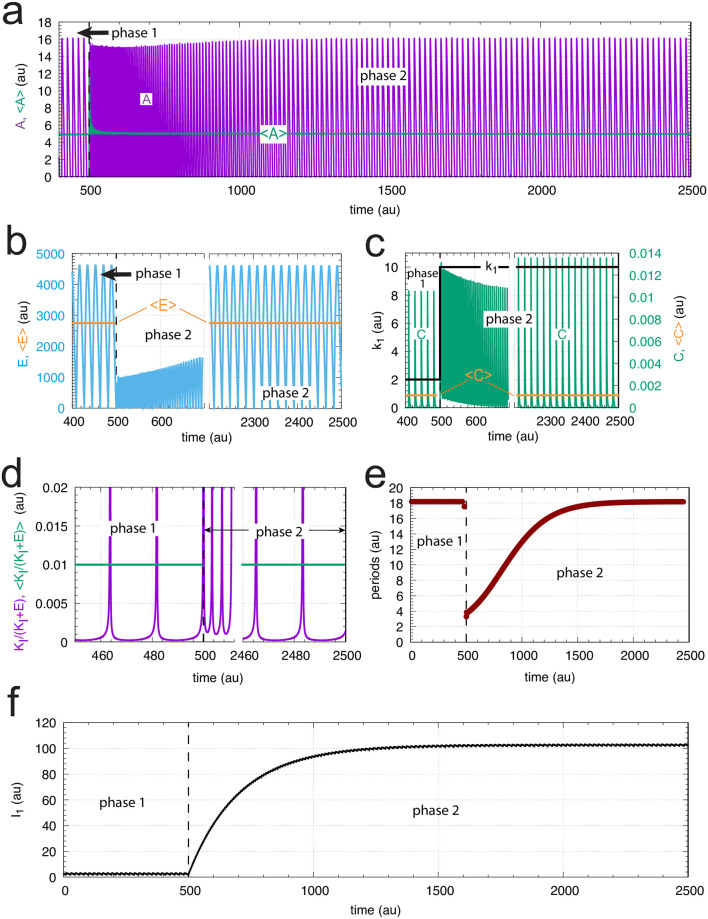
Fig 21 illustrates the period homeostasis for step-wise changes of k1 from 2.0 to 10.0. The period length during phase 1 (k1 = 2.0) is approximately 18 time units. Directly after the step in k1 the period drops to approximately 4 time units but then increases to its original value due to the increase in I1 (panels a, e, and f). The set-point of <C> can be calculated from Eq 24 by setting , which leads to
| (27) |
by assuming that <I1/(KM + I1)> = 1, i.e, KM ≪ I1.
Fig 21. Example of period homeostasis of the controller in Fig 20 when k1 changes from 2.0 (phase 1) to 10 at time t = 500.
Panel a shows oscillatory A and the calculated average <A> as a function of time. (b) Concentration of E as a function of time (in blue) and <E> (orange lines). For phase 1 <E> was calculated for the entire phase, i.e., for the time interval 0-500, while in phase 2 <E> was calculated for the time interval 2000-2500. (c) Step-wise change of k1 from 2 to 10 (left ordinate, outlined in black). Right ordinate: concentration of C as a function of time. Orange lines: calculated average <C> for the time intervals given in panel b. (d) Time plot (in purple) and average value (in green) of respectively KI/(KI + E) and <KI/(KI + E)>. The average values are calculated for the time intervals as stated for panel b. For visibility, ordinate values, which have maximum values of 1 are cut off at 0.02. (e) Calculated period length as a function of time showing that I1 manages to keep period homeostatically controlled. (f) I1 as a function of time. Rate constants: k2 = 1 × 10⁵, k3 = 500, k4 = k5 = 100, k6 = 1.0, k7 = 100, k8 = 0.1, k9 = 8 × 10⁻², KI = 1.0, KM = 1 × 10⁻⁶. Initial concentrations: A0 = 2.683, E0 = 4.463 × 10³, C0 = 4.108 × 10⁻⁶, I1,0 = 2.705, n = 1.
Fig 21c shows that the calculated <C> value (= 0.001) is in perfect agreement with Eq 27. Applying in Eq 23 leads to the condition
| (28) |
which is obeyed, as seen in Fig 21d. However, despite the fact that Eq 28 is fulfilled, we were not able to extract an analytical value for <E>. To get <E> (Fig 21b) we used the numerical solution of the rate equations.
An interesting aspect is whether period homeostasis can also be obtained when the perturbation becomes time-dependent. We will deal with this situation more generally in another paper.
Controller breakdown due to saturation
We have shown that the breakdown of the simple derepression m2 controllers (Figs 2 and 13) can be delayed or even circumvented by including a component C which is activated by derepression from E, but itself activates the generation of E via A (Fig 5). However, there is the question how saturation may affect the performance of the controllers. For example, although the controllers containing a first-order autocatalysis in C are apparently able to follow exponentially increasing k1 values (Figs 9 and 17) they eventually will break down since neither the perturbation k1 nor the increase in C can continue ad infinitum.
In this respect, the models presented here need to be considered as idealizations. For example, concerning the growth of k1 and C, k1 and C will eventually approach saturation levels. In the case of k1, the removal of A may be due to an enzyme or a transporter, which eventually will go into saturation. Likewise, C will be generated by corresponding enzymatic processes and will be subject to saturation (see for example Ref [18] (Supporting Material) and Ref [56]).
A brief overview over these breakdown scenarios are now given. When k1, i.e. the removal of A, goes into saturation before the production of C and before the C-signaling to the compensatory flux, the controller will be able to keep homeostasis of A at its set-point, at a high but constant level of k1. When C-signaling goes into saturation before k1 and C become saturated, then the controller will break down due to an unbalanced exponential increase of C. Finally, when C production becomes saturated, but the removal of A by k1 and C-signaling are still operative, then breakdown of the controller occurs, because the kinetics of the C production are not able to oppose the rapid decrease of A and A levels will go to zero.
Example: The TOC1/PRR5-RVE8 negative feedback loop
A question natural to ask, is whether the above “A-E-C” regulatory circuits can be found in physiology. Would the properties be the same as in the isolated case, i.e., as studied here? Since circadian rhythms are based on transcriptional-translational negative feedback loops, the Goodwin oscillator and the m2-scheme has served as a basic model to describe circadian oscillations [49–51, 57, 58]. We have taken the plant circadian clock organization and looked for the A-E-C motif (Fig 5) there. In plants the circadian organization is complex [59, 60] and consists of several interlocked negative feedback loops where each of them can approximately be described by a basic m2-scheme (Fig 13). Plants have a morning oscillator based on the genes LHY (Late Elongated Hypocotyl) and CCA1 (Circadian Clock Associated 1) and an evening complex (EC) which also contains an autoregulatory negative feedback loop. In addition, there appear to be transcriptional-translational negative feedbacks in the organization of pseudo-response regulators (PRR’s). The PRR gene family consists of five paralogue genes (PRR1, 3, 5, 7, and PRR9). PRR1 (also known as Timing of CAB expression 1 (TOC1)) is presently one of the best characterized gene in the PRR family. They are implicated in clock function and act as period controlling factors [61]. TOC1 and PRR5 are interlocked with the morning oscillator components LHY and CCA1 and the evening complex. It is in the TOC1/PRR5 feedback structure including the RVE8 (REVEILLE8) gene we find the A-E-C motif.
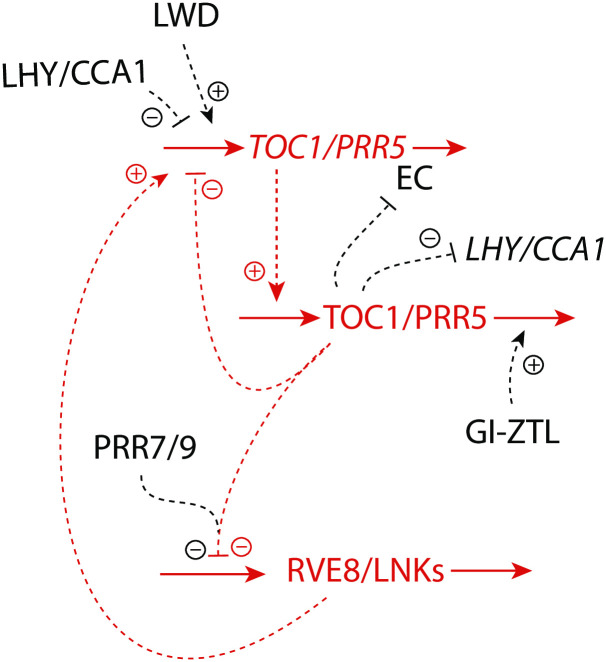
Fig 22 shows part of the plant circadian network including TOC1/PRR5 and RVE8. The TOC1 and RVE8 genes, when mutated, affect the period of the plant circadian clock. In addition, RVE8 has also an influence on the circadian period with respect to temperature (temperature compensation) [62]. RVE8 interacts with LHY, CCA1, and the EC, which in their turn also have an influence on the plant circadian rhythm. The TOC1/PRR5-mRNA’s are part of a negative feedback loop where the proteins TOC1 and PRR5 feed negatively back on their transcription. RVE8 is a MYB-like transcription factor and activates the transcription of TOC1/PRR5, but needs NIGHT LIGHT-INDUCIBLE AND CLOCK-REGULATED 1 and 2 (LNK1 and LNK2) [63, 64] to do that. TOC1/PRR5 on their side inhibit the production of RVE8 possibly by transcriptional repression [65]. Our results with the A-E-C motif suggests, in agreement with experimental implications [62], that RVE8 may take part in the homeostasis of the TOC1/PRR5 negative feedback loop, to stabilize homeostatic properties of the plant circadian clock, including the period. For example, overexpression of RVE8 leads to a shorter circadian period. In analogy, increase of k5 in Fig 5 leads also to a shorter period. However, the TOC1/PRR5 circuits are highly interlocked with other clock components. Thus, other roles of the TOC1/PRR5-RVE8 loop may emerge when detailed models of the plant circadian clock are considered.
Fig 22. Part of the plant circadian clock involving the TOC1 m2-type feedback loop.
The A-E-C motif (Fig 5) is outlined in red.
While we started to find an improvement of the m2-regulatory loop, we arrived at the A-E-C motif. We feel that this or similar feedback structures may be found in other physiological regulations, but more investigations are needed in this respect.
Supporting information
A zip-file with Matlab programs showing results from Fig 4 (n = 4), Fig 6 (n = 4, i = 1), Figs 8, 10 and 14.
(ZIP)
Comparison between controllers (Fig 7) having first-order and second-order autocatalytic generation of C.
(PDF)
It is shown that autocatalysis with an order larger than one shows hyperbolic growth.
(PDF)
Data Availability
All relevant data are within the manuscript and its Supporting information files.
Funding Statement
The author(s) received no specific funding for this work.
References
- 1. Langley LL, editor. Homeostasis. Origins of the Concept. Stroudsbourg, Pennsylvania: Dowden, Hutchinson & Ross, Inc.; 1973. [Google Scholar]
- 2. Cannon W. Organization for Physiological Homeostatics. Physiol Rev. 1929;9:399–431. 10.1152/physrev.1929.9.3.399 [DOI] [Google Scholar]
- 3. Clancy J, McVicar A. Physiology and Anatomy. A Homeostatic Approach. Second edition. Arnold; 2002. [Google Scholar]
- 4. Cannon W. The Wisdom of the Body. Revised and enlarged edition. New York: Norton; 1939. [Google Scholar]
- 5. Davis RC. The domain of homeostasis. Psychological Review. 1958;65(1):8–13. 10.1037/h0045358 [DOI] [PubMed] [Google Scholar]
- 6. Rosen R. Anticipatory Systems. Second edition. Springer; 2012. [Google Scholar]
- 7. Rowland MA, Abdelzaher A, Ghosh P, Mayo ML. Crosstalk and the dynamical modularity of feed-forward loops in transcriptional regulatory networks. Biophys J. 2017;112(8):1539–1550. 10.1016/j.bpj.2017.02.044 [DOI] [PMC free article] [PubMed] [Google Scholar]
- 8. Leibiger IB, Leibiger B, Berggren PO. Insulin feedback action on pancreatic β-cell function. FEBS Letters. 2002;532(1-2):1–6. 10.1016/S0014-5793(02)03627-X [DOI] [PubMed] [Google Scholar]
- 9. Jacques-Silva MC, Correa-Medina M, Cabrera O, Rodriguez-Diaz R, Makeeva N, Fachado A, et al. ATP-gated P2X3 receptors constitute a positive autocrine signal for insulin release in the human pancreatic β cell. PNAS. 2010;107(14):6465–6470. 10.1073/pnas.0908935107 [DOI] [PMC free article] [PubMed] [Google Scholar]
- 10. Wilkie J, Johnson M, Reza K. Control Engineering. An Introductory Course. New York: Palgrave; 2002. [Google Scholar]
- 11. Lewis FL. Applied Optimal Control & Estimation. Englewood Cliffs, NJ: Prentice Hall; 1992. [Google Scholar]
- 12. Ashby WR. An Introduction to Cybernetics. Chapman & Hall; 1961. [Google Scholar]
- 13. Wiener N. Cybernetics: or Control and Communication in the Animal and the Machine. Second Edition. Cambridge, Massachusetts: The MIT Press; 1961. [Google Scholar]
- 14. Cariani PA. The homeostat as embodiment of adaptive control. International Journal of General Systems. 2009;38(2):139–154. 10.1080/03081070802633593 [DOI] [Google Scholar]
- 15. Milsum JH. Biological Control Systems Analysis. New York: McGraw-Hill; 1966. [Google Scholar]
- 16. Milhorn HT. Application of Control Theory to Physiological Systems. Philadelphia: WB Saunders; 1966. [Google Scholar]
- 17. Saunders PT, Koeslag JH, Wessels JA. Integral rein control in physiology. J Theor Biol. 1998;194(2):163–173. 10.1006/jtbi.1998.0746 [DOI] [PubMed] [Google Scholar]
- 18. Drengstig T, Jolma I, Ni X, Thorsen K, Xu X, Ruoff P. A basic set of homeostatic controller motifs. Biophys J. 2012;103(9):2000–2010. 10.1016/j.bpj.2012.09.033 [DOI] [PMC free article] [PubMed] [Google Scholar]
- 19. Barkai N, Leibler S. Robustness in simple biochemical networks. Nature. 1997;387(6636):913–7. 10.1038/43199 [DOI] [PubMed] [Google Scholar]
- 20. Yi TM, Huang Y, Simon MI, Doyle J. Robust perfect adaptation in bacterial chemotaxis through integral feedback control. PNAS. 2000;97:4649–53. 10.1073/pnas.97.9.4649 [DOI] [PMC free article] [PubMed] [Google Scholar]
- 21. El-Samad H, Goff JP, Khammash M. Calcium homeostasis and parturient hypocalcemia: an integral feedback perspective. J Theor Biol. 2002;214(1):17–29. 10.1006/jtbi.2001.2422 [DOI] [PubMed] [Google Scholar]
- 22. Ni XY, Drengstig T, Ruoff P. The control of the controller: Molecular mechanisms for robust perfect adaptation and temperature compensation. Biophys J. 2009;97:1244–53. 10.1016/j.bpj.2009.06.030 [DOI] [PMC free article] [PubMed] [Google Scholar]
- 23. Jolma IW, Ni XY, Rensing L, Ruoff P. Harmonic oscillations in homeostatic controllers: Dynamics of the p53 regulatory system. Biophys J. 2010;98(5):743–52. 10.1016/j.bpj.2009.11.013 [DOI] [PMC free article] [PubMed] [Google Scholar]
- 24. Huang Y, Drengstig T, Ruoff P. Integrating fluctuating nitrate uptake and assimilation to robust homeostasis. Plant, Cell and Environment. 2011;35(5):917–928. 10.1111/j.1365-3040.2011.02462.x [DOI] [PubMed] [Google Scholar]
- 25. Shoval O, Goentoro L, Hart Y, Mayo A, Sontag E, Alon U. Fold-change detection and scalar symmetry of sensory input fields. PNAS. 2010;(36):15995–16000. 10.1073/pnas.1002352107 [DOI] [PMC free article] [PubMed] [Google Scholar]
- 26. Drengstig T, Ni XY, Thorsen K, Jolma IW, Ruoff P. Robust Adaptation and Homeostasis by Autocatalysis. J Phys Chem B. 2012;116:5355–5363. 10.1021/jp3004568 [DOI] [PubMed] [Google Scholar]
- 27. Briat C, Zechner C, Khammash M. Design of a synthetic integral feedback circuit: dynamic analysis and DNA implementation. ACS Synthetic Biology. 2016;5(10):1108–1116. 10.1021/acssynbio.6b00014 [DOI] [PubMed] [Google Scholar]
- 28. Briat C, Gupta A, Khammash M. Antithetic integral feedback ensures robust perfect adaptation in noisy biomolecular networks. Cell Systems. 2016;2(1):15–26. 10.1016/j.cels.2016.01.004 [DOI] [PubMed] [Google Scholar]
- 29. Aoki SK, Lillacci G, Gupta A, Baumschlager A, Schweingruber D, Khammash M. A universal biomolecular integral feedback controller for robust perfect adaptation. Nature. 2019;570:533–537. 10.1038/s41586-019-1321-1 [DOI] [PubMed] [Google Scholar]
- 30. Seaton D, Krishnan J. Modular systems approach to understanding the interaction of adaptive and monostable and bistable threshold processes. IET Syst Biol. 2011;5(2):81–94. 10.1049/iet-syb.2009.0061 [DOI] [PubMed] [Google Scholar]
- 31. Krishnan J, Floros I. Adaptive information processing of network modules to dynamic and spatial stimuli. BMC Systems Biology. 2019;13(1):32. 10.1186/s12918-019-0703-1 [DOI] [PMC free article] [PubMed] [Google Scholar]
- 32. Fjeld G, Thorsen K, Drengstig T, Ruoff P. The performance of homeostatic controller motifs dealing with perturbations of rapid growth and depletion. J Phys Chem B. 2017;121:6097–6107. 10.1021/acs.jpcb.7b01989 [DOI] [PubMed] [Google Scholar]
- 33. Ruoff P, Agafonov O, Tveit DM, Thorsen K, Drengstig T. Homeostatic controllers compensating for growth and perturbations. PLOS ONE. 2019;14(8):e0207831. 10.1371/journal.pone.0207831 [DOI] [PMC free article] [PubMed] [Google Scholar]
- 34.Radhakrishnan K, Hindmarsh AC. Description and Use of LSODE, the Livermore Solver for Ordinary Differential Equations. NASA Reference Publication 1327, Lawrence Livermore National Laboratory Report UCRL-ID-113855. Cleveland, OH 44135-3191: National Aeronautics and Space Administration, Lewis Research Center; 1993.
- 35. Segel IH. Enzyme Kinetics: Behavior and Analysis of Rapid Equilibrium and Steady State Enzyme Systems. New York: Wiley; 1975. [Google Scholar]
- 36. Goldbeter A. Biochemical Oscillations and Cellular Rhythms. Cambridge: Cambridge University Press; 1996. [Google Scholar]
- 37. Kruse K, Jülicher F. Oscillations in cell biology. Current Opinion in Cell Biology. 2005;17(1):20–26. 10.1016/j.ceb.2004.12.007 [DOI] [PubMed] [Google Scholar]
- 38. Shabala S, Shabala L, Gradmann D, Chen Z, Newman I, Mancuso S. Oscillations in plant membrane transport: model predictions, experimental validation, and physiological implications. Journal of Experimental Botany. 2006;57(1):171–184. 10.1093/jxb/erj022 [DOI] [PubMed] [Google Scholar]
- 39. Novák B, Tyson JJ. Design principles of biochemical oscillators. Nat Rev Mol Cell Biol. 2008;9(12):981–991. 10.1038/nrm2530 [DOI] [PMC free article] [PubMed] [Google Scholar]
- 40. Tyson JJ, Albert R, Goldbeter A, Ruoff P, Sible J. Biological switches and clocks. Journal of The Royal Society Interface. 2008;5(suppl_1):S1–S8. 10.1098/rsif.2008.0179.focus [DOI] [PMC free article] [PubMed] [Google Scholar]
- 41. Bünning E. The Physiological Clock. Berlin: Springer-Verlag; 1963. [Google Scholar]
- 42. Dunlap JC, Loros JJ, DeCoursey PJ. Chronobiology. Biological Timekeeping. Sunderland, MA: Sinauer; 2004. [Google Scholar]
- 43. Moore-Ede MC. Physiology of the circadian timing system: predictive versus reactive homeostasis. American Journal of Physiology-Regulatory, Integrative and Comparative Physiology. 1986;250(5):R737–R752. 10.1152/ajpregu.1986.250.5.R737 [DOI] [PubMed] [Google Scholar]
- 44. Bonny O, Firsov D. Circadian clock and the concept of homeostasis. Cell Cycle. 2009;8(24):4015–14. 10.4161/cc.8.24.10224 [DOI] [PubMed] [Google Scholar]
- 45. Nakagawa H, Okumura N. Coordinated regulation of circadian rhythms and homeostasis by the suprachiasmatic nucleus. Proceedings of the Japan Academy, Series B. 2010;86(4):391–409. 10.2183/pjab.86.391 [DOI] [PMC free article] [PubMed] [Google Scholar]
- 46. Solt LA, Kojetin DJ, Burris TP. The REV-ERBs and RORs: Molecular links between circadian rhythms and lipid homeostasis. Future Medicinal Chemistry. 2011;3(5):623–638. 10.4155/fmc.11.9 [DOI] [PMC free article] [PubMed] [Google Scholar]
- 47. Davis GW. Homeostatic signaling and the stabilization of neural function. Neuron. 2013;80(3):718–728. 10.1016/j.neuron.2013.09.044 [DOI] [PMC free article] [PubMed] [Google Scholar]
- 48. Thorsen K, Agafonov O, Selstø CH, Jolma IW, Ni XY, Drengstig T, et al. Robust concentration and frequency control in oscillatory homeostats. PLOS ONE. 2014;9(9):e107766. 10.1371/journal.pone.0107766 [DOI] [PMC free article] [PubMed] [Google Scholar]
- 49. Goodwin BC. Temporal Organization in Cells. Academic Press; 1963. [Google Scholar]
- 50. Gonze D, Abou-Jaoudé W. The Goodwin model: Behind the Hill function. PLOS ONE. 2013;8(8):e69573. 10.1371/journal.pone.0069573 [DOI] [PMC free article] [PubMed] [Google Scholar]
- 51. Gonze D, Ruoff P. The Goodwin oscillator and its legacy. Acta Biotheoretica. 2020; p. 1–18. [DOI] [PubMed] [Google Scholar]
- 52. Kurosawa G, Iwasa Y. Saturation of enzyme kinetics in circadian clock models. J Biol Rhythms. 2002;17(6):568–577. 10.1177/0748730402238239 [DOI] [PubMed] [Google Scholar]
- 53. Goodwin BC. Oscillatory behavior in enzymatic control processes. In: Weber G, editor. Advances in Enzyme Regulation, Vol. 3. Oxford, UK: Pergamon Press; 1965. p. 425–438. [DOI] [PubMed] [Google Scholar]
- 54. Ruoff P, Vinsjevik M, Rensing L. Temperature compensation in biological oscillators: a challenge for joint experimental and theoretical analysis. Comments Theor Biol. 2000;5:361–382. [Google Scholar]
- 55. Ruoff P, Behzadi A, Hauglid M, Vinsjevik M, Havås H. pH homeostasis of the circadian sporulation rhythm in clock mutants of Neurospora crassa. Chronobiology International. 2000;17(6):733–750. 10.1081/CBI-100102109 [DOI] [PubMed] [Google Scholar]
- 56. Ang J, McMillen DR. Physical constraints on biological integral control design for homeostasis and sensory adaptation. Biophys J. 2013;104(2):505–515. 10.1016/j.bpj.2012.12.015 [DOI] [PMC free article] [PubMed] [Google Scholar]
- 57. Ruoff P, Rensing L. The temperature-compensated Goodwin model simulates many circadian clock properties. J Theor Biol. 1996;179(4):275–285. 10.1006/jtbi.1996.0067 [DOI] [Google Scholar]
- 58. Ruoff P, Vinsjevik M, Monnerjahn C, Rensing L. The Goodwin model: Simulating the effect of light pulses on the circadian sporulation rhythm of Neurospora crassa. J Theor Biol. 2001;209(1):29–42. 10.1006/jtbi.2000.2239 [DOI] [PubMed] [Google Scholar]
- 59. McClung CR. The plant circadian oscillator. Biology. 2019;8(1):14. 10.3390/biology8010014 [DOI] [PMC free article] [PubMed] [Google Scholar]
- 60. Nohales MA, Kay SA. Molecular mechanisms at the core of the plant circadian oscillator. Nat Struct & Mol Biol. 2016;23(12):1061. 10.1038/nsmb.3327 [DOI] [PMC free article] [PubMed] [Google Scholar]
- 61. Nakamichi N, Kita M, Ito S, Yamashino T, Mizuno T. PSEUDO-RESPONSE REGULATORS, PRR9, PRR7 and PRR5, together play essential roles close to the circadian clock of Arabidopsis thaliana. Plant and Cell Physiology. 2005;46(5):686–698. 10.1093/pcp/pci086 [DOI] [PubMed] [Google Scholar]
- 62. Rawat R, Takahashi N, Hsu PY, Jones MA, Schwartz J, Salemi MR, et al. REVEILLE8 and PSEUDO-REPONSE REGULATOR5 form a negative feedback loop within the Arabidopsis circadian clock. PLoS Genet. 2011;7(3):e1001350. 10.1371/journal.pgen.1001350 [DOI] [PMC free article] [PubMed] [Google Scholar]
- 63. Xie Q, Wang P, Liu X, Yuan L, Wang L, Zhang C, et al. LNK1 and LNK2 are transcriptional coactivators in the Arabidopsis circadian oscillator. The Plant Cell. 2014;26(7):2843–2857. 10.1105/tpc.114.126573 [DOI] [PMC free article] [PubMed] [Google Scholar]
- 64. Xing H, Wang P, Cui X, Zhang C, Wang L, Liu X, et al. LNK1 and LNK2 recruitment to the evening element require morning expressed circadian related MYB-like transcription factors. Plant Signaling & Behavior. 2015;10(3):e1010888. 10.1080/15592324.2015.1010888 [DOI] [PMC free article] [PubMed] [Google Scholar]
- 65. Nakamichi N, Kiba T, Henriques R, Mizuno T, Chua NH, Sakakibara H. PSEUDO-RESPONSE REGULATORS 9, 7, and 5 are transcriptional repressors in the Arabidopsis circadian clock. The Plant Cell. 2010;22(3):594–605. 10.1105/tpc.109.072892 [DOI] [PMC free article] [PubMed] [Google Scholar]


