Abstract
Melanin is a Sporothrix virulence factor that can inhibit the innate immune functions of macrophages such as phagocytosis and killing. However, no data on melanin’s influence on antigen presentation by macrophages are available. In this study, we used conidia, yeasts, and melanin ghosts (MGs) from a black Sporothrix globosa strain (MEL+) and its ultraviolet-induced albino mutant (MEL−), to study the influence of melanin on expression of molecules involved in antigen presentation by mouse macrophages (MHC class II, CD80, CD86), as well as on levels of transcription factors regulating their expression (CIITA and promoters I, III, and IV). A murine infection model was used to assess the virulence of both strains and differences in expression of MHC class II and CD80/86 in vivo. MHC class II, CD86 CIITA, and PIV expressions were lower in macrophages infected with MEL+ than in macrophages infected with MEL− conidia, while CD80 expression was similar. No statistical difference in gene expression was observed between macrophages infected by MEL+ and MEL− yeasts. Infection by MGs alone had no clear effect on expression of antigen presentation–associated molecules. Mice infected with MEL+ S. globosa had significantly higher fungal burdens in the lung, liver, spleen, kidney, and testicle compared with mice infected with MEL− S. globosa 21 days post-infection. MHC class II expression changes in the animal study were similar to those observed in the in vitro experiment. Our results indicate that S. globosa melanin can inhibit expression of antigen presentation–associated molecules during both the early and late stages of infection, representing a new mechanism to evade host immunity and to enhance dissemination. Further investigations of melanin’s impact on adaptive immunity will be helpful in understanding this fungal virulence factor.
Electronic supplementary material
The online version of this article (10.1007/s42770-020-00345-7) contains supplementary material, which is available to authorized users.
Keywords: Melanin, Sporothrix globosa, MHC class II, CIITA, Macrophage
Introduction
Melanin is an important fungal virulence factor of pathogenic dematiaceous fungi [1]. The dimorphic dematiaceous fungus Sporothrix schenckii complex, including S. schenckii sensu stricto, S. brasiliensis, S. globosa, S. mexicana, S. luriei, and S. albicans, is the common cause of deep mycotic sporotrichosis [2]. Most cases are related to three major species: S. schenckii sensu stricto, S. brasiliensis, and S. globosa. All three species produce at least one of three types of melanin [3–5]. Most melanin particles are transported to the cell wall, where they have structural functions [6] and play various protective roles [7–9]. As a stable, negatively charged, reducing, high-molecular weight polymer covering the cell wall, melanin modulates interactions between the fungus and immune cells to protect Sporothrix spp. from host immunity. However, the detailed mechanisms are still poorly understood.
Phagocytes are crucial for the elimination of S. schenckii. Neutrophils can rapidly migrate to the site of infection, but they do not kill fungal cells efficiently [10]. Macrophages that efficiently recognize, phagocytose, and kill pathogens play a key role in the immune response against Sporothrix spp. There are very limited published data regarding the effect of S. globosa melanin on phagocytes and immune responses, although a few studies found that melanin could increase the survival and invasion of S. schenckii [6, 11, 12] by inhibiting macrophage functions including phagocytosis and production of reactive oxygen species [6]. In addition to their direct effects on pathogens, macrophages are also important antigen-presenting cells for establishing adaptive immune responses. Antigen processing and presentation rely on a macrophage’s ability to capture, kill, and digest pathogens. The potential ability of melanin to suppress these functions leads to the question of whether Sporothrix melanin can inhibit macrophage antigen presentation functions. In this study, we assessed the influence of melanin on expression of MHC class II, CD80, and CD86 protein and gene expression of CIITA (class II transactivator, the major promoter of MHC II) and its promoters PI, PIII, and PIV in mouse macrophages. In this present study, a melanin-producing (MEL+) strain of S. globosa, which is the most prevalent species in China [13, 14], along with its albino mutant (MEL−) and melanin ghosts (MGs, a MG is an empty shell formed by melanin in the cell wall after all other cell components were digested and removed) were used.
Materials and methods
Melanin-producing wild-type S. globosa strain and production of its albino mutant
The S. globosa strain (FHJU 12082703) used in this study was isolated from a Chinese patient diagnosed with lymphocutaneous sporotrichosis by fungal culture and histopathological examination. Colonies (cultured at 25 °C) were black and the isolate was confirmed as S. globosa by morphological characterization and calmodulin (CAL) gene sequencing. This strain (MEL+) was stored in 10% glycerin at − 80 °C and was resuscitated on a Sabouraud dextrose agar (SDA) slant at 25 °C before use. An albino strain (MEL−) was induced using ultraviolet light at 254 nm as described previously [6]. A microculture was used to identify morphological characteristics of the albino strain, and CAL gene sequencing was applied to confirm the identity of the MEL− strain. The morphological and ultrastructural features of both strains were compared by light microscopy and transmission electron microscopy (TEM), respectively.
Preparation of mycelium form conidia and yeast forms of MEL+ and MEL− strains and preparation of melanin ghosts (MGs)
To prepare conidia of the mycelium form, the MEL+ and MEL− strains were inoculated in SDB and cultured in a shaker incubator at 28 °C with 150 rpm shaking for 10 days. The cultures were filtered to remove hyphae and washed with phosphate-buffered saline (PBS) twice in 15-mL centrifuge tubes (4000 rpm, 10 min). The conidia were counted using a blood cell counting chamber and resuspended in normal saline or Dulbecco’s modified Eagle’s medium (DMEM; BI, Israel). To prepare the yeast forms, the MEL+ and MEL− strains were inoculated in brain heart infusion (BHI) broth and cultured in a shaker incubator at 37 °C with 150 rpm shaking for 10 days. The cultures were filtered and then washed twice with PBS in 15-mL centrifuge tubes (4000 rpm, 10 min). The yeast cells were counted using a counting chamber and resuspended in normal saline or DMEM. To prepare MGs, a previously reported method [4] was used. Briefly, conidia were collected by centrifugation at 4000 rpm for 10 min and digested by shaking overnight in 1 M sorbitol and 0.1 M sodium citrate (pH 5.5) containing 10 mg/mL cellulase (Kayon Biological, Shanghai, China), glusulase, and lywallzyme (Bioleaf, Shanghai, China). The resulting protoplasts were collected and washed three times with PBS and resuspended in 1.0 M sorbitol and 0.1 M sodium citrate (pH 5.5), then incubated overnight at room temperature with 150 rpm shaking. The products were collected and washed three times with PBS and digested with proteinase K (1.0 mg/mL, Novagen, USA) at 37 °C overnight. The samples were washed three times in PBS and then boiled in 6 M HCl for 1 h. The MGs were collected, filtered, and dialyzed against MilliQ water for 10 days. The MG particles were examined by light microscopy, TEM, Gram staining, cotton blue staining, periodic acid-Schiff (PAS) staining, and 3,4-dihydroxy-l-phenylalanine (DOPA) staining. The ultraviolet absorption of MGs was assessed using an ultraviolet spectrophotometer (Spectrum, Shanghai).
Isolation of peritoneal microphages from BALB/c mice
Peritoneal cells were collected from male BALB/c mice (weighing approximately 20 g) by washing the peritoneal cavities with cold PBS. After centrifugation at 1650 rpm at 4 °C for 7 min, the cells were resuspended and counted. A suspension of 1 × 10⁶ macrophages in 2 mL of DMEM (BI, Israel) containing 10% fetal calf serum (BI, Israel) was added to each well of six-well plates. The cells were allowed to settle and adhere for 3 h at 37 °C in a humidified incubator containing 5% CO2. After incubation, the medium was exchanged in each well and non-adherent cells were removed.
In vitro infection of peritoneal macrophage with MEL+ or MEL− strains and MGs
Macrophages, conidia, yeasts, and MGs were prepared as described above. MEL− conidia, MEL+ conidia, MEL− yeasts, MEL+ yeasts, and MGs were added to wells of six-well plates containing macrophages (MOI = 5). Isometric culture medium was added to wells as a negative control. Each treatment included three replicates. The plates were incubated for 24 h at 37 °C in a humidified incubator containing 5% CO2 to allow the macrophages to interact with conidia/yeasts or MGs. Free conidia/yeasts/MGs were removed by gently washing and changing the culture medium. Cells were collected for flow cytometry or quantitative PCR (qPCR) analysis.
Flow cytometry
Cells were washed with cold PBS containing 0.1% bovine serum albumin. Unfixed cells were collected, washed once with cold PBS, and stained with 1:1000 viability dye (Thermo Fisher Scientific, USA) for 30 min at 4 °C. The cells were washed once with FACS Buffer. For extracellular staining, cells were treated with Fc-block (1:100) for 10 min at 4 °C and then stained with fluorescently labeled monoclonal antibodies against murine macrophage surface markers (F4/80, MHC class II, CD80, and CD86) in the dark at 4 °C for 30 min. The following antibodies were used: anti-mouse F4/80 fluorescein isothiocyanate (FITC) (eBioscience, San Diego, USA); anti-mouse MHC class II phycoerythrin (PE)-cyanine5 (Cy5) (eBioscience); anti-mouse CD80 PE (eBioscience); and anti-mouse CD86 PE-Cy5 (eBioscience). For intracellular staining, 250 μL of fixation buffer was used to fix cells for 30 min at 4 °C in the dark. The cells were washed once with 1× permeabilization buffer and centrifuged at 1650 rpm at 4 °C for 5 min. The supernatant was discarded and 50 μL of permeabilization buffer was added, along with 10 μL of anti-mouse tumor necrosis factor (TNF)–α PE (eBioscience) and 10 μL of anti-mouse F4/80 FITC (eBioscience). The cells were stained in the dark at 4 °C for 30 min, washed once, and data were acquired using a FACSCalibur flow cytometer (BD Biosciences, San Jose, USA).
RNA preparation and qPCR
To compare changes in the CIITA and promoters I, III, and IV mRNA levels of murine macrophages that had engulfed different strains of S. globosa, total RNA was extracted and reverse-transcribed into cDNA. Briefly, the macrophages in each well were washed gently with PBS to remove free conidia. One milliliter of TRIZOL reagent (Invitrogen, USA) was added to each well and then, the plate was shaken and incubated for 5 min. The mixtures were transferred into microcentrifuge tubes and extensively vortexed. The resulting mixtures were incubated at room temperature for another 5 min. Two hundred microliters of chloroform was added, mixed by vortexing for 15 s, and incubated at room temperature for 3 min. The phases were separated by centrifugation at 12,000 rpm at 4 °C for 10 min, and the upper aqueous phase was recovered into a fresh RNAse-free Eppendorf tube. Finally, 500 μL of isopropanol was added and mixed by inverting the tubes. After incubation at room temperature for 10 min, RNA precipitates were recovered by centrifugation at 4 °C, rinsed with 500 μL of 75% ethanol, air-dried, and dissolved in 15 μL of diethyl pyrocarbonate–treated water. RNA integrity and concentration were estimated using a SynergyH1 multi-mode reader (BioTek, Winooski, USA). The cDNAs used for real-time PCR were synthesized from total RNA using TransScript® All-in-One First-Strand cDNA Synthesis SuperMix for qPCR Kit (TransGen, Beijing, China). The reaction mixture contained 4 μL of 5× TransScript All-in-One SuperMix for qPCR, 1 μL of TransScript gDNA remover, 5 μL (500 ng) of total RNA, and nuclease-free water to a final volume of 20 μL. Amplification was carried out using the following thermal cycling conditions: 42 °C for 15 min, followed by 85 °C for 5 s to stop the reaction.
Primer sequences for qPCR are listed in Table 1. Expression of glyceraldehyde 3-phosphate dehydrogenase was used as a reference. PCR products were then quantified using the ABI 7500 Fast Real-Time PCR System (Applied Biosystems, USA) and TransScript® Green Two-Step qRT-PCR Supermix (TransGen) according to the manufacturer’s instructions. The reaction mixture contained 10 μL of TransStart® Top Green qPCR SuperMix (2×), 0.4 μL of PCR Forward Primer (10 μM), 0.4 μL of PCR Reverse Primer (10 μM), 0.4 μL of Passive Reference Dye (50×), 2 μL of cDNA, and nuclease-free water in a final volume of 20 μL. Relative expression levels were calculated using the 2−ΔΔCt method and presented in relation expression levels in macrophages receiving different treatments (controls, infected with MEL+ or MEL− strains). Each expression analysis was performed three times.
Table 1.
Primers used in qPCR
| Targets | Sequences (5′-3′)a | Amplicon length (bp) | Temperature (°C) |
|---|---|---|---|
| GAPDH |
F: CTGCACCACCAACTGCTTAG R: GTCTGGGATGGAAATTGTGA |
660 | 55 |
| CIITA |
F: ACGCTTTCTGGCTGGATTAGT R: TCAACGCCAGTCTGACGAAGG |
342 | 55 |
| PI |
F: GGTCGGCATCACTGTTAAGGA R: AAGAGCTGCTCTCACGGGAAT |
264 | 52 |
| PIII |
F: GGTCGGCATCACTGTTAAGGA R: TCTTACCTGCCGGAGTT |
100 | 50 |
| PIV |
F: GGTCGGCATCACTGTTAAGGA R: GAGACTGCATGCAGGCAGCA |
129 | 50 |
aF and R refers to forward and reverse primers, respectively
In vivo virulence of MEL+/− strains and in vivo expression of MHC class II, CD80, and CD86
The conidia of both strains were collected using the method described previously and resuspended in normal saline (0.9%) at a density of 1 × 10⁸ conidia/mL.
Fifteen male BALB/c mice (weighing approximately 20 g) were divided into three groups. Group 1 mice (n = 5) received intraperitoneal injections of 0.2 mL of a conidial suspension of the MEL+ strain. Group 2 mice (n = 5) received intraperitoneal injections of 0.2 mL of a conidial suspension of the MEL− strain. Group 3 mice (n = 5) received intraperitoneal injections of 0.2 mL of normal saline as controls. Mice were examined once every day to calculate the mortality rate in each group. After 3 weeks, all mice were sacrificed for assessment of fungal burdens in the liver, lung, kidney, spleen, and testicle. For the histological study, sections of selected organs were fixed in 10% formalin and stained with hematoxylin and eosin or PAS. For quantitative organ cultures, organ samples were weighed and then homogenized in 2 mL of PBS. Two hundred microliters of the homogenate were spread onto SDA plates and incubated at 25 °C for 7 days to determine the number of CFU/g in each organ. Two plates were prepared for each sample. Animal experiments were approved by the Ethics Committee of the First Hospital of Jilin University, whose work follows “Laboratory animal – Guideline for ethical review of animal welfare (Standards Press of China, GB/T 35892-2018)” and Regulations on Laboratory Animals in Jilin Province.
For MHC class II expression analysis of peritoneal microphages, peritoneal cells were collected using the method described above immediately following sacrifice. The surface expression of MHC class II and CD80/86 molecules in each group was assessed by flow cytometry.
Nitric oxide (NO) production and TNF-α production by macrophages following infection by MEL+ and MEL− strains
Macrophages were infected by MEL+ and MEL− conidia for 24 h, as described previously. The culture medium was collected and conidia were removed by passing the medium through 0.22-μm filters. The NO levels in media were assessed using a commercial kit (Nanjing Jiancheng Bioengineering Institute, China) according to the manufacturer’s instructions. Macrophages in each well were washed twice with PBS to remove free conidia. Two milliliters of DMEM containing 10% FBS and 4 μL of leukocyte activation cocktail with BD GolgiPlug (BD) were added to each well. Macrophages were cultured for 6 h at 37 °C, washed with cold PBS, and collected in FACS tubes. Cell surface F4/80 expression and levels of intracellular TNF-α were assessed using flow cytometry as described above.
Statistical analyses
Student’s t tests, two-way ANOVAs, and rank-sum tests were used to assess differences between two or more groups. Statistical analysis was performed using SPSS 13.0. P values < 0.05 were considered statistically significant.
Results
Development of an ultraviolet light–induced albino strain of S. globosa
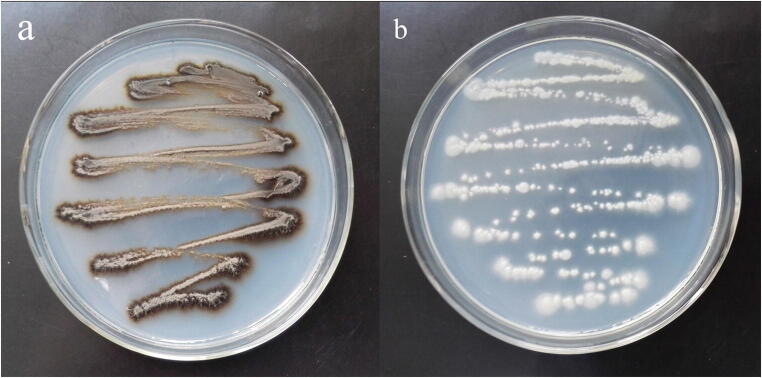
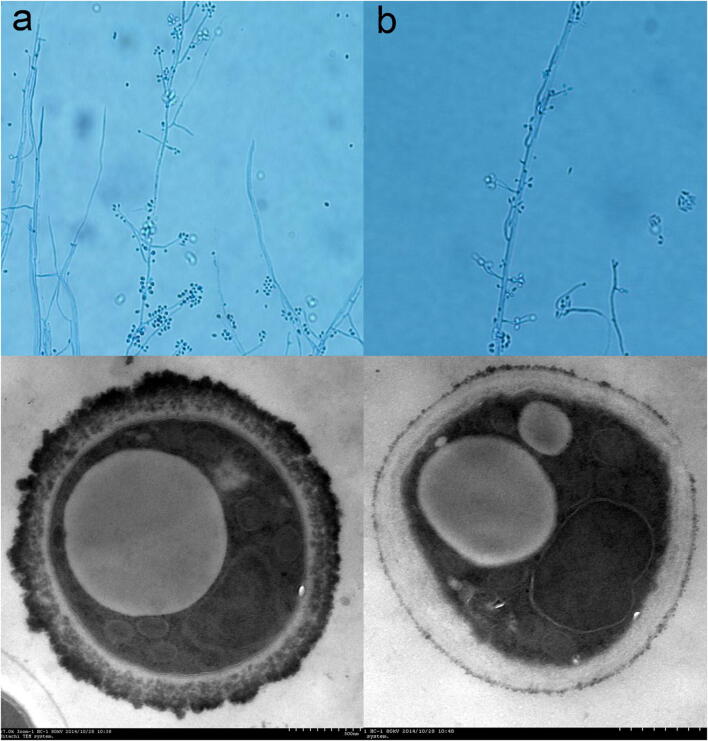
An albino (MEL−) strain of S. globosa was induced by irradiation with 254 nm ultraviolet light. Sequencing of the CAL genes of both MEL+ and MEL− strains produced identical results and this sequence was deposited in the GenBank database (GenBank Accession No. KT008664). Colonies of the MEL− strain had similar morphologies to those of the MEL+ strain except for their color. After 7 days of culture in Sabouraud liquid medium, MEL+ strain colonies were black or dark brown while those of the MEL− strain were white (Fig. 1). No obvious re-pigmentation of the MEL− strain was observed. Under light microscopy, both strains (mycelial phase) showed the typical morphological characteristics of S. schenckii sensu lato, including separated hyphae and oval conidia sometimes resembling a flower. However, the hyphae of the MEL− strain were slightly shorter and sparser than those of the MEL+ strain. TEM showed an electron-dense layer composed of melanin granules in the external cell wall of MEL+ conidia, which was absent in the MEL− strain (Fig. 2). Some of the melanin granules were separated from the cell wall and were released into the peripheral space. The cell wall thicknesses of both strains were similar but the exposed cell wall of MEL− conidia had a smoother appearance.
Fig. 1.
MEL+ (a) and MEL− (b) strains cultured on SDA at 28 °C. The MEL+ strain produces melanin and showed black colonies, while the MEL− strain showed white colonies which represents melanin production deficiency
Fig. 2.
MEL+ (a) and MEL− (b) strains viewed under light microscopy (top, cotton staining, × 400) and TEM (bottom). The MEL+ strain had a large number of electron-dense melanin particles on its surface and in the outer layer of the cell wall
Preparation of MGs
Under light microscopy, MG particles were similar in size to conidia, but showed no evidence of any cellular structure. Under TEM, MGs appeared as high-density empty shells (Fig. 3a). MGs stained weakly positive with DOPA and negative with cotton blue and PAS (Fig. 3b).
Fig. 3.
Melanin ghosts (MGs) under TEM (a, showing empty structure inside) and light microscopy (b, positive for DOPA staining × 400; c, negative for cotton blue staining × 400; d, negative for PAS staining × 400). On the contrary, the live MEL+ strain was positive for cotton blue and PAS staining
Expression of MHC class II, CD80, and CD86 in macrophages can be influenced by S. globose melanin
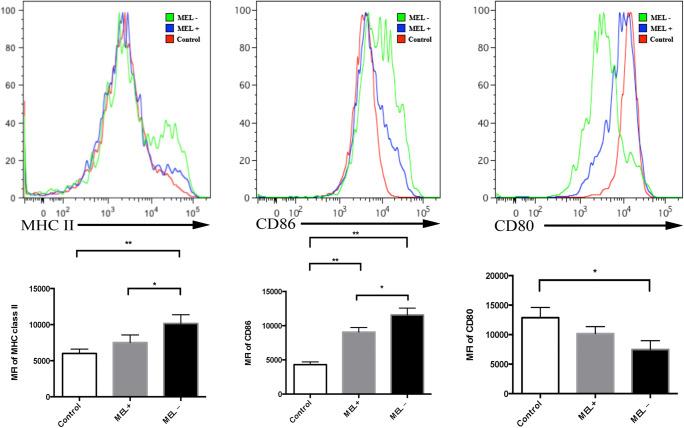
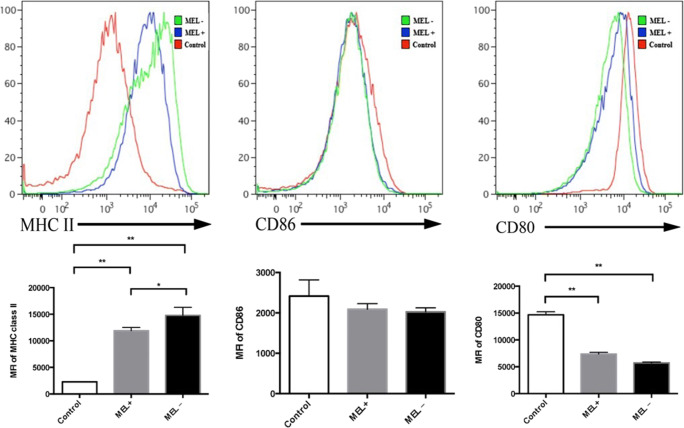
Flow cytometry was performed 24 h post-infection of murine macrophages by MEL+ or MEL− conidia, yeasts, and MGs. The mean fluorescence intensity (MFI) of MHC class II staining in macrophages infected by MEL+ conidia was lower than in macrophages infected by MEL− conidia (t = 2.861, P < 0.05). The MFI in the control group was the lowest (control vs. MEL−: t = 5.343, P < 0.01). The MFI of CD86 staining in macrophages infected by MEL− conidia was significantly higher than in macrophages infected by MEL+ conidia (t = 3.609, P < 0.05) and control macrophages (t = 11.649, P < 0.01). The CD86 MFI in macrophages infected by MEL+ staining was also significantly higher than that of control macrophages (t = 10.711, P < 0.01). However, no statistical difference in CD80 MFI was observed between macrophages infected by MEL+ and MEL− conidia (t = 2.427, P > 0.05). These data are summarized in Fig. 4.
Fig. 4.
Expression of MHC class II, CD86, and CD80 on the surface of murine macrophages 24 h post-infection by MEL+ and MEL− conidia. The expression of MHC class II and CD86 was significantly lower in macrophages infected by MEL+ conidia than by MEL− conidia. *P < 0.05; **P < 0.01
Melanin production is reduced when Sporothrix spp. take on their yeast form [15], and yeasts only generate colonies with a white cream-like morphology. In our experiments, it was also difficult to distinguish MEL+ and MEL− yeast colonies by their color. Flow cytometry showed no significant difference between macrophages infected by MEL+ and MEL− yeasts in terms of the MFIs of MHC class II and CD86 staining. However, the MFI of CD80 staining in macrophages infected by MEL− yeasts was higher than that in macrophages infected by MEL+ yeasts (Fig. 5).
Fig. 5.
Expression of MHC class II, CD86, and CD80 on the surface of murine macrophages 24 h post-infection by MEL+ and MEL− yeasts. No differences were observed in MHC class II and CD86 expression between macrophages infected by MEL+ and MEL− yeasts. Expression of CD80 was significantly lower in macrophages infected by MEL+ yeasts than by MEL− yeasts. *P < 0.05; **P < 0.01
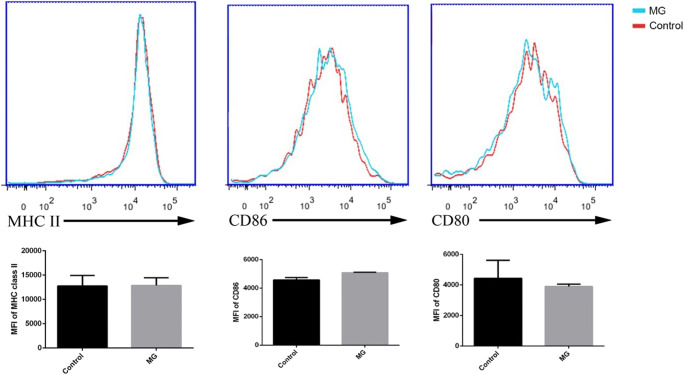
No significant differences were observed in the MFIs of staining for MHC class II, CD80, or CD86 between control macrophages and macrophages infected by MG particles (Fig. 6).
Fig. 6.
Expression of MHC II, CD80, and CD86 on the surface of murine macrophages 24 h post-infection by MEL+ conidia (control) and melanin ghosts (MGs). No significant differences in expression were observed
Melanin reduces CIITA and PIV mRNA levels
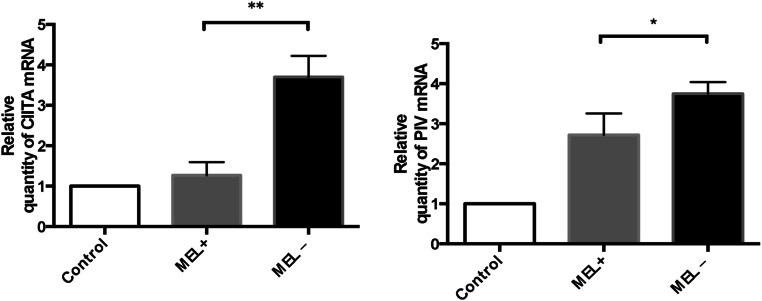
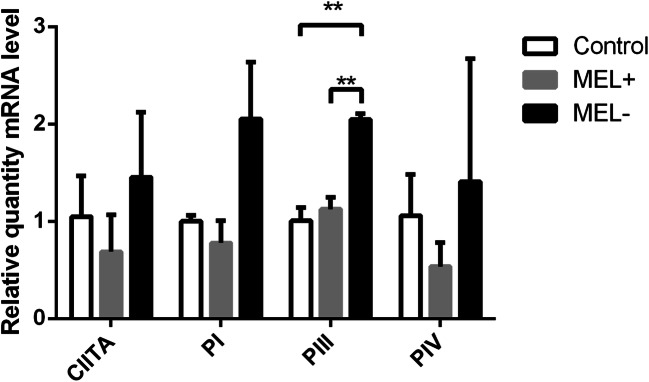
To further investigate the influence of S. globosa melanin, levels of CIITA, PI, PIII, and PIV mRNA in murine macrophages that had engulfed MEL− and MEL+ stains were assessed by qPCR. Expression levels of both CIITA and PIV were lower in macrophages cultured with MEL+ conidia than those cultured with MEL− conidia (t = 6.813, P < 0.01 and t = 2.916, P < 0.05, respectively). Macrophages cultured with MEL+ and MEL− conidia both showed higher expression than control macrophages (Fig. 7). No statistical differences were observed between macrophages cultured with MEL+ and MEL− conidia in terms of mRNA levels of PI and PIII (data not shown). A trend toward higher expression levels in macrophages infected by MEL− yeasts was present for all four molecules, but a statistical difference was only observed for PIII expression (Fig. 8).
Fig. 7.
Relative levels of CIITA and PIV mRNA in macrophages 24 h post-infection by MEL+ and MEL− conidia. Higher expression of both molecules was observed in macrophages infected by MEL− conidia. *P < 0.05; **P < 0.01
Fig. 8.
Relative levels of CIITA and PI, PIII, and PIV mRNA in macrophages 24 h post-infection by MEL+ and MEL− yeasts. Higher expression of PIII was observed in macrophages infected by MEL− conidia. *P < 0.05; **P < 0.01
Virulence of MEL+ and MEL− strains in BALB/c mice
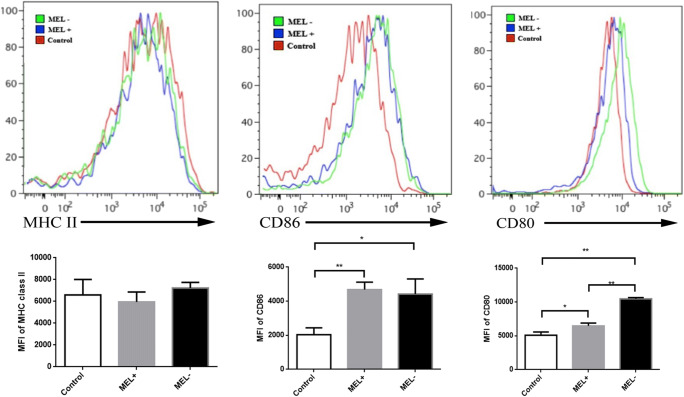
Surprisingly, no mice died following infection over the 21-day observation period. Three mice in the MEL+ group and two in the MEL− group showed small nodules on the tail. However, the deep organ disseminations in these two groups of mice were quite different. The mean weights of the lung, liver, spleen, kidney, and testicle in mice infected with MEL+ conidia were 0.20 g, 1.83 g, 0.33 g, 0.27 g, and 0.14 g, respectively, and in mice infected with MEL− conidia, they were 0.18 g, 1.67 g, 0.14 g, 0.27 g, and 0.10 g, respectively. The average weights of most organs in mice infected with MEL+ conidia were similar to those of mice infected with MEL− conidia. However, a statistical difference was observed in mean spleen weight (t = 2.579, P < 0.05) (Fig. 9). None of the mice infected with MEL− conidia showed lung, liver, or testicle involvement and only 20% developed spleen and kidney infections. By contrast, 80% of mice infected with MEL+ conidia developed lung infections and 100% developed liver, spleen, kidney, and testicle infections. The average fungal load per gram of spleen and kidney in infected mice was significantly different between mice infected with MEL+ and MEL− conidia (Table 2). Thus, the MEL+ strain showed higher dissemination, despite similarity lethality over the observation period. The peritoneal macrophages were washed with cold PBS 21 days post-infection. Flow cytometry showed that the MFI of MHC class II staining in peritoneal macrophages from mice infected with MEL+ conidia was lower than that of macrophages from mice infected with MEL− conidia (t = 3.051, P < 0.05). Macrophages from control mice showed the lowest MHC class II MFI (vs. MEL+, t = 26.968, P < 0.01; vs. MEL−, t = 14.212, P < 0.01). Expression of CD86 by macrophages from these three groups of mice showed no significant differences (F = 2.032, P > 0.05). CD80 expression levels in macrophages from mice infected with both MEL+ and MEL− conidia were lower than those of macrophages from control mice (t = 19.816, P < 0.01 and t = 26.797, P = <0.01, respectively). These data are summarized in Fig. 10.
Fig. 9.
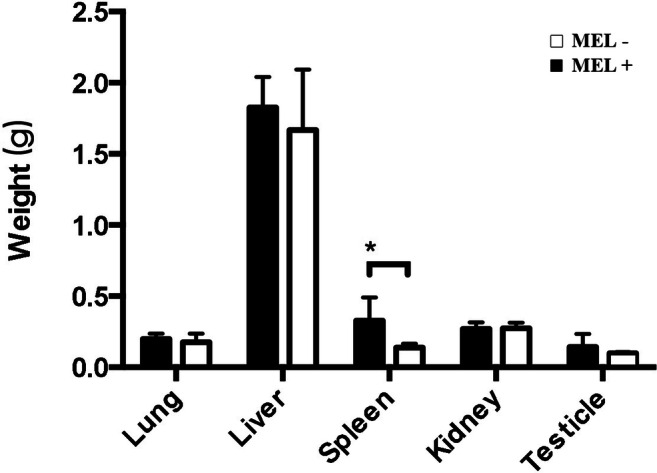
Average weights (g) of organs from mice 21 days post-infection by MEL+ and MEL− conidia. Statistical difference exists in spleen. (*P < 0.05; **P < 0.01)
Table 2.
Fungal load per g of the lung, liver, spleen, kidney, and testicle tissue
| Organ fungal load (/g) | Lung | Liver | Spleen | Kidney | Testicle |
|---|---|---|---|---|---|
| M1 | 0 | 0 | 71.43 | 35.71 | 0 |
| M2 | 0 | 0 | 0 | 0 | 0 |
| M3 | 0 | 0 | 0 | 0 | 0 |
| M4 | 0 | 0 | 0 | 0 | 0 |
| M5 | 0 | 0 | 0 | 0 | 0 |
| Mean of infected | 71.43* | 35.71* | |||
| Rate of involvement (%) | 0 | 0 | 20 | 20 | 0 |
| W1 | 0 | 5958.33 | 2500 | 1800 | 226,000 |
| W2 | 500 | 1500 | 7500 | 2333.33 | 207,333.33 |
| W3 | 875 | 500 | 1125 | 6800 | 12,333.33 |
| W4 | 3666.67 | 12,600 | 1866.67 | 5250 | 100,600 |
| W5 | 2666.67 | 285.71 | 83.33 | 5333.33 | 7000 |
| Mean of infected | 1927.09 | 4168.81 | 2615* | 4303.33* | 110,653.33 |
| Rate of involvement (%) | 80 | 100 | 100 | 100 | 100 |
Fungal loads are indicated for mice infected with the MEL− mutant (M1–M5) and MEL+ wild-type (W1–W5). *P < 0.05 by Student’s t test
Fig. 10.
Expression of MHC class II, CD86, and CD80 on the surface of murine peritoneal macrophages 21 days post-infection by MEL+ and MEL− conidia. The expression of MHC class II was significantly lower in peritoneal macrophages from mice infected by MEL+ conidia than that infected by MEL− conidia. *P < 0.05; **P < 0.01
NO production and TNF-α production by macrophages following infection by MEL+ and MEL− conidia
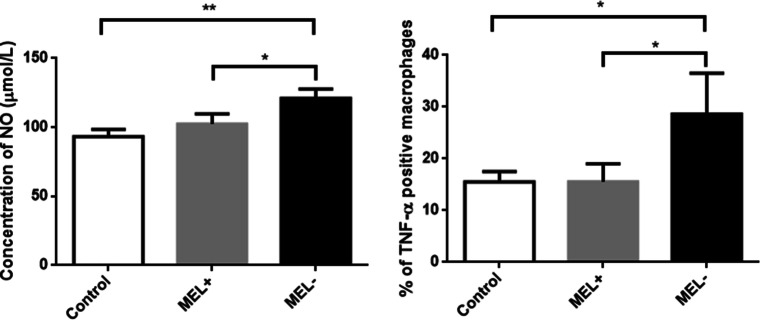
The concentration of NO in the culture medium of macrophages infected with MEL− conidia (121.07 ± 6.60 μmol/L) was significantly higher than that in the culture medium of macrophages infected with MEL+ conidia (102.50 ± 7.30 μmol/L, t = 3.269, P < 0.05) and control macrophages (93.27 ± 5.35 μmol/L, t = 5.666, P < 0.01) (Fig. 11). Similar trends were observed among the three groups of macrophages in terms of the percentage of TNF-α-positive macrophages (MEL−, 28.63 ± 7.88%; MEL+, 15.57 ± 3.44%; and control, 15.50 ± 2.01%) (Fig. 11).
Fig. 11.
Left: Nitric oxide (NO) levels in the culture medium of macrophages infected by MEL+ and MEL− conidia. MEL− conidia induced higher levels of NO production than MEL+ conidia. Right: Percentage of TNF-α-positive macrophages in each group. MEL− strains could induce more TNF-α production by macrophage. *P < 0.05; **P < 0.01
Discussion
Melanin is known to protect animals, plants, and fungi from damage of UV light and oxidation [16]. Level of melanization is often related to the virulence and pathogenicity of fungi [17–20]. Several studies using albino strains (including ultraviolet light–induced and chemically induced mutants) of S. schenckii sensu lato have demonstrated that Sporothrix melanin can disrupt the phagocytic, oxidative killing, and digestive functions of macrophages, causing impairment of innate immunity [6, 12, 21]. In this study, our results showed that melanin can also inhibit expression of MHC II and co-stimulatory molecules on the surface of macrophages, which may impair the antigen presentation function of these cells.
MHC class II is the key factor in exogenous antigen presentation. Processed antigenic peptides are displayed on the cell surface by MHC class II molecules, which can then activate T cells to induce specific antibody production and cytokine secretion. The results of our study showed that the conidia of the MEL+ strain induced lower expression levels of MHC class II expression in macrophages than the conidia of the albino MEL− strain 24 h post-infection. Although without statistical difference, the MEL− group showed a higher trend in MHC II level than the control group. However, when infected by yeast cells, both strains showed no significant differences in their ability to modulate MHC II expression. We showed via the colors of colonies and TEM microscopy that MEL+ conidia had higher levels of melanin, which was distributed on the cell surface and in the cell wall. By contrast, the yeasts of both strains showed much lower and equivalent levels of melanin production. Thus, we conclude that fungal melanin has a negative impact on expression of MHC II in murine macrophages. The exact mechanism remains unclear, but the lower expression levels of CIITA and PIV in the macrophages of mice infected with MEL+ conidia suggest that melanin can inhibit MHC class II expression at the transcriptional level via suppression of its master regulators [22, 23]. CIITA interacts with the assembled bound factors RFX, X2BP/CREB, and NF-Y to activate transcription of MHC II. CIITA can also recruit coactivators (including CBP, p300, and PCAF) with histone acetyltransferase activity for the MHC class II promoter region [24]. Promoters PI, PIII, and PIV encode the first exon which will be spliced into the CIITA second exon. In dendritic cells, CIITA expression is mainly regulated by PI and PIII. By contrast, in B cells, only PIII is necessary, and in macrophages, all three promoters regulate CIITA expression. We also found that infection by MGs alone had no effect on MHC class II expression levels, indicating that melanin itself had no biological activity. Thus, we speculate that the dense melanin layer on the surface of Sporothrix spp. may provide a physical shield for fungal antigens on the cell wall, making it difficult for macrophage receptors to recognize fungal cells. We also found that NO and TNF-α production, which also relies on macrophage pattern recognition receptor interaction with fungal molecules [25], was inhibited by melanin. Production of these molecules is associated with the killing ability of macrophages, which is also an important step for antigen processing. Thus, melanin may inhibit macrophage antigen presentation by inhibiting expression of antigen presentation–associated molecules and by impairing the killing ability of macrophages.
Although the yeast form of Sporothrix spp. is the primary pathogenic phase, melanin still plays important roles in early infection, when melanization is still high on the cell wall prior to phase conversion. Inhibition of MHC class II expression by melanin may disrupt the antigen presentation functions of macrophage and consequently delay induction of adaptive immune responses. This may help the fungus to establish infection.
In addition to MHC class II, antigen presentation requires co-stimulatory factors to generate secondary signals. In our study, changes in the expression of CD80 and CD86 on macrophages infected with Sporothrix spp. were quite different. Because CD86 had similar expression patterns as MHC class II, it may represent the most important co-stimulatory factor for antigen presentation in the early stages of S. globosa infection. CD86 can trigger a stronger Th2 response than CD80 [26, 27] and is also critical for activation of CD4+ cells in both Th1 and Th2 responses. The low CD86 expression levels in macrophages infected by MEL+ conidia may enhance the inhibitory effects of melanin on antigen presentation.
Antigen presentation triggers and modulates the strength of adaptive immunity. Melanin inhibition of the expression of MHC class II and co-stimulatory molecules may influence adaptive immunity, which is also indispensable [28] in sporotrichosis. Disseminated and extracutaneous sporotrichosis usually occur on HIV-infected individuals [29–32] whose adaptive immune systems are impaired, and treatment of these patients is very challenging. Other studies have found that monoclonal antibodies offer effective protection against Sporothrix infection [28, 33]. Therefore, melanin’s effect on antigen presentation may be advantageous to the fungus for evasion of host immune responses and for maximizing dissemination. In our mouse infection model, similar MHC class II expression patterns to our in vitro experiment were observed in peritoneal macrophages 21 days post-infection with MEL+ and MEL− conidia, when deep organ dissemination had occurred. Consistent with other studies [12], the MEL+ strain was very aggressive, with high fungal loads detected in all tested organs. By contrast, the MEL− strain rarely invaded deep organs. A study investigating the virulence of 61 S. brasiliensis, one S. globosa, and 10 S. schenckii clinical isolates concluded that melanin was related to the dissemination of the fungus to internal organs [34]. These results suggest that melanin has a long-term inhibitory effect on macrophage antigen presentation and is important for deep organ dissemination. In our study, mortality was lower than those in other experiments using similar amounts of inoculum. One potential explanation might be that we used S. globosa (the predominant species of the Sporothrix complex in China [13, 14] and many other countries [2, 35, 36]) in our study. Several experiments have shown that the virulence of S. globosa is relatively low compared with that of S. schenckii sensu stricto and S. brasiliensis [34, 37, 38].
In conclusion, melanin, a well-recognized virulence factor of the S. schenckii complex, can increase the pathogenicity and dissemination ability of S. globosa. Through a complex mechanism involving suppression of immune cells. The inhibition of MHC class II and CIITA expression by melanin suggests that antigen presentation by macrophages represents another pathogenic mechanism of melanin. Further investigations will be helpful in achieving a more comprehensive understanding of the role of melanin in fungus-immune system interactions.
Electronic supplementary material
(PPTX 91 kb)
Funding information
This study was financially supported by the National Natural Science Foundation of China (grant numbers 81573060, 81803147, 81703136, and 81171509) as well as the Science & Technology Project Foundation of Jilin Province (grant numbers 20170204060SF).
Compliance with ethical standards
Conflict of interest
The authors declare that they have no conflict of interest.
Footnotes
Publisher’s note
Springer Nature remains neutral with regard to jurisdictional claims in published maps and institutional affiliations.
Yang Song and Lei Yao contributed equally to this work.
References
- 1.Jacobson ES. Pathogenic roles for fungal melanins. Clin Microbiol Rev. 2000;13(4):708–717. doi: 10.1128/CMR.13.4.708. [DOI] [PMC free article] [PubMed] [Google Scholar]
- 2.Chakrabarti A, Bonifaz A, Gutierrez-Galhardo MC, Mochizuki T, Li S. Global epidemiology of sporotrichosis. Med Mycol. 2015;53(1):3–14. doi: 10.1093/mmy/myu062. [DOI] [PubMed] [Google Scholar]
- 3.Almeida-Paes R, Frases S, Fialho Monteiro PC, Gutierrez-Galhardo MC, Zancopé-Oliveira RM, Nosanchuk JD. Growth conditions influence melanization of Brazilian clinical Sporothrix schenckii isolates. Microbes Infect. 2009;11(5):554–562. doi: 10.1016/j.micinf.2009.03.002. [DOI] [PMC free article] [PubMed] [Google Scholar]
- 4.Almeida-Paes R, Frases S, Araújo Gde S, et al. Biosynthesis and functions of a melanoid pigment produced by species of the Sporothrix complex in the presence of L-tyrosine. Appl Environ Microbiol. 2012;78(24):8623–8630. doi: 10.1128/AEM.02414-12. [DOI] [PMC free article] [PubMed] [Google Scholar]
- 5.Almeida-Paes R, Brito-Santos F, Oliveira MME, Bailão AM, Borges CL, Araújo GRS, Frases S, Soares CMA, Zancopé-Oliveira RM. Interaction with Pantoea agglomerans modulates growth and Melanization of Sporothrix brasiliensis and Sporothrix schenckii. Mycopathologia. 2019;184(3):367–381. doi: 10.1007/s11046-019-00350-x. [DOI] [PubMed] [Google Scholar]
- 6.Romero-Martinez R, Wheeler M, Guerrero-Plata A, Rico G, Torres-Guerrero H́. Biosynthesis and functions of melanin in Sporothrix schenckii. Infect Immun. 2000;68(6):3696–3703. doi: 10.1128/IAI.68.6.3696-3703.2000. [DOI] [PMC free article] [PubMed] [Google Scholar]
- 7.Mario DA, Santos RC, Denardi LB, et al. Interference of melanin in the susceptibility profile of Sporothrix species to amphotericin B. Rev Iberoam Micol. 2016;33(1):21–25. doi: 10.1016/j.riam.2015.03.001. [DOI] [PubMed] [Google Scholar]
- 8.Almeida-Paes R, Figueiredo-Carvalho MH, Brito-Santos F, et al. Melanins protect Sporothrix brasiliensis and Sporothrix schenckii from the antifungal effects of terbinafine. PLoS One. 2016;11(3):e0152796. doi: 10.1371/journal.pone.0152796. [DOI] [PMC free article] [PubMed] [Google Scholar]
- 9.Tamez-Castrellón AK, Romeo O, García-Carnero LC, et al. Virulence factors in Sporothrix schenckii, one of the causative agents of sporotrichosis. Curr Protein Pept Sci. 2019;21:295–312. doi: 10.2174/1389203720666191007103004. [DOI] [PubMed] [Google Scholar]
- 10.Carlos IZ, Sassá MF, da Graça Sgarbi DB, Placeres MCP, Maia DCG. Current research on the immune response to experimental sporotrichosis. Mycopathologia. 2009;168(1):1–10. doi: 10.1007/s11046-009-9190-z. [DOI] [PubMed] [Google Scholar]
- 11.Taborda CP, da Silva MB, Nosanchuk JD, Travassos LR. Melanin as a virulence factor of Paracoccidioides brasiliensis and other dimorphic pathogenic fungi. Mycopathologia. 2008;165(4–5):331–339. doi: 10.1007/s11046-007-9061-4. [DOI] [PMC free article] [PubMed] [Google Scholar]
- 12.Madrid IM, Xavier MO, Mattei AS, Fernandes CG, Guim TN, Santin R, Schuch LFD, Nobre MO, Araújo Meireles MC. Role of melanin in the pathogenesis of cutaneous sporotrichosis. Microbes Infect. 2010;12(2):162–165. doi: 10.1016/j.micinf.2009.10.004. [DOI] [PubMed] [Google Scholar]
- 13.Yu X, Wan Z, Zhang Z, Li F, Li R, Liu X. Phenotypic and molecular identification of Sporothrix isolates of clinical origin in Northeast China. Mycopathologia. 2013;176(1–2):67–74. doi: 10.1007/s11046-013-9668-6. [DOI] [PMC free article] [PubMed] [Google Scholar]
- 14.Liu TT, Zhang K, Zhou X. Molecular identification of Sporothrix clinical isolates in China. J Zhejiang Univ Sci B. 2014;15(1):100–108. doi: 10.1631/jzus.B1300136. [DOI] [PMC free article] [PubMed] [Google Scholar]
- 15.Cruz ILR, Figueiredo-Carvalho MHG, Zancopé-Oliveira RM, Almeida-Paes R. Evaluation of melanin production by Sporothrix luriei. Mem Inst Oswaldo Cruz. 2018;113(1):68–70. doi: 10.1590/0074-02760170339. [DOI] [PMC free article] [PubMed] [Google Scholar]
- 16.Eisenman HC, Casadevall A. Synthesis and assembly of fungal melanin. Appl Microbiol Biotechnol. 2012;93(3):931–940. doi: 10.1007/s00253-011-3777-2. [DOI] [PMC free article] [PubMed] [Google Scholar]
- 17.Brandt ME, Warnock DW. Epidemiology, clinical manifestations and therapy of infections caused by dematiaceous fungi. J Chemother. 2003;15:36–47. doi: 10.1179/joc.2003.15.Supplement-2.36. [DOI] [PubMed] [Google Scholar]
- 18.Chai LY, Netea MG, Sugui J, et al. Aspergillus fumigatus conidial melanin modulates host cytokine response. Immunobiology. 2010;215(11):915–920. doi: 10.1016/j.imbio.2009.10.002. [DOI] [PMC free article] [PubMed] [Google Scholar]
- 19.Bocca AL, Brito PP, Figueiredo F, Tosta CE. Inhibition of nitric oxide production by macrophages in chromoblastomycosis: a role for Fonsecaea pedrosoi melanin. Mycopathologia. 2006;161(4):195–203. doi: 10.1007/s11046-005-0228-6. [DOI] [PubMed] [Google Scholar]
- 20.Casadevall A, Rosas AL, Nosanchuk JD. Melanin and virulence in Cryptococcus neoformans. Curr Opin Microbiol. 2000;3(4):354–358. doi: 10.1016/S1369-5274(00)00103-X. [DOI] [PubMed] [Google Scholar]
- 21.Oliveira MME, Almeida-Paes R, Corrêa-Moreira D, Borba CM, Menezes RC, Freitas DFS, do Valle ACF, Schubach AO, Barros MBL, Nosanchuk JD, Gutierrez-Galhardo MC, Zancopé-Oliveira RM. A case of sporotrichosis caused by different Sporothrix brasiliensis strains: mycological, molecular, and virulence analyses. Mem Inst Oswaldo Cruz. 2019;114:e190260. doi: 10.1590/0074-02760190260. [DOI] [PMC free article] [PubMed] [Google Scholar]
- 22.Krawczyk M, Reith W. Regulation of MHC class II expression, a unique regulatory system identified by the study of a primary immunodeficiency disease. Tissue Antigens. 2006;67(3):183–197. doi: 10.1111/j.1399-0039.2006.00557.x. [DOI] [PubMed] [Google Scholar]
- 23.Drozina G, Kohoutek J, Jabrane-Ferrat N, Peterlin BM. Expression of MHC II genes. Curr Top Microbiol Immunol. 2005;290:147–170. doi: 10.1007/3-540-26363-2_7. [DOI] [PubMed] [Google Scholar]
- 24.Wright KL, Ting JP. Epigenetic regulation of MHC-II and CIITA genes. Trends Immunol. 2006;27(9):405–412. doi: 10.1016/j.it.2006.07.007. [DOI] [PubMed] [Google Scholar]
- 25.Zhou L, Cao X, Fang J, Li Y, Fan M. Macrophages polarization is mediated by the combination of PRR ligands and distinct inflammatory cytokines. Int J Clin Exp Pathol. 2015;8(9):10964–10974. [PMC free article] [PubMed] [Google Scholar]
- 26.Slavik JM, Hutchcroft JE, Bierer BE. CD80 and CD86 are not equivalent in their ability to induce the tyrosine phosphorylation of CD28. J Biol Chem. 1999;274(5):3116–3124. doi: 10.1074/jbc.274.5.3116. [DOI] [PubMed] [Google Scholar]
- 27.Lang TJ, Nguyen P, Peach R, Gause WC, Via CS. In vivo CD86 blockade inhibits CD4+ T cell activation, whereas CD80 blockade potentiates CD8+ T cell activation and CTL effector function. J Immunol. 2002;168(8):3786–3792. doi: 10.4049/jimmunol.168.8.3786. [DOI] [PubMed] [Google Scholar]
- 28.de Lima FD, Nascimento RC, Ferreira KS, Almeida SR. Antibodies against Sporothrix schenckii enhance TNF-α production and killing by macrophages. Scand J Immunol. 2012;75(2):142–146. doi: 10.1111/j.1365-3083.2011.02636.x. [DOI] [PubMed] [Google Scholar]
- 29.Moreira JA, Freitas DF, Lamas CC. The impact of sporotrichosis in HIV-infected patients: a systematic review. Infection. 2015;43(3):267–276. doi: 10.1007/s15010-015-0746-1. [DOI] [PubMed] [Google Scholar]
- 30.Morris-Jones R. Sporotrichosis. Clin Exp Dermatol. 2002;27:427–431. doi: 10.1046/j.1365-2230.2002.01087.x. [DOI] [PubMed] [Google Scholar]
- 31.Gutierrez-Galhardo MC, do Valle AC, Fraga BL, et al. Disseminated sporotrichosis as a manifestation of immune reconstitution inflammatory syndrome. Mycoses. 2010;53(1):78–80. doi: 10.1111/j.1439-0507.2008.01655.x. [DOI] [PubMed] [Google Scholar]
- 32.Freitas DF, Valle AC, da Silva MB. Sporotrichosis: an emerging neglected opportunistic infection in HIV-infected patients in Rio de Janeiro, Brazil. PLoS Negl Trop Dis. 2014;8(8):e3110. doi: 10.1371/journal.pntd.0003110. [DOI] [PMC free article] [PubMed] [Google Scholar]
- 33.Almeida SR. Therapeutic monoclonal antibody for sporotrichosis. Front Microbiol. 2012;3:409. doi: 10.3389/fmicb.2012.00409. [DOI] [PMC free article] [PubMed] [Google Scholar]
- 34.Oliveira LC, Oliveira MM, Gutierrez-Galhardo MC, et al. Phenotypic characteristics associated with virulence of clinical isolates from the Sporothrix complex. Biomed Res Int. 2015;2015:212308. doi: 10.1155/2015/212308. [DOI] [PMC free article] [PubMed] [Google Scholar]
- 35.Camacho E, León-Navarro I, Rodríguez-Brito S, Mendoza M, Niño-Vega GA. Molecular epidemiology of human sporotrichosis in Venezuela reveals high frequency of Sporothrix globosa. BMC Infect Dis. 2015;15:94. doi: 10.1186/s12879-015-0839-6. [DOI] [PMC free article] [PubMed] [Google Scholar]
- 36.de Oliveira MM, Veríssimo C, Sabino R, et al. First autochthone case of sporotrichosis by Sporothrix globosa in Portugal. Diagn Microbiol Infect Dis. 2014;78(4):388–390. doi: 10.1016/j.diagmicrobio.2013.08.023. [DOI] [PubMed] [Google Scholar]
- 37.Arrillaga-Moncrieff I, Capilla J, Mayayo E, Marimon R, Marine M, Genis J, Cano J, Guarro J. Different virulence levels of the species of Sporothrix in a murine model. Clin Microbiol Infect. 2009;15(7):651–655. doi: 10.1111/j.1469-0691.2009.02824.x. [DOI] [PubMed] [Google Scholar]
- 38.Fernandes GF, dos Santos PO, Rodrigues AM, Sasaki AA, Burger E, de Camargo ZP. Characterization of virulence profile, protein secretion and immunogenicity of different Sporothrix schenckii sensu stricto isolates compared with S. globosa and S. brasiliensis species. Virulence. 2013;4(3):241–249. doi: 10.4161/viru.23112. [DOI] [PMC free article] [PubMed] [Google Scholar]
Associated Data
This section collects any data citations, data availability statements, or supplementary materials included in this article.
Supplementary Materials
(PPTX 91 kb)


