

Abstract
Purpose
To determine the feasibility of using deep learning with a multiview approach, similar to how a human radiologist reviews multiple images, for binomial classification of acute pediatric elbow radiographic abnormalities.
Materials and Methods
A total of 21 456 radiographic studies containing 58 817 images of the elbow and associated radiology reports over the course of a 4-year period from January 2014 through December 2017 at a dedicated children’s hospital were retrospectively retrieved. Mean age was 7.2 years, and 43% were female patients. The studies were binomially classified, based on the reports, as either positive or negative for acute or subacute traumatic abnormality. The studies were randomly divided into a training set containing 20 350 studies and a validation set containing the remaining 1106 studies. A multiview approach was used for the model by combining both a convolutional neural network and recurrent neural network to interpret an entire series of three radiographs together. Sensitivity, specificity, positive predictive value, negative predictive value, area under the receiver operating characteristic curve (AUC), and their 95% confidence intervals were calculated.
Results
AUC was 0.95, and accuracy was 88% for the model on the studied dataset. Sensitivity for the model was 91% (536 of 590), while the specificity for the model was 84% (434 of 516). Of 241 supracondylar fractures, one was missed. Of 88 lateral condylar fractures, one was missed. Of 77 elbow effusions without fracture, 15 were missed. Of 184 other abnormalities, 37 were missed.
Conclusion
Deep learning can effectively classify acute and nonacute pediatric elbow abnormalities on radiographs in the setting of trauma. A recurrent neural network was used to classify an entire radiographic series, arrive at a decision based on all views, and identify fractures in pediatric patients with variable skeletal immaturity.
Supplemental material is available for this article.
© RSNA, 2019
Summary
Deep learning using a multiview approach combining a recurrent neural network and a convolutional neural network can distinguish elbow abnormality from normal growth centers of the pediatric elbow and emulates a radiologist’s method of binomial decision making when presented with multiple images.
Key Points
■ A convolutional neural network and a recurrent neural network were used in conjunction to interpret an entire series of three radiographs together.
■ This multiview approach to deep learning can effectively classify a pediatric elbow radiograph series with an accuracy rate of 88%.
■ Fractures were successfully identified with deep learning in skeletally immature patients with open growth plates, and these open growth plates were distinguished from true abnormality.
Introduction
Pediatric elbow radiographs are diagnostically challenging compared with those of adult elbows because of the presence of ossification centers, unossified cartilage, and fracture patterns that change based on skeletal maturation (1). The complexity of these findings is further compounded by normal developmental variants, presenting an increased challenge for nonpediatric radiologists and nonradiologists who are often the first clinicians to review radiographs after trauma (2). In high-volume emergency departments or urgent care centers without trained on-site pediatric radiologists, there is a strong need for quick and correct triage of the patient for either orthopedic evaluation or discharge (3). Binomial identification of elbow abnormality has the potential to simplify point-of-care triage in settings lacking immediate access to a trained pediatric radiologist.
Recently, convolutional neural networks (CNNs) have been shown to be successful in radiologic image classification (4–7), as well as with various applications in automated detection of findings, image quality analytics, image segmentation, and postprocessing (8). Use of CNNs in the triage of radiologic studies has been suggested (8,9), but few studies have in fact studied their feasibility for such a task (10). To our knowledge, no studies to date have experimented with CNN application in pediatric elbow examinations and tested the ability for differentiating abnormalities from normal growth centers.
The purpose of our study was to determine the feasibility of using deep learning with a multiview approach, similar to how radiologists review multiple images, for binomial classification of acute pediatric elbow radiographic abnormalities.
Materials and Methods
Dataset Generation
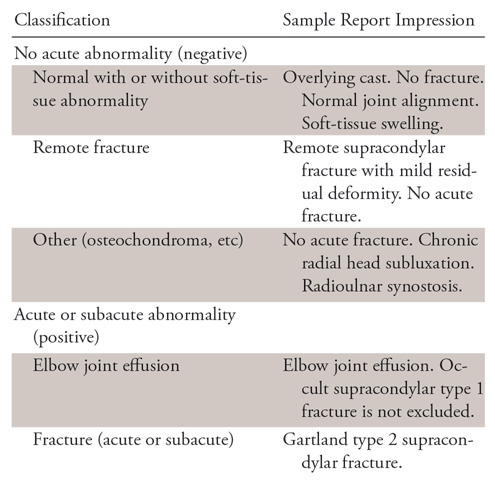
All studies were conducted under a protocol approved by the institutional review board. This study was Health Insurance Portability and Accountability Act compliant. We retrospectively reviewed 21 456 anonymized pediatric elbow studies spanning a 4-year period from January 2014 through December 2017 at a tertiary care children’s center. Demographic data were not readily available for the studies in 2014. Mean age for the group from January 2015 through December 2017 was 7.2 years (age range, 0–85 years; 99.3% were younger than age 18). This group comprised 17 909 studies, of which 9630 (57%) were in male patients and 8279 (43%) were in female patients. The 21 456 studies contained 58 817 images (ie, two to three images per study defined as a minimum of anteroposterior and lateral views, with possible oblique view). We used the fastText algorithm (11) (Appendix E1 [supplement]) to categorize in a binary fashion the 21 456 studies according to the text of the official radiology report generated by certificate of added qualification pediatric radiologists. Examples of positive and negative reports are provided in Table 1.
Table 1:
Elbow Report Classification Examples
Validation Set Generation
We selected 516 normal and 590 abnormal studies, encompassing a total of 3096 images at random from our dataset, and made this our validation (test) set. This represented 5% of our entire dataset. Two senior radiology residents (J.C.R. and N.R.) then reviewed these images for integrity. This validation set was never provided to the model during training phases. In addition, a senior pediatric musculoskeletal radiologist (J.H.K.) reviewed 14 equivocal reports in the validation set at a standard picture archiving and communication system workstation to classify as either an acute or not acute abnormality. Equivocality was determined as reports where “possible,” “indeterminate,” and synonyms thereof were used as qualifiers for positive findings. Of the 590 positive studies, 241 were supracondylar fractures and 88 were lateral condylar fractures; the remaining fracture patterns or relevant acute abnormalities are specified in Table 2.
Table 2:
Multiview Convolutional Neural Network Identification of Specific Pediatric Elbow Abnormality
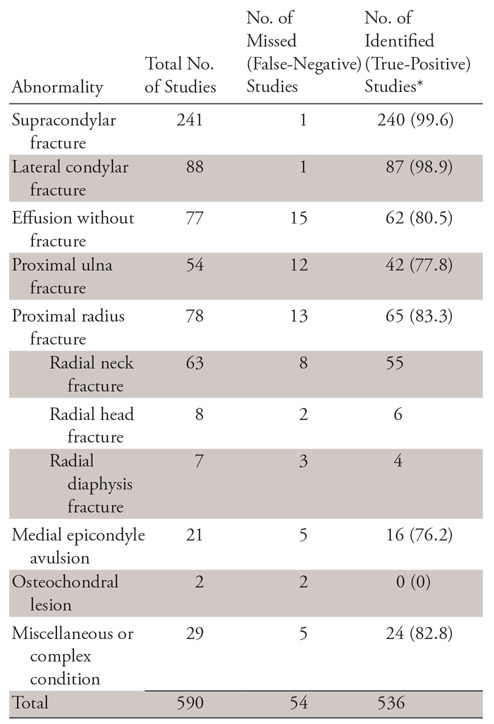
*Data in parentheses are percentages.
Training Set Generation
The remaining 20 350 cases served as the training dataset, of which 4966 cases were considered negative and 15 384 cases were considered positive for acute or subacute abnormality. Equivocality was not assessed in these reports.
Images were preprocessed and underwent data augmentation as specified in Appendix E1 (supplement).
Phase 1 of Training
We performed training in a two-phase fashion. For phase 1, as the image classifier, we modified the Xception (12) architecture to accept single-channel gray-scale input. This model was trained without pretrained weights. We refer to this as the vision model (Fig 1), to distinguish it from the final model used in phase 2. We modified the input dimensions of the vision model to be 500 × 500 × 1 (as represented by single-channel floating point values in the range of 0 to 1).
Figure 1:

Phase 1 of training involved training the convolutional neural network (CNN). Single images were provided at random from the training set, with the ground truth for the image represented by the corresponding report from its respective radiographic series.
After the final feature extraction layer of our model with adaptive global average pooling, where high-level image features are extracted upon forward pass through the model, we added a two-unit dense layer, following a scaled exponential linear units activation function (13). Activation functions such as scaled exponential linear units provide the nonlinearity necessary for our model’s artificial neuron layers and are analogous to thresholding of synapses in the biological neuron where a neuron only fires after meeting a certain amount of activation (14).
Loss is defined as the amount of error the model generates. The model starts off training with a high loss value, and accuracy at the start is no better than random chance (50%). Optimizers such as Adam (name based on adaptive moment estimation) (15) are commonly used to reduce the loss of a neural network by slowly changing the weights (parameters) of the network toward a minimum. The entire process of training can therefore be thought of as a process of loss optimization. Our model specifically optimized a cross-entropy loss with the AMSGrad variant of the Adam optimizer (16). Cross-entropy is a way to define the error between multiple categories and the ground truth (14), and in our case, represented the model’s confidence that a particular image is either positive or negative and whether the study was actually positive or negative.
With the definition of a single epoch as one pass through the number of studies in the training set (20 350 studies), the model was trained for 100 epochs, with the best model from the entire training run chosen to be used in phase 2. In this study, the lowest validation loss occurred at epoch 83. The learning rate of the optimizer was initialized to 0.001 and was reduced by 90% if the loss did not reduce over the course of 10 epochs to a minimum of 0.00001 (two reductions in total).
Phase 2 of Training
For the second phase of training, we used the trained CNN (vision model) as a high-level feature extractor within a larger model (Fig 2) encompassing a recurrent neural network. Parameters for the trained CNN were locked during this phase of training. A 512-unit dense fully connected layer served as the bridge between the CNN and the 512-unit gated recurrent unit (GRU) (17). The GRU was followed by a two-unit dense layer that output floating point values. This model processed three images in series and made its decision only after viewing all three images. In studies in which only two images were present, one of two views was randomly chosen as padding with separate data augmentation.
Figure 2:

Phase 2 of training, which represents the final model that was ultimately used to produce results from the validation set. The use of a recurrent neural network (RNN) with the gated recurrent unit (GRU) allows the three radiographs to be processed in series prior to the final output of whether the study is positive or negative for abnormality. The results from this model were reported and analyzed in the results section. CNN = convolutional neural network.
We interpreted the output values of the model after passing it through a softmax layer (14) (Appendix E1 [supplement]) by examining the scores in the positive category. We accordingly used a simple scoring system where values in the range of 0.0 to 0.5 were defined as normal, and values in the range of 0.5 to 1.0 were defined as abnormal. Values in the range of 0.25 to 0.75 were considered low confidence, and those outside this range as high confidence. The distribution of output probabilities from the training and validation sets are presented in Appendix E1 (supplement) for reference.
Statistical Analysis
We evaluated the performance of the classification algorithm on the validation set by calculating the sensitivity, specificity, positive predictive value, negative predictive value, and area under the receiver operating characteristic curve (AUC), as well as their 95% confidence intervals.
Results
The time to curate the training set was approximately 16 person-hours. Training time for phase 1 on the graphics processing unit was approximately 96 hours trained from randomly initialized weights. Training time for phase 2 on the graphics processing unit was approximately 37 hours. Evaluation time for the entire validation set of 1106 studies (3906 images) took approximately 66 seconds, with average inference speed of 21 milliseconds per image and 63 milliseconds per study.
The sensitivity, specificity, positive predictive value, negative predictive value, and their 95% confidence intervals for the validation set are detailed in Figure 3. The AUC is shown in Figure 4.
Figure 3:

Contingency table shows multiview convolutional neural network (CNN) radiographic evaluation of pediatric elbow fractures. CI = confidence interval, NPV = negative predictive value, PPV = positive predictive value.
Figure 4:
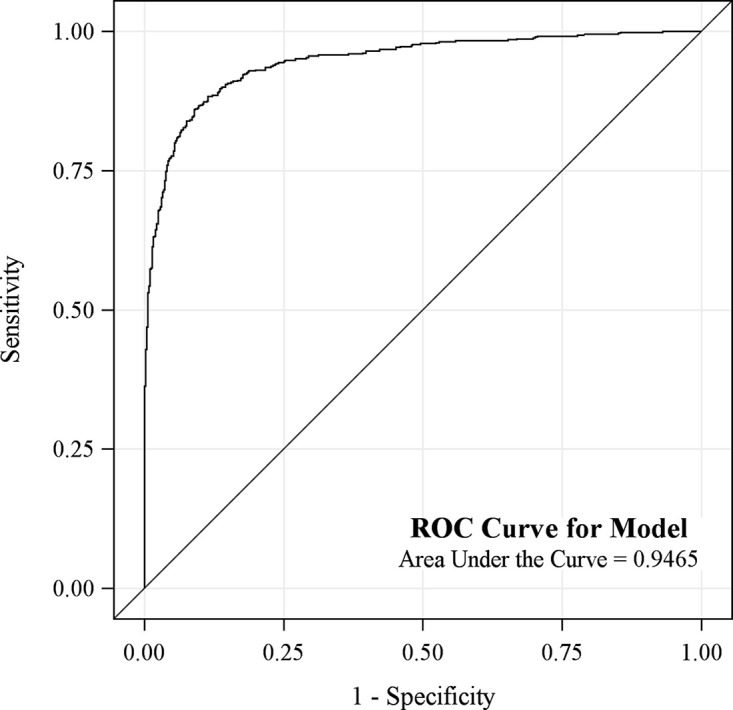
Graph shows area under the receiver operating characteristic (ROC) curve for the model was 0.95 (95% confidence interval: 0.93, 0.960).
There were a total of 54 false-negative studies, representing 4.9% of cases. Retrospective review of these false-negative studies was performed, with breakdown and further subcategorization of false-negative studies detailed in Table 2.
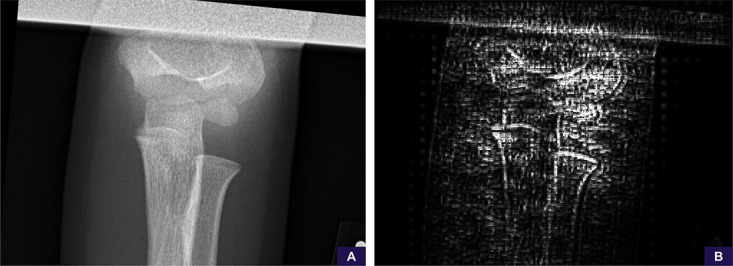
After appropriate manual cropping and magnification of the only missed cases (one each) of supracondylar and lateral condylar fractures, scores changed from negative to positive for abnormality. This was performed retrospectively and not included in our aforementioned statistics. We used guided backpropagation (18) to generate saliency maps that allowed us to further examine areas the model was attending to on the manually cropped and magnified images, and these demonstrated that the model was attentive to the specific areas of abnormality in both cases (Fig 5).
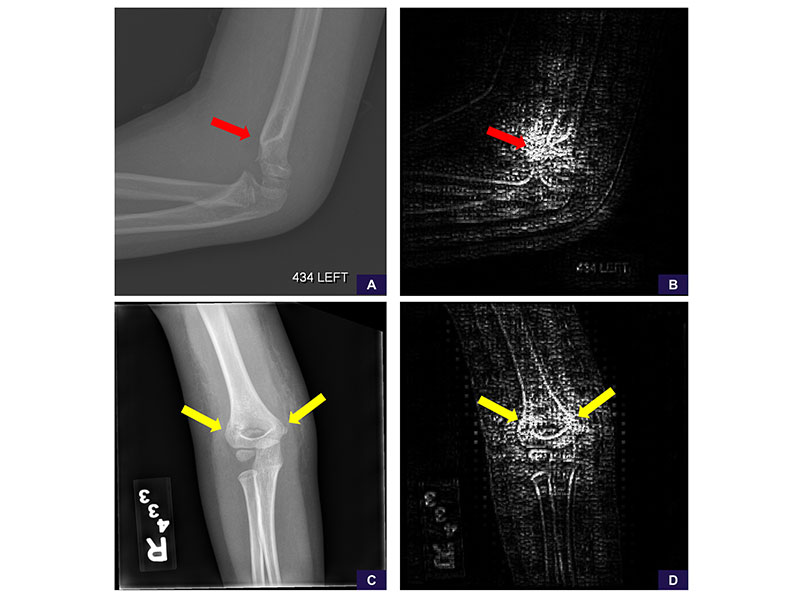
Figure 5:

False-negative supracondylar and lateral condylar fractures. These cases represented the only misses of each fracture type in our test set. A, Source anteroposterior view shows too large of a field of view to identify the supracondylar fracture line. B, Image cropped and magnified to the area of interest shows the fracture line. Reinterpretation with the magnified image increases the positivity score from 0.14 (negative, high confidence) to 0.90 (positive, high confidence). C, Saliency map based on guided backpropagation of the magnified area demonstrates the model is attentive to the healing fracture line in the lateral cortex (red arrow) and trabecular changes in the medial supracondylar region (blue arrow). D, Source anteroposterior view shows too large of a field of view to identify the lateral condylar fracture line. E, Image cropped and magnified to the area of interest shows the fracture line. Reinterpretation with the magnified image increases the positivity score from 0.44 (negative, low confidence) to 0.67 (positive, low confidence). F, Saliency map of the magnified area demonstrates that the model is attentive to the fracture line in the lateral condyle (yellow arrow).
Of the 15 missed joint effusions, all were qualified as either “small” or synonyms thereof in the original radiology report. Proximal ulna and proximal radius fractures were the next largest contributor to misses, representing 12 and 13 of the 54 misses, respectively; specifically, of the 13 radius fractures, eight were radial neck fractures.
Examples of false-negative studies below diagnostic resolution (eg, nondisplaced radial neck fractures) and rare abnormalities underrepresented in the dataset (eg, osteochondral lesions) are shown in Figure 6.
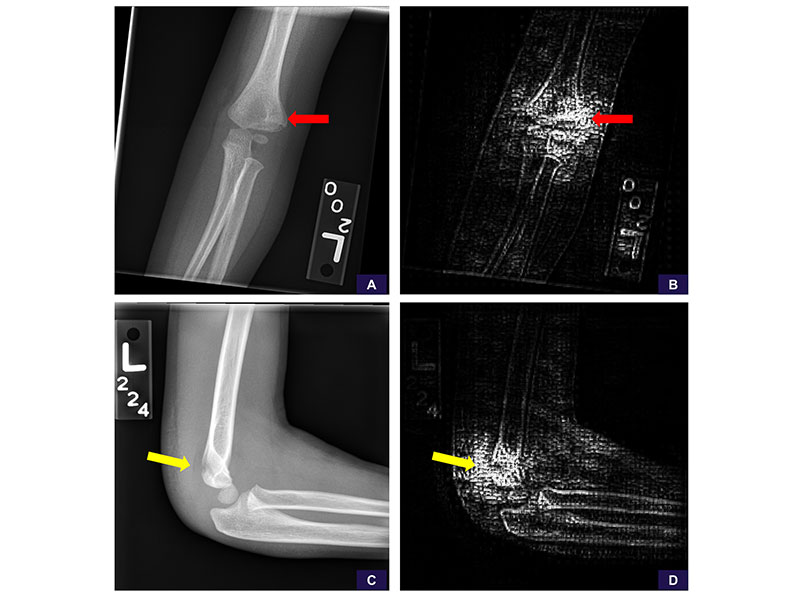
Figure 6:

False-negative examples of, A–C, rare abnormality (osteochondral lesion) and, D–F, subtle abnormality (nondisplaced radial neck fracture). A, Source anteroposterior view is sufficient to identify the osteochondral lesion (red arrow). B, Image cropped and magnified to the area of interest shows the abnormality more clearly. Reinterpretation with the magnified image has no meaningful change in positivity score from 0.25 (negative, high confidence) to 0.24 (negative, high confidence). C, Saliency map demonstrates the model is not attentive to the abnormality and is examining the cortices around the joint, ultimately concluding (falsely) that this is a negative study for abnormality. D, Source anteroposterior view shows resolution detail is insufficient to identify the radial neck fracture. E, Image cropped and magnified to the area of interest shows the radial neck fracture (blue arrow). Reinterpretation with the magnified image has no meaningful change in positivity score from 0.19 (negative, high confidence) to 0.21 (negative, high confidence). F, Saliency map demonstrates the model is not sufficiently attentive to the abnormality, focusing elsewhere and ultimately concluding (falsely) this is a negative study for abnormality.
There were a total of 82 false-positive studies representing 7.4% of cases. An example of a false-positive study related to suboptimal patient positioning is shown in Figure 7.
Figure 7:
Suboptimal positioning false-positive example. A, The anteroposterior source image demonstrates no specific findings of fracture or malalignment, although the image is noted to be suboptimally positioned and collimated. B, Saliency map demonstrates the model’s attention is scattered throughout the image without sufficient focus on any particular area. The radiographic series was ultimately scored as 0.69 (positive, low confidence).
Discussion
We demonstrated that a deep learning model trained on a robust elbow dataset exhibits an AUC of 0.95 and an accuracy of 88% in identifying acute elbow abnormality in the pediatric population at our institution. Our model achieved both a relatively high sensitivity and specificity at this task. To our knowledge, this study is the first to present use of a recurrent neural network in conjunction with a CNN to classify an entire radiographic series, rather than a single image. We found that labor-intensive data curation and annotation is not necessary for large datasets if efficient natural language processing tools are used to parse and classify existing radiology reports.
To our knowledge, our study is the first to show that machine learning has the potential to screen for elbow trauma and differentiate abnormality from normal growth centers, and this will continue to improve with further modifications of the model. We observed that the model was most accurate with the most common fracture patterns (supracondylar and lateral condylar fractures), which was to be expected given the large number of such studies in our training set. Proximal radius and ulna fractures were the next largest contributor to misses, representing 12 and 13 of the 54 misses, respectively. We did not make any attempts to augment these cohorts, as we thought the underlying problem with these fracture patterns was their subtlety of findings, requiring zooming in to identify the buckle, rather than an insufficient sample. However, for relatively rarer abnormalities such as osteochondral fractures and medial epicondyle avulsions (19), augmentation methods may be beneficial.
Multiview Approach to Radiographic Series Classification
Our model interpreted all radiographs of a case and combined salient features prior to making an interpretation with the use of a GRU, introduced by Cho et al in 2014 (17). This is analogous to how radiologists take into account all views before arriving at a diagnosis. Recurrent neural networks, and specifically the long short-term memory (20) and GRU variants, are extensively used in text sequence classification (21–23) and more recently in video classification and captioning (24–26). However, their use has been limited within radiology, with only a single paper exploring use of a long short-term memory in CT hemorrhage classification (4), and to our knowledge, none studying their use on radiographs with multiple views from a single series. This approach of synthesizing image information from multiple views is important, as it is analogous to how radiologists synthesize information from multiple views prior to generating their final interpretation in a report. This method is extensible to any radiologic study where information from multiple images is synthesized into one report, such as posteroanterior and lateral views from a chest radiograph. We think that recurrent networks will likely have continued success in various problem domains within radiology.
Application to Pediatric Musculoskeletal Radiology
To our knowledge, no studies exist demonstrating efficacy of deep learning models in pediatric musculoskeletal radiology. Chung et al demonstrated sensitivity and specificity of 99% and 97%, respectively, for binary classification of adult proximal humeral fractures from a single frontal radiograph (6). Kim and MacKinnon demonstrated distal radius fracture detection based on a lateral view only, with a sensitivity and specificity of 90% and 88%, respectively, in adult patients and excluded any patient with open growth plates (7). Unlike these studies, we chose to tackle a more complex problem by not targeting a specific type of fracture. We decided to curate our data with existing radiology reports, rather than individual image curation by an expert radiologist. The latter is both time-consuming and costly, whereas the former allowed us to leverage a larger dataset with the aid of recently published natural language processing tools (11) to minimize errors of classification. In addition, our dataset contained more complex data because we had both normal and abnormal radiographs in patients of varying ages and skeletal maturation, which led to a more heterogeneous dataset. Our resultant error rate of 12% falls within range of other published error rates of radiologist discrepancies with clinicians, peers, and second opinion radiologist metrics, which range from a low of 1.6% to a high of 41.8% (27–29).
Limitations
Limitations of our study included the fact that all cases were retrieved from a single institution, which may limit the generalizability of this study. Another limitation was the resolution to our model (500 × 500 pixels) was below the standard resolution of a radiograph viewed at a picture archiving and communication system workstation. This accordingly affected our model’s sensitivity to subtle abnormality. We theorize that a larger input image size to the model may address this problem. Another approach may be an attention mechanism if hardware limitations are to be considered, as described in recent works within the video classification and captioning literature (30–33). Improved preprocessing to better standardize images will also likely address these edge cases.
Object detection methods, which include the regions with CNNs (or R-CNN) (34) and derived variations such as the more recently published RetinaNet (35), may be useful in maximizing the areas of interest by reducing the field of view prior to classification. Our technique as implemented also cannot specify the exact location of abnormality. Subdomain decomposition methods may be necessary for solving this problem if bounding-box annotated datasets are not readily available. The use of a CNN for diagnosis is also not approved by the U.S. Food and Drug Administration or other regulatory bodies.
Another limitation was with rare abnormalities and unlikely (“zebra”) diagnoses. Certain abnormalities may only be seen a few times in the career of a radiologist, despite being known clinically and provided to the interpreting radiologist as an indication for the study. These diseases or abnormalities may only be diagnosed after a literature search and correlation with case reports and will likely continue to prove a unique challenge in applying deep learning within medicine.
Because of the anonymized nature of our dataset, we also did not account for the number of studies in the dataset that represented follow-ups in the same patient. Thus, performance on the validation set may be higher with studies represented as follow-ups of a prior fracture in the same patient. Last, our study was not powered to evaluate the degree to which age-related changes affect test performance, and this might be an area of future investigation. This would be especially interesting with common abnormalities found at uncommon ages, resulting in a relatively rarer appearance of the conventionally expected abnormality. We theorize that given the amount of information and complexity involved with the maturation of the pediatric elbow, age-related changes can also be a separate area of study with adjunct investigational potential from calculating bone age using an elbow radiograph alone.
Conclusion
Our data demonstrate that deep learning can effectively binomially classify acute and nonacute findings on pediatric elbow radiographs in the setting of trauma. To our knowledge, to date, this is the first study that has successfully identified fractures with deep learning in skeletally immature patients with open growth plates and distinguished these open growth plates from true abnormality. Uniquely, we have also applied a recurrent neural network to classify an entire radiographic series rather than single radiographic images and to arrive at a decision based on all views, as a human radiologist would.
APPENDIX
SUPPLEMENTAL FIGURES
Current address: Department of Radiology, Division of Abdominal Imaging, Massachusetts General Hospital, Boston, Mass
Current address: Department of Interventional Radiology, The University of Texas MD Anderson Cancer Center, Houston, Tex
Disclosures of Conflicts of Interest: J.C.R. disclosed no relevant relationships. N.R. disclosed no relevant relationships. J.H.K. disclosed no relevant relationships. W.Z. disclosed no relevant relationships. A.A. Activities related to the present article: disclosed no relevant relationships. Activities not related to the present article: board member and stockholder of Alzeca and Sensulin; consultant for Alzeca and Sensulin (compensation in stock or options); institution receives grants, including NIH 5R01DE024392, Gillson Longenbaugh Foundation, Texas Heart Institute, Alzeca Biosciences, NIH 1R44AG051292, NIH 1R01HD094347-01, NIH U01DE028233; honorarium for invited talk from University of Zurich and University of Massachusetts; involved in many patents related to imaging and imaging agents; money to institution for pending intellectual property. Other relationships: disclosed no relevant relationships.
Abbreviations:
- AUC
- area under the receiver operating characteristic curve
- CNN
- convolutional neural network
- GRU
- gated recurrent unit
References
- 1.Iyer RS, Thapa MM, Khanna PC, Chew FS. Pediatric bone imaging: imaging elbow trauma in children—a review of acute and chronic injuries. AJR Am J Roentgenol 2012;198(5):1053–1068. [DOI] [PubMed] [Google Scholar]
- 2.Taves J, Skitch S, Valani R. Determining the clinical significance of errors in pediatric radiograph interpretation between emergency physicians and radiologists. CJEM 2018;20(3):420–424. [DOI] [PubMed] [Google Scholar]
- 3.Paryavi E, Schwartz BS, Meyer CL, Herman MJ, Abzug JM. Reliability and effectiveness of smartphone technology for the diagnosis and treatment planning of pediatric elbow trauma. J Pediatr Orthop 2016;36(5):483–487. [DOI] [PubMed] [Google Scholar]
- 4.Grewal M, Srivastava MM, Kumar P, Varadarajan S. RADNET: Radiologist level accuracy using deep learning for hemorrhage detection in CT scans. arXiv [csCV] [preprint] https://arxiv.org/abs/1710.04934. Posted October 13, 2017. Revised January 3, 2018. Accessed June 2018.
- 5.Cheng PM, Tejura TK, Tran KN, Whang G. Detection of high-grade small bowel obstruction on conventional radiography with convolutional neural networks. Abdom Radiol (NY) 2018;43(5):1120–1127. [DOI] [PubMed] [Google Scholar]
- 6.Chung SW, Han SS, Lee JW, et al. Automated detection and classification of the proximal humerus fracture by using deep learning algorithm. Acta Orthop 2018;89(4):468–473. [DOI] [PMC free article] [PubMed] [Google Scholar]
- 7.Kim DH, MacKinnon T. Artificial intelligence in fracture detection: transfer learning from deep convolutional neural networks. Clin Radiol 2018;73(5):439–445. [DOI] [PubMed] [Google Scholar]
- 8.Choy G, Khalilzadeh O, Michalski M, et al. Current applications and future impact of machine learning in tadiology. Radiology 2018;288(2):318–328. [DOI] [PMC free article] [PubMed] [Google Scholar]
- 9.Guan X, Lee J, Wu P, Wu Y. Machine learning for exam triage. arXiv [cs.CV] [preprint] https://arxiv.org/abs/1805.00503. Posted April 30, 2018. Accessed June 2018. [Google Scholar]
- 10.Philipsen RHHM, Sánchez CI, Maduskar P, et al. Automated chest-radiography as a triage for Xpert testing in resource-constrained settings: a prospective study of diagnostic accuracy and costs. Sci Rep 2015;5(1):12215. [DOI] [PMC free article] [PubMed] [Google Scholar]
- 11.Joulin A, Grave E, Bojanowski P, Mikolov T. Bag of tricks for efficient text classification. arXiv [cs.CL] [preprint] https://arxiv.org/abs/1607.01759. Posted July 6,2016. Revised August 9, 2016. Accessed June 2018.
- 12.Chollet F. Xception: deep learning with depthwise separable convolutions. In: 2017 IEEE Conference on Computer Vision and Pattern Recognition (CVPR), 2017; 1800–1807. [Google Scholar]
- 13.Klambauer G, Unterthiner T, Mayr A, Hochreiter S. Self-normalizing neural networks. In: Guyon I, Luxburg UV, Bengio S, et al., eds. Advances in neural information processing systems 30. Barcelona: Curran Associates, 2017; 971–980. [Google Scholar]
- 14.Karpathy A. Stanford University CS231n: convolutional neural networks for visual recognition. http://cs231n.stanford.edu/syllabus.html. Published 2017. Accessed June 2018.
- 15.Kingma DP, Ba J. Adam: A method for stochastic optimization. arXiv [cs.LG] [preprint] https://arxiv.org/abs/1412.6980. Published 2014. Accessed June 2018.
- 16.Reddi SJ, Kale S, Kumar S. On the convergence of Adam and beyond. In: International Conference on Learning Representations. http://www.sanjivk.com/AdamConvergence_ICLR.pdf. Published 2018. Accessed June 2018. [Google Scholar]
- 17.Cho K, van Merrienboer B, Bahdanau D, Bengio Y. On the properties of neural machine translation: encoder-decoder approaches. arXiv [cs.CL]. [preprint] https://arxiv.org/abs/1409.1259. Posted December 22, 2014. Revised January 30, 2017. Accessed June 2018.
- 18.Springenberg JT, Dosovitskiy A, Brox T, Riedmiller M. Striving for simplicity: the all convolutional net. arXiv [cs.LG] [preprint] https://arxiv.org/abs/1412.6806. Posted December 14, 2014. Revised April 13, 2015. Accessed June 2018.
- 19.Little KJ. Elbow fractures and dislocations. Orthop Clin North Am 2014;45(3):327–340. [DOI] [PubMed] [Google Scholar]
- 20.Hochreiter S, Schmidhuber J. Long short-term memory. Neural Comput 1997;9(8):1735–1780. [DOI] [PubMed] [Google Scholar]
- 21.Karpathy A, Johnson J, Li FF. Visualizing and understanding recurrent networks. arXiv [cs.LG] [preprint] https://arxiv.org/abs/1506.02078. Posted June 5, 2015. Revised November 17, 2015. Accessed June 2018.
- 22.Johnson R, Zhang T. Supervised and semi-supervised text categorization using LSTM for region embeddings. arXiv [stat.ML] [preprint] https://arxiv.org/abs/1602.02373. Posted February 7, 2016. Revised May 26, 2016. Accessed June 2018. [PMC free article] [PubMed] [Google Scholar]
- 23.Nowak J, Taspinar A, Scherer R. LSTM recurrent neural networks for short text and sentiment classification. In: Rutkowski L, Korytkowski M, Scherer R, Tadeusiewicz R, Zadeh LA, Zurada JM, eds. Artificial Intelligence and Soft Computing. (Lecture Notes in Computer Science; vol. 10246). Cham, Switzerland: Springer International, 2017; 553–562. [Google Scholar]
- 24.Venugopalan S, Rohrbach M, Donahue J, Mooney R, Darrell T, Saenko K. Sequence to sequence-video to text. In: Proceedings of the IEEE International Conference on Computer Vision, 2015; 4534–4542. [Google Scholar]
- 25.Venugopalan S, Hendricks LA, Mooney R, Saenko K. Improving LSTM-based video description with linguistic knowledge mined from text. arXiv [cs.CL] [preprint] https://arxiv.org/abs/1604.01729. Posted April 6, 2016. Revised November 29, 2016. Accessed June 2018.
- 26.Sun J, Wang J, Yeh TC. Video understanding: from video classification to captioning. Stanford. http://cs231n.stanford.edu/reports/2017/pdfs/709.pdf. Published 2017. Accessed June 2018. [Google Scholar]
- 27.Swanson JO, Thapa MM, Iyer RS, Otto RK, Weinberger E. Optimizing peer review: a year of experience after instituting a real-time comment-enhanced program at a children’s hospital. AJR Am J Roentgenol 2012;198(5):1121–1125. [DOI] [PubMed] [Google Scholar]
- 28.Klein EJ, Koenig M, Diekema DS, Winters W. Discordant radiograph interpretation between emergency physicians and radiologists in a pediatric emergency department. Pediatr Emerg Care 1999;15(4):245–248. [PubMed] [Google Scholar]
- 29.Chalian M, Del Grande F, Thakkar RS, Jalali SF, Chhabra A, Carrino JA. Second-opinion subspecialty consultations in musculoskeletal radiology. AJR Am J Roentgenol 2016;206(6):1217–1221. [DOI] [PubMed] [Google Scholar]
- 30.Shan M, Atanasov N. A spatiotemporal model with visual attention for video classification. arXiv [cs.CV] [preprint] https://arxiv.org/abs/1707.02069. Posted July 7, 2017. Revised July 24, 2017. Accessed June 2018.
- 31.Yao L, Torabi A, Cho K, et al. Video description generation incorporating spatio-temporal features and a soft-attention mechanism. arXiv:1502 08029 [preprint] https://uk.arxiv.org/pdf/1502.08029v1.pdf. Posted 2015. Accessed June 2018.
- 32.Zanfir M, Marinoiu E, Sminchisescu C. Spatio-Temporal Attention Models for Grounded Video Captioning. In: Lai SH, Lepetit V, Nishino K, Sato Y, eds. Computer Vision – ACCV 2016. Cham, Switzerland: Springer International, 2017; 104–119. [Google Scholar]
- 33.Karpathy A, Toderici G, Shetty S, Leung T, Sukthankar R, Li FF. Large-scale video classification with convolutional neural networks. In: Proceedings of the IEEE Conference on Computer Vision and Pattern Recognition, 2014; 1725–1732. [Google Scholar]
- 34.Girshick R, Donahue J, Darrell T, Malik J. Rich feature hierarchies for accurate object detection and semantic segmentation. In: Proceedings of the IEEE Conference on Computer Vision and Pattern Recognition, 2014; 580–587. [Google Scholar]
- 35.Lin TY, Goyal P, Girshick R, He K, Dollár P. Focal loss for dense object detection. In: 2017 IEEE International Conference on Computer Vision (ICCV), 2017; 2999–3007. [Google Scholar]
Associated Data
This section collects any data citations, data availability statements, or supplementary materials included in this article.