Abstract
Angioimmunoblastic T cell lymphoma (AITL) and peripheral T cell lymphoma not-otherwise-specified (PTCL, NOS) have poor prognosis and lack driver actionable targets for directed therapies in most cases. Here we identify FYN-TRAF3IP2 as a recurrent oncogenic gene fusion in AITL and PTCL, NOS tumors. Mechanistically, we show that FYN-TRAF3IP2 leads to aberrant NF-κB signaling downstream of T cell receptor activation. Consistent with a driver oncogenic role, FYN-TRAF3IP2 expression in hematopoietic progenitors induces NF-κB-driven T cell transformation in mice and cooperates with loss of the Tet2 tumor suppressor in PTCL development. Moreover, abrogation of NF-κB signaling in FYN-TRAF3IP2-induced tumors with IκB kinase inhibitors delivers strong anti-lymphoma effects in vitro and in vivo. These results demonstrate an oncogenic and pharmacologically targetable role for FYN-TRAF3IP2 in PTCLs and call for the clinical testing of anti-NF-κB targeted therapies in these diseases.
Peripheral T cell lymphoma (PTCL) constitutes a diverse group of mature T cell neoplasms, which together add up to about 15% of non-Hodgkin lymphoma (NHL) diagnoses1. Among these, angioimmmunoblastic T cell lymphoma (AITL), a tumor of follicular helper T cell origin, is the most common discrete entity, accounting for 18.5% of PTCL cases1. Moreover, about 25% of PTCL cases do not meet diagnostic criteria to be classified in a distinct PTCL group and receive a diagnosis of PTCL, not-otherwise-specified (PTCL, NOS)1. Genome-wide mutation profiling studies have identified highly recurrent genetic alterations in TET22–4, IDH25,6, DNMT3A3,4,6–8 and RHOA3,4,6,8–10 in AITL, and a heterogeneous genetic makeup in PTCL, NOS7,11–15. In all, exome sequencing results highlight a pathogenic role for mutations inducing T cell receptor (TCR) activation3,13,14, altered RHOA signaling3,4,6,8–10, and epigenetic deregulation2–8 in the oncogenesis of PTCL. In addition, recurrent activating gene fusions involving the VAV1 oncogene are present in about 7% of PTCL, NOS samples11,12, and ITK-SYK, a druggable kinase fusion oncogene resulting from the t(5;9)(q33;q22) chromosomal translocation, can be found in some PTCL, NOS cases with follicular T cell features16–18. Despite this progress, the lack of highly prevalent actionable oncogenic drivers in AITL and PTCL, NOS has limited the impact of genomic findings in the clinic.
RESULTS
Identification of a FYN-TRAF3IP2 gene fusion in PTCL
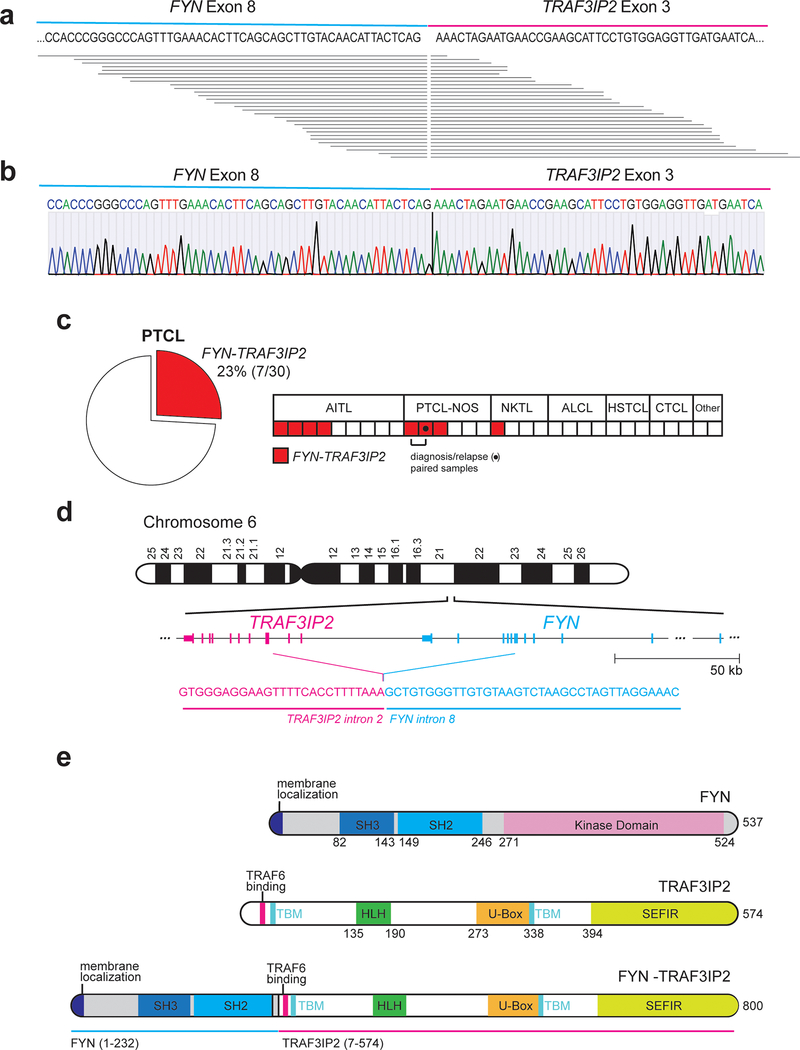
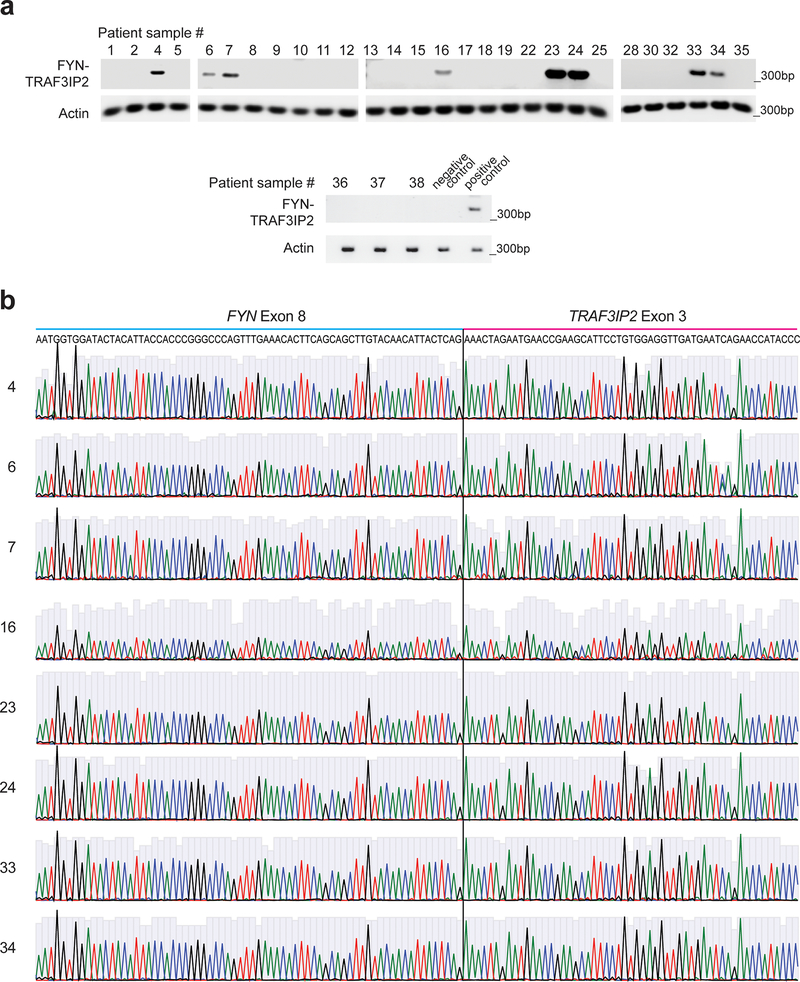
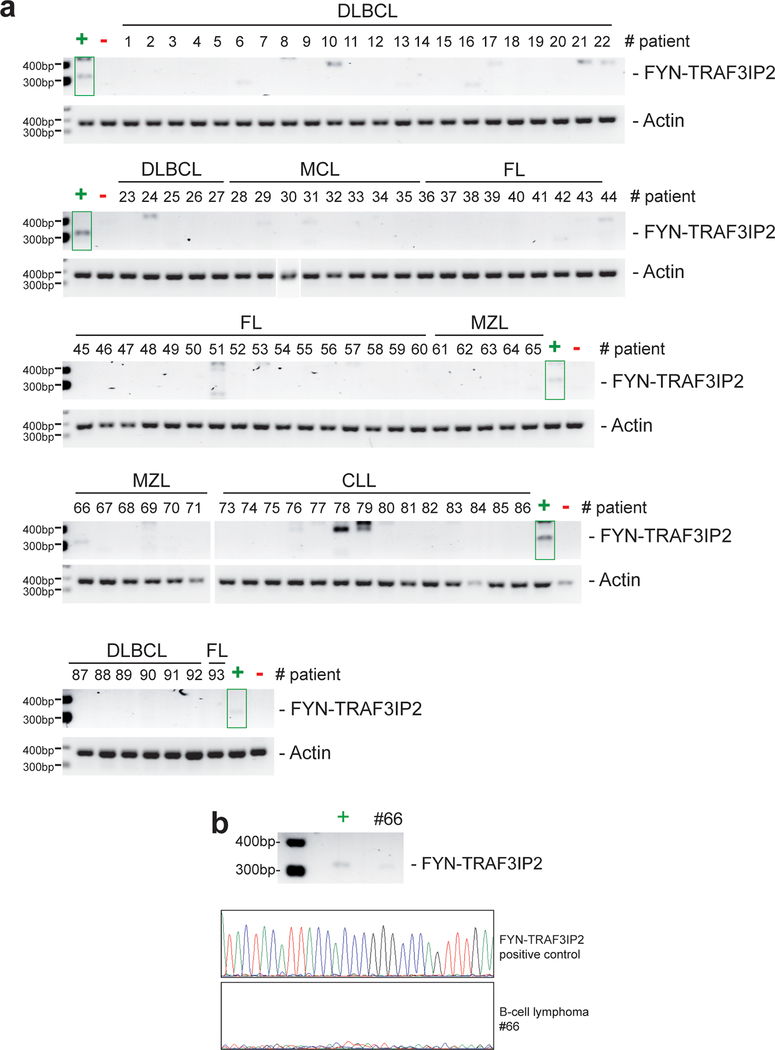
With the goal of identifying new therapeutic targets in PTCL, we investigated the presence of recurrent gene fusion events in RNAseq data in a cohort of 154 PTCL samples that include AITL (n=60) and PTCL-NOS (n=41) cases11. These analyses identified the presence of chimeric reads spanning exon 8 of FYN and exon 3 of TRAF3IP2 in two AITL cases (Supplementary Table 1) supporting expression of a recurrent FYN-TRAF3IP2 fusion joining the FYN non-receptor tyrosine kinase gene19 and TRAF3IP2, which encodes a cytoplasmic adapter signaling protein downstream of the interleukin 17 receptor (IL17R)20–22 (Fig. 1a). Reverse-transcription PCR (RT-PCR) amplification and dideoxynucleotide sequencing validated the expression of the FYN-TRAF3IP2 fusion mRNA (Fig. 1b). Given the low tumor content of many PTCL samples, which limits the sensitivity of RNAseq analyses, we performed extended evaluation of FYN-TRAF3IP2 expression by RT-PCR and sequencing of an independent panel of PTCL RNA samples (Supplementary Table 2). These analyses revealed the presence of FYN-TRAF3IP2 fusion transcripts in 7/30 patients (23%), including 4/9 AITLs, 2/5 PTCL, NOS cases and in 1/4 extranodal NK/T cell lymphoma, nasal type samples (Fig. 1c and Extended Data Fig. 1). In addition, a recurrent sample from a positive patient diagnosed with PTCL Tfh NOS also showed expression of FYN-TRAF3IP2 (Fig. 1c and Extended Data Fig. 1). Mutation profiling in this series demonstrated occurrence of recurrent mutations in TET2, IDH2, DNMT3A and RHOA in FYN-TRAF3IP2 expressing samples (Supplementary Table 3). In contrast, analysis of a representative panel of 92 mature B-cell non Hodgkin lymphomas including diffuse large B cell lymphomas (n=33), mantle cell lymphomas (n=9), follicular lymphomas (n=25), marginal zone lymphomas (n=11) and chronic lymphocytic leukemia samples (n=14) showed negative results (Extended Data Fig. 2a,b and Supplementary Table 4).
Figure 1. Identification of the FYN-TRAF3IP2 gene fusion in PTCL.
a, Schematic representation of the FYN-TRAF3IP2 fusion transcripts identified in RNAseq. Each horizontal line represents a chimeric FYN-TRAF3IP2 RNAseq read. b, Representative dideoxynucleotide sequencing result of the FYN-TRAF3IP2 cDNA from a PTCL index sample. c, Frequency and distribution across PTCL groups of samples harboring the FYN-TRAF3IP2 fusion transcript identified by RT-PCR (total patients n=30; total samples n=31, AITL, n=9; PTCL, NOS, n=6 (includes a paired diagnostic-relapse pair from same patient); extranodal NKTCL, nasal type, n=4; anaplastic T cell lymphoma, ALCL, n=4; hepatosplenic T cell lymphoma, HSTCL, n=3; cutaneous T cell lymphoma, CTCL, n=3; adult T cell leukemia/lymphoma, ATL, n=1; subcutaneous panniculitis-like T-cell lymphoma, SPTCL, n=1). d, Schematic representation of the chromosomal rearrangement event resulting in expression of the FYN-TRAF3IP2 fusion RNA and breakpoint sequence identified by whole genome sequencing of an index (RNAseq and RT-PCR positive) sample. e, Schematic representation of the structures of the FYN kinase, TRAF3IP2 protein, and FYN-TRAF3IP2 fusion protein. SH3, Src homology 3 domain; SH2, Src homology 2 domain; TBM, TRAF-binding motif; HLH, Helix-loop-helix domain; SEFIR, SEF/IL-17R signaling domain.
Structurally, FYN and TRAF3IP2 are adjacently located loci in the long arm of chromosome 6 with the TRAF3IP2 gene positioned 53.4 kb centromeric from FYN in head to tail orientation (Fig. 1d). To investigate the mechanism underlying the expression of FYN-TRAF3IP2 fusion mRNAs in PTCL, we performed deep (100x) whole genome sequencing of a FYN-TRAF3IP2-expressing AITL sample with available genomic DNA. Analysis of structural abnormalities in this sample identified a chromosome 6 gene fusion joining FYN intron 8 (Chr6:111,702,370) and TRAF3IP2 intron 2 (Chr6:111,592,704) (Fig. 1d and Supplementary Table 5). These results support that expression of the FYN-TRAF3IP2 fusion transcript identified in our RNAseq analyses in this sample is the result of transcription driven by FYN promoter sequences and splicing of FYN exon 8 into the newly adjacently positioned exon 3 of TRAF3IP2.
Functional characterization of FYN-TRAF3IP2
The chimeric protein encoded by FYN-TRAF3IP2 contains the N-terminal membrane localization motif and the SH3 and SH2 domains (aa1–232) of FYN, but not its SH1 kinase domain, in fusion with all known motifs and domains of TRAF3IP2 (aa7–574) including a helix-loop-helix domain, a U-Box domain, three putative TRAF-binding motifs and an IL-17R-associating SEFIR domain (Fig. 1e). Mechanistically, this protein configuration suggests that FYN-TRAF3IP2 could result in aberrant TRAF3IP2-mediated signaling rather than inducing oncogenic FYN kinase activity.
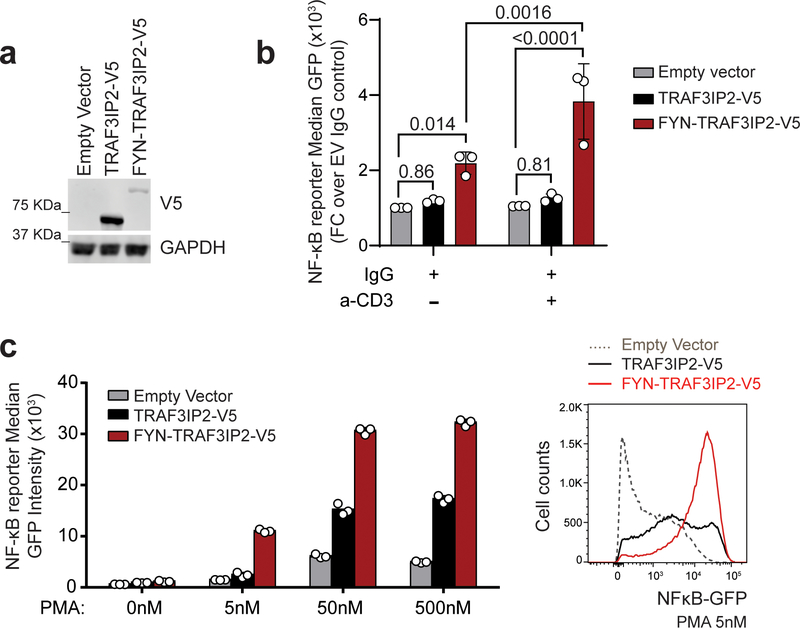
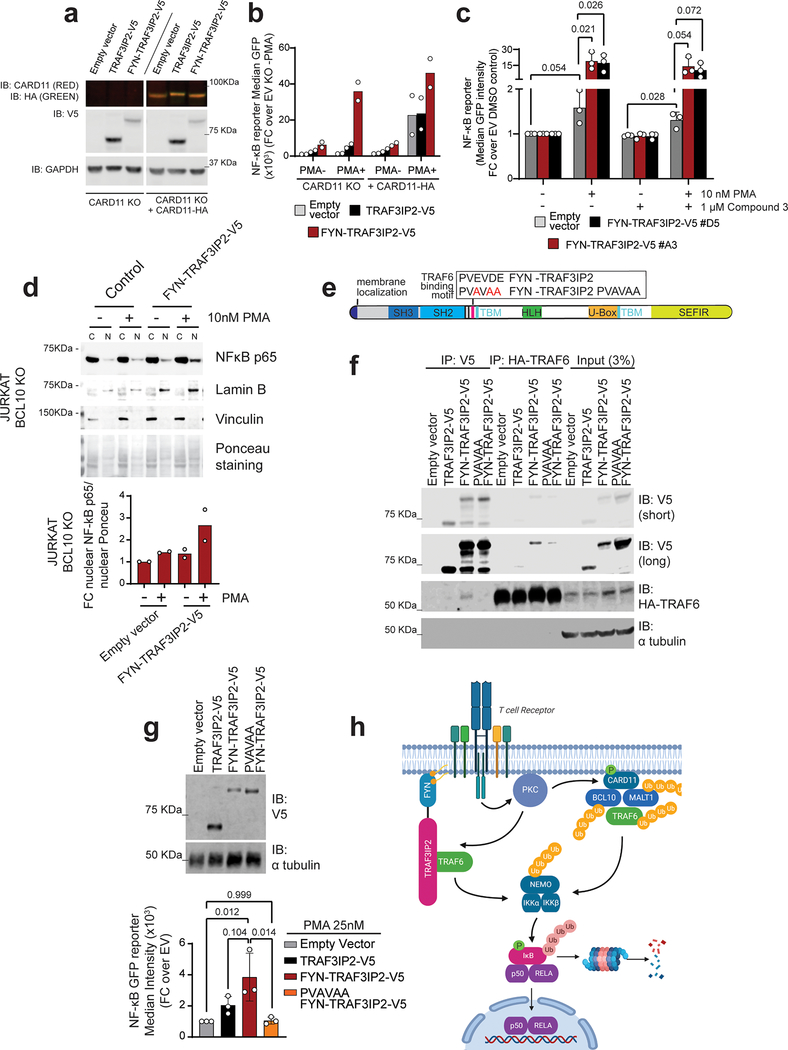
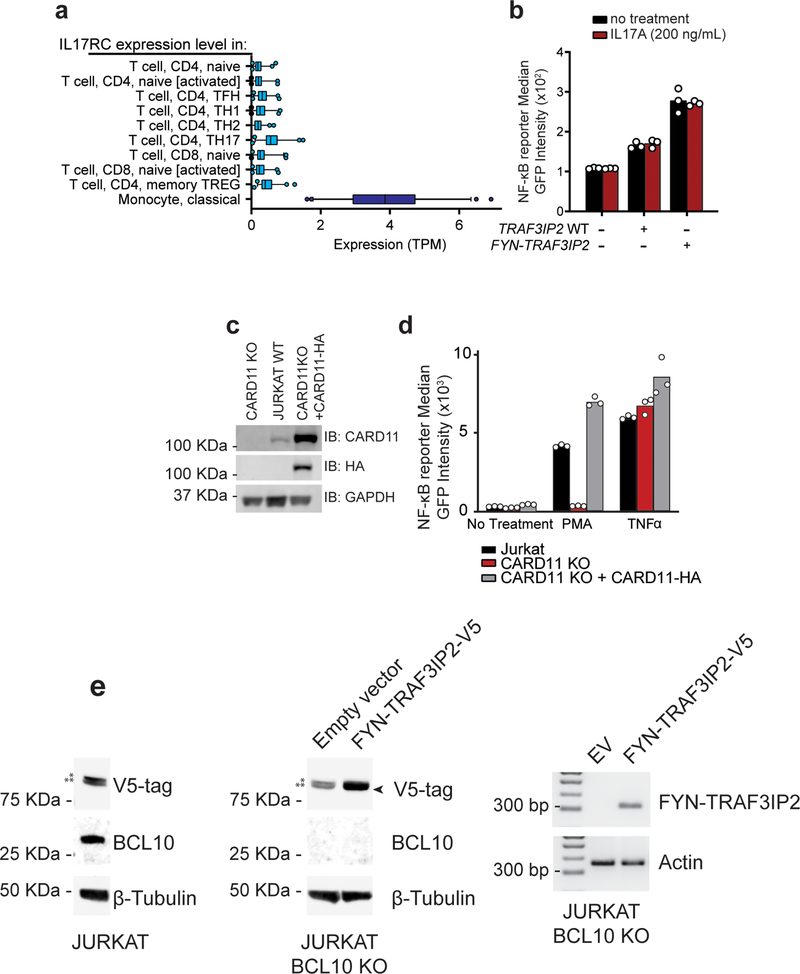
The TRAF3IP2 adaptor protein plays an important role in mediating NF-κB signaling downstream of the IL17 receptor20–22. However, IL17R is not functionally expressed in T cells (Extended Data Fig. 3a)23–25. In this context, and given the prominent role of TCR signaling as driver of PTCL proliferation and survival26, we proposed an aberrant adaptor role for FYN-TRAF3IP2 linking TCR activation to NF-κB signaling. Consistently, IL17 treatment failed to elicit increased NF-κB signaling in GFP NF-κB reporter Jurkat T cells infected with empty vector, wild type TRAF3IP2 and FYN-TRAF3IP2 expressing lentiviruses (Extended Data Fig. 3b). In contrast, TCR stimulation of FYN-TRAF3IP2-expressing Jurkat cells with an anti-CD3 antibody led to significantly increased NF-κB reporter activity compared with controls (Fig. 2a,b). Similarly, treatment with phorbol 12-myristate 13-acetate (PMA), which mimics the effects of diacylglycerol, a second messenger inducing protein kinase C (PKC) activation downstream of TCR signaling, induced markedly increased NF-κB reporter responses in FYN-TRAF3IP2-expressing Jurkat cells compared with empty vector infected controls (Fig. 2a,c). In contrast, expression of TRAF3IP2 induced only mild activation of NF-κB under stimulating conditions (Fig. 2a–c). In all, these results support a role for FYN-TRAF3IP2 as a driver of NF-κB activation downstream of TCR-induced PKC signaling in PTCL.
Figure 2. FYN-TRAF3IP2 drives NF-κB activation in response to TCR-induced PKC signaling.
a, Immunoblot analysis of Jurkat NF-κB-GFP reporter cells lentivirally transduced with empty vector or with viruses driving expression of wild type TRAF3IP2-V5 or the FYN-TRAF3IP2-V5 fusion. Expression levels were verified in 3 independent experiments. b, NF-κB-GFP reporter activity in Jurkat cells as in a after stimulation with anti-CD3 (a-CD3) antibody. Results are reported as mean of fold change over empty vector IgG control from n=3 independent experiments ± s.d. Individual values are shown as white circles. P values were calculated using two-way ANOVA and Tukey’s or Sidak’s multiple comparison test. c, NF-κB-GFP reporter activity in Jurkat cells as in a after treatment with increasing doses of PMA. Bar graphs indicate the mean of technical replicate values obtained in parallel. Individual values are shown as white circles. The experiment was performed once.
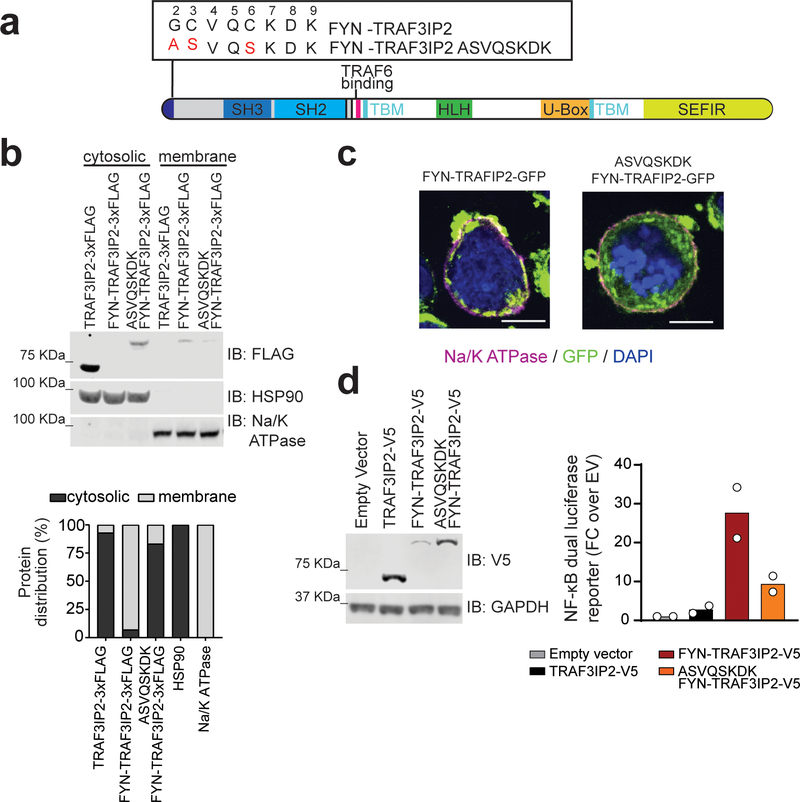
Recruitment of adaptor and signaling factors to multiprotein complexes in the plasma membrane plays an important role in TCR signal transduction27. The FYN N-terminal sequence GCVQCKDK is myristoylated (at the Gly site) and palmitoylated (at the two Cys sites) and targets localization of the FYN protein to the plasma membrane28,29 (Fig. 3a). The presence of this motif in FYN-TRAF3IP2 supports a potential role for aberrant membrane recruitment of this fusion protein in NF-κB activation. Consistently, subcellular fractionation analyses of cells expressing TRAF3IP2 or the FYN-TRAF3IP2 fusion recovered FYN-TRAF3IP2 in the membrane fraction, while wild type TRAF3IP2 was primarily located in the cytosol (Fig. 3b). Moreover, mutation (ASVQSKDK) of the FYN-TRAF3IP2 FYN membrane localization motif29 (Fig. 3a) resulted in delocalization of this fusion protein to the cytosolic compartment in Jurkat cells (Fig. 3b). Similarly, confocal analysis of C-terminal GFP-tagged proteins expressed in the Karpas-299 PTCL line showed plasma membrane localization of FYN-TRAF3IP2-GFP and a diffuse cytosolic localization pattern for ASVQSKDK FYN-TRAF3IP2-GFP (Fig. 3c). In addition, and in support of a mechanistic functional role of plasma membrane localization in FYN-TRAF3IP2-mediated signaling, introduction of the ASVQSKDK membrane localization motif mutation in FYN-TRAF3IP2 abrogated the capacity of this fusion protein to activate NF-κB in reporter assays (Fig. 3d).
Figure 3. FYN-TRAF3IP2 signaling requires membrane localization. a,
FYN-TRAF3IP2 signaling requires membrane localization. a, Schematic representation of the FYN-TRAF3IP2 fusion protein indicating the wild type and mutant membrane localization motif sequences. b, Immunoblot analysis (top) and quantification (bottom) of cytosolic and membrane-associated FLAG-tagged proteins after subcellular fractionation in Jurkat cells expressing wild type TRAF3IP2–3xFLAG, FYN-TRAF3IP2–3xFLAG, or membrane localization mutant ASVQSKDK FYN-TRAF3IP2–3xFLAG. Expression levels and fractionation controls were verified for each independent experiment. IB, immunoblot. c, Immunofluorescence analysis of cellular localization of GFP-tagged proteins in Karpas-299 cells expressing FYN-TRAF3IP2-GFP, and membrane localization mutant ASVQSKDK FYN-TRAF3IP2-GFP. GFP-tagged proteins are shown in green, the Na/K ATPase membrane marker in purple, and DAPI-stained nuclei in blue. The experiment was performed twice with similar results. Scale bar represents 10 μm. d, NF-κB dual luciferase reporter activity (right) and immunoblot analysis (left) of 293T cells transfected with empty vector or lentivirus driving expression of wild type TRAF3IP2-V5, FYN-TRAF3IP2-V5, or mutant ASVQSKDK FYN-TRAF3IP2-V5. Bar graphs indicate the mean of fold change over empty vector from n=2 independent experiments. Individual values are shown as white circles.
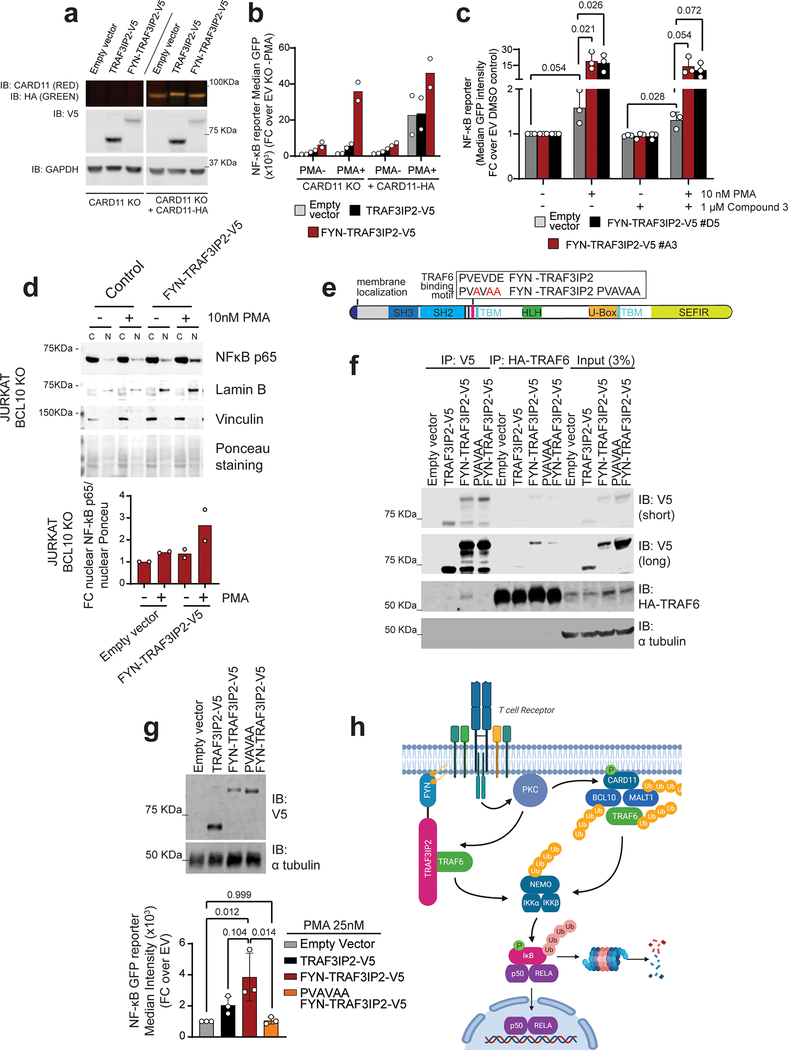
Activation of NF-κB downstream of PKCθ after TCR activation involves the assembly of a multiprotein complex containing CARD11, BCL10 and MALT1 (CBM signalosome), which upon activation, recruits and activates TRAF630. This, in turn, triggers multiple K63-linked (TRAF6 and BCL10-mediated) and M1-linear (linear ubiquitin chain assembly complex (LUBAC)-mediated) ubiquitination events, which collectively mediate phosphorylation and activation of the IKK complex30 and the degradation of the IκBα NF-κB inhibitory factor, leading to NF-κB nuclear localization and consequently, to activation of NF-κB target gene expression30. To test if FYN-TRAF3IP2 could activate NF-κB via the CBM complex, we analyzed the ability of PKC activation induced by PMA treatment to trigger expression of a NF-κB-GFP reporter in wild type and CARD11 knockout Jurkat cells31 (Extended Data Fig. 3c,d) expressing FYN-TRAF3IP2. In these experiments, empty vector control and wild type TRAF3IP2-expressing CARD11 deficient cells showed a marked impairment in NF-κB signaling triggered by PMA treatment, which was effectively rescued by lentiviral expression of CARD11-HA (Fig. 4a,b). In contrast, CARD11 knockout Jurkat cells expressing FYN-TRAF3IP2 readily activated the NF-κB-GFP reporter in response to PMA treatment (Fig. 4a,b) in support of a CARD11-independent mechanism of action.
Figure 4. FYN-TRAF3IP2-induced NF-κB activation is mediated by TRAF6.
a, Immunoblot analysis of CARD11 knockout Jurkat cells and CARD11-HA reconstituted CARD11 knockout cells infected with empty vector or lentiviruses driving expression of TRAF3IP2-V5 or the FYN-TRAF3IP2-V5 fusion. Expression levels were verified in 2 independent experiments. b, NF-κB-GFP reporter activity after stimulation with 25 nM PMA in Jurkat cells as in a. Results are shown as mean of fold change over empty vector non treated CARD11 KO cells from n=2 independent experiments with individual values (white circles). c, NF-κB-GFP reporter activity in two independently FYN-TRAF3IP2-V5 infected Jurkat cell cultures (A3 and D5) after stimulation with PMA in presence and absence of Compound 3, a specific MALT1 inhibitor. Results are reported as mean of fold change over empty vector DMSO control from n=3 independent experiments (bar) ± s.d. (error bar) with individual values (white circles). P values were calculated using unpaired two-tailed Student’s t-test. d, Western blot analysis and quantitation of the RELA/p65 NF-κB subunit nuclear translocation in BCL10 knockout Jurkat cells infected with empty vector or a FYN-TRAF3IP2-V5 expressing vector after PMA stimulation. Results are reported as mean of fold change over empty vector DMSO control from n=2 independent experiments with individual values (white circles). Expression levels were verified for each independent experiment. e, Schematic representation of the FYN-TRAF3IP2 fusion protein indicating the wild type and mutant TRAF6-binding motif. f, Western blot of immunoprecipitation experiment analyzing the interaction between HA-TRAF6 and V5-tagged proteins in 293T cells expressing wild type TRAF3IP2-V5, FYN-TRAF3IP2-V5 or PVAVAA FYN-TRAF3IP2-V5 or in the empty vector control. The experiment was performed twice with similar results. g, Immunoblot analysis of Jurkat cells transduced with empty vector or lentivirus driving expression of wild type TRAF3IP2-V5, fusion FYN-TRAF3IP2-V5, or mutant PVAVAA FYN-TRAF3IP2-V5 (top) and corresponding NF-κB-GFP reporter activity after stimulation with 25nM PMA (bottom). Bars show the mean of fold change over empty vector from n=3 independent experiments (bar) ± standard deviation (error bar) with individual values (white circles). P values were calculated using one-way ANOVA and Tukey’s multiple comparison test. h, Schematic representation of the TCR/FYN-TRAF3IP2/ NF-κB signaling axis in PTCL. IP, immunoprecipitation; IB, immunoblot.
Similarly, evaluation of NF-κB signaling in Jurkat cells expressing FYN-TRAF3IP2 and treated with Compound 3, a specific small molecule inhibitor of the MALT1 paracaspase32, showed effective activation of the NF-κB-GFP reporter in response to PMA treatment (Fig. 4c) in agreement with a MALT1-independent mechanism. In addition, BCL10 knockout Jurkat cells33 expressing FYN-TRAF3IP2 readily activated the NF-κB in response to PMA treatment as documented by increased nuclear localization of the RELA/p65 NF-κB subunit (Extended Data Fig. 3e and Fig. 4d). Interestingly, both IL17R and TCR-CBM signalosome-driven NF-κB activation engage TRAF6, upstream of IKKβ activation34. TRAF3IP2 interacts with TRAF6 via TRAF-binding motifs retained in the FYN-TRAF3IP2 fusion protein35–37(Fig. 4e), suggesting a potential role for TRAF6 in FYN-TRAF3IP2-mediated NF-κB activation. Consistent with this possibility, immunoprecipitation and western blot analyses demonstrated that, similar to wild type TRAF3IP2, the FYN-TRAF3IP2 protein can prominently interact with TRAF6 (Fig. 4f). Moreover, introduction of a disruptive focal mutation (PVAVAA)36 in the TRAF3IP2 TRAF6-binding motif of FYN-TRAF3IP2 (Fig. 4e) impaired the ability of this fusion protein to interact with TRAF6 (Fig. 4f) and its capacity to respond to PMA in Jurkat NF-κB-GFP reporter assays (Fig. 4g). Collectively, these results demonstrate a role for FYN-TRAF3IP2 as mediator of TCR-induced TRAF6-mediated NF-κB activation in PTCL (Fig. 4h).
Oncogenic role of FYN-TRAF3IP2 in PTCL
Loss-of-function TET2 mutations are recurrent genetic lesions in PTCL2–4,7,38 and can be found in association with FYN-TRAF3IP2 (Supplementary Table 1). To investigate the oncogenic activity of FYN-TRAF3IP2 we analyzed the lymphomagenic effects of expressing this gene fusion alone and in cooperation with loss of the Tet2 tumor suppressor gene in vivo. In these experiments, we first infected hematopoietic progenitors from CD4-specific tamoxifen-inducible Cre Tet2 conditional knockout mice (CD4 Cre-ERT2, Tet2fl/fl) with bicistronic retroviruses expressing wild type TRAF3IP2 and GFP, FYN-TRAF3IP2 and GFP, or GFP alone and injected these intravenously into isogenic recipients (Extended Data Fig. 4a). Transplanted mice were then treated with vehicle only, to test the oncogenic effects of TRAF3IP2, FYN-TRAF3IP2 or GFP expression; or with tamoxifen, to evaluate the effects of TRAF3IP2, FYN-TRAF3IP2 or GFP expression in concert with genetic loss of Tet2 in CD4 T cells (Extended Data Fig. 4a). In this setting, all animals transplanted with GFP-expressing progenitors remained lymphoma free at the end of follow up and one animal transplanted with wild type TRAF3IP2 GFP expressing cells developed a CD8+ T cell lymphoma (Fig. 5a,b). In contrast, and most notably, 4/10 (40%) vehicle treated mice transplanted with FYN-TRAF3IP2-expressing cells developed clonal CD4-restricted mature T cell lymphomas with a latency of 28 weeks (P = 0.012), in support of a driver oncogenic role for FYN-TRAF3IP2 in PTCL (Fig. 5a). In addition, mice transplanted with FYN-TRAF3IP2-expressing progenitors and then treated with tamoxifen to delete Tet2 in the CD4 T cell compartment showed accelerated mortality with a latency of 22 weeks, supporting a cooperative role between Tet2 loss and FYN-TRAF3IP2 in lymphoma development (Fig. 5c). By 44 weeks post-transplant, 7/10 of mice in this group were euthanized with signs of disease (P = 0.006) (Fig. 5c). Of these, 5/7 were diagnosed with CD4-positive T cell lymphoma based on histopathological and flow cytometry analyses, for an overall lymphoma penetrance of 50% (5/10) at the end of follow up (P = 0.033).
Figure 5. Expression of FYN-TRAF3IP2 in mouse hematopoietic progenitors induces PTCL NOS.
a, Kaplan-Meier survival curves of mice transplanted with bone marrow progenitor cells from CD4 Cre-ERT2 Tet2fl/fl mice retrovirally transduced to express GFP only, wild type TRAF3IP2 and GFP, or fusion FYN-TRAF3IP2 and GFP treated with vehicle (blue arrow) 8 weeks post-transplant. 10 mice were transplanted per experimental group (n=number of mice). Black arrows indicate the red blood cell immunizations. b, Splenic weight of animals at the endpoint after transplantation as in a. Red circles, GFP+ CD4+ lymphoma; black circles, no lymphoma; gray circle, GFP+ CD8+ lymphoma; horizontal line, mean value. P values were calculated using two-tailed Student’s t-test. c, Kaplan-Meier survival curves of mice transplanted with bone marrow progenitor cells from CD4 Cre-ERT2 Tet2fl/fl mice retrovirally transduced to express GFP only, wild type TRAF3IP2 and GFP, or fusion FYN-TRAF3IP2 and GFP treated with tamoxifen (red arrow) 8 weeks post-transplant. 10 mice were transplanted per experimental group (n=number of mice). Black arrows indicate the red blood cell immunizations. d, Splenic weight of animals at the endpoint after transplantation as in c. Red circles, GFP+ CD4+ lymphoma; black circles, no lymphoma; horizontal line, mean value. P values were calculated using two-tailed Student’s t-test. e, Spleens from FYN-TRAF3IP2-induced lymphoma-bearing mice (bottom) and nine representative mice that were lymphoma-free at the end of follow up (top) and representative lymph nodes from FYN-TRAF3IP2-induced lymphoma-bearing mice. f, Representative FACS plots showing GFP+ CD4+ FYN-TRAF3IP2 lymphoma cells infiltrating lymph nodes and bone marrow. g, Histological micrographs of hematoxylin-eosin stained spleen sections of immunized control mice and FYN-TRAF3IP2-induced CD4+ PTCL, NOS. Tissues from 3 mice per group showed similar results. Scale bar = 400 μm.
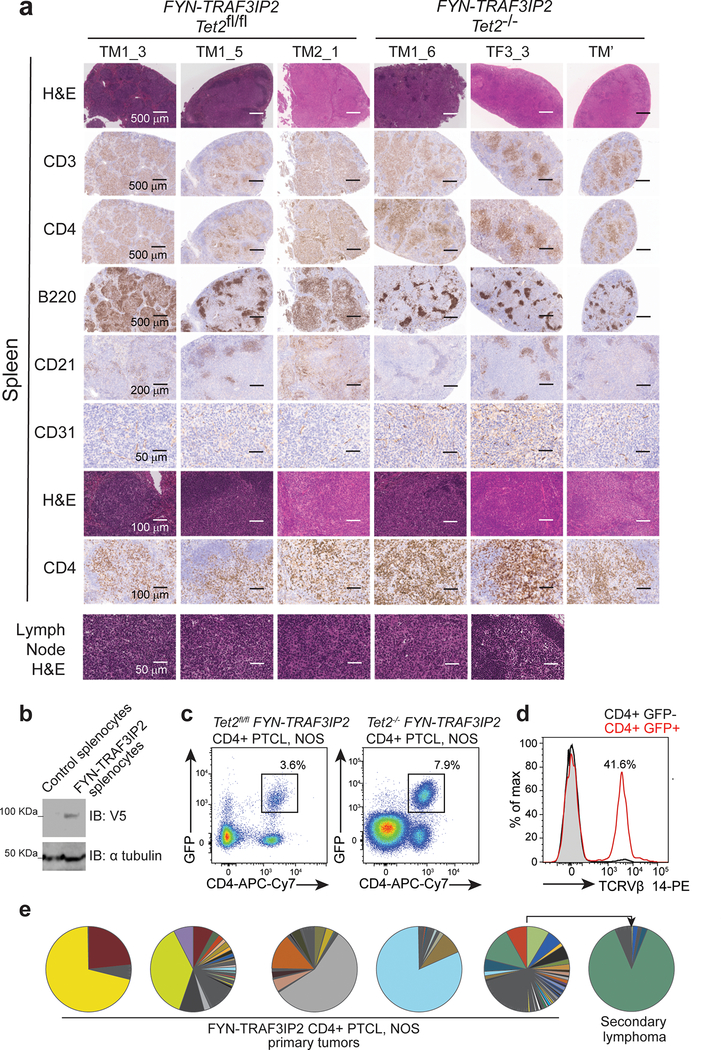
Mice harboring FYN-TRAF3IP2-induced lymphomas showed splenomegaly and generalized lymphadenopathy (Fig. 5b,d,e). Flow cytometry analysis of cells isolated from the diseased lymph nodes and bone marrow showed the presence of GFP+ cells derived from FYN-TRAF3IP2 GFP infected progenitors (Fig. 5f). Detailed histopathological examination (Supplementary Table 6) and immunohistochemical analyses of the enlarged spleen and involved lymph nodes demonstrated an infiltrate of medium to large sized neoplastic lymphocytes with prominent nucleoli and variably condensed chromatin, accompanied by a prominent polymorphous inflammatory infiltrate composed of histiocytes, plasma cells and a few neutrophils, which in the spleen involved predominantly the white pulp (forming vague nodules), with some tumors also diffusely infiltrating the red pulp and the lymph nodes showed a predominantly paracortical localization with variable extension into the medullary cords (Figs. 5g and 6a).
Figure 6. Histological and clonality features of FYN-TRAF3IP2-induced PTCL, NOS lymphomas.
a. Representative histopathologic micrographs of hematoxylin-eosin stained and immunohistochemistry analysis of T cells (CD3, CD4), B cells (B220), follicular dendritic cells (CD21) and vasculature (CD31) of spleen and lymph node of individual FYN-TRAF3IP2 Tet2fl/fl or Tet2−/− FYN-TRAF3IP2-induced lymphoma-bearing animals (n=3 in each group). Similar fields on consecutive sections are shown in rows 1–4 and rows 7–8. Scale bar and size are shown in the micrographs. b, Immunoblot analysis of FYN-TRAF3IP2-V5 protein expression in control splenocytes and in the lymphoma-infiltrated spleen of a FYN-TRAF3IP2 diseased mouse. c, Representative FACS plot showing GFP+ CD4+ lymphoma cells in lymphoma-infiltrated spleens from FYN-TRAF3IP2 diseased mice. d, Tcr Vβ clonality in FYN-TRAF3IP2 lymphoma cells (GFP+ CD4+) and normal CD4 T cells (GFP− CD4+) from a diseased mouse. e, Tcrb clonal distribution in FYN-TRAF3IP2-induced CD4+ primary tumors and in a representative allografted secondary lymphoma. Sectors represent the fraction of reads corresponding to individual Tcrb sequences.
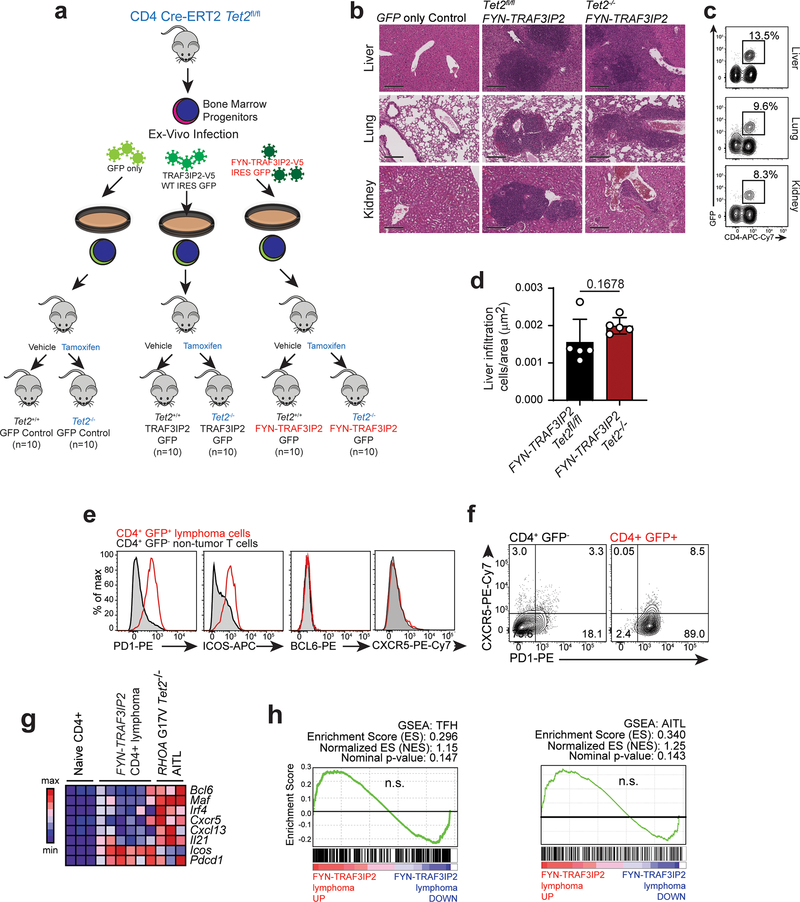
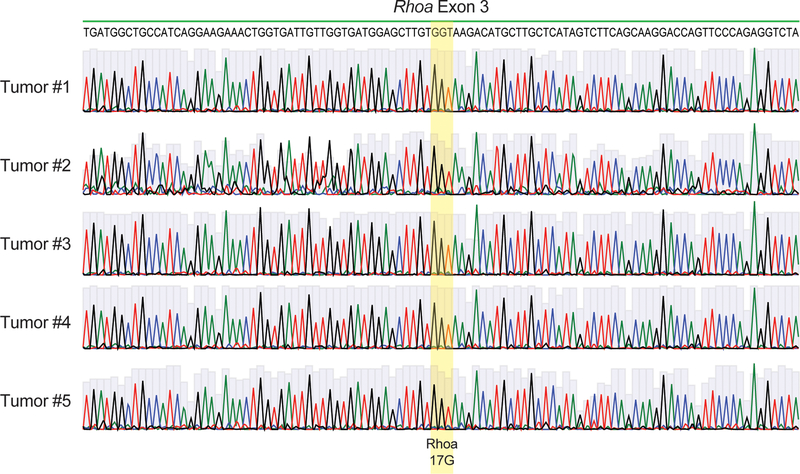
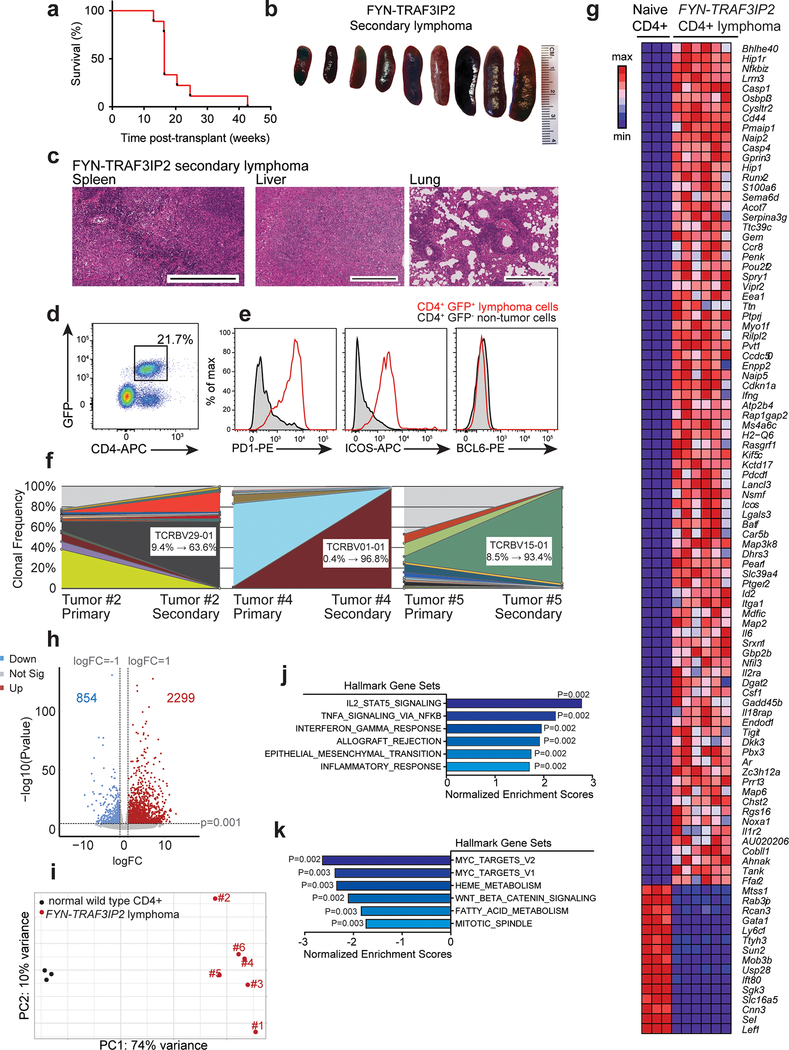
Immunoblot analysis verified the expression of the FYN-TRAF3IP2 protein in the lymphoma bearing spleens (Fig. 6b). In addition, histological and flow cytometry analyses of extranodal sites revealed infiltration of peripheral tissues including liver, kidneys and lungs by GFP+ tumor cells indicating disseminated disease (Extended Data Fig. 4b,c). Quantitative analysis of liver infiltration in animals bearing FYN-TRAF3IP2 and FYN-TRAF3IP2 Tet2-null tumors showed no difference in the nature or volume of cellular infiltration between these models (Extended Data Fig. 4d). All GFP+ FYN-TRAF3IP2 lymphoma cells showed CD4+ immunophenotype (Figs. 5f and 6c and Supplementary Fig. 1). In analyses of Tfh markers, the lymphoma cells showed upregulation of ICOS and PD1, but variable and generally limited expression of CXCR5 and BCL6 (Extended Data Fig. 4e,f and Supplementary Table 7). Consistently with immunophenotypic analyses, RNAseq profiling of FYN-TRAF3IP2 CD4+ GFP+ lymphoma cells showed transcriptional upregulation of Icos and Pdcd1, in the absence of other Tfh/AITL-associated transcripts including Bcl6, Maf, Irf4, Cxcl13 and Cxcr5, compared with normal CD4+ T cells (Extended Data Fig. 4g). GSEA analyses revealed no significant enrichment of Tfh39 and AITL40-associated gene signatures in FYN-TRAF3IP2 CD4+ GFP+ tumor cells (Extended Data Fig. 4h). In agreement, mutation analysis of Rhoa in sorted tumor T cells from 5 independent cases showed absence of the Rhoa G17V mutation associated with Tfh/AITL lymphoma in this model (Extended Data Fig. 5). Moreover, sequencing and flow cytometry analyses of the TCR repertoire of FYN-TRAF3IP2 lymphoma cells revealed clonal expansion of T cell populations (Fig. 6d,e). Finally, transplantation of splenic cells from diseased mice into secondary recipients led to accelerated development of secondary lymphomas (Extended Data Fig. 6a), which retained the histological and immunophenotypic features of the primary tumor (Extended Data Fig. 6b–e) with increased T cell clonality (Fig. 6e and Extended Data Fig. 6f). In all, these analyses support an oncogenic role for FYN-TRAF3IP2 in the development of PTCL, NOS tumors in mice.
NF-κB activation as driver and therapeutic target in FYN-TRAF3IP2 induced PTCL
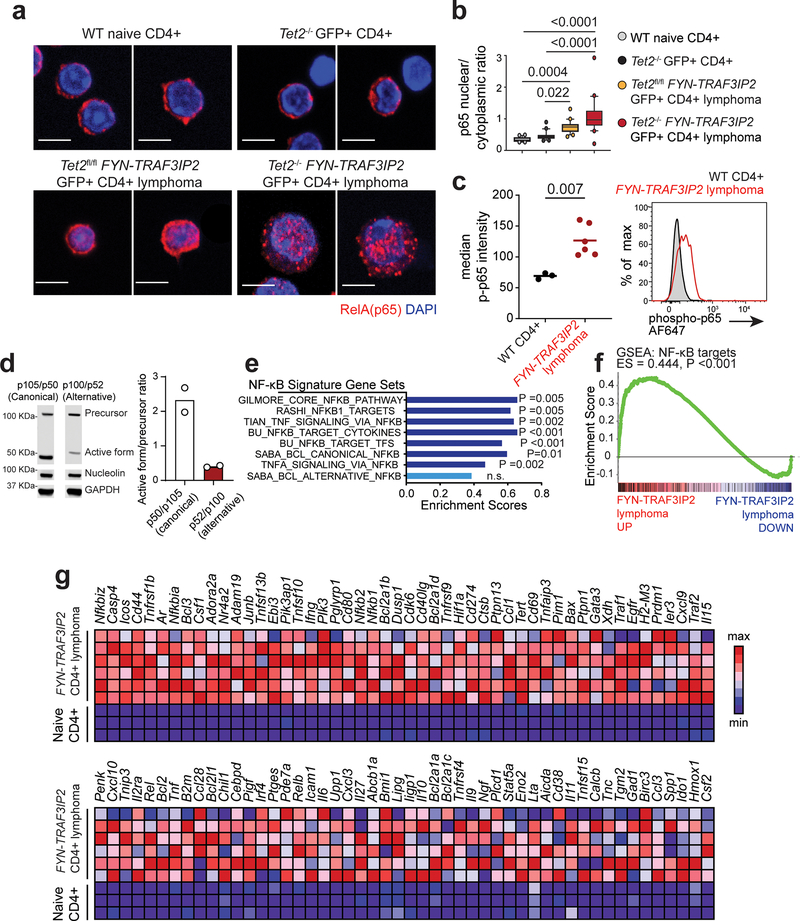
In agreement with a role of FYN-TRAF3IP2 as driver of NF-κB activation, examination of nuclear RelA/p65 NF-κB subunit in FYN-TRAF3IP2 CD4+ GFP+ mouse lymphoma cells showed clear nuclear localization pattern of NF-κB transcription factor by immunofluorescence analysis (Fig. 7a,b) and significantly increased levels of active phosphorylated p65 proteins by flow cytometry analysis (Fig. 7c). Consistently, immunoblot analysis of FYN-TRAF3IP2 Tet2−/− CD4+ GFP+ tumor cells demonstrated a high p50/p100 protein ratio indicative of active engagement of canonical NF-kB signaling and low levels of alternative NF-kB activation as evidenced by a low p52/p100 protein ratio (Fig. 7d). Moreover, transcriptomic profiling of FYN-TRAF3IP2 lymphoma tumor lymphocytes showed broad differences in gene expression (Extended Data Fig. 6g–i), which included marked enrichment of gene sets indicative of NF-κB activation, including NF-κB transcriptional targets and constitutive canonical NF-κB activation in lymphoma compared with normal CD4+ T cells 41 (Fig. 7e–g and Extended Data Fig. 6j,k).
Figure 7. NF-κB activation in FYN-TRAF3IP2-induced mouse PTCL, NOS.
a, Immunofluorescence analysis of p65 NF-κB intracellular localization in naïve CD4+ T cells, in normal GFP+ CD4+ cells from mice transplanted with Tet2−/− progenitors infected with GFP expressing retroviruses, in GFP+ Tet2f/f FYN-TRAF3IP2 CD4+ lymphoma cells and in GFP+ Tet2−/− FYN-TRAF3IP2 CD4+ lymphoma. p65 proteins shown in red and DAPI-stained nuclei in blue. 2 representative images per condition are shown. Scale bar = 5 μm. b, Quantitation (20 cells from 1 mouse per group) of p65 NF-κB intracellular nuclear/cytoplasmic localization in CD4+ cells as in a. N/C ratio, nuclear/cytoplasmic ratio. The boxplot lines represent median, boxes represent 25–75% intervals, whiskers represent 10–90% intervals and circles represent data points outside the 10–90% interval. P values were calculated using one-way ANOVA and Tukey’s multiple comparison test. c, Flow cytometry analysis of phospho-p65 NF-κB transcription factor levels in FYN-TRAF3IP2-induced CD4+ GFP+ lymphoma cells compared to wild type CD4+ T cell controls. Horizontal lines in the graph indicate the mean, and circles represent values for six independent tumors (red; two Tet2fl/fl FYN-TRAF3IP2 and four Tet2−/− FYN-TRAF3IP2 lymphomas) and three normal CD4+ T cell control samples (black). The P value was calculated using two-tailed Student’s t-test. AF647, Alexa Fluor 647. d, Western blot analysis and quantitation of canonical p105 and alternative p100 NF-κB factor precursor cleavage into active p52 and p50 forms in Tet2−/− FYN-TRAF3IP2 lymphoma cells. Results are reported as mean of n=2 independent experiments with individual values shown as white circles. Expression levels were verified for each independent experiment. e, Bar graph representation of enrichment scores for NF-κB gene signatures obtained by Gene Set Enrichment Analysis (GSEA) of differentially expressed genes associated with FYN-TRAF3IP2-induced mouse CD4+ PTCL, NOS. BCL, B-cell lymphoma. f, GSEA plot corresponding to analysis of the NF-κB target geneset of the BU Gilmore lab database as in e. g, Heat map representation of the GSEA leading edge genes from the analysis of the NF-κB target geneset of the BU Gilmore lab database as in e, f. Scale bar shows color-coded differential expression, with red indicating higher levels of expression and blue indicating lower levels of expression.
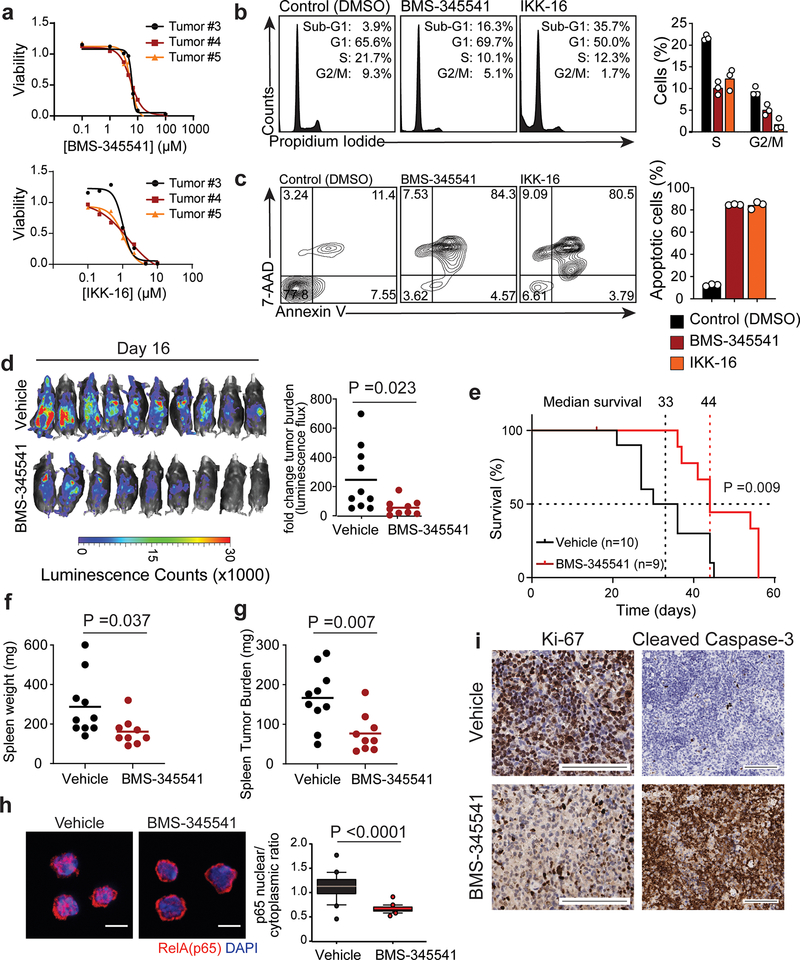
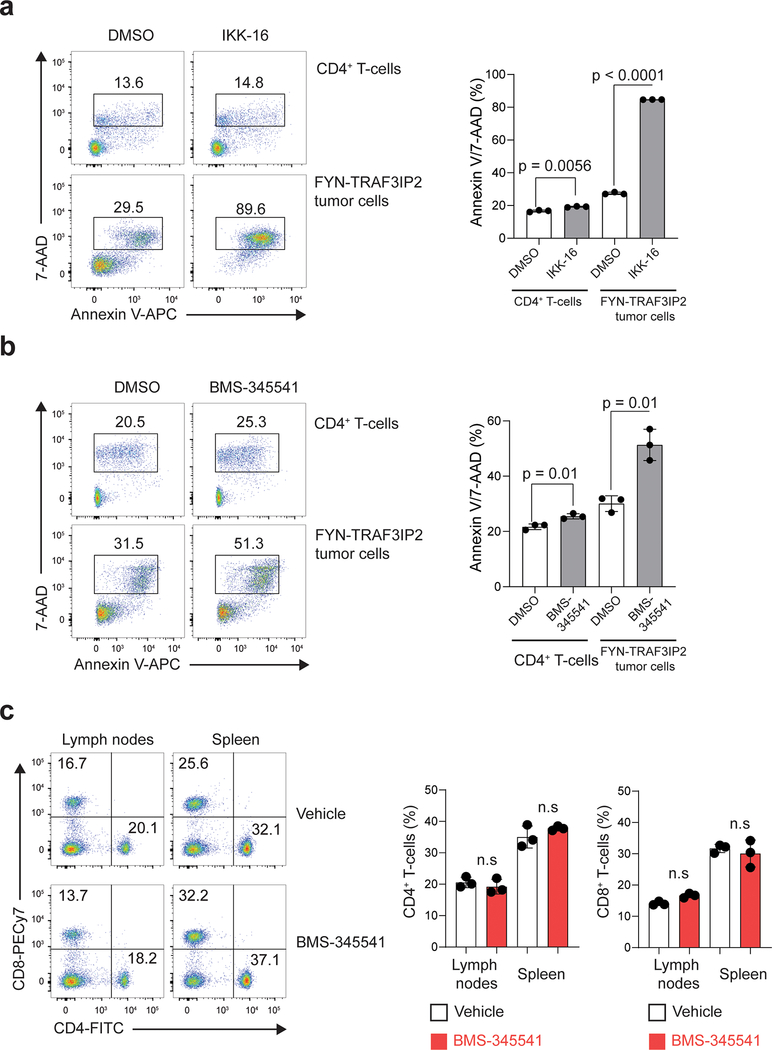
Activation of NF-κB by FYN-TRAF3IP2 in cell reporter assays and a prominent NF-κB-associated gene signature in FYN-TRAF3IP2-induced lymphomas support a driver role and potential therapeutic target for NF-κB signaling in PTCL. To test this hypothesis, we evaluated the therapeutic activity of IKK inhibitors, which block NF-κB signaling downstream of TRAF6 activation42. In vitro treatment of FYN-TRAF3IP2 mouse tumor cells with the IKK inhibitors BMS-34554143 and IKK-1644 induced strong dose-dependent anti-lymphoma effects (Fig. 8a) with G1 cell cycle arrest (Fig. 8b) and increased apoptosis (Fig. 8c). Notably, BMS-345541 and IKK-16 were markedly more cytotoxic in FYN-TRAF3IP2 mouse lymphoma T cells than in normal untransformed mouse CD4 lymphocytes (Extended Data Fig. 7a,b). To further test the antitumor activity of IKK inhibition in vivo we treated mice bearing luciferized FYN-TRAF3IP2 mouse tumors with BMS-345541, an allosteric IKK inhibitor with verified activity in vivo43 and monitored therapeutic response by in vivo bioimaging. In these experiments, IKK inhibitor treatment of FYN-TRAF3IP2 lymphomas at doses that do not induce depletion of normal T cells in lymph node and spleen (Extended Data Fig. 7c), resulted in marked anti-tumor effects (Fig. 8d) with prolonged survival (Fig. 8e) and reduced splenic tumor burden at the end of follow up (Fig. 8f,g). Mechanistically, treatment of FYN-TRAF3IP2 tumors with BMS-345541 induced suppression of NF-κB activation in vivo as evidenced by loss of RelA/p65 nuclear localization (Fig. 8h), along with decreased lymphoma cell proliferation and increased apoptosis as determined by immunohistochemical analyses of Ki67 and cleaved caspase 3, respectively (Fig. 8i). These results support a driver mechanistic role for NF-κB signaling in FYN-TRAF3IP2 tumor cell proliferation and survival and as therapeutic target for the treatment of PTCL.
Figure 8. Anti-lymphoma effects of NF-κB inhibition in FYN-TRAF3IP2-induced PTCL tumors.
a, In vitro cell viability relative to vehicle only (DMSO) controls of FYN-TRAF3IP2-induced mouse lymphoma. Data are shown as mean of technical replicates. The experiment was performed with 3 independent tumors from different mice. b, Flow cytometry analysis of cell cycle in FYN-TRAF3IP2-induced mouse lymphoma cells treated in vitro with DMSO and IC50 concentration of IKK beta inhibitors BMS-345541 (5 μM) and IKK-16 (2 μM). Results are reported as mean of technical replicate values from 1 tumor per condition (bar) with individual values shown as white circles. c, Representative FACS plots and quantitation of apoptosis as in b. d, Luciferase in vivo bioimaging analysis of response of FYN-TRAF3IP2-induced mouse lymphomas treated with vehicle or BMS-345541 (n=10 mice in the vehicle group and n=9 mice in the treatment group). Graph indicates fold changes in bioluminescence relative to the basal signal before treatment. e, Kaplan-Meier survival curve of the mice treated with BMS-345541 or vehicle as in d. The P value was calculated using the Log-rank (Mantel-Cox) test. f, Spleen weight of FYN-TRAF3IP2-induced lymphoma-bearing mice treated with vehicle only or BMS-345541 at the endpoint as in d, e. g, Splenic tumor burden as in f. h, Immunofluorescence analysis and quantitation (20 cells from 1 mouse per condition) of p65 NF-κB nuclear/cytoplasmic localization in FYN-TRAF3IP2-induced mouse lymphoma cells after treatment with vehicle or BMS-345541 in vivo. p65 protein is shown in red and DAPI-stained nuclei in blue. Scale bar = 5 μm; N/C ratio, nuclear/cytoplasmic ratio. The boxplot lines indicate the median, boxes represent 25–75% intervals, whiskers represent 10–90% intervals and circles represent data points outside the 10–90% intervals. i, Immunohistochemistry analysis of cell proliferation (Ki67) and apoptosis (cleaved caspase-3) in spleen sections of FYN-TRAF3IP2-induced lymphoma-bearing mice after treatment with vehicle only or BMS-345541. Tissues from 3 mice per group showed similar results. Scale bar = 100 μm. Horizontal lines in graphs shown in d, f, and g indicate mean and circles correspond to individual values. P values in d, f, g and h were calculated using two-tailed Student’s t-test. P value in e was calculated using the log-rank test.
Discussion
Constitutive NF-κB signaling –as result of mutations activating upstream signaling factors– is a hallmark and a validated therapeutic target in multiple myeloma and activated B cell type (ABC) diffuse large B cell lymphoma (DLBCL)45,46. In PTCL, broad NF-κB activation of potential pathogenic relevance has been proposed based on gene expression and immunohistochemical analyses of NF-κB-inducing kinase (NIK)47 and NF-κB subunits47–49. NF-κB deregulation as result of rare p100/NF-kappa B2 truncations has been described in sporadic T cell lymphoma cases50,51. Moreover, a recent mouse model of AITL occurring in the context of transgenic expression of GAPDH involved activation of alternative NF-κB signaling as a pathogenic mechanism52. However, the molecular mechanism driving deregulated NF-kB signaling in human PTCL remains largely unknown. In this context, the identification here of FYN-TRAF3IP2 as an NF-κB-activating recurrent gene fusion supports a direct driver oncogenic role for deregulated NF-κB activation in the pathogenesis of human AITL and PTCL, NOS.
Mechanistically, localization of FYN-TRAF3IP2 at the membrane rewires the TCR signal transduction pathway resulting in enhanced and dysregulated NF-κB signaling. During T-cell activation, engagement of the TCR with a target peptide presented by the major histocompatibility complex prompts PKC activation at the membrane leading to the translocation and activation of CBM complex, which in turn recruits TRAF6 to activate NF-κB signaling30. NF-κB activation by FYN-TRAF3IP2 also responds to TCR and PKC activation, but seems to redirect this input signal to directly recruit TRAF6 and activate NF-κB (Fig. 4h). Interestingly, NF-κB activation by FYN-TRAF3IP2 does not seem to require CARD11 and BCL10 or the enzymatic activity of the MALT1 paracaspase. The specific mechanisms linking TCR-PKC and FYN-TRAF3IP2 could involve recruitment of alternative signaling factors interacting with TRAF3IP2, but also proteins interacting with the SH2 and SH3 domains of FYN present in the FYN-TRAF3IP2 protein. Analysis of the oncogenic effects of FYN-TRAF3IP2 in CD4 T cell specific Card11, Bcl10 and Malt1 conditional knockout mice will be particularly informative to evaluate the requirement of the CBM complex in FYN-TRAF3IP2-induced lymphomagenesis. An interesting additional observation in our biochemical characterization of the FYN-TRAF3IP2 fusion protein worth of further investigation is that inactive mutant forms of FYN-TRAF3IP2 with impaired membrane localization and TRAF6 binding seem to be expressed at higher levels than the functionally competent intact FYN-TRAF3IP2 protein (Fig. 3b,d and Fig. 4f,g) suggesting that FYN-TRAF3IP2 signaling could be coupled with increased protein turnover.
PTCL mouse models driven by expression of Rhoa G17V53,54 and GAPDH52, develop AITL-like disease. In contrast, FYN-TRAF3IP2 mouse PTCL tumors are devoid of Rhoa mutations and recapitulate key histological and immunophenotypic features of human PTCL, NOS in support of a distinct mechanism of action.
As mentioned above, constitutive NF-κB activation is readily present in B cell lymphoma and multiple myeloma45,46 in support of a driver oncogenic role for constitutively active NF-κB in B cell transformation. However, we observed that pan-hematopoietic expression of FYN-TRAF3IP2 via transplantation of hematopoietic progenitors infected with FYN-TRAF3IP2-expressing retroviral particles specifically results in development of CD4+ T cell lymphomas, a finding potentially related to the requirement of TCR signaling to trigger FYN-TRAF3IP2-mediated NF-κB activation. This finding is in concert with the specific development of T cell lymphoma in mice with hematopoietic expression of the ITK-SYK oncogene55, which has been related to the capacity of this chimeric signaling factor to engage T-cell receptor, but not B cell receptor signals56.
Finally, and of potential clinical relevance, IKK inhibitor treatment induced marked anti-tumor effects against FYN-TRAF3IP2-induced mouse PTCLs, highlighting the role of NF-κB signaling as a driver of T-cell transformation and as therapeutic target in this disease. Despite the increased response of FYN-TRAF3IP2 lymphoma cells compared with normal lymphocytes observed in our model, treatment with IKK inhibitors has been reported to also affect the survival and function of normal T cells57. Thus, further preclinical and clinical studies are needed evaluate the safety and efficacy of NF-κB inhibition in PTCL.
Materials and Methods
Patient samples
Tumor banks at the Columbia University Medical Center (New York, New York, USA), Cornell University Medical Center (New York, NY, USA) and Hospital Clinic of Barcelona (Barcelona, Spain) provided DNA and RNA samples from PTCL and B cell tumors. Samples were obtained with written informed consent, and analysis was conducted under the supervision of the Columbia University Medical Center Institutional Review Board.
FYN-TRAF3IP2 gene fusion detection and validation
We analyzed a panel of 154 RNAseq PTCL samples generated by Illumina HiSeq paired-end sequencing as previously described11. To detect gene fusions in the data we used the ChimeraScan algorithm58, which identifies gene fusion candidates by detecting read pairs discordantly mapping to two different genes. From this analysis, we then successively reduced the candidate list by applying homology-based filters and by detecting reads spanning junction breakpoints (split reads). To further improve our search for driver oncogenic fusions, we applied the Pegasus pipeline59. Briefly, Pegasus reconstructs the entire fusion sequence and annotates lost and preserved protein domains in the gene partners. Next, the algorithm applies a pre-trained classification model to the candidate fusion to derive a probability of it being an oncogenic driver event (termed the Pegasus driver score). In-frame gene fusions with a Pegasus driver score greater than 0.5 were selected for further experimental validation.
To investigate the presence of the FYN-TRAF3IP2 fusion mRNAs in each of the index samples and in the additional independent panel of PTCL (n=31 samples including two specimens (diagnostic (sample #4) and a progression (sample #16)) for one patient, n=30 patients) and B cell tumor (n=92 samples, n=92 patients) cases, we synthesized cDNA from patient total RNA isolated from frozen PTCL biopsies using oligo(dT)20 primers and the SuperScript™ IV First-Strand Synthesis System (Invitrogen #18091050) following manufacturer’s protocol. We then PCR amplified the region flanking the fusion breakpoint using KAPA HiFi HotStart ReadyMix PCR Kit (Kapa Biosystems #KK2601) and the following primers: FYN_466–488_FWD GAAAAGATGCTGAGCGACAGC and TRAF3IP2_91–70_REV CCTCTTCCGGGGAATATTCTGG and validated the fusion transcript by dideoxynucleotide sequencing (GENEWIZ, South Plainfield, NJ) (Benchling software). We amplified actin mRNA in the same way as cDNA control using the following primers: hACTB_FWD CGACAACGGCTCCGGCATG and hACTB_REV CTGGGGTGTTGAAGGTCTCAACATG
We analyzed expression of FYN-TRAF3IP2 in Jurkat BCL10 knockout cells infected with empty vector control or FYN-TRAF3IP2-V5 expressing lentiviruses by quantitative PCR and the following primers: FYN_466–488_FWD GAAAAGATGCTGAGCGACAGC and TRAF3IP2_91–70_REV CCTCTTCCGGGGAATATTCTGG in an Applied Biosystems 7500 Real-Time PCR instrument using FastStart Universal SYBR Green Master (Rox) (Roche) following standard procedures. We amplified actin mRNA in the same way as loading control using the following primers: hACTB_FWD CGACAACGGCTCCGGCATG and hACTB_REV CTGGGGTGTTGAAGGTCTCAACATG.
We analyzed the genomic DNA extracted from a patient lymphoma biopsy harboring FYN-TRAF3IP2 fusion mRNA after deep (100x) whole genome sequencing performed by GENEWIZ on Illumina HiSeq platform following the DNA library preparation using NEBNext® Ultra™ DNA Library Prep Kit. Briefly, acoustic shearing with a Covaris LE220 instrument fragmented the genomic DNA, which was then end repaired, adenylated and ligated with adapters at the 3’ ends. Enrichment of the ligated fragments by limited cycle PCR generated the DNA library, which was validated using D1000 ScreenTape on the Agilent 4200 TapeStation (Agilent Technologies, Palo Alto, CA, USA) and was quantified using Qubit 2.0 Fluorometer and by real time PCR (Applied Biosystems, Carlsbad, CA, USA). DNA sequencing was performed on the Illumina HiSeq platform in a 2× 150 paired-end (PE) configuration using the HiSeq Control Software (HCS) on the HiSeq instrument for image analysis and base calling. Raw sequencing data (.bcl files) generated from Illumina HiSeq was converted into fastq files and de-multiplexed using Illumina’s bcl2fastq software. One mismatch was allowed for index sequence identification.
We identified structural variants (SV) from the whole genome sequencing data using LUMPY60, which integrates multiple alignment signals, including read depth, splitter and discordant reads.
Targeted mutation analysis
We performed mutation profiling by deep sequencing of 8 FYN-TRAF3IP2 PTCL samples, (including a diagnostic-progression sample pair) in a clinical cancer panel sequencing platform (Columbia Combined Cancer Panel) using Custom Agilent SureSelect capture and Illumina HiSeq2500 sequencing (Supplementary Table 8). Average sequencing depth was > 500-fold, with > 50-fold depth across >98% of targeted coding sequences.
Cell line and culture
We cultured the Jurkat T cell line (American Type Culture Collection, ATCC), Karpas-299 (Deutsche Sammlung von Mikroorganismen und Zellkulturen, DSMZ), NF-κB/Jurkat/GFP transcriptional reporter cell line (System Biosciences), and CARD11-null Jurkat JPM50.6 cell line31 (kindly provided by Dr. Andrew Snow, Uniformed Services University, Bethesda, MD), Jurkat BCL10 knockout33 (kindly provided by Dr. Brian Schaefer at Uniformed Services University, Bethesda, MD) in RPMI-1640 containing 10% FBS, 100 U/mL penicillin G, and 100 μg/mL streptomycin. We cultured the HEK293T cell line (ATCC) in DMEM supplemented with 10% FBS, 100 U/mL penicillin G, and 100 μg/mL streptomycin. We cultured the FYN-TRAF3IP2-induced murine PTCL cells in RPMI-1640 supplemented with 20% FBS, 100 U/mL penicillin G, 100 μg/mL streptomycin, 100 μM 2-mercaptoethanol and 10 ng/mL IL2 (Peprotech #200–02).
We maintained all cell cultures at 37˚C in a humidified atmosphere under 5% CO2 and regularly tested them for mycoplasma contamination.
Drugs
We purchased IL17A (#200–17) and TNFα (#300–01A) from Peprotech, phorbol 12-myristate 13-acetate (PMA; #P1585) and tamoxifen (#T5648) from Sigma-Aldrich, BMS-345541 (#S8044) and IKK-16 (#S2882) from Selleckchem, and XenoLight D-Luciferin (#122799) from Perkin Elmer. The Compound 3 MALT1 inhibitor32 was provided by Ari Melnik’s laboratory at Weill Cornell Medical Center.
Plasmid and vectors
We obtained pLX304-blast-V5 construct encoding TRAF3IP2 and CARD11 from the Broad Lentiviral Expression Library, pcDNA3 Flag-TRAF6 (#66929) from Addgene, and FUW-mCherry-Puro-Luc from 61. We cloned TRAF6 into pcDNA3.1 vector (Invitrogen #V79020) with N-terminal HA tag and mutagenized pLX304-CARD11 plasmid to switch the V5 tag into HA tag at the C-terminal using the QuikChange II XL Site-Directed Mutagenesis kit (Agilent #200522) according to the manufacturer’s instructions. We generated C-terminal GFP tagged expression constructs by cloning gene synthesis products of wild type FYN-TRAF3IP2 and the ASVQSKDK FYN-TRAF3IP2 mutant (GenScript) in the pCDH-CMV-MCS-EF1-Puro vector (System Biosciences #CD510B-1). We cloned gene synthesis products of FYN-TRAF3IP2 and TRAF3IP2 (Genewiz) into pLenti-CMV-Puro vector (Addgene #17452) for human cell line lentiviral infection experiments, into pMSCV Puro IRES GFP vector (Addgene #18751) for mouse primary cell retroviral infection experiments, and into the pcDNA3.1 vector (Invitrogen #V79020) for transient transfection experiments, with N-terminal Kozak sequence GCCACCATG and C-terminal V5. We generated the ASVQSKDK and PVAVAA mutants of FYN-TRAF3IP2 by site directed mutagenesis as described above.
Virus production and infection
We produced viral particles and infected cells by spinoculation using standard procedures.
NF-κB reporter assays
To analyze NF-κB activity in Jurkat cell line, we measured the median GFP intensity of NF-κB/Jurkat/GFP cells transduced with empty vector or stably expressing wild type TRAF3IP2, fusion FYN-TRAF3IP2, or mutant constructs by flow cytometry under basal conditions, 12 hours after stimulation with 200 ng/mL IL17, 12 hours after stimulation with antibodies against human CD3, or 6 hours after stimulation with phorbol 12-myristate 13-acetate (PMA) as indicated. To stimulate the cells with a-hCD3 antibodies, we incubated the ice-chilled cells with 0.5 μg/mL anti-hCD3 antibodies (BD Biosciences #555329) on ice for 15 minutes, washed the cells with ice-cold PBS, and resuspended the cell pellet after centrifugation in 37°C warm complete culture media with 10 μg/mL goat anti-mouse Ig (BD biosciences #553998) to 10 × 106 cells/mL. After 15 minutes of stimulation in Ig-containing media, we diluted the cell suspension to 1 × 10⁶ cells/mL in complete media and cultured the cells for 12 hours before analysis.
We similarly analyzed NF-κB reporter activity in JPM50.6 (CARD11 knockout, NF-κB-GFP reporter-expressing Jurkat31) cells by measuring median GFP intensity using flow cytometry under basal conditions or 6 hours after stimulation with 25 nM PMA or 20 ng/mL TNFα.
To analyze MALT1 contribution to NF-κB activity in the context of FYN-TRAF3IP2 signaling we pre-incubated Jurkat cells transduced with empty vector or stably expressing fusion FYN-TRAF3IP2 with 1μM Compound 3 for 30 min and then stimulated them with 10 nM PMA analyzing NF-κB activity by measuring the median GFP intensity by flow cytometry. We acquired flow cytometry data using a FACS Canto cytometer (BD Biosciences) and analyzed it using FlowJo software (TreeStar) (Supplementary Fig. 1). The results represented in the figures are biological replicates of at least three independent experiments.
To analyze NF-κB activity by transient transfection followed by dual luciferase reporter assay, we transfected HEK293T cells with 200 ng inducible NF-kB firefly luciferase reporter plasmid (Promega #E8491) and 50 ng constitutively expressed Renilla luciferase plasmid (Promega #E2231) together with 1 ng of empty pcDNA3.1 vector or pcDNA3.1 constructs encoding wild type TRAF3IP2, fusion FYN-TRAF3IP2, or mutant ASVQSKDK FYN-TRAF3IP2. We measured luciferase 24 hours after transfection in 96-well format using Dual-Luciferase Reporter Assay Kit (Promega #E1960) and Microplate Reader (Promega #9300–062) according to the manufacturer’s protocols. We analyzed data from Promega Microplate Reader using Microsoft Excel.
Cell fractionation
We generated cell lysates and performed cell fractionations using the Mem-PER™ Plus Membrane Protein Extraction Kit (Thermo Scientific #89842). For cytosolic and nuclear protein extractions, we used NE-PER™ Nuclear and Cytoplasmic Extraction Reagents (Thermo Scientific™, Pierce, #78835) following manufacture’s guidelines.
Immunoblot analysis
We separated the protein extract by SDS-PAGE and transferred to nitrocellulose membranes using standard procedures. We visualized the immunoblots using IRDye Secondary Antibodies (LI-COR biosciences) and Odyssey Infrared Imaging System (LI-COR Biosciences). We performed quantification analysis of the immunoblots using Image Studio software (LI-COR biosciences).
Immunofluorescence and confocal microscopy imaging
To analyze the cellular localization of the FYN-TRAF3IP2-GFP fusion proteins, Karpas-299 cells were fixed in 3% paraformaldehyde/2% sucrose in PBS for 15 min at room temperature and immune-stained using standard procedures. Slides were mounted with Prolong Gold Antifade Reagent containing DAPI from Thermo Fisher Scientific (#P36931). Images were acquired on a Nikon Ti Eclipse inverted microscope fitted with a PL Apo 100X/0.95 numerical aperture (NA) objective and analyzed using ImageJ software.
For mouse cells, we sorted the CD4+ or CD4+ GFP+ population accordingly and resuspended the cell pellet in 3% paraformaldehyde, 2% sucrose in PBS to fix. We attached the fixed cells on the coverslips by layering the cell suspension over the Poly-D-Lysine-coated coverslips We acquired images on Nikon Ti Eclipse inverted confocal microscope using NIS-Elements software. We prepared the images for display and quantitated the fluorescent signals using NIH ImageJ/FIJI software. To quantify p65 intensity in cytosol and nucleus, we measured the integrated density over the nuclear and cytosolic area and subtracted each by background signal (calculated by multiplying mean gray value of background times area of region of interest).
Immunoprecipitation
We transfected HEK293T cells with pcDNA3.1-HA-TRAF6 and empty vector or pcDNA3.1 constructs encoding wild type TRAF3IP2-V5, fusion FYN-TRAF3IP2-V5, or mutant PVAVAAA-FYN-TRAF3IP2-V5, using JetPEI transfection reagent (Polyplus #101–01) according to the manufacturer’s protocol. After 24 hours, we collected the cells by scraping, washed in cold 1x PBS, and lysed for 30 minutes in Immunoprecipitation Lysis buffer (50 mM Tris pH7.5. 150 mM NaCl, 1% NP40 supplemented with protease and phosphatase inhibitors). After clearing the lysate by 15 minute 15,000 x g centrifugation at 4˚C, we incubated the protein extract overnight at 4°C with either EZview Red Anti-HA Affinity gel (Sigma Aldrich #E6779) or Anti-V5 Agarose Affinity Gel (Sigma Aldrich #A7345). We then washed the beads in the Immunoprecipitation Lysis buffer and eluted the immunoprecipitates from the beads by boiling in Laemmli sample buffer before analyzing them by SDS-PAGE and immunoblotting.
Mice
We maintained all animals in filter-topped cages on autoclaved food and water in specific pathogen-free facilities at the Irving Cancer Research Center at Columbia University Medical Center campus (20–26C, 30–79% humidity, 12h light/dark cycles). All animal procedures were approved by the Institutional Animal Care and Use Committee (IACUC) at Columbia University Medical Center (Protocol # AAAU8468). The Tet2fl/fl mouse line was generously provided by Dr. Ross Levine at MSKCC (New York, NY).62 CD4CreERT2 line (Tg(Cd4-cre/ERT2)11Gnri) mice, which expresses a tamoxifen-inducible form of the Cre recombinase under the control of the mouse Cd4 promoter63, as well as Rag2 knockout mice (Rag2tm1.1Cgn/J) were purchased from Jackson Laboratories (Bar Harbor, ME). We bred Tet2fl/fl mice with CD4CreERT2 line to generate conditional inducible CD4 specific Tet2 knockout mice. Age- and sex-matched male and female mice of each genotype were used in experiments in which different genotypes were compared. For drug treatment and tumor transplant studies, age-matched female mice were randomly assigned to different treatment groups. Animal experiments were conducted in compliance with all relevant ethical regulations. Animals were euthanized upon showing symptoms of clinically overt disease (do not feed, lack of activity, abnormal grooming behavior, hunch back posture) or excessive weight loss (20% body weight loss or 10–15% over a week).
Bone marrow transplantation
To analyze the oncogenic activity of FYN-TRAF3IP2 in vivo in both wild type and Tet2-inactivated CD4 T cells, we harvested bone marrow cells from the long bones of Tet2fl/fl;CD4CreERT2 mice and isolated lineage negative cells using a magnetic bead-based, negative selection cell lineage depletion kit (Miltenyi Biotec #130–090-858) following manufacturer’s guidelines. We transduced the isolated lineage negative cells with retroviral particles encoded by pMSCV IRES GFP containing GFP only; TRAF3IP2-V5 and GFP; or FYN-TRAF3IP2-V5 and GFP. We transplanted 1.75 × 10⁵ GFP+ lineage negative cells intravenously into lethally irradiated 8 to 12 week-old isogenic C57BL/6 female mice. To induce Tet2 deletion in CD4+ T cells of mice assigned to Tet2−/− group, we treated mice transplanted with the Tet2fl/fl; CD4CreERT2 bone marrow progenitors with a single dose of tamoxifen (3 mg) at 8 weeks post-transplant, while administrating corn oil vehicle to the mice assigned to Tet2fl/fl group. To provide stimulatory signals to T cells and induce T cell proliferation, we immunized each mouse with 1×10⁸ sheep red blood cells (SRBC) (Cocalico Biologicals #20–1334A) delivered by intraperitoneal injection every 4–5 weeks for 6 cycles. To avoid the confounding factor of mortality derived from radiation-induced tumors in aged mice, we followed mice after transplantation for over 40–50 weeks. All animals were euthanized and thoroughly analyzed at this point. Two animals with non-transplant-derived GFP– disease at the end of follow up, one in the Tet2−/− TRAF3IP2-V5 group and one in the Tet2−/− FYN-TRAF3IP2-V5 group, were excluded from analyses.
Histopathology and immunohistochemistry
WE performed immunohistochemistry staining of tissue sections at performed at HistoWiz, Inc. (Brooklyn, NY). Slides were scanned using a Leica SCN 400 scanner and photomicrographs were examined with Aperio ImageScope Software (Leica Biosystems). We quantified tumor infiltration in peripheral organs using Qupath (Version: 0.2.0-m8).
Antibody staining for flow cytometry analysis
We stained single cell suspensions following standard procedures using fluorochrome-conjugated antibodies. We performed FACS sorting on SH800S cell sorter (SONY biotechnologies) using Sony Cell Sorter Software and acquired flow cytometry data using FACS Canto cytometer (BD Biosciences). We analyzed flow cytometry data using FlowJo software (TreeStar) (Supplementary Fig. 1).
T cell receptor variable beta chain (TCR Vβ) repertoire analysis
We utilized flow cytometry to analyze the TCR Vβ repertoire of the CD4+ GFP+ lymphoma population using a panel of 14 monoclonal antibodies directed against the variable (V) region of the TCRβ chain from BD Pharmigen. We assessed the clonal expansion by comparing of the TCR Vβ repertoire distribution in GFP+ CD4+ cells versus non-tumorigenic GFP-null CD4+ T cells from the same sample.
In addition, TCR Vβ repertoire analysis of genomic DNA samples by TCR sequencing was performed at Adaptive Biotechnologies, (Seattle, USA) using the mouse immunoSEQ assay.64 We analyzed TCR sequencing data using Adaptive Biotechnologies immunoSEQ analyzer proprietary software.
Tumor transplantation
We injected cell suspensions (1×10⁸ cells) extracted from lymphoma-containing spleen of diseased mice intravenously into 6 to 8 week-old female isogenic C57BL/6 wild type or Rag2 knockout immunodeficient mice.
RNAseq and gene expression profiling
RNAseq libraries were prepared and sequenced on Illumina HiSeq platform by GENEWIZ. Briefly, sequencing libraries were prepared using Illumina Nextera XT library from the full-length cDNA synthesized and amplified by SMART-Seq v4 Ultra Low Input Kit (Clontech, Mountain View, CA). Individual libraries were pooled at equimolar concentrations and sequenced to an average depth of 30 million, 150 base pair, paired-end reads per sample on an Illumina HiSeq 4000 instrument.
After trimming adapters from raw reads using Trim Galore (version 0.4.4), we aligned the reads to GRCm38.p5 with the Gencode vM16 feature annotation using STAR (version 2.7).65 reader, filtering out genes with fewer than 15 total fragments mapped and fitting a negative binomial GLM after estimating library size factors and gene count dispersions. We used the fitted GLM to test contrasts with Wald statistics and determine the log2 fold change. To plot heatmaps and visualize expression data, we used log transformed, size factor normalized gene counts.
Using javaGSEA and R, we performed Gene Set Enrichment Analysis (GSEA)66 with gene sets available in Molecular Signatures Database (MSigDB), Dr. Thomas Gilmore’s NF-κB target database (Boston University, Boston, MA) (http://www.bu.edu/nf-kb/gene-resources/target-genes/), and a previously published NF-κB signature identified in the context of B cell lymphoma41.
Rhoa mutation analysis
We analyzed Rhoa exon 3 by Sanger sequencing of PCR products amplified with the following primers: RhoAex3mur_FW TCTTAACCGCTGAGCCATCT and RhoAex3mur_Rv ACATTTTGGTCACGCTGTGT.
In vitro cell viability and pharmacological treatment assays
We measured cell growth and treatment responses of primary mouse tumors in vitro by measurement of the metabolic reduction of the tetrazolium salt MTT using the Cell Proliferation Kit I (Sigma Aldrich #11465007001). We analyzed drug treatment responses following 72 hour incubation with increasing concentrations of BMS-345541 or IKK-16 compared to DMSO controls. Dose response curves presented are representative experiments on three independent mouse tumor samples. We quantified cell viability and apoptosis by flow cytometry with Annexin V-APC (BD Biosciences #550475) and 7-AAD markers (BD Biosciences #559925) and performed cell cycle analysis by flow cytometry after Propidium Iodide (Sigma Aldrich #P4864) DNA staining.
We treated CD4+ T-cells and FYN-TRAF3IP2-induced murine PTCL cells with 2 μM IKK-16 and 2.5 μM BMS-345541 or vehicle only (DMSO) for 48 hours and measured apoptosis by flow cytometry with Annexin V-APC (BD Biosciences #550475) and 7-AAD markers (BD Biosciences #559925) as before.
In vivo pharmacological treatments
For experimental therapeutics studies, we used Tet2−/− FYN-TRAF3IP2 GFP+ PTCL, NOS tumor cells lentivirally infected with FUW-mCherry-Luc-puro to express luciferase. We transplanted luciferase-expressing lymphoma cells into Rag2 knockout mice via retro-orbital injection and monitored tumor development by in vivo luminescence bioimaging with the IVIS Spectrum In Vivo Imaging System (Perkin Elmer).
For evaluation of BMS-345541 in normal T-cell populations in vivo, we intraperitoneally administered vehicle only or BMS-345541 (25 mg per kg) to C57BL/6 mice every other day for five days and quantified T-cell population by flow cytometry after staining of single cell suspensions with anti CD4 and anti CD8 antibodies.
For acute effect study, we administered vehicle only or BMS-345541 (first dose: 60 mg/kg; second dose 12 hours later: 100 mg/kg) intraperitoneally to animals presenting homogeneous tumor burden. We sacrificed the mice for analyses 6 hours after the last treatment.
For longitudinal studies we segregated animals in two groups with even distribution of animals by tumor burden as determined by in vivo bioimaging at day 14 post-transplant and randomly assigned randomly each group to treatment with vehicle only or BMS-345541 (n=10 animals/group). One mouse in treatment group died before the treatment started. Following baseline tumor load quantification, we intraperitoneally injected BMS-345541 (25 mg/kg) or vehicle only to mice every other day for the first four weeks first and dosed them two consecutive days with one day off thereafter. We assessed the effect of BMS-345541 on overall tumor burden by in vivo bioimaging 16 days after the start of the treatment schedule, before any lymphoma-caused mortality. We measured spleen weight and quantified spleen tumor burden at endpoint considering % of GFP+ cells and spleen weight. We collected and analyzed the in vivo bioimaging data using Living Image software (Perkin Elmer). Spleen tumor burden was calculated based on organ weight and fraction of tumor infiltration: spleen weight x (tumor cells/total cells).
Statistics & Reproducibility
We conducted statistical analyses using Prism software v8.0 (GraphPad Software, La Jolla, CA, USA) and considered statistical significance at P < 0.05. We reported results as mean ± SD (standard deviation) with significance annotated by P value calculated as indicated in the figure legends, using student’s t-test assuming equal variance and normal distribution or using ANOVA and Tukey’s or Sidak’s multiple comparison test as indicated in the figure legends. For survival in mouse experiments, we represented the results as Kaplan-Meier curves and determined the significance using Log-rank test. The Investigators were not blinded to allocation during experiments and outcome assessment. The experiments were not randomized. No data were excluded from the analyses.
Data availability
DNA and RNA sequencing data that support the findings of this study have been deposited in the Genotypes and Phenotypes (dbGaP), https://www.ncbi.nlm.nih.gov/ (accession no. phs001962.v1.p1) and Gene Expression Omnibus (GEO), https://www.ncbi.nlm.nih.gov/geo/ (accession no. GSE138416) databases. Previously published data sets that were reanalyzed during this study include RNAseq data from patients with AITL and PTCL, NOS in dbGaP (accession no. phs000689.v1.p1) and in the Sequence Read Archive at the National Center for Biotechnology Information, https://www.ncbi.nlm.nih.gov/sra/ (accession no. SRP029591), as well as RNAseq data from RhoA G17V mouse AITL in GEO (accession no. GSE83918). We performed Gene Set Enrichment Analysis (GSEA) with gene sets available in Molecular Signatures Database (MSigDB) https://www.gsea-msigdb.org/gsea/msigdb, Dr. Thomas Gilmore’s NF-κB target database (Boston University, Boston, MA) (http://www.bu.edu/nf-kb/gene-resources/target-genes/).
Further information on research design is available in the Nature Research Reporting Summary linked to this article.
Source data for Fig. 2, 3, 4, 5, 7, 8 and Extended Data Fig. 3, 4, 6, 7 have been provided as Source Data files. All other data supporting the findings of this study are available from the corresponding author on reasonable request.
Extended Data
Extended Data Fig. 1: FYN-TRAF3IP2 detection by RT-PCR and dideoxynucleotide sequencing.
a, Reverse-transcription PCR (RT-PCR) amplification results of an independent panel of 31 PTCL RNA samples spanning the region of FYN-TRAF3IP2 fusion breakpoint. b, DNA sequencing chromatograms of the RT-PCR amplicons generated in a.
Extended Data Fig. 2: RT-PCR analysis of FYN-TRAF3IP2 in B cell malignancies.
a, Reverse-transcription PCR (RT-PCR) amplification results of a panel of 92 B cell malignancies RNA samples spanning the region of FYN-TRAF3IP2 fusion breakpoint. + indicates a PTCL positive control sample, - indicates a PTCL negative control sample. No PCR products corresponding to the size of the specific FYN-TRAF3IP2 amplicon were detected. b, DNA sequencing chromatogram of the RT-PCR amplicons generated in a for the positive control PTCL sample and in sample 66 which showed a weak band slightly smaller than the specific FYN-TRAF3IP2 product. Lack of priming in this sample ruled out the presence of a specific FYN-TRAF3IP2 RT-PCR product in sample 66.
Extended Data Fig. 3: Expression and functional analysis of IL17 receptor and CARD 11 dependent signaling in T cells.
a, RNA expression level of IL17RC, essential for a functional IL17 receptor68, in T cells and monocytes represented from DICE (Database of Immune Cell Expression, Expression quantitative trait loci and Epigenomics). b, NF-κB-GFP reporter activity in transduced Jurkat cells after stimulation with 200 ng/mL IL17A. Results are reported as mean of technical replicate values (bar) from 1 independent experiment with individual values (white circles), n=1. c, Immunoblot analysis of JPM50.6 CARD11 knockout and JPM50.6 cells reconstituted by CARD11-HA expression. Expression levels were verified for each independent experiment. d, NF-κB-GFP reporter activity after stimulation with 25 nM of PMA or 20 ng/mL TNFα as in c. e, Western blot analysis of FYN-TRAF3IP2-V5 and BCL10 expression in Jurkat cells and Jurkat BCL10 knockout cells infected with empty vector or FYN-TRAF3IP2-V5 expressing lentiviruses; and RT-PCR analysis of FYN-TRAF3IP2-V5 mRNA in the same Jurkat BCL10 knockout cells infected with empty vector or FYN-TRAF3IP2-V5 expressing lentiviruses. * and ** indicate non-specific bands detected by the V5 antibody, while the arrowhead indicates the location of the specific FYN-TRAF3IP2-V5 band detected with the same antibody. Expression levels were verified for each independent experiment.
Extended Data Fig. 4: Generation and characterization of FYN-TRAF3IP2-induced mouse PTCL.
a. We transduced hematopoietic progenitors from CD4 Cre-ERT2 Tet2fl/fl mice with bicistronic retroviruses driving the expression of GFP, FYN-TRAF3IP2-V5 and GFP or wild type TRAF3IP2-V5 and GFP. We intravenously transplanted the infected cells into lethally irradiated C57BL/6 recipient mice and treated them 8 weeks post-transplant with vehicle only or with tamoxifen to preserve or delete Tet2 in CD4+ T cells, respectively. These cohorts of mice were then immunized with sheep red blood cells every 4–5 weeks to induce peripheral T cell activation. b, Representative histological micrographs of hematoxylin-eosin stained liver, lung, and kidney of Tet2fl/fl or Tet2−/− FYN-TRAF3IP2-induced lymphoma-bearing animals and the GFP only control. Tissues from 3 mice per group showed similar results. Scale bar = 200 μm. c, Representative FACS plots of mononuclear cells collected from liver, lung, and kidney of FYN-TRAF3IP2-induced lymphoma-bearing animals, showing GFP+ CD4+ cell infiltration. d, Quantitative analysis of lymphoma liver infiltration in FYN-TRAF3IP2 Tet2fl/fl and FYN-TRAF3IP2 Tet2−/− tumors. Results are reported as mean of values (bar) ± standard deviation (error bar) with individual values (white circles), n=5 (5 tumors from 5 different mice per condition). The P value was calculated using two-tailed Student’s t-test. e, Representative flow cytometry analyses of PD1, ICOS, BCL6 and CXCR5 Tfh cell marker expression in CD4+ GFP+ spleen tumor cells compared to CD4+ GFP− non-tumor cells from the same spleen. f, Flow cytometry analysis of PD1 and CXCR5 Tfh cell marker expression in CD4+ GFP− non-tumor cells and CD4+ GFP+ tumor cells from a representative FYN-TRAF3IP2-induced lymphoma-bearing spleen. g, Heatmap representation of Tfh-associated marker expression in CD4+ naïve wild type T cells, FYN-TRAF3IP2-induced CD4+ GFP+ lymphoma cells and RHOA G17V Tet2−/− AITL-like mouse tumor cells53. h, GSEA enrichment plots of differentially expressed genes associated with FYN-TRAF3IP2-induced mouse lymphoma cells compared to wild type naïve CD4+ T cells. AITL geneset: top differentially upregulated genes in AITL compared with PTCL, NOS (fold change 1.5, p <0.002)38. Tfh geneset: top 100 genes associated with Tfh cells37.
Extended Data Fig. 5: Analysis of the Rhoa G17V mutation in FYN-TRAIF3I2-induced mouse PTCL samples.
DNA chromatograms corresponding to the sequence of Rhoa exon 3 in DNA from tumor CD4+ T cells sorted from five independent FYN-TRAIF3I2-induced lymphomas. Highlighted area indicates the sequence corresponding to Rhoa codon 17 which is wild type (G17) in every case. No mutations were detected in these analyses.
Extended Data Fig. 6: Characterization of FYN-TRAF3IP2-induced mouse PTCL: transplantability and transcriptional profiling.
a, Kaplan-Meier survival curve of 9 mice transplanted with cell suspension containing FYN-TRAF3IP2 GFP+ lymphoma infiltrate. b, Spleens of secondary recipients transplanted with FYN-TRAF3IP2-induced lymphoma infiltrate. c, Representative histological micrographs of H&E stained spleen, liver, and lung of lymphoma transplanted mice at the endpoint showing lymphoma infiltration. Tissues from 3 mice showed similar results. Scale bar = 400 μm. d, Representative FACS plot showing GFP+ CD4+ lymphoma infiltrates in spleens from diseased secondary recipients. e, Representative flow cytometry analyses of PD1, ICOS and BCL6 Tfh cell marker expression in CD4+ GFP+ spleen tumor cells compared to CD4+ GFP− non-tumor cells from the same spleen. f, Tcrb gene clonal analysis of three secondary Tet2−/− FYN-TRAF3IP2 GFP+ lymphomas illustrated by side-by-side representation of Tcrb sequence reads from primary and secondary Tet2−/− FYN-TRAF3IP2 GFP+ lymphomas, indicating the retention and expansion of specific lymphoma clone with unique Tcrb rearrangements after transplantation. g, RNAseq data of six independent FYN-TRAF3IP2-induced mouse CD4+ GFP+ lymphomas and wild type isogenic mouse naïve CD4+ T cells represented as heat map of the unselected top 100 differentially expressed genes between FYN-TRAF3IP2-induced tumors and wild type CD4+ naïve T cells (mouse genes without known human orthologues excluded; scale bar shows color-coded differential expression, with red indicating higher levels of expression and blue indicating lower levels of expression). h, Volcano plot of all differentially expressed genes as in g (P value <0.001 and |log2(fold change)|> 1 deemed significant). Blue, significantly downregulated genes. Red, significantly upregulated genes. The number of significantly downregulated or upregulated genes is indicated. i, Principal component analysis plot of RNAseq data as in g. j-k, GSEA analyses of differentially expressed genes associated with FYN-TRAF3IP2-induced mouse lymphomas based on the RNAseq data and the Hallmark signatures69 from MSigDB. The top 6 upregulated signatures j and top 6 downregulated signatures k are represented as bar graphs of normalized enrichment scores and P values.
Extended Data Fig. 7: IKK inhibitor treatment in normal T-cells.
a, Representative flow cytometry plot and quantification of the analysis of apoptosis in normal CD4+ T cells and CD4 FYN-TRAF3IP2 lymphoma cells treated with vehicle only (DMSO) or the IKK16 inhibitor. b, Representative flow cytometry plot and quantification of analysis of apoptosis in normal CD4+ T cells and CD4 FYN-TRAF3IP2 lymphoma cells treated with vehicle only (DMSO) or the BMS345541 IKK inhibitor. c, Representative flow cytometry plot and quantification of normal lymphocytes in spleen and lymph nodes of mice treated with vehicle only or with the BMS-345541 IKK inhibitor in vivo. Results are reported as mean of replicate values from 3 mice (bar) ± standard deviation (error bar) with individual values (black circles), n=3. P values were calculated using two-tailed Student’s t-test.
Supplementary Material
Acknowledgements
We would like to thank Dr. Ross Levine (Memorial Sloan-Kettering Cancer Center, New York, NY) for kindly providing the Tet2f/f mouse line and the Digital Computational Pathology Laboratory in the Department of Pathology and Cell Biology at Columbia University Irving Medical Center. This work was supported by the St. Baldrick’s Foundation (AAF), the NIH grants P30 CA013696 (Confocal and Specialized Microscopy Shared Resource, Molecular Pathology Shared Resource, Oncology Precision Therapeutics and Imaging Core (OPTIC), Flow Cytometry Shared Resource, Genomics Shared Resource, Herbert Irving Comprehensive Cancer Center), R01 CA197945 (TP), R35 CA210065 (AF), R01 CA206501(AF), R01 CA185486 (RR), R01 CA179044 (RR), U54 CA121852 (RR), F30 CA225052 (CK), the Stewart Foundation (RR), the Leukemia & Lymphoma Society grants TRP-6507-17 (TP), TRP- 6163-12 (AF) and Special Fellow Award 3395-20 (SA), and the Spanish Ministerio de Ciencia, Innovación y Universidades grant RTI2018-094274-B-I00 (EC). EC is an Academia Researcher of the “Institució Catalana de Recerca i Estudis Avançats (ICREA)” of the Generalitat de Catalunya. JRC is supported by a Lady Tata Memorial Trust fellowship.
Footnotes
Competing Interests
The authors declare no competing interests.
References
- 1.Vose J, Armitage J & Weisenburger D International peripheral T-cell and natural killer/T-cell lymphoma study: pathology findings and clinical outcomes. J Clin Oncol 26, 4124–30 (2008). [DOI] [PubMed] [Google Scholar]
- 2.Quivoron C et al. TET2 inactivation results in pleiotropic hematopoietic abnormalities in mouse and is a recurrent event during human lymphomagenesis. Cancer Cell 20, 25–38 (2011). [DOI] [PubMed] [Google Scholar]
- 3.Palomero T et al. Recurrent mutations in epigenetic regulators, RHOA and FYN kinase in peripheral T cell lymphomas. Nat Genet 46, 166–70 (2014). [DOI] [PMC free article] [PubMed] [Google Scholar]
- 4.Sakata-Yanagimoto M et al. Somatic RHOA mutation in angioimmunoblastic T cell lymphoma. Nat Genet 46, 171–5 (2014). [DOI] [PubMed] [Google Scholar]
- 5.Cairns RA et al. IDH2 mutations are frequent in angioimmunoblastic T-cell lymphoma. Blood 119, 1901–3 (2012). [DOI] [PMC free article] [PubMed] [Google Scholar]
- 6.Wang C et al. IDH2R172 mutations define a unique subgroup of patients with angioimmunoblastic T-cell lymphoma. Blood 126, 1741–52 (2015). [DOI] [PMC free article] [PubMed] [Google Scholar]
- 7.Couronne L, Bastard C & Bernard OA TET2 and DNMT3A mutations in human T-cell lymphoma. N Engl J Med 366, 95–6 (2012). [DOI] [PubMed] [Google Scholar]
- 8.Yoo HY et al. A recurrent inactivating mutation in RHOA GTPase in angioimmunoblastic T cell lymphoma. Nat Genet 46, 371–5 (2014). [DOI] [PubMed] [Google Scholar]
- 9.Manso R et al. The RHOA G17V gene mutation occurs frequently in peripheral T-cell lymphoma and is associated with a characteristic molecular signature. Blood 123, 2893–4 (2014). [DOI] [PubMed] [Google Scholar]
- 10.Odejide O et al. A targeted mutational landscape of angioimmunoblastic T-cell lymphoma. Blood 123, 1293–6 (2014). [DOI] [PMC free article] [PubMed] [Google Scholar]
- 11.Abate F et al. Activating mutations and translocations in the guanine exchange factor VAV1 in peripheral T-cell lymphomas. Proc Natl Acad Sci U S A 114, 764–769 (2017). [DOI] [PMC free article] [PubMed] [Google Scholar]
- 12.Boddicker RL et al. Integrated mate-pair and RNA sequencing identifies novel, targetable gene fusions in peripheral T-cell lymphoma. Blood 128, 1234–45 (2016). [DOI] [PMC free article] [PubMed] [Google Scholar]
- 13.Rohr J et al. Recurrent activating mutations of CD28 in peripheral T-cell lymphomas. Leukemia 30, 1062–70 (2016). [DOI] [PMC free article] [PubMed] [Google Scholar]
- 14.Vallois D et al. Activating mutations in genes related to TCR signaling in angioimmunoblastic and other follicular helper T-cell-derived lymphomas. Blood 128, 1490–502 (2016). [DOI] [PubMed] [Google Scholar]
- 15.Watatani Y et al. Molecular heterogeneity in peripheral T-cell lymphoma, not otherwise specified revealed by comprehensive genetic profiling. Leukemia (2019). [DOI] [PubMed] [Google Scholar]
- 16.Attygalle AD, Feldman AL & Dogan A ITK/SYK translocation in angioimmunoblastic T-cell lymphoma. Am J Surg Pathol 37, 1456–7 (2013). [DOI] [PubMed] [Google Scholar]
- 17.Huang Y et al. Peripheral T-cell lymphomas with a follicular growth pattern are derived from follicular helper T cells (TFH) and may show overlapping features with angioimmunoblastic T-cell lymphomas. Am J Surg Pathol 33, 682–90 (2009). [DOI] [PMC free article] [PubMed] [Google Scholar]
- 18.Streubel B, Vinatzer U, Willheim M, Raderer M & Chott A Novel t(5;9)(q33;q22) fuses ITK to SYK in unspecified peripheral T-cell lymphoma. Leukemia 20, 313–8 (2006). [DOI] [PubMed] [Google Scholar]
- 19.Palacios EH & Weiss A Function of the Src-family kinases, Lck and Fyn, in T-cell development and activation. Oncogene 23, 7990–8000 (2004). [DOI] [PubMed] [Google Scholar]
- 20.Chang SH, Park H & Dong C Act1 adaptor protein is an immediate and essential signaling component of interleukin-17 receptor. J Biol Chem 281, 35603–7 (2006). [DOI] [PubMed] [Google Scholar]
- 21.Li X et al. Act1, an NF-kappa B-activating protein. Proc Natl Acad Sci U S A 97, 10489–93 (2000). [DOI] [PMC free article] [PubMed] [Google Scholar]
- 22.Qian Y et al. The adaptor Act1 is required for interleukin 17-dependent signaling associated with autoimmune and inflammatory disease. Nat Immunol 8, 247–56 (2007). [DOI] [PubMed] [Google Scholar]
- 23.Gaffen SL Structure and signalling in the IL-17 receptor family. Nature Reviews Immunology 9, 556 (2009). [DOI] [PMC free article] [PubMed] [Google Scholar]
- 24.Ishigame H et al. Differential roles of interleukin-17A and −17F in host defense against mucoepithelial bacterial infection and allergic responses. Immunity 30, 108–19 (2009). [DOI] [PubMed] [Google Scholar]
- 25.Kuestner RE et al. Identification of the IL-17 receptor related molecule IL-17RC as the receptor for IL-17F. J Immunol 179, 5462–73 (2007). [DOI] [PMC free article] [PubMed] [Google Scholar]
- 26.Wilcox RA A three-signal model of T-cell lymphoma pathogenesis. Am J Hematol 91, 113–22 (2016). [DOI] [PMC free article] [PubMed] [Google Scholar]
- 27.Chakraborty AK & Weiss A Insights into the initiation of TCR signaling. Nat Immunol 15, 798–807 (2014). [DOI] [PMC free article] [PubMed] [Google Scholar]
- 28.Sato I et al. Differential trafficking of Src, Lyn, Yes and Fyn is specified by the state of palmitoylation in the SH4 domain. J Cell Sci 122, 965–75 (2009). [DOI] [PubMed] [Google Scholar]
- 29.Wolven A, Okamura H, Rosenblatt Y & Resh MD Palmitoylation of p59fyn is reversible and sufficient for plasma membrane association. Mol Biol Cell 8, 1159–73 (1997). [DOI] [PMC free article] [PubMed] [Google Scholar]
- 30.Meininger I & Krappmann D Lymphocyte signaling and activation by the CARMA1-BCL10-MALT1 signalosome. Biol Chem 397, 1315–1333 (2016). [DOI] [PubMed] [Google Scholar]
- 31.Wang D et al. A requirement for CARMA1 in TCR-induced NF-kappa B activation. Nat Immunol 3, 830–5 (2002). [DOI] [PubMed] [Google Scholar]
- 32.Fontan L et al. Specific covalent inhibition of MALT1 paracaspase suppresses B cell lymphoma growth. J Clin Invest 128, 4397–4412 (2018). [DOI] [PMC free article] [PubMed] [Google Scholar]
- 33.Schlauderer F et al. Molecular architecture and regulation of BCL10-MALT1 filaments. Nat Commun 9, 4041 (2018). [DOI] [PMC free article] [PubMed] [Google Scholar]
- 34.Walsh MC, Lee J & Choi Y Tumor necrosis factor receptor- associated factor 6 (TRAF6) regulation of development, function, and homeostasis of the immune system. Immunol Rev 266, 72–92 (2015). [DOI] [PMC free article] [PubMed] [Google Scholar]
- 35.Liu C et al. Act1, a U-box E3 ubiquitin ligase for IL-17 signaling. Sci Signal 2, ra63 (2009). [DOI] [PMC free article] [PubMed] [Google Scholar]
- 36.Ryzhakov G, Blazek K & Udalova IA Evolution of vertebrate immunity: sequence and functional analysis of the SEFIR domain family member Act1. J Mol Evol 72, 521–30 (2011). [DOI] [PubMed] [Google Scholar]
- 37.Sonder SU et al. IL-17-induced NF-kappaB activation via CIKS/Act1: physiologic significance and signaling mechanisms. J Biol Chem 286, 12881–90 (2011). [DOI] [PMC free article] [PubMed] [Google Scholar]
- 38.Lemonnier F et al. Recurrent TET2 mutations in peripheral T-cell lymphomas correlate with TFH-like features and adverse clinical parameters. Blood 120, 1466–9 (2012). [DOI] [PubMed] [Google Scholar]
- 39.Chtanova T et al. T follicular helper cells express a distinctive transcriptional profile, reflecting their role as non-Th1/Th2 effector cells that provide help for B cells. J Immunol 173, 68–78 (2004). [DOI] [PubMed] [Google Scholar]
- 40.de Leval L et al. The gene expression profile of nodal peripheral T-cell lymphoma demonstrates a molecular link between angioimmunoblastic T-cell lymphoma (AITL) and follicular helper T (TFH) cells. Blood 109, 4952–63 (2007). [DOI] [PubMed] [Google Scholar]
- 41.Saba NS et al. Pathogenic role of B-cell receptor signaling and canonical NF-κB activation in mantle cell lymphoma. Blood 128, 82–92 (2016). [DOI] [PMC free article] [PubMed] [Google Scholar]
- 42.Awasthee N et al. Targeting IkappaappaB kinases for cancer therapy. Semin Cancer Biol 56, 12–24 (2019). [DOI] [PMC free article] [PubMed] [Google Scholar]
- 43.Burke JR et al. BMS-345541 is a highly selective inhibitor of I kappa B kinase that binds at an allosteric site of the enzyme and blocks NF-kappa B-dependent transcription in mice. J Biol Chem 278, 1450–6 (2003). [DOI] [PubMed] [Google Scholar]
- 44.Waelchli R et al. Design and preparation of 2-benzamido-pyrimidines as inhibitors of IKK. Bioorg Med Chem Lett 16, 108–12 (2006). [DOI] [PubMed] [Google Scholar]
- 45.Lim KH, Yang Y & Staudt LM Pathogenetic importance and therapeutic implications of NF-kappaB in lymphoid malignancies. Immunol Rev 246, 359–78 (2012). [DOI] [PMC free article] [PubMed] [Google Scholar]
- 46.Krappmann D & Vincendeau M Mechanisms of NF-kappaB deregulation in lymphoid malignancies. Semin Cancer Biol 39, 3–14 (2016). [DOI] [PubMed] [Google Scholar]
- 47.Odqvist L et al. NIK controls classical and alternative NF-kappaB activation and is necessary for the survival of human T-cell lymphoma cells. Clin Cancer Res 19, 2319–30 (2013). [DOI] [PubMed] [Google Scholar]
- 48.Martinez-Delgado B et al. Differential expression of NF-kappaB pathway genes among peripheral T-cell lymphomas. Leukemia 19, 2254–63 (2005). [DOI] [PubMed] [Google Scholar]
- 49.Izban KF et al. Constitutive expression of NF-kappa B is a characteristic feature of mycosis fungoides: implications for apoptosis resistance and pathogenesis. Hum Pathol 31, 1482–90 (2000). [DOI] [PubMed] [Google Scholar]
- 50.Fracchiolla NS et al. Structural alterations of the NF-kappa B transcription factor lyt-10 in lymphoid malignancies. Oncogene 8, 2839–45 (1993). [PubMed] [Google Scholar]
- 51.Derudder E et al. Identification and characterization of p100HB, a new mutant form of p100/NF-kappa B2. Biochem Biophys Res Commun 308, 744–9 (2003). [DOI] [PubMed] [Google Scholar]
- 52.Mondragon L et al. GAPDH Overexpression in the T Cell Lineage Promotes Angioimmunoblastic T Cell Lymphoma through an NF-kappaB-Dependent Mechanism. Cancer Cell 36, 268–287.e10 (2019). [DOI] [PubMed] [Google Scholar]
- 53.Cortes JR et al. RHOA G17V Induces T Follicular Helper Cell Specification and Promotes Lymphomagenesis. Cancer Cell 33, 259–273.e7 (2018). [DOI] [PMC free article] [PubMed] [Google Scholar]
- 54.Ng SY et al. RhoA G17V is sufficient to induce autoimmunity and promotes T-cell lymphomagenesis in mice. Blood 132, 935–947 (2018). [DOI] [PMC free article] [PubMed] [Google Scholar]
- 55.Dierks C et al. The ITK-SYK fusion oncogene induces a T-cell lymphoproliferative disease in mice mimicking human disease. Cancer Res 70, 6193–204 (2010). [DOI] [PubMed] [Google Scholar]
- 56.Pechloff K et al. The fusion kinase ITK-SYK mimics a T cell receptor signal and drives oncogenesis in conditional mouse models of peripheral T cell lymphoma. J Exp Med 207, 1031–44 (2010). [DOI] [PMC free article] [PubMed] [Google Scholar]
- 57.Schmidt-Supprian M et al. Mature T cells depend on signaling through the IKK complex. Immunity 19, 377–89 (2003). [DOI] [PubMed] [Google Scholar]
- 58.Iyer MK, Chinnaiyan AM & Maher CA ChimeraScan: a tool for identifying chimeric transcription in sequencing data. Bioinformatics 27, 2903–4 (2011). [DOI] [PMC free article] [PubMed] [Google Scholar]
- 59.Abate F et al. Pegasus: a comprehensive annotation and prediction tool for detection of driver gene fusions in cancer. BMC Syst Biol 8, 97 (2014). [DOI] [PMC free article] [PubMed] [Google Scholar]
- 60.Layer RM, Chiang C, Quinlan AR & Hall IM LUMPY: a probabilistic framework for structural variant discovery. Genome Biol 15, R84 (2014). [DOI] [PMC free article] [PubMed] [Google Scholar]
- 61.Kimbrel EA, Davis TN, Bradner JE & Kung AL In vivo pharmacodynamic imaging of proteasome inhibition. Mol Imaging 8, 140–7 (2009). [PubMed] [Google Scholar]
- 62.Moran-Crusio K et al. Tet2 loss leads to increased hematopoietic stem cell self-renewal and myeloid transformation. Cancer Cell 20, 11–24 (2011). [DOI] [PMC free article] [PubMed] [Google Scholar]
- 63.Aghajani K, Keerthivasan S, Yu Y & Gounari F Generation of CD4CreER(T(2)) transgenic mice to study development of peripheral CD4-T-cells. Genesis 50, 908–13 (2012). [DOI] [PMC free article] [PubMed] [Google Scholar]
- 64.Hsu MS et al. TCR Sequencing Can Identify and Track Glioma-Infiltrating T Cells after DC Vaccination. Cancer Immunology Research 4, 412 (2016). [DOI] [PMC free article] [PubMed] [Google Scholar]
- 65.Dobin A et al. STAR: ultrafast universal RNA-seq aligner. Bioinformatics 29, 15–21 (2013). [DOI] [PMC free article] [PubMed] [Google Scholar]
- 66.Subramanian A et al. Gene set enrichment analysis: A knowledge-based approach for interpreting genome-wide expression profiles. Proceedings of the National Academy of Sciences 102, 15545 (2005). [DOI] [PMC free article] [PubMed] [Google Scholar]
Associated Data
This section collects any data citations, data availability statements, or supplementary materials included in this article.
Supplementary Materials
Data Availability Statement
DNA and RNA sequencing data that support the findings of this study have been deposited in the Genotypes and Phenotypes (dbGaP), https://www.ncbi.nlm.nih.gov/ (accession no. phs001962.v1.p1) and Gene Expression Omnibus (GEO), https://www.ncbi.nlm.nih.gov/geo/ (accession no. GSE138416) databases. Previously published data sets that were reanalyzed during this study include RNAseq data from patients with AITL and PTCL, NOS in dbGaP (accession no. phs000689.v1.p1) and in the Sequence Read Archive at the National Center for Biotechnology Information, https://www.ncbi.nlm.nih.gov/sra/ (accession no. SRP029591), as well as RNAseq data from RhoA G17V mouse AITL in GEO (accession no. GSE83918). We performed Gene Set Enrichment Analysis (GSEA) with gene sets available in Molecular Signatures Database (MSigDB) https://www.gsea-msigdb.org/gsea/msigdb, Dr. Thomas Gilmore’s NF-κB target database (Boston University, Boston, MA) (http://www.bu.edu/nf-kb/gene-resources/target-genes/).
Further information on research design is available in the Nature Research Reporting Summary linked to this article.
Source data for Fig. 2, 3, 4, 5, 7, 8 and Extended Data Fig. 3, 4, 6, 7 have been provided as Source Data files. All other data supporting the findings of this study are available from the corresponding author on reasonable request.


