

Abstract
What is the range of stimuli encoded by face-selective regions of the brain? Here, we asked how electrical microstimulation of these regions in macaque inferotemporal (IT) cortex affects the percept of faces and objects. We found that microstimulation strongly influenced the percept of faces, and this effect depended on precise targeting to the center of face patches. While microstimulation had no effect on the percept of many non-face objects, it did have a significant effect on the percept of some non-face objects including ones whose overall shape is consistent with a face (e.g., apples), as well as somewhat face-like abstract images (e.g., cartoon houses). Surprisingly, among the objects whose percept could be perturbed by microstimulation were ones that did not activate the stimulated face patch at all. These results indicate that representation of facial identity is localized to face-selective regions, but activity in these regions can also affect the percept of face-compatible non-face objects, including ones normally represented in other parts of IT cortex.
Introduction
Early visual areas represent visual information through topographic feature maps. The discovery of cells in IT cortex selective for specific complex objects in the late 1970s1 suggested that IT cells are not processing information in only a local part of space, but are specialized to process object units. This immediately raised the question: how are the representations of different objects organized in IT cortex? Given the near infinite variety of objects in the real world, it seems a priori impossible for there to exist a distinct piece of cortex for representing every possible object. If specialization exists, it must be for a class of objects.
Perhaps the strongest evidence for processing of a specific object class by a specialized cortical region comes from studies of “face patches” in the macaque monkey. These regions appear to be specialized for processing one biologically important class of objects, faces, based on multiple pieces of evidence: (1) The patches contain high concentrations of face-selective cells2–5. (2) The patches are strongly and specifically connected to each other, suggesting representation of a common set of objects6. (3) The patches encode a specific set of transformations supporting representation of view-invariant facial identity3. (4) The selectivity of cells in face patches for contrast between pairs of face parts is consistent with predictions from computational theories of illumination-invariant face detection7. Extrapolating from the example of the face patch system, one might expect other parts of IT to also be organized according to meaningful categories.
An alternative view of IT organization is that it encodes a “visual feature topography”, analogous to orientation columns in V1, but with orientation replaced by more complex features8. Using fMRI in humans, Haxby et al. showed that different stimulus categories elicit distinct distributed response patterns across ventral temporal cortex, and the identity of the category being viewed can be distinguished using these distributed patterns even when regions responding maximally to the category are excluded from analysis8. Verhoef et al. showed that stimulation of clusters of IT neurons preferring convex or concave 3D shape could influence a monkey’s percept of convexity; importantly, the effective clusters were distributed throughout the lower bank of the anterior STS, supporting the concept of a distributed code in IT cortex9. Besides 3D curvature, other features postulated to be represented by the IT feature map include: retinotopic biases10, real-world size11, animacy12, 2D curvature13–15, and color16,17. All of these coarse “topologies” of IT cortex suggest a distributed coding of object identities in IT cortex.
The concept of a distributed visual feature topography seems at odds with the concept of regions specialized for processing single high-level object categories such as faces. Faces share many features with other object classes (e.g., round shape, bilateral symmetry, and so on), and the former account would predict that brain regions coding faces should also code other objects sharing these features. This raises the question: How specialized are face-selective areas for processing faces? Is activity in face-selective brain regions also used by the brain to encode other types of objects? If so, one would expect that perturbing face patch activity should also affect the processing of non-face objects.
Related to this, it is unclear what precisely constitutes a face for a face-selective region. Typically, localizer experiments to define such regions use photographs of real faces (humans and monkeys). But how abstract can the representation of a face be and still be affected by stimulation of a face patch? For example, people see faces in rocks, toast, clouds, electrical outlets, and so on. Are all of these “face-like objects” represented by face patches? Perturbation experiments offer one approach to define the boundaries of the face space represented by face-selective regions.
Electrical microstimulation is a tool often used to perturb neuronal processing and assess the causal contribution of an area to perception and behavior18,19. In monkeys, stimulation of face-selective clusters in anterior IT cortex was found to bias monkeys’ report in a face detection task20, though the location of these clusters relative to fMRI-identified face patches was not determined. In humans, electrical stimulation of the fusiform gyrus elicits partial or whole-face hallucinations21–23, and stimulation targeted to face-selective regions in the fusiform gyrus selectively distorts the percept of facial identity24. In general, stimulation experiments in humans offer valuable insight into the subjective percept induced by microstimulation, as subjects can verbalize the elicited percept. However, targeting is determined by therapeutic needs, and relatively large epi-dural electrodes with coarse spacing are typically used, resulting in approximate targeting of specific cortical areas. In addition, human subjects are only available for relatively short amounts of time making repeated experiments and parametric exploration of microstimulation effects challenging. Thus the behavioral effects of face patch perturbation remain unclear.
A recent study used optogenetics to silence activity in a face-selective cluster in macaque IT cortex25 and assess the effect on a face gender discrimination task. This study found some evidence for selective representation of face gender: Optogenetic silencing of a face-selective region produced a 2% decrement in performance, while silencing of an adjacent region produced no significant effect. However, the tiny size of the effect leaves open the question whether face patches truly have a substantially greater role over non-face selective cortex in representing faces. Also, the study did not explore the effect of face patch perturbation on discrimination of non-face objects. Finally, the lack of fMRI identification of face patches in the study leaves unclear exactly which patch was perturbed, if any, and what the effect is of perturbations across different patches.
Here, we exploit the macaque face patch system to systematically explore the effects of targeted microstimulation of different fMRI-identified face patches on perception of faces and objects.
Results
We localized face-selective regions in two macaque monkeys, M1 (Fig. 1a) and M2, and targeted a subset of these patches in the two animals for electrical stimulation (Fig. 1b). The animals were trained to perform a delayed match-to-sample task that tested perception of object identity (see Methods for details on training). In this task, a fixation spot appeared (1000 ms), followed by the first cue (200 ms), a delay period during which a blank screen with fixation spot was shown (600 ms), and a second cue (200 ms). The animal was required to maintain fixation throughout this period. Then two saccade targets appeared, a red “X” (always on the left) and a green “V” (always on the right). The monkey was required to saccade to the X if the two cues were different, and to the V if they were the same, for a juice reward (Fig. 1c). We chose this delayed match to sample task for the following reasons: (1) The task is highly versatile, allowing us to probe the effect of face patch stimulation on perception of a large variety of different face and non-face stimuli; in contrast, a face/non-face detection task (e.g.,20) would limit us to a single categorical decision, (2) the separation of the two cues by a delay allowed us to compare effects of stimulation during cue 1, cue 2, or both cues, to gain insight into the temporal dynamics of face representation and potential sites of face storage during working memory. We performed five different experiments, described in detail below; a subset of the stimuli presented as cues in these experiments are shown in Fig. 1d–h. In this report we concentrate on those sessions in which we electrically stimulated during the second cue presentation only (with the exception of Supplementary Figures 8 & 9 where we also show the results of first cue only and dual cue stimulation).
Figure 1.
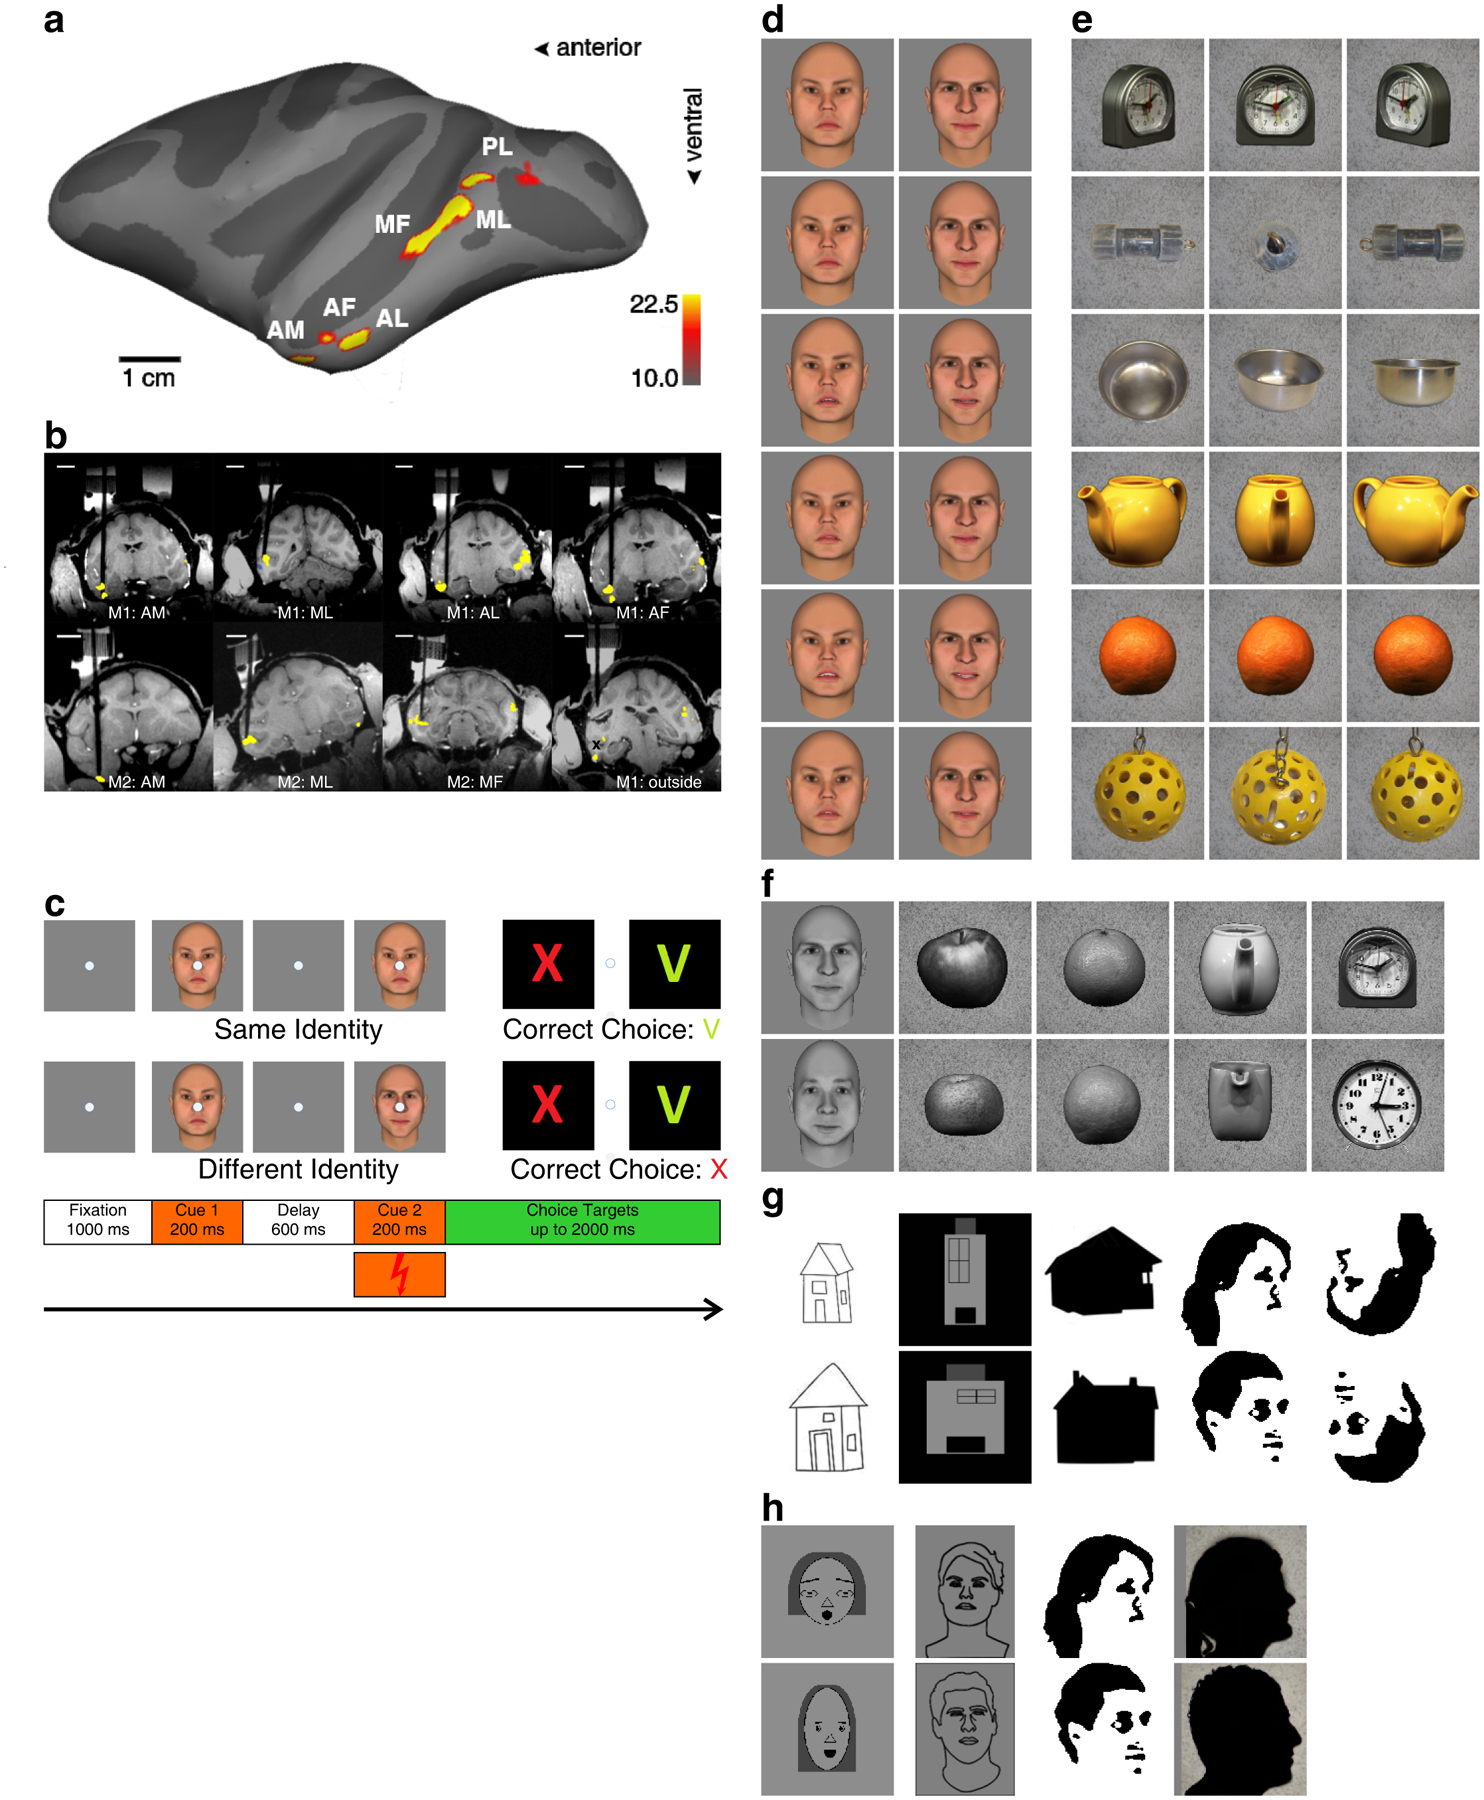
Experimental paradigm. (a) Side view of the macaque brain, showing six face patches of monkey M1 on lateral view of an inflated left hemisphere. The patches were identified by contrasting activation to faces versus objects (see Methods for details). Dark gray regions indicate sulci. The color-bar shows the negative common logarithm of the uncorrected significance level, with −10 equaling p = 0.00005 Bonferroni corrected. (b) Brain regions that were stimulated in monkeys M1 and M2 in the current study, shown on coronal MRI slices (slice plane was slightly rotated from coronal to show the full electrode). Electrodes targeting face patches (dark black lines) were lowered through recording grids into the brain. The chambers and recording grids, filled with gadolinium, are also visible in the images. The face patches are shown superimposed (the yellow mask shows significant activation for faces versus objects, at significance level of p = 0.00005 Bonferroni corrected). The electrode in the lower right panel (outside) was partially retracted after the stimulation experiment, before MRI images were obtained (black x shows the position of the electrode tip during microstimulation in the lower bank of the STS). (c) Visual and electrical stimulation paradigm. A fixation point appeared, followed by the first cue, a delay during which only the fixation spot was presented, the second cue, and then two saccade targets. The animal was required to saccade to the green V if the two cues were the same, and the red X if they were different. On a subset of trials, electrical microstimulation was delivered during presentation of the second cue. Examples of the stimuli used for the five main experiments: d) 2 out of 32 different colored identities shown at 6 different facial expressions (Experiment 1, 2); e) 6 out of 28 colored objects shown at 3 different view angles (Experiment 2); f) 10 out of 15 gray-scale stimuli (Experiment 3); g) 10 out of 20 abstract houses and faces (Experiment 4b); h) 8 out of 16 abstract faces (Experiment 4a).
Experiment 1: Microstimulation of face patches during face identification
In the first experiment, we tested the effect of electrical microstimulation on perception of face identity. The two cue images were selected from a set of 32 different human faces (Fig. 1d shows two example identities). In half the trials the two cue images depicted the same identity, but with different expression, while in the other half, the two cue images represented different facial identities; for all trials, we chose faces of different expression to ensure that the monkey was choosing “same” or “different” based on invariant identity rather than a low-level cue (see Methods for details on how identities of the two cues were chosen). We first stimulated in the most anterior face patch, AM, previously shown to contain a view-invariant representation of individual identity3. The monkey performed above chance on both same (91.49%) and different (66.62%) trials compared to chance (both p < 0.0001, Fisher’s Exact test26) (Fig. 2a, gray bars). Microstimulation profoundly affected the monkey’s percept of facial identity: performance on same trials dropped to 13.92% (dark red bar, a decrease of 77.57 percentage points), while performance on different trials increased to 94.49% (bright red bar, increase of 27.87 percentage points). Both effects were highly significant (p < 0.0001). It appeared that electrical microstimulation severely distorted the monkey’s percept of facial identity, such that faces depicting the same identity now appeared to depict different identities. We found the same effect in a second monkey (Fig. 2b) (microstimulation changed performance in same identity trials from 80.19% to 14.88% and in different identity trials from 66.59% to 93.61%, all with p < 0.0001). To put these effects into signal detection theory terms, microstimulation in M1’s AM decreased d’ from 1.801 standard deviations to 0.513, while increasing the criterion c from −0.471 (slight bias to report same identity) to 1.341 (a much stronger bias to report different identity). In M2 microstimulation decreased d’ from 1.277 to 0.481, and increased criterion c from −0.210, 1.282 (Fig. 2h, top and bottom left two bar groups).
Figure 2.
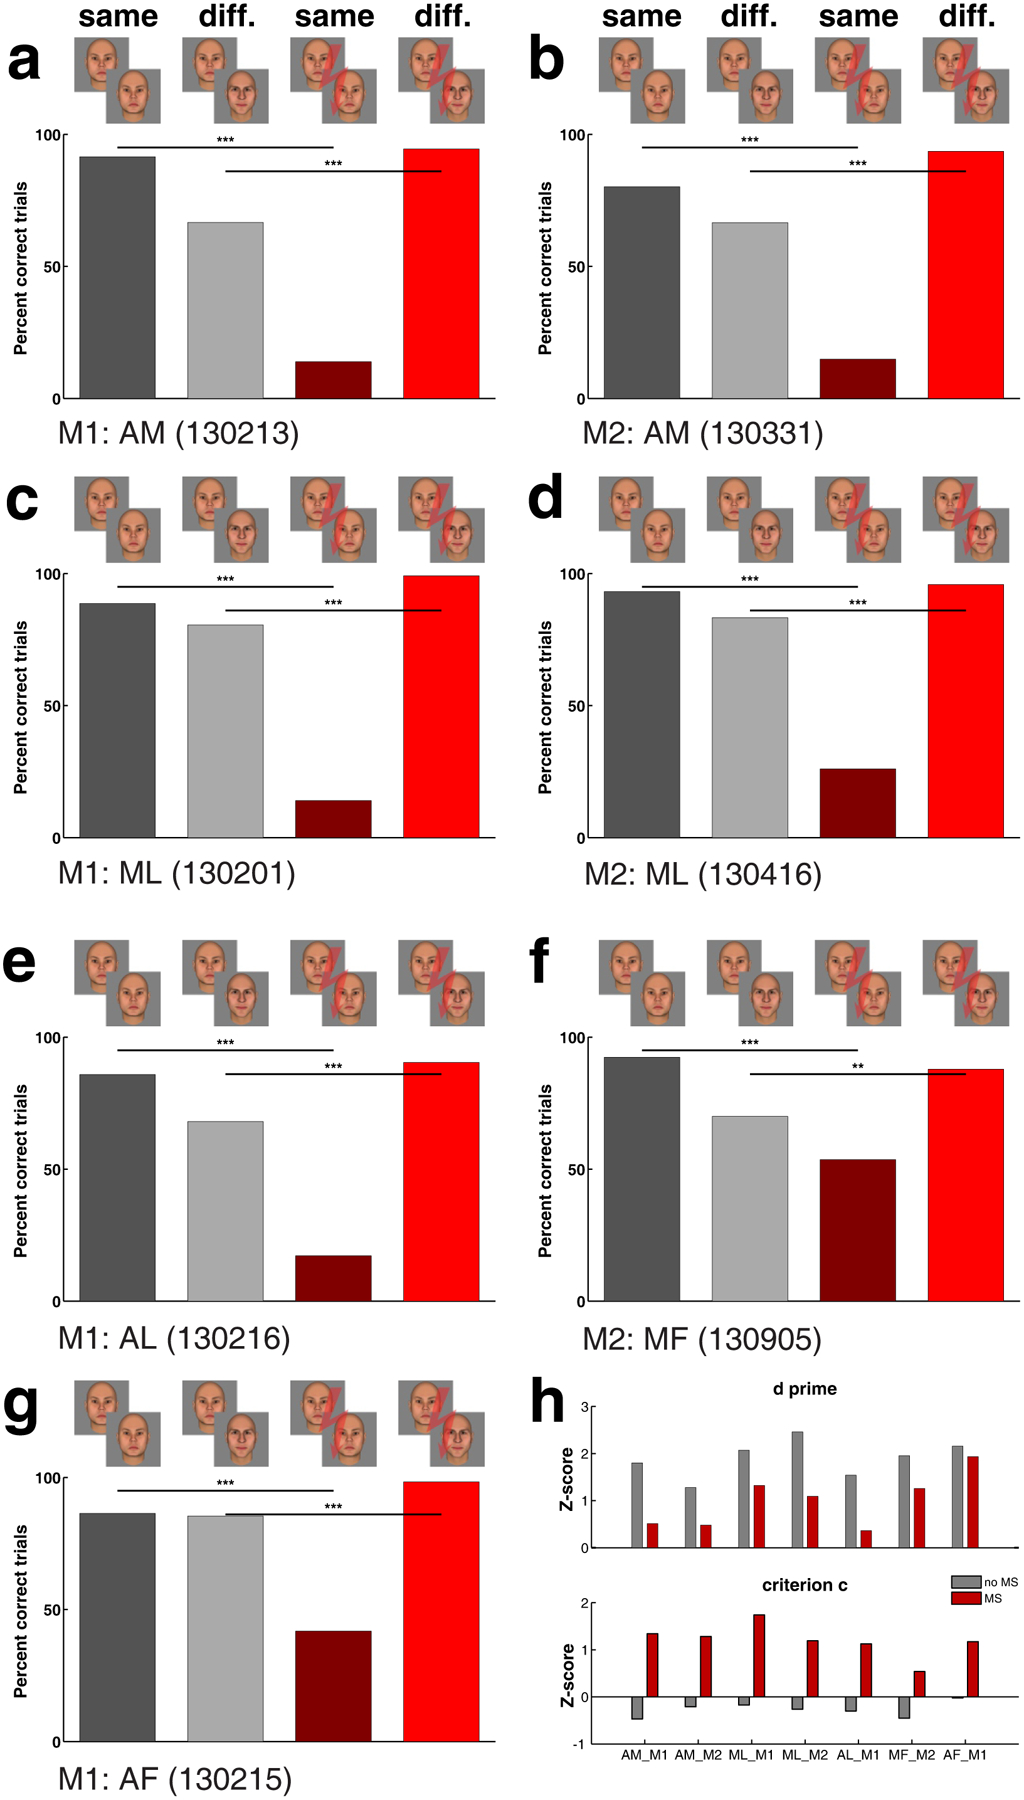
Experiment 1: Face patch stimulation exerts a large effect on perception of facial identity. (a) Behavioral performance of monkey M1 for trials in which cue 1 and cue 2 were of the same identity (first and third columns) or of different identities (second and fourth columns). Electrical stimulation of face patch AM in monkey M1 greatly reduced performance on same trials (compare column 3 versus 1) and increased performance on different trials (compare column 4 versus 2). Gray bars denote trials without, red bars trials with electrical micro-stimulation; darker bars show the performance for same-identity trials, lighter bars for different-identity trials. *: P < 0.05; **: P < 0.01; ***: P < 0.005; Fisher’s exact test. Subsequent panels show similar results of stimulation in (b) AM of M2, (c) ML of M1, (d) ML of M2, (e) AL of M1, (f) MF of M2, (g) AF of M1. Stimulation current was 300 μA except in (d) 200 μA was used. (h) Signal detection measures d’ (top) and criterion c (bottom) for the seven sessions shown in (a) to (g); red bars calculated for trials with microstimulation, gray bars calculated for trials without microstimulation. Microstimulation both reduced the d’ values and changed the criterion c from a bias for same-identity towards a larger bias for different-identity.
Do all face patches contribute to encoding facial identity, or does AM have a privileged role? We found a significant effect of electrical microstimulation in ML (Fig. 2c, d), AL (Fig. 2e), MF (Fig. 2f) and AF (Fig. 2g), with all patches showing qualitatively the same decrease of d’ and increase of criterion c (Fig. 2h). However, the effects elicited by stimulation in same identity trials in AF (−44.59 percentage points change, maximum of 1 session) and MF (−55.35 percentage points change, maximum of 8 sessions) were smaller than those elicited by ML (−74.63 percentage points change, maximum of 3 sessions), AL (−68.58 percentage points change, maximum of 1 session), and AM stimulation (−91.80 percentage points, maximum of 34 sessions). We report maximums across sessions because effect size correlated with accuracy of targeting to the center of the face patch and varied across sessions, as discussed in detail below (Supplementary Table 1 provides a summary of effects for each session individually). The distinction between effect sizes in fundus versus non-fundus face patches is especially interesting since electrophysiological studies have so far failed to uncover significant functional differences between ML and nearby MF, or between AL and nearby AF.
How do the effects depend on magnitude of the stimulation current? For the experiments shown in Fig. 2, the stimulation current was 300 μA (except in Fig. 2d, where we used 200 μA). Suppl. Fig. 1 shows the behavioral effects elicited by different stimulation current amplitudes (5 sessions with 2–3 different current strengths each). We typically saw a smaller effect with 100 μA than with 200 μA. At 300 μA, the effect was typically comparable to that for 200 μA. At 100 μA the effect ranged from no significant modulation (Suppl. Fig. 1g) to above 50% (Suppl. Fig. 1e). This variability in effect magnitude at 100 μA likely reflects the distance of the center of the face patch from the stimulation source and demonstrates how spatially specific the effect of microstimulation on face perception is.
Typically, in MRI experiments the significance of the contrast comparing faces with non-face objects in a face patch is very high in the center of the patch and tapers off as one moves away from the center; recordings targeted to the highly significant center voxels are those that show up to 97% of neurons to be selective for faces2; the relative magnitude of face selectivity of a voxel in fMRI data (compared to the most significant voxel in a patch) can hence provide a functional measure of distance to the center of a face patch. An analysis of 18 sessions in AM (M1: 10 sessions, M2: 8 sessions) showed that the magnitude of the stimulation effect on same-identity trials correlated highly with the face selectivity of the stimulation site as determined by fMRI (p: 0.00074, correlation coefficient r: −0.72064, r2: 0.5193, results were also significant for the individual animals (p < 0.05)). For different-identity trials correlation was also significant (p: 0.00449, correlation coefficient r: 0.63676, r2: 0.4055). (Fig. 3a). This correlation between microstimulation effect size and face selectivity indicates that in order to strongly perturb the percept of faces, the relatively small core of a face patch needs to be precisely targeted during microstimulation.
Figure 3.
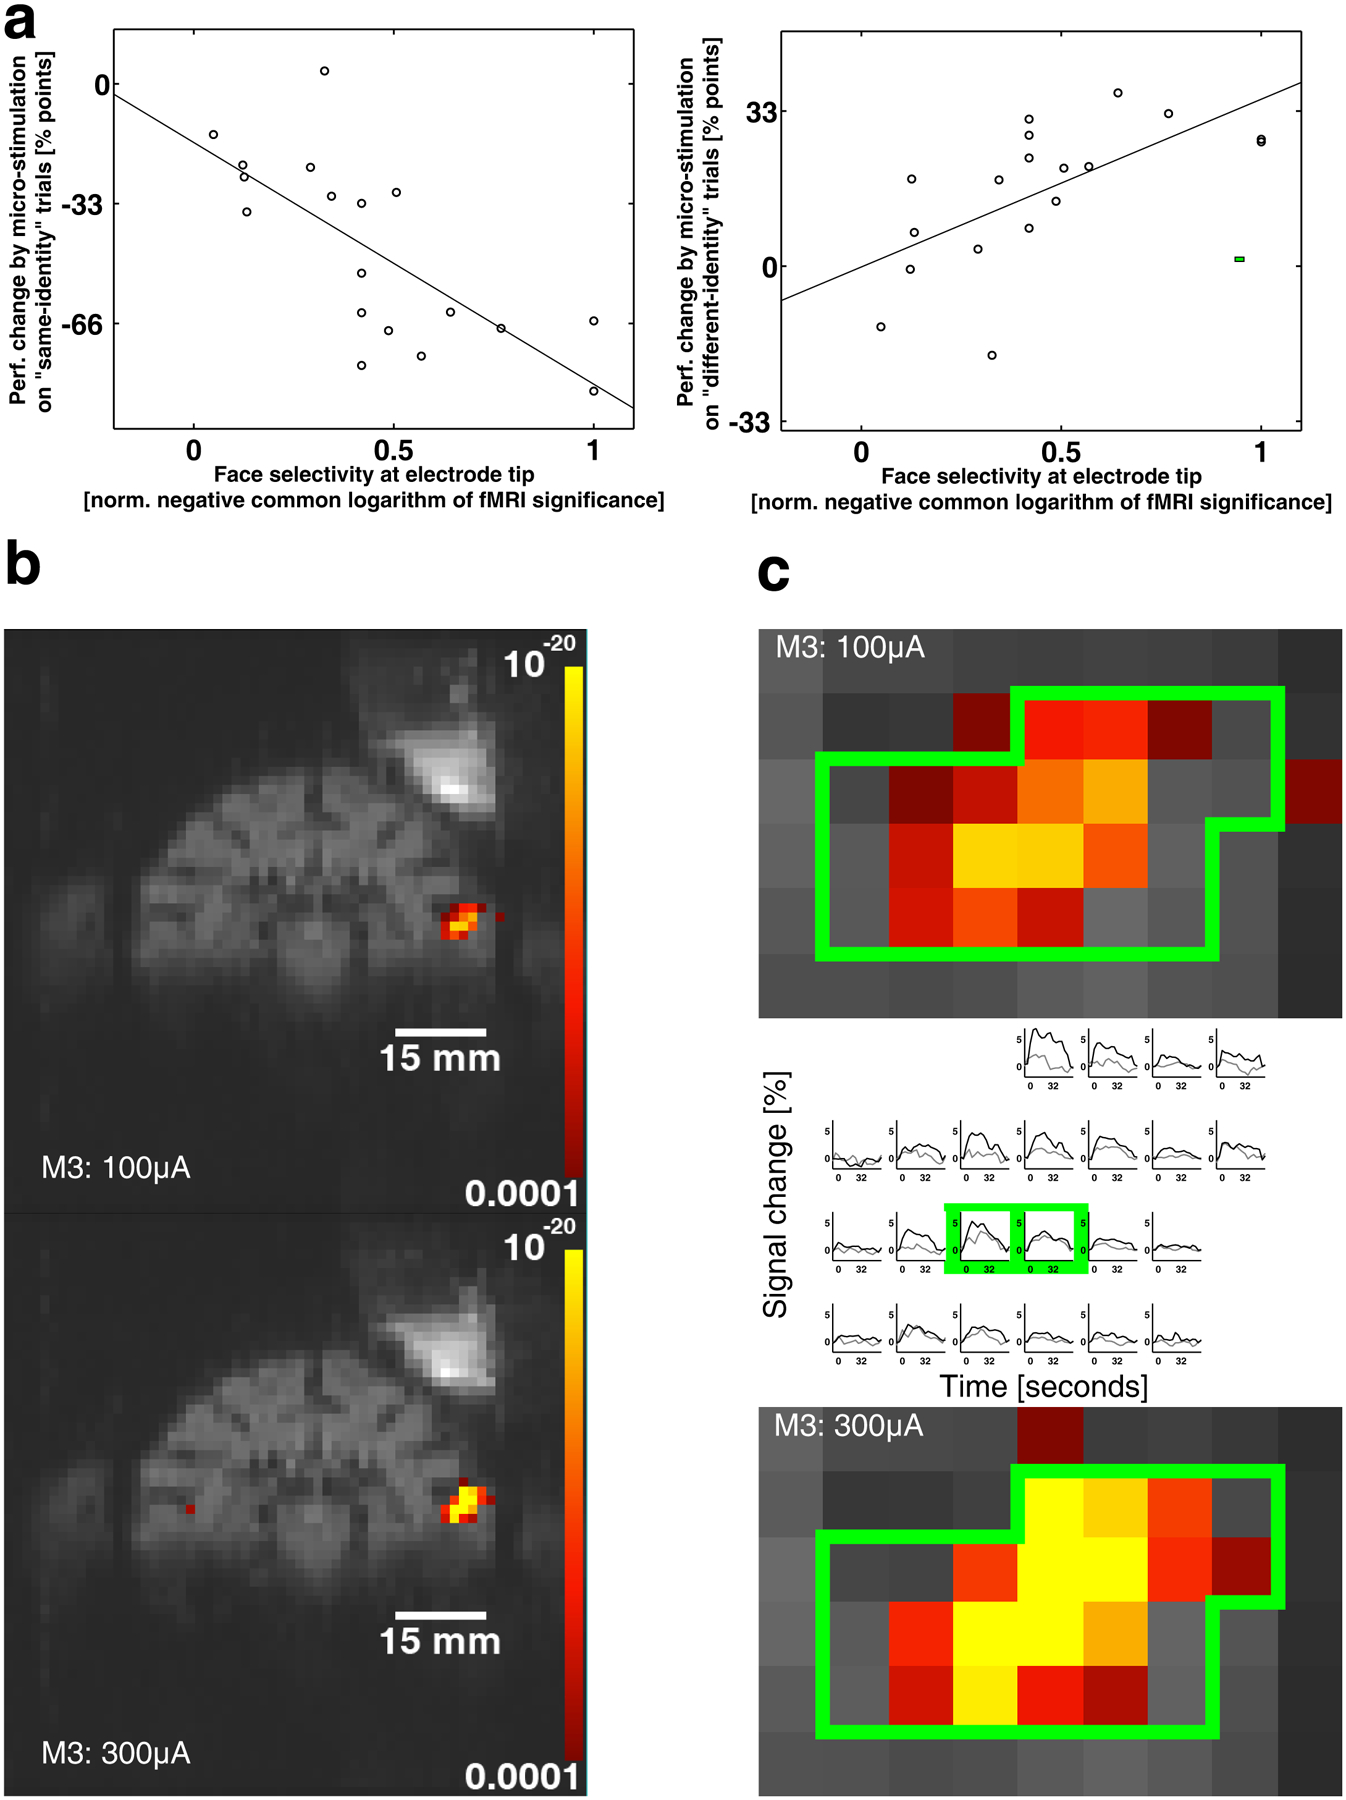
The dependence of effect magnitude on proximity to the center of a face patch. (a) Pooled data for M1 (10 sessions) and M2 (8 sessions) showing how the magnitude of electrical microstimulation effect on same identity trials correlates with the face selectivity of the target location as measured by fMRI (p: 0.0007, correlation coefficient r = −0.72064, r2 = 0.5193, the line shows a least-square fit to the data). The x-axis shows the negative common logarithm of the fMRI contrast faces versus non-face objects from the fMRI face localizer experiments at each of the 18 electrode positions; to facilitate pooling for each monkey we divided each animal’s fMRI significance values by the maximum value of the targeted face patch AM so that zero denotes no face selectivity and one maximal face selectivity). The right panel shows the correlation between the face selectivity magnitude and the microstimulation-dependent performance change in different-identity trials (p: 0.0045, correlation coefficient r = 0.63676, r2 = 0.4055, the line shows a least-square fit to the data). (b) The extent of stimulated cortex depends on the stimulation current: in M3 we stimulated with 100 μA (top) and 300 μA (bottom) in the same session while the animal fixated a gray screen. At 100 μA, 56 voxels around the electrode tip showed a significant modulation by microstimulation (with p <= 0.001), while at 300 μA, 77 voxels were activated. (c) Magnification of one slice through face-patch ML (100 μA top, 300 μA bottom) with a region of interest outlined in green. The middle panel shows the averaged activation time course of each voxel in the ROI for 100 μA in gray and for 300 μA in black; the two voxel positions closest to the electrode tip are highlighted with a green border. Around the electrode tip both stimulation currents caused similar activation, further away from the electrode the response for 300 μA was considerably stronger but did not project further than roughly 1–2 voxels (1.5 mm isotropic) compared to the weaker stimulation current.
To better understand how electrical microstimulation spreads through the cortex we microstimulated ML in a third animal while it was awake and fixating on a gray background, and performed simultaneous fMRI. Comparing the extent of activation spread around the stimulation electrode at two stimulation currents, 100 μA and 300 μA (Fig. 3b, c), we found: at 300 μA, 77 contiguous voxels around the electrode tip showed a modulation by microstimulation with p <= 0.001, while at 100 μA only 56 voxels reached that level of significance. Clearly the stimulation current affects the spatial extent of recruited cortex. Fig. 3c shows the time courses for the voxels in the green outlined region of interest, averaged for all microstimulation epochs in the experiment. The data from 300 μA stimulation (black line) always showed stronger modulation than the data from 100 μA stimulation (gray lines), except at the two voxels closest to the electrode (highlighted in green) where the modulation was similar, and outside the activated region, where neither current yielded noticeable activation. This data shows that close to the electrode both 100 and 300 μA can fully recruit at least a full voxel (1.5 mm isotropic); and that even at 300 μA the activation does not spread much further than at 100 μA (roughly 1 to 2 voxels further). Both the full recruitment close to the electrode tip at 100 μA and the limited spread at 300 μA indicate that with proper targeting to the core of a face patch even 100 μA should have a strong impact on the animal’s percept (Suppl. Fig. 1a, e, i), while targeting too far away from the patch might be rescued by increasing the current to recruit the critical part of a face patch (Suppl. Fig. 1c, d, g, h).
Experiment 2: Microstimulation outside of face patches during face identification and inside the face patches during object identification
Stimulation in the lower bank of the STS outside a face patch (electrode trajectory illustrated in Fig. 1b, second row, rightmost panel) produced no effect on face perception, for either same or different trials (Fig. 4a). Multi-unit responses to a set of face and object stimuli confirmed that the targeted site was not face selective (Fig. 4b), and at this site the fMRI localizer showed stronger responses to non-face objects (p < 0.000015, uncorrected).
Figure 4.
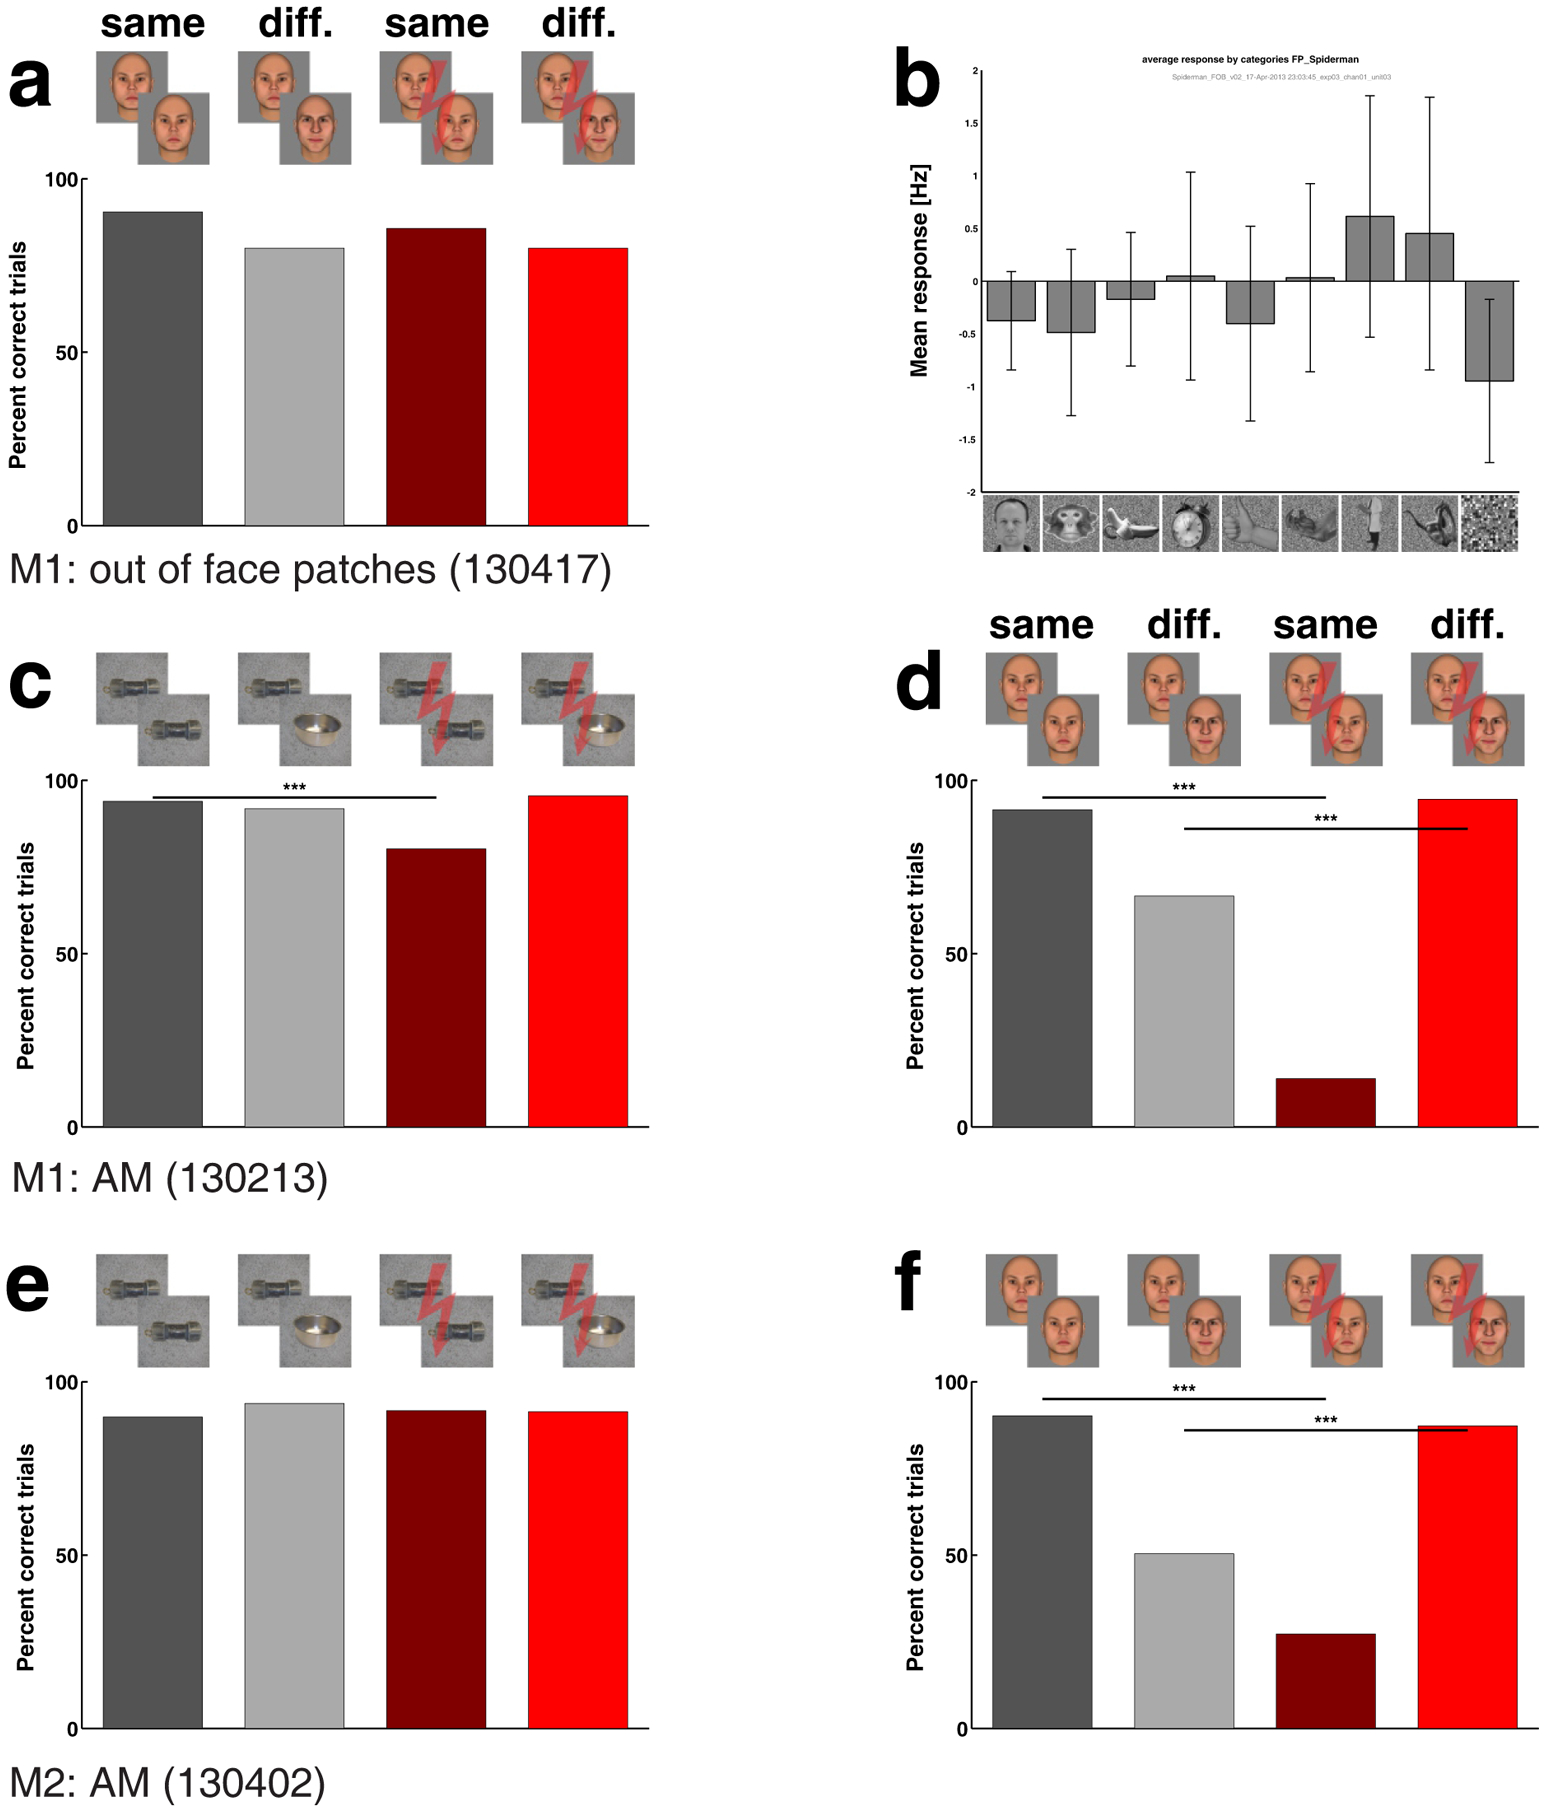
Experiment 2: Effect of stimulation outside the face patches on face perception and effect of stimulation inside face patch AM on object perception. (a) Effect of stimulating outside a face patch (see Fig. 1b lower right panel for electrode location); conventions as in Fig. 2. (b) Mean response (and 95% confidence interval) to images of 9 different categories (16 images each), recorded from multi-unit activity at site stimulated in (a); mean response to faces was not different from those to other objects. (c) Effect of AM stimulation on object perception in monkey M1. Performance was significantly worse on microstimulation “same” trials (reduction by 13.7 percentage points). (d) Effect of stimulation on face perception at the same session and site as in (c) (reduction by 77.6 percentage points for microstimulation “same” trials), repeated from Fig. 2a. (e, f) Same as (c, d), for stimulation in AM of monkey M2. Stimulation current was 300 μA except in (a), where 200 μA was used.
Is the perceptual effect elicited by face patch microstimulation specific to faces? When the animal performed a non-face object identity matching task, consisting of matching identities of 28 objects, each taken from three different views, to generate image dissimilarity on same trials (see Fig. 1e for example objects), performance was only very mildly (−13.68 percentage points change) though significantly (p: 2.92 * 10−7) decreased by micro-stimulation on same-identity trials in monkey M1 (Fig. 4c) and showed no significant change for either same- or different-identity trials in monkey M2 (Fig. 4e). For both animals, stimulation at the same site and session during face identification produced large and significant effects on both same- and different-identity trials (Fig. 4d, f).
Experiment 3: Microstimulation of face patches during identification of faces and non-face objects that elicit responses from face patch neurons
A major debate in cognitive neuroscience concerns whether cells which show a non-maximal but above-baseline response to a stimulus participate in encoding that stimulus. This question is fundamentally important because it gets at the heart of the relationship between neural firing and perception. It is possible that any available information is used by the brain; alternatively, it is possible that only information from specific regions/cell types is available for readout. Face-selective cells in the middle face patches show significant responses to round objects including clocks and apples2,27, and in AM, population decoding of individual identity for a set of 128 stimuli including 16 each of faces, bodies, fruits, gadgets, hands, monkey bodies, monkey body parts, and scrambled patterns showed best performance for the 16 faces followed by three clocks28. Hence, we can ask, does perturbing the code for round non-face objects carried by non-maximal responses in a face patch produce an effect on the percept of round non-face objects?
To test this, we measured performance of monkeys on a round-object identification task (Fig. 5). In this task, the stimulus set consisted of four sets of round objects (apples, citrus fruits, tea pots, and clocks) together with faces (see Fig. 1f for examples of the stimulus set). The monkey was required to perform same/different identity judgments on pairs of images from within each class (i.e., two apples, two clocks, etc.). We found a significant effect of electrical microstimulation not only on faces, but also on apples and citrus fruits; there was no significant effect on the percept of teapots and clocks, though the trend was in the same direction (Fig. 5 and Suppl. Fig. 2b top row). This effect was obtained with a stimulation current of 100 μA. When we lowered the stimulation current to 50 μA in a different session (Suppl. Fig. 2a), the magnitude of the effect on faces dropped, but we continued to see an effect on the percept of apples and citrus fruits. Stimulation outside the face patches (in the lower STS roughly halfway between ML and AL, not close to any of the patches) failed to affect the identification of faces, but still had a significant effect on the identification of apples and citrus fruit (Suppl. Fig. 2c). Calculating the correlation between face selectivity at a stimulation site and the magnitude of the microstimulation effect in same- and different-identity trials, corroborates this observation: out of the five object categories only faces showed a significant correlation (Suppl. Fig. 3a) (same identity: p: 0.044706, correlation coefficient r: −0.54319, r2: 0.2951; different identity: p: 0.0053008, correlation coefficient r: 0.70014, r2: 0.4902; 14 sessions, M1: 9, M2: 5). This indicates that apple and citrus fruit identification very likely recruits more than just face patch AM and hence can be perturbed by stimulation of locations outside of AM that do not yield any effect on face identification.
Figure 5.
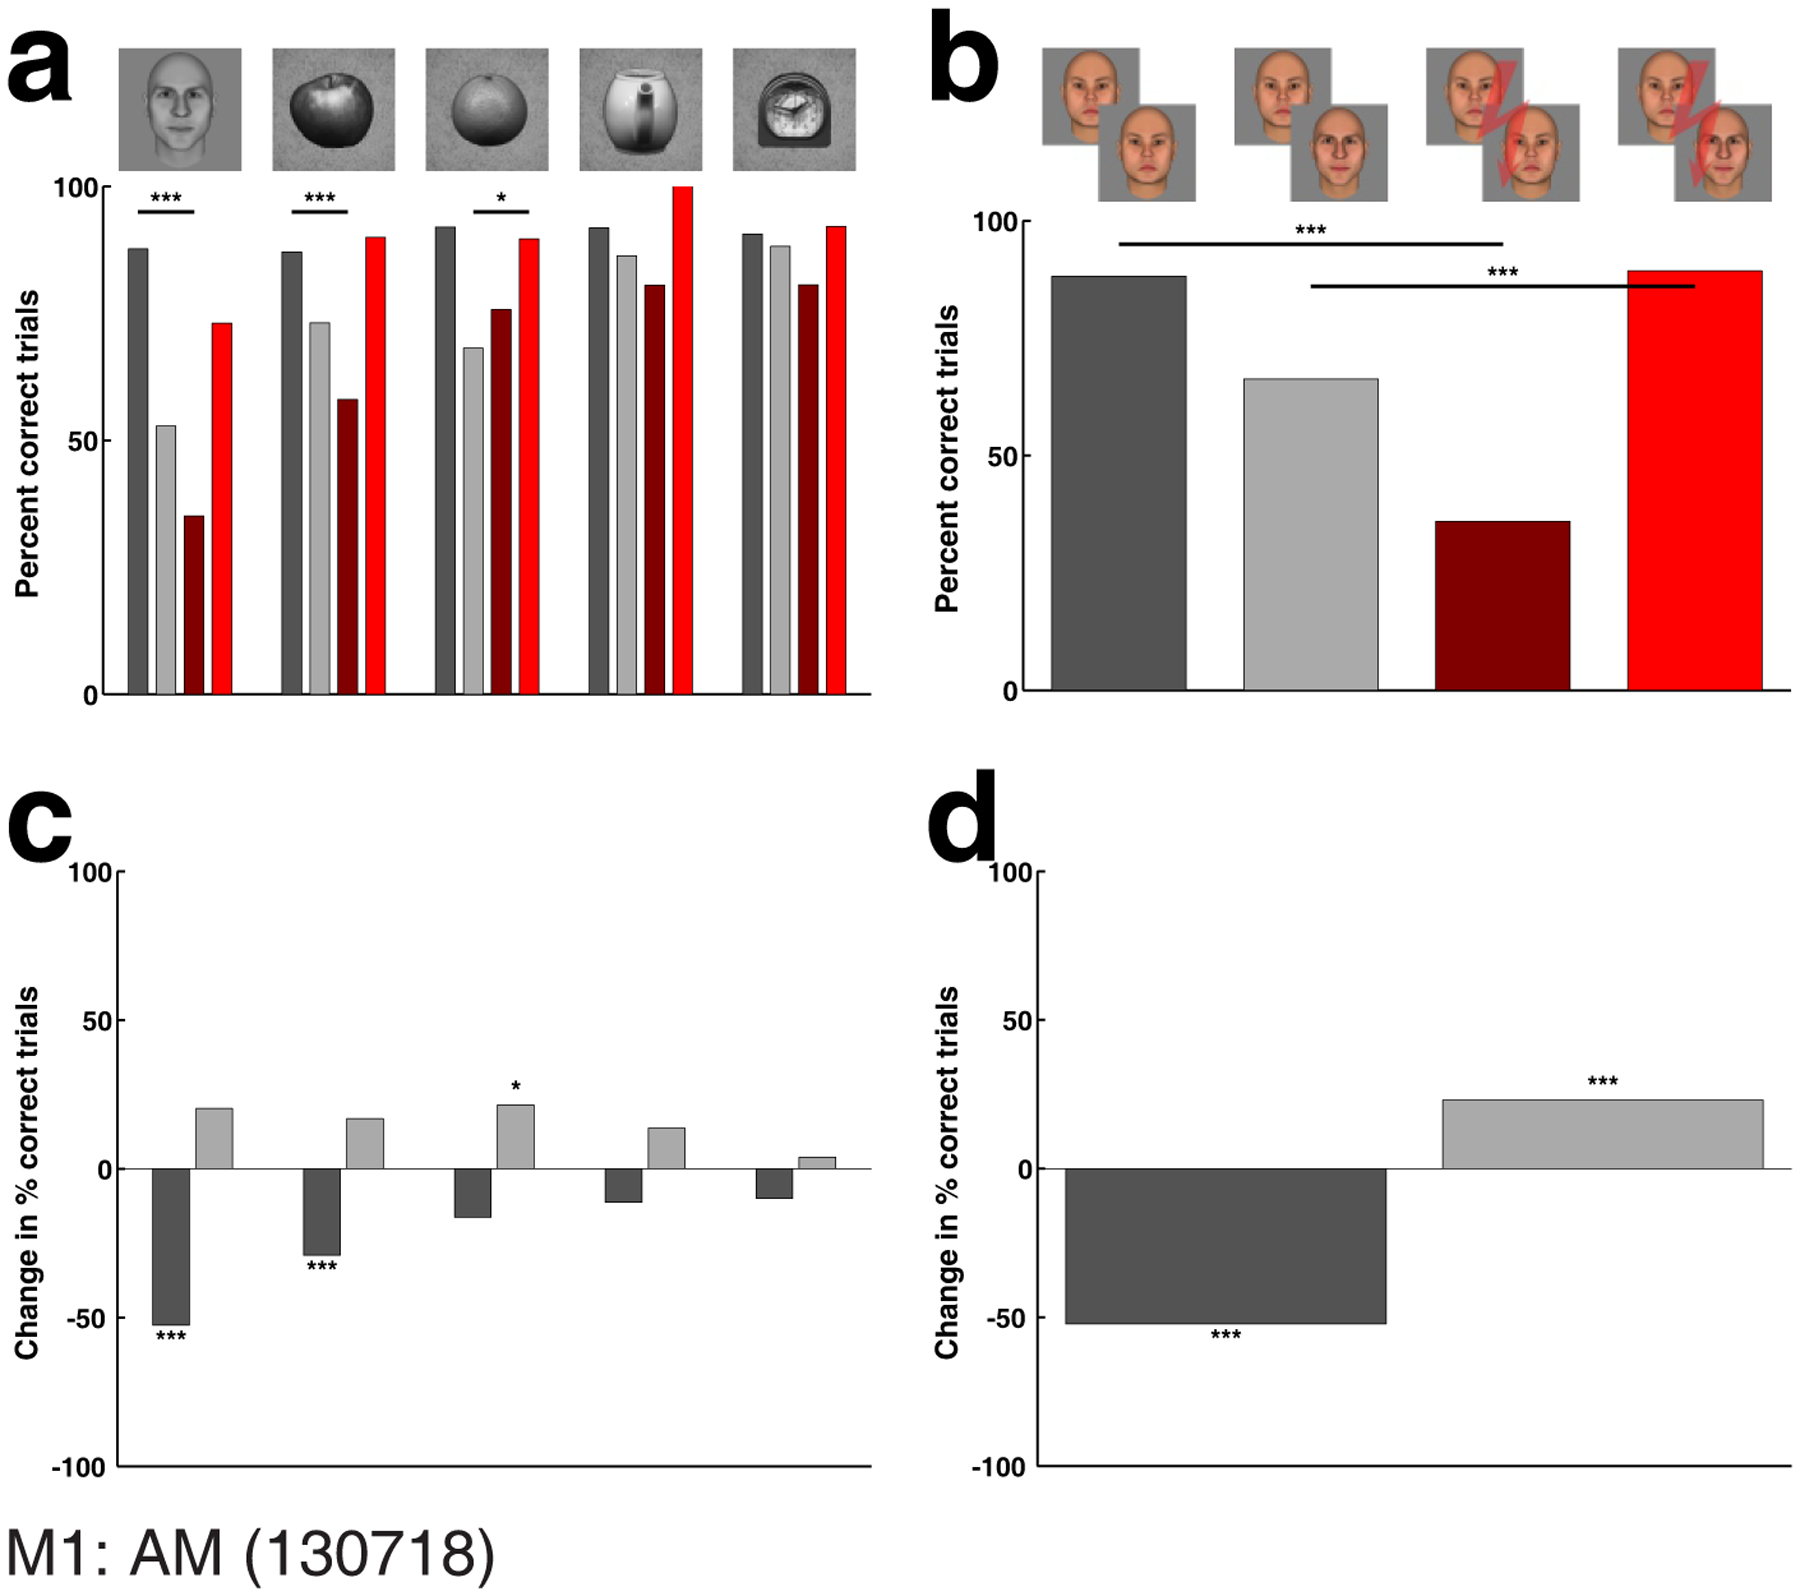
Experiment 3: Effect of face patch stimulation on perception of round objects. (a) Effect of face patch stimulation on perception of faces, apples, citrus fruits, teapots, and clocks. A significant effect was found for faces, apples, and citrus fruits, but not for teapots and clocks. (b) Effect obtained in same experimental session, for face stimuli of Experiment 1. (c) Difference between performance on same and different identity trials for each of the five categories of round shapes, and (d) for the faces of Experiment 1. Stimulation current was 100 μA. Conventions as in Fig. 4.
Based on these results we re-analyzed the two non-face object sessions from Experiment 2, but this time we excluded all object images that were round or elliptic in shape, resulting in images of 14 non-round objects. Interestingly, for M1 the effect of microstimulation in same-identity trials dropped both in magnitude from −13.68% to −7.77% as well as in significance from p = 2.9e-7 to p = 0.035 (Suppl. Fig. 4a, c); for M2 the effect on same identity trials remained non-significant (Suppl. Fig. 4b, d).
Experiment 4a: Microstimulation of face patches during abstract face identification
How abstract can a face be and still be perturbed by stimulation of a face patch? Cells in face patches respond strongly to cartoon faces3. Is the percept of cartoon faces affected by face patch stimulation? And what about even more simplified representations? To address this, we next measured the effect of microstimulation in AM on the percept of cartoon faces, line drawings of faces, Mooney faces29, and silhouettes. We found that stimulation had a significant effect on the percept of each of these simplified face renderings (Fig. 6).
Figure 6.
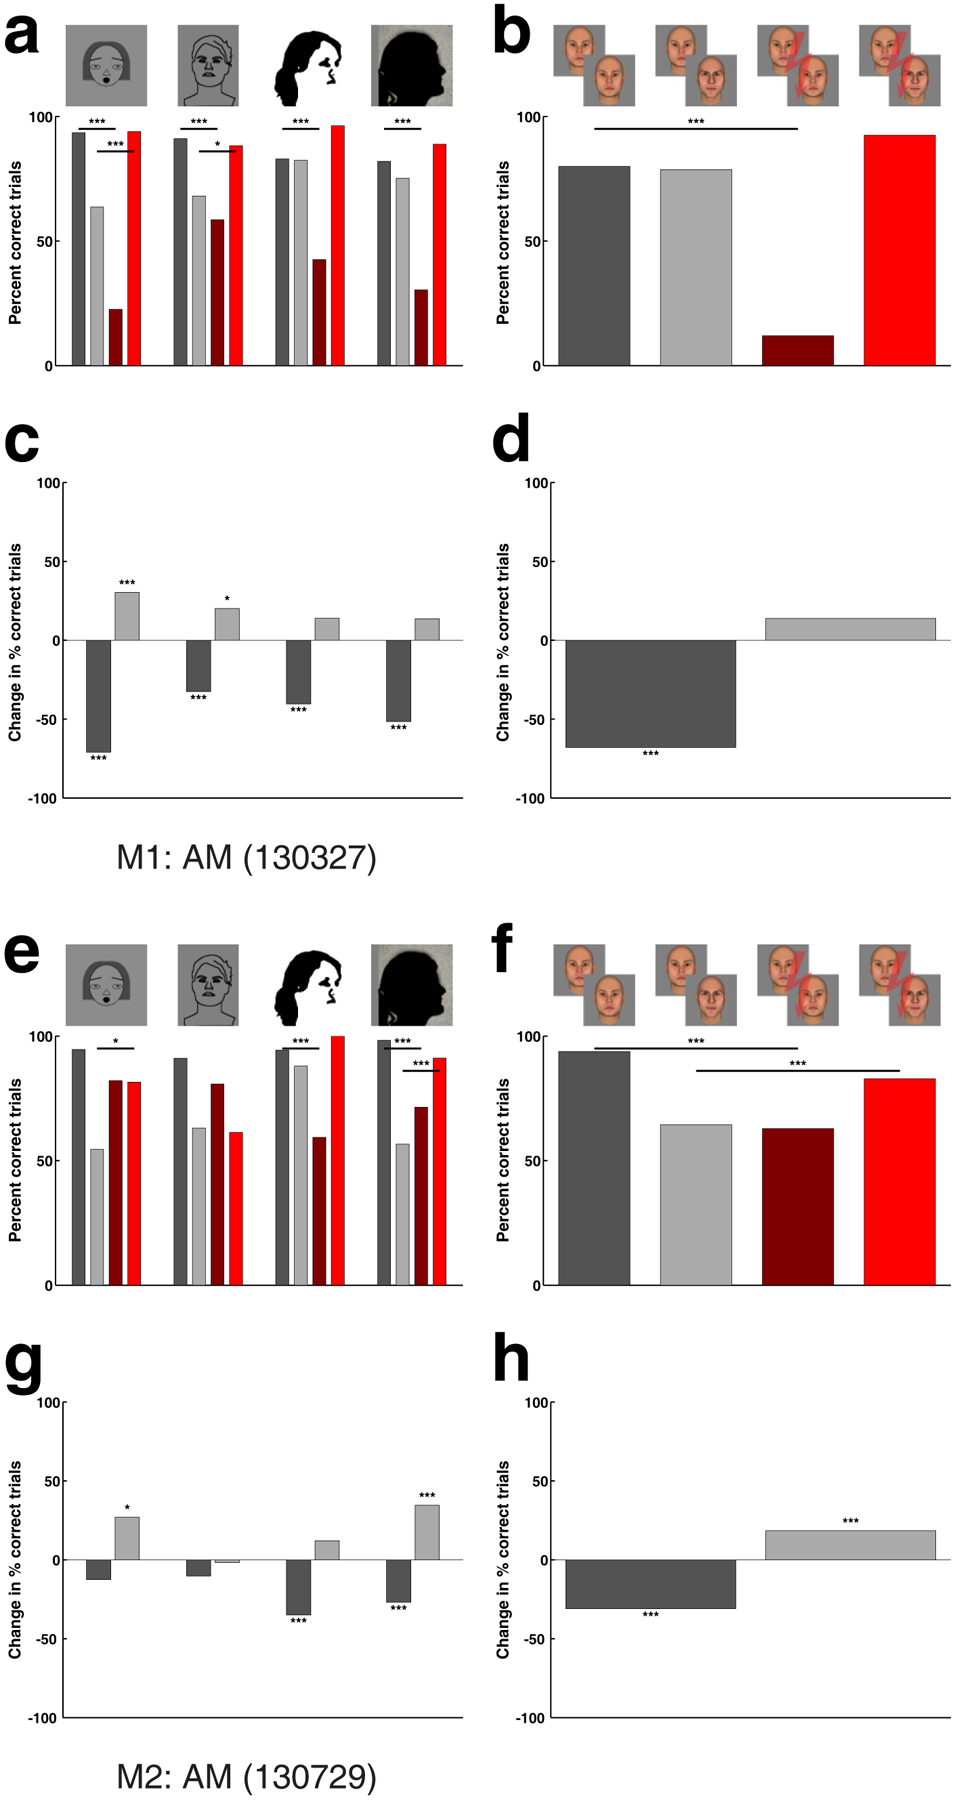
Experiment 4a: Effect of face patch stimulation on perception of abstract faces. (a M1, e M2) Effect of stimulation in face patch AM on the percept of cartoon faces, line drawings of faces, Mooney faces, and face silhouettes (see Fig. 1h). Conventions as in Fig. 2. (b M1, f M2) Effect obtained in same experimental session, for face stimuli of Experiment 1. (c M1, g M2) Performance change in percentage points caused by electrical microstimulation for same- (dark gray bar) and different-identity trials (light gray bar) for each of the four categories of abstract faces, and (d M1, h M2) for the faces of Experiment 1. Stimulation current was 300 μA. P-levels as in Fig. 2.
Importantly, in both monkeys M1 and M2 we performed an extensive study of fMRI and single-unit responses to the Mooney stimuli used in the microstimulation experiments. In M1, we found that fMRI activation by Mooney faces and photographs of real faces was very similar (Figure 7a, 7c left); in M2, we found a very different pattern: with the exception of the most posterior face patch PL in the left hemisphere, Mooney faces did not activate face patches in fMRI experiments, but instead activated several patches distinct and distant from the face patches (Fig. 7b, 7c right). We confirmed this pattern of results with electrophysiology targeted to face patch AM of both animals (Fig. 7d, e): in M1, AM units responded strongly to Mooney faces, but in M2, the units showed no response. Indeed, the mean response to Mooney stimuli in M2 was significantly below that to object stimuli (p=0.005, Student’s t-test, using an interval 50–300 ms after stimulus onset) as well as below baseline (p<0.0001, using an interval 100 ms before stimulus onset). The fact that M2 showed no responses to Mooney faces in AM, yet stimulation of AM could produce a significant effect on M2’s percept of Mooney faces (Fig. 6e), shows that stimulation of an area can affect the percept of stimuli which do not normally activate that area, but are represented elsewhere (likely, in the regions activated by Mooney faces in Fig. 7b including PL). As a side note, the discrepancy in activation to Mooney faces between monkeys M1 and M2 is interesting in itself (though not directly relevant to the present paper): it suggests that the process of face detection may have a dynamic, plastic component and is not solely the result of hardwired feedforward filters which would be expected to be the same in both animals.
Figure 7.
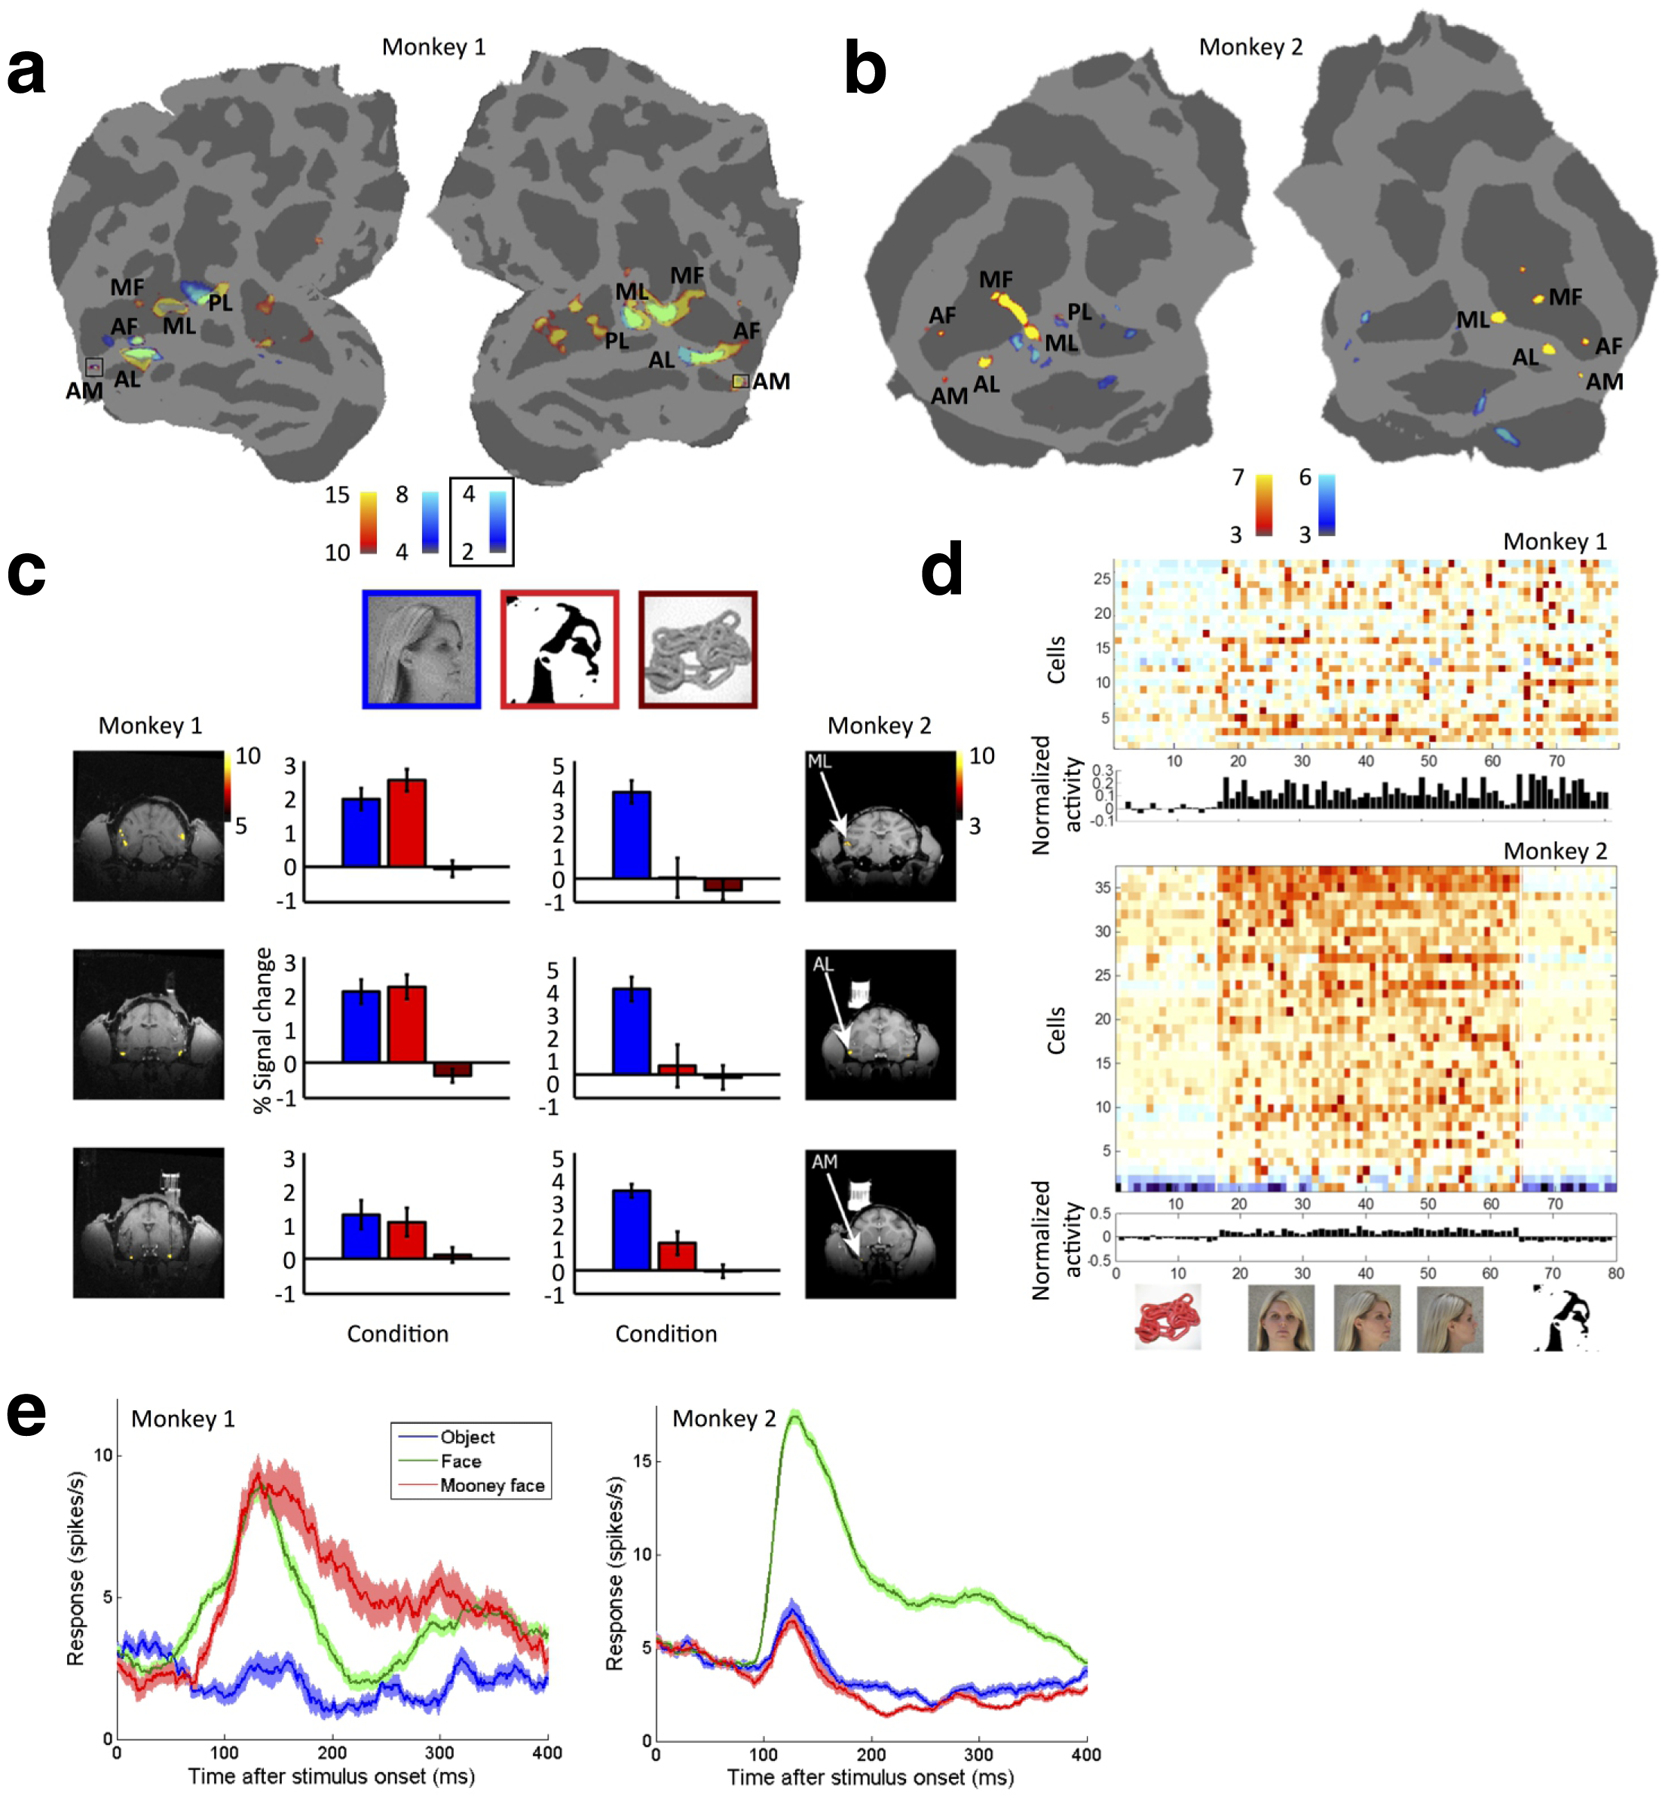
fMRI and electrophysiological responses to abstract Mooney stimuli. (a) fMRI activation to Mooney faces versus non-face objects (blue), overlaid on face patches (yellow, identified through a standard face localizer experiment), for M1. (b) Same as (a), for M2. In M1, Mooney faces versus objects activated the face patches; in M2 they produced no activation in face patches except in left PL, but did activate other patches in IT cortex outside the face patches. (c) Bar graphs of fMRI responses from Monkeys 1 and 2 to blocks of face photographs (blue), Mooney faces (red), and non-face objects (maroon), from ML, AL, and AM. The coronal slices show face patches ML, AL and AM for the two monkeys, identified from the same session by contrasting face photographs versus non-face objects. (d) Single-unit responses (baseline-subtracted, averaged from 50 to 250 ms after stimulus onset) from face patch AM in Monkeys 1 and 2 in response to 80 stimuli, comprised of non-face objects, faces at different views, and Mooney faces. AM cells in M1 showed strong responses to both photographs of faces and Mooney faces, while AM cells in M2 showed responses only to the face photographs. Since electrical stimulation of face patches was able to alter the percept of Mooney faces in M2, this shows that stimulation of an area can affect the percept of stimuli which do not normally activate that area. (e) Mean response time courses to objects (blue), faces (green), and Mooney faces (red) in monkeys M1 and M2.
Experiment 4b: Microstimulation of face patches during identification of faces and abstract houses
To further explore the “edges” of face space, we presented a stimulus set consisting of cartoon houses, Mooney faces, and upside down Mooney faces (Fig. 8; M2 in Suppl. Fig. 5). We found that stimulation of face patch AM could significantly influence the percept of each of these stimuli, including all three cartoon house stimuli. This raises the possibility that face patches may be involved in representation of non-face objects, at least during microstimulation experiments (see Discussion). The strength of the effect we obtained for faces in the same session (Fig. 8b, d), together with anatomical scans of the electrode after recording (Suppl. Fig. 6) confirms that our electrode was centered within the face patch. Interestingly, there also appeared to be a stronger effect for upright versus inverted Mooney faces (Fisher’s exact tests between same-identity trials of Mooney and inverted Mooney faces: without microstimulation: not significant; with microstimulation: p: 0.00018577), perhaps because face patch activity plays a greater role in representation of upright faces30.
Figure 8.
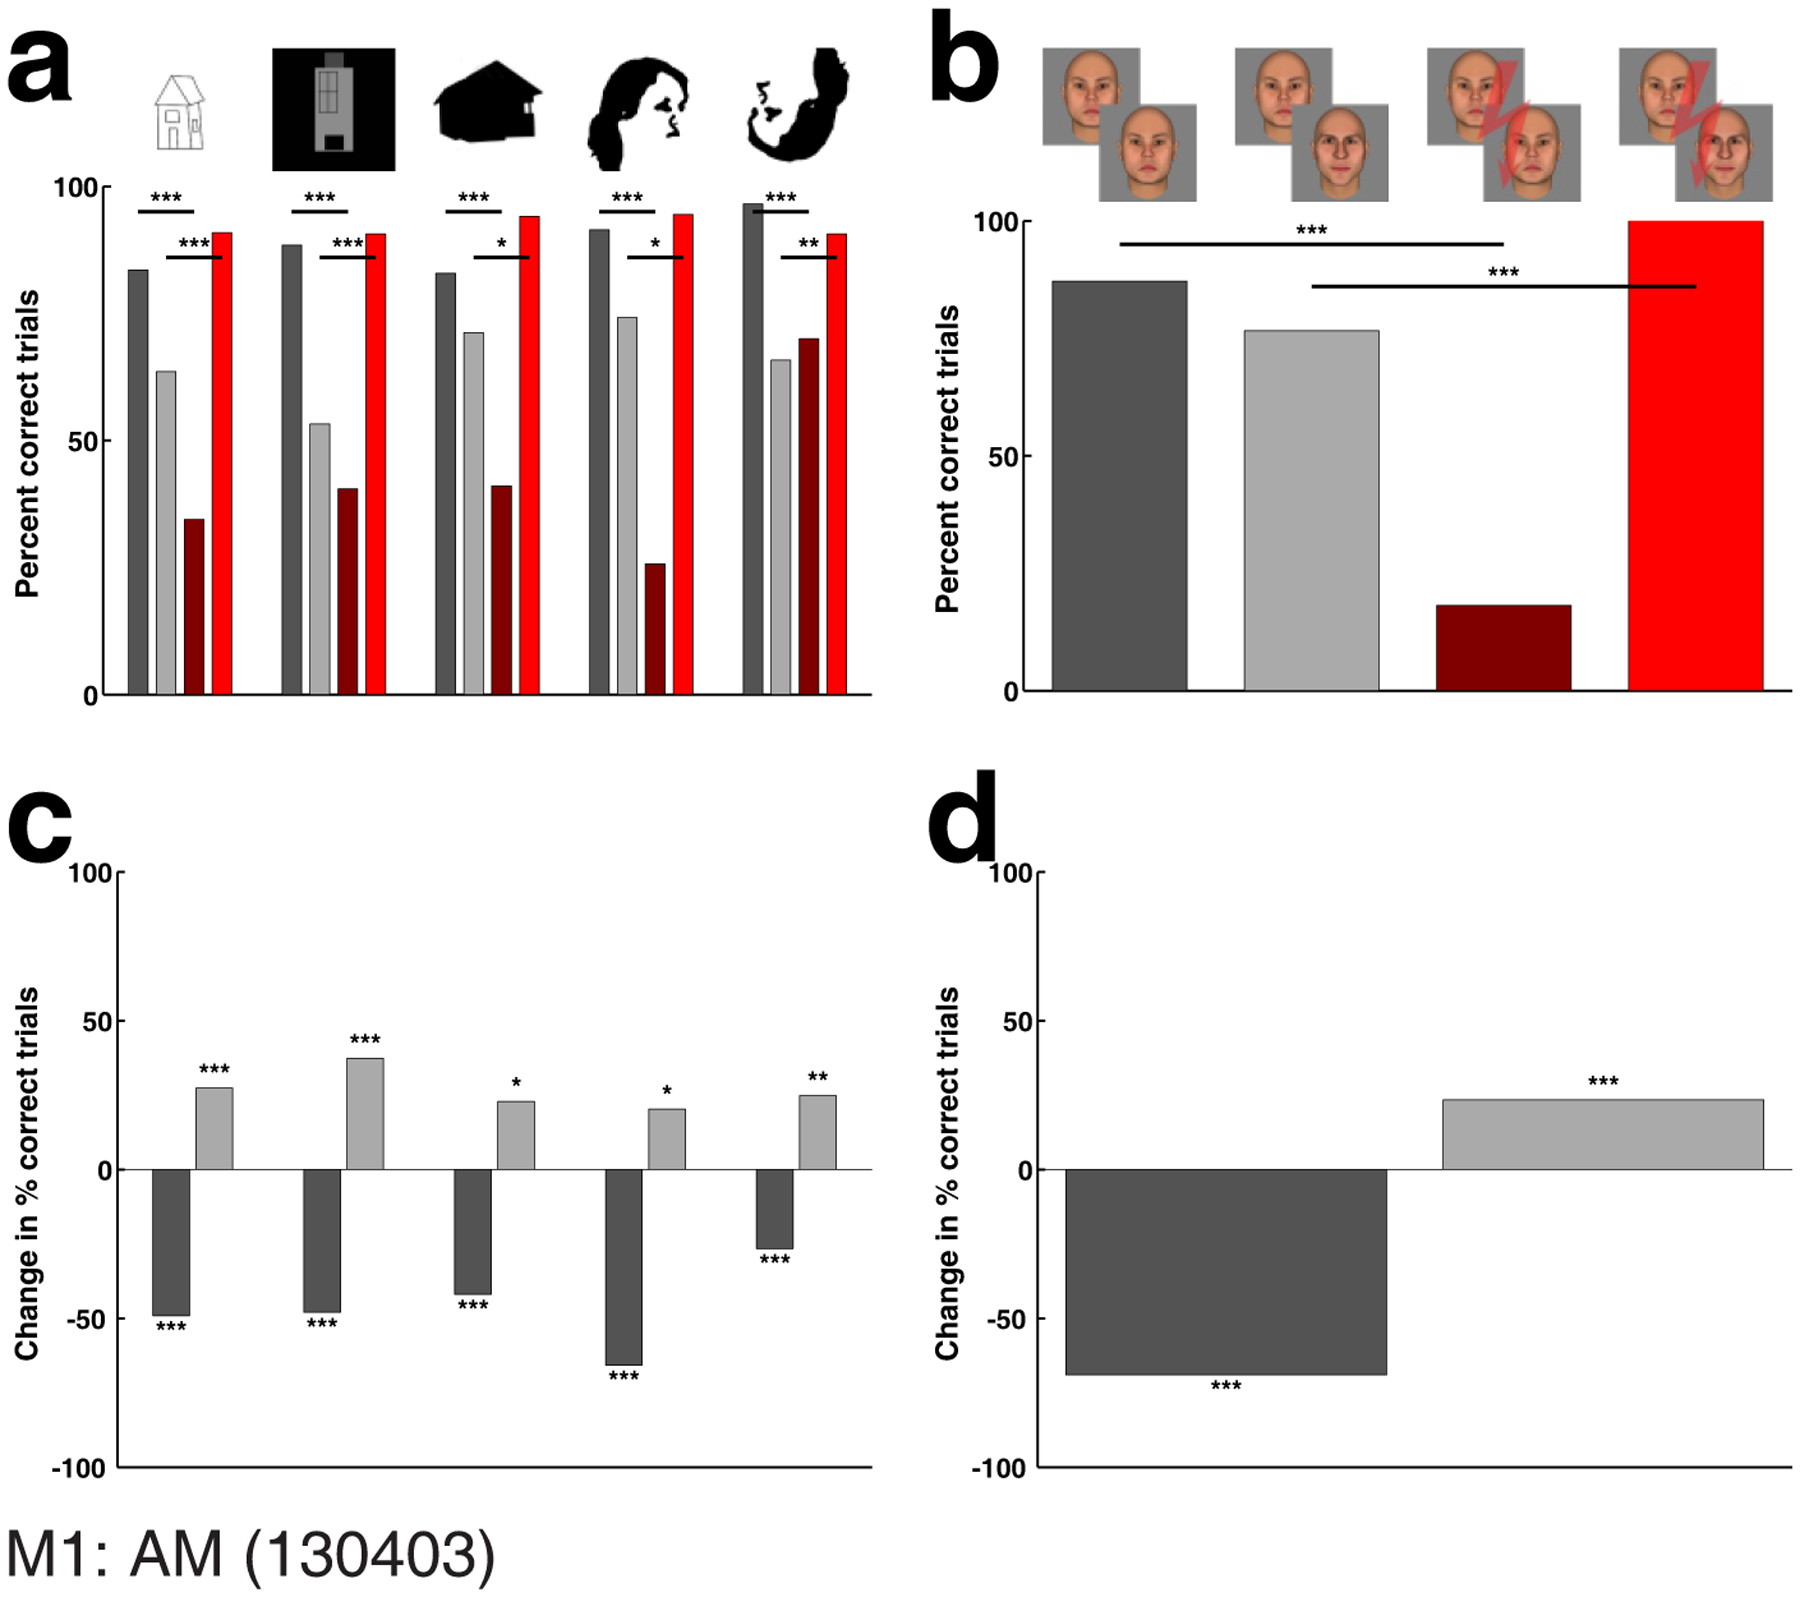
Experiment 4b: Effect of stimulation inside face patch AM on perception of non-face objects II. (a) Effect of face patch stimulation on perception of house line drawings, house cartoons, house silhouettes, Mooney faces, and upside down Mooney faces. (b) Effect obtained in same experimental session, for face stimuli of Experiment 1. (c) Performance change in percentage points caused by electrical microstimulation for same- (dark gray bar) and different-identity trials (light gray bar) for each of the five categories of non-face objects II, and (d) for the faces of Experiment 1. Stimulation current was 300 μA. Conventions as in Fig. 4.
Why did AM stimulation affect the percept of cartoon houses but not the non-face objects used in Experiment 2? One possible reason is that cartoon houses, like Mooney faces (Fig. 7b), may activate the most posterior face patch PL, while the non-face objects in Experiment 2 do not. To test this, we performed an fMRI experiment contrasting activation to real faces, real objects (similar to the ones used in Experiment 2 but taken from our face localizer stimulus), cartoon houses, and real, unambiguous photographs of houses. We found significant activation in PL to both the real faces and the cartoon houses, but not to the real objects or to the real houses (Suppl. Fig. 7).
Experiment 5: Temporal specificity of the effect of microstimulation on face identification behavior
In all the experiments so far, we microstimulated only during presentation of the second cue, reasoning that this would be most analogous to the situation described in24, where a patient with an electrode over the fusiform face area was asked by the neurologist whether he saw something change in the experimenter’s face upon electrical stimulation. What happens when stimulation is applied during presentation of the first cue, or during presentation of both cues? Suppl. Fig. 8a shows the result for stimulation in ML for all three conditions, interleaved in blocks of 10–20 trials for the three stimulation time patterns. On same-identity trials, performance decreased for all three conditions. But the effect for stimulation during cue 1, or during cue 1 and cue 2, was much less than the effect for stimulation during cue 2. This trend was robust, and held true for stimulation in AM (Suppl. Fig. 8b), as well as for stimulation in a second monkey (Suppl. Fig. 8c). One reason the effect was so much weaker for cue 1 stimulation may have been that the effects of stimulation during presentation of the first cue persisted following removal of the cue. An alternative explanation might be that in the time between cue 1 stimulation and the required decision during presentation of cue 2 the brain had sufficient time to “replace” the manipulated information with a correct interpretation from the non-stimulated right hemisphere. We also tested the effect of changing stimulation duration, and found that decreasing the stimulation period from 200 ms (Suppl. Fig. 8b) to 50 ms (Suppl. Fig. 8d) (while keeping cue presentation duration at 200 ms) greatly reduced the behavioral effect of cue 2 stimulation.
A priori, it is not clear what result stimulation during both cues should produce. If the effect of stimulation is a random perturbation of the percept of the face, then one would expect stimulation during both cues to cause identical faces to be perceived as different, with even greater likelihood than for cue 2 stimulation alone. The relative weakness of the result of dual cue stimulation compared to cue 2 stimulation suggests that the perturbation caused by stimulation is not random.
Experiment 6: Bilateral stimulation
Finally, we ran experiments in which we stimulated bilaterally in AM. Briefly, bilateral stimulation of AM during both cues produced a mild but significant increased report of sameness (unlike in all the other stimulation experiments, where there was a decreased report of sameness, Suppl. Fig. 9), hinting that the animals integrate information from both hemispheres. A detailed discussion of this experiment is provided in the Supplementary Text.
Discussion
How does the percept of visual objects arise from neural activity in the brain? The discovery of cortical regions specialized for processing specific classes of visual stimuli such as faces, bodies, and scenes suggests that a distributed, retinotopic representation of low- and mid-level object features within early retinotopic cortex might be re-organized into specialized category-specific channels subsequently in IT cortex, capable of representing fine details necessary to discriminate one class member from another within the same category. But other lines of evidence indicate that IT cortex continues to use a distributed representation: object identity can be rapidly decoded from neural activity recorded in random populations of IT neurons31, and can be decoded using non-maximal fMRI response patterns8. It is of course possible that some objects are represented through distributed mechanisms and others through specialized mechanisms.
A large body of neurological, electrophysiological, fMRI, and human stimulation results suggests that specialized machinery exists to represent faces. This provides us with a “ground zero” for addressing the existence of cortical specialization in IT: are face patches really specialized for representing faces? Here, we examined the perceptual effects of electrical microstimulation targeted to macaque face patches to systematically delineate the class of objects affected by microstimulation. Fig. 9 summarizes microstimulation results across all the stimuli tested: face patches are clearly not equipotential.
Figure 9.
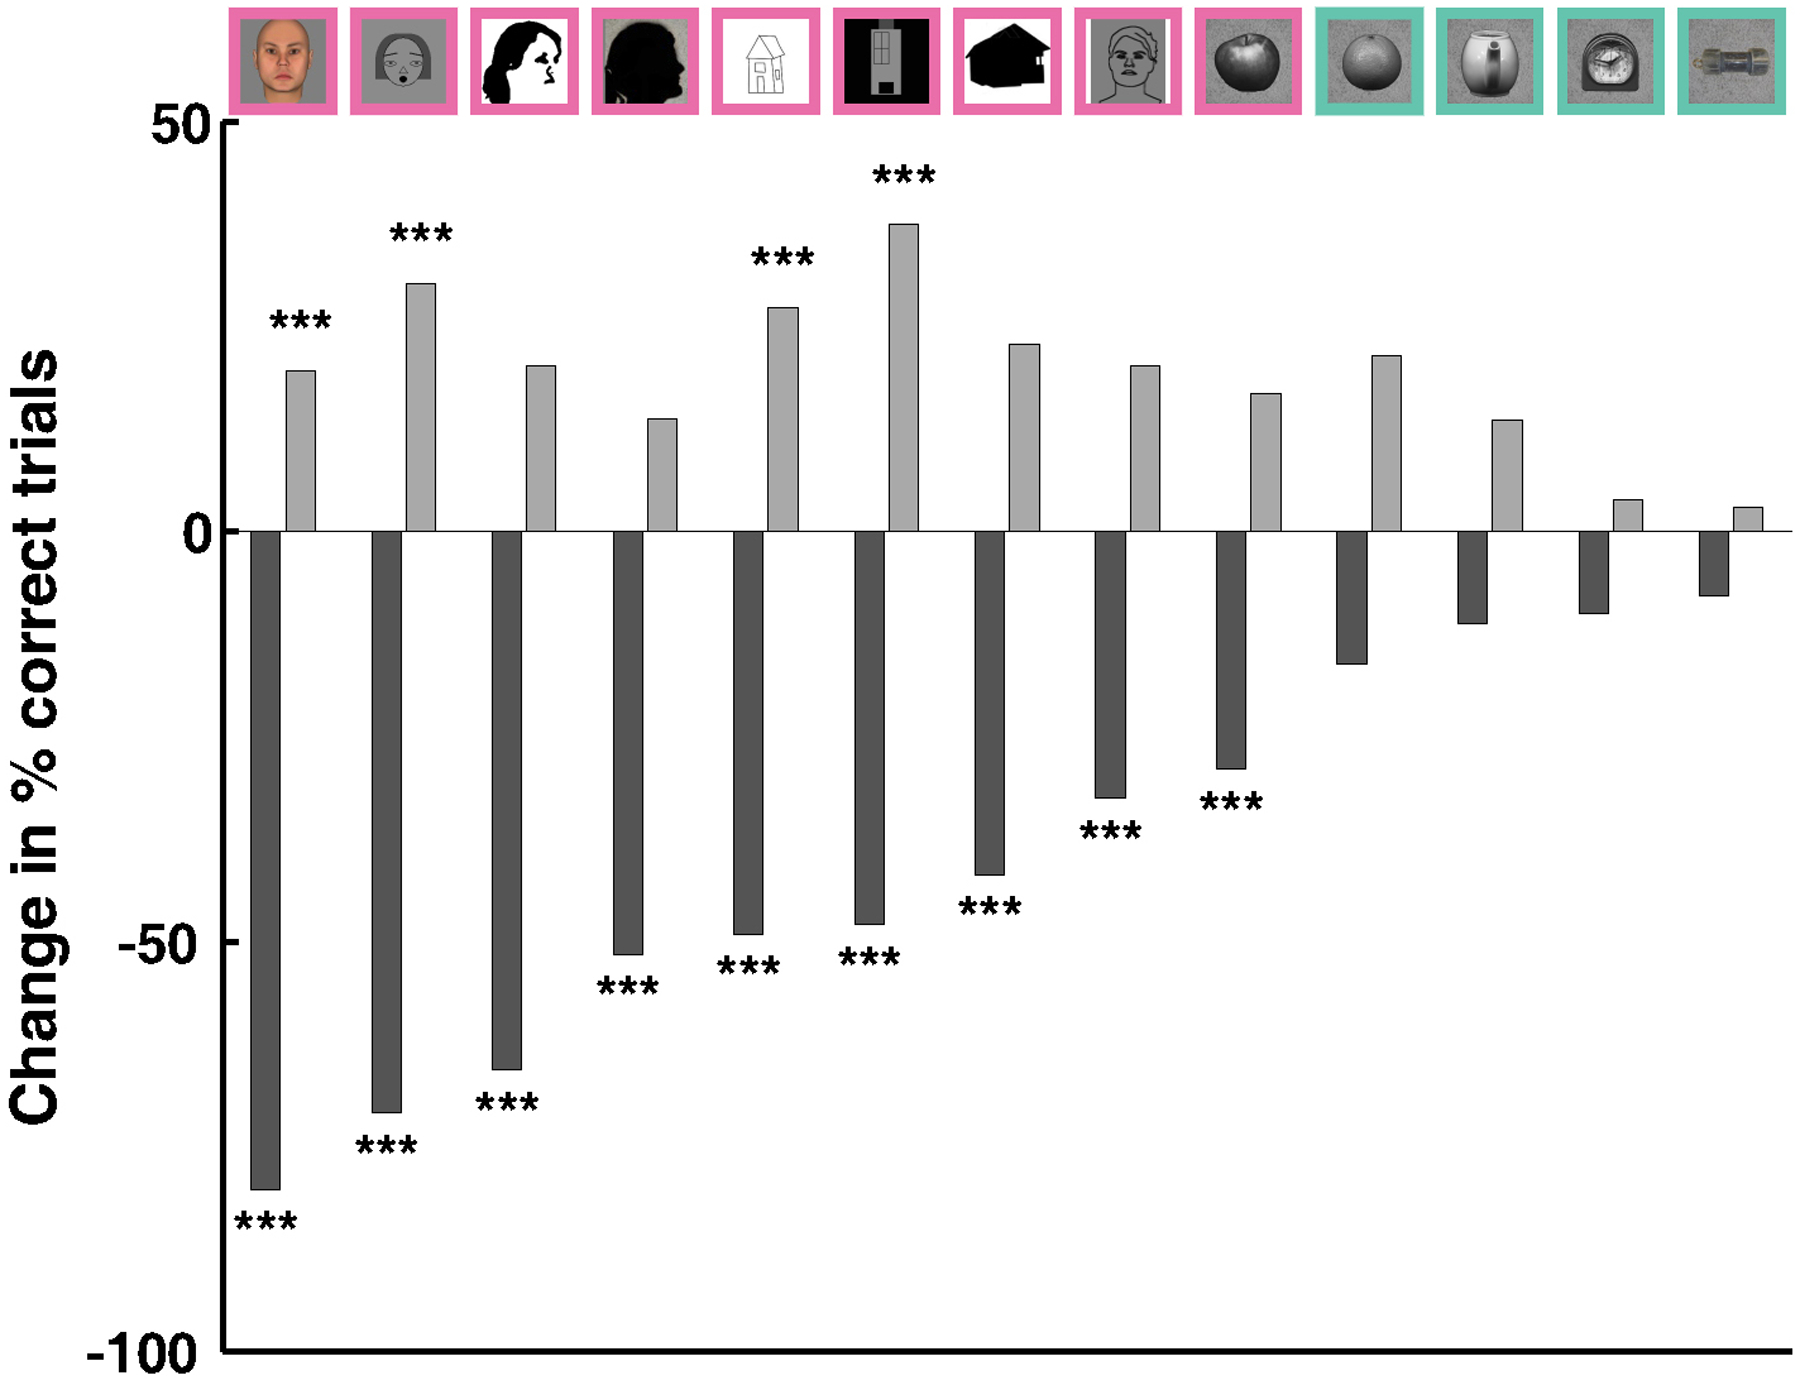
Summary of results. Microstimulation induced performance change in percentage points for the different face and object categories used in the preceding experiments for M1. The categories are symbolized by example images on top. Dark gray bars for same identity, light gray bars for different identity trials. Symbols denote the significance of the induced change as assessed by Fisher’s exact test: ***: P < 0.005.
Confirming the notion of specialized machinery for face representation, we found that stimulation of face patches produced a strong effect on same/different judgments of facial identity, appearing to distort the percept of a face, consistent with previous human reports24,32. We found this effect in all the patches we stimulated, though it seemed stronger in patches on the lateral surface of IT cortex than in those in the fundus. Importantly, the large microstimulation effect we observed required very precise targeting of the stimulation electrode to the center of the face patch (Fig. 3a, b, Suppl. Fig. 3a), supporting the notion that facial identity is represented by a specialized piece of cortex.
A recent study reported that inactivation of a face-selective cell cluster results in a mild impairment of face processing25: a 2% performance decrease on gender discrimination of faces following optogenetic inactivation, and a 5.5% decrease after Muscimol injection. The performance decreases caused by electrical microstimulation in our identification task were much larger: 44% (AF) to 91% (AM). What is the reason for this massive difference in perturbation efficiency? Two possibilities are: 1) Task design: It is unclear to what extent gender discrimination of human faces relies on information processing in the face patches, whereas extensive evidence implicates face patches in facial identification3. Our same/different face identification task directly taps into face identification mechanisms. 2) Affected cortical volume: Afraz et al. estimate that their optogenetic intervention affected a volume of 1 mm in diameter, while the Muscimol injection affected a volume 3 mm in diameter. While we estimate that our microstimulation only affected a volume a few mm in diameter directly at the stimulation site (Fig. 3b, c), we also know that electrical microstimulation significantly affects the fMRI signal at remote projections which coincide almost exclusively with the other face patches6. It seems likely that the brain can compensate for the lack of some information about faces from one patch, but it cannot “undo” the effect of electrical microstimulation, which injects an artificial signal affecting processing not only at that node but in all face patches of the same hemisphere (and more weakly in the contralateral hemisphere’s face patches). Whatever the reason (task or affected cortical volume), our current results strongly support the criticality of the face patches for face processing hinted at by the Afraz et al. study.
Surprisingly, we found that stimulation of face patches could also influence the percept of a number of non-face stimuli, including highly simplified face stimuli such as silhouettes and line drawings, round objects such as apples and citrus fruits, and even objects that could only be construed as face-like at a very abstract level (if at all) such as cartoon houses. One interpretation of this result is that the representation of these other categories may depend on face cortex, or cortex very close to the face patches (Interpretation 1). An alternative interpretation is that stimulation may have evoked “face phosphenes”33–35, and such hallucinations may have been elicited only when the monkey could view non-face objects compatible with a face, as if perception would require a suitable “canvas” onto which to paint facial features, e.g., the apples and citrus fruit in Experiment 3 (Interpretation 2).
According to Interpretation 2, even though stimulation of face patches elicited large effects on perception of certain classes of non-face objects, the face patches would not normally be involved in encoding these non-face objects. This is consistent with the finding that stimulation of face-selective clusters of cells increases likelihood of face detection in a fully ambiguous noise stimulus20. Further supporting Interpretation 2, an extensive study of both fMRI and single-unit responses to one of the abstract patterns tested in the current study, namely, upright Mooney faces, revealed no significant response in AM of one animal (Fig. 7b, c). Yet, stimulation of AM in this same animal could nevertheless significantly affect its percept of the Mooney faces (furthermore, the regions of IT cortex that were activated by Mooney faces in this animal were very distant from AM (Fig. 7b), making Interpretation 1 unlikely in this case). This unexpected result suggests that the set of stimuli for which face patch stimulation can produce a perceptual effect may be much larger than the set of stimuli which elicit a significant response in cells within the patch.
Close perusal of the pattern of fMRI activation to Mooney faces in this animal (Fig. 7b) suggests a concrete explanation: stimulation of AM may have activated the most posterior face patch PL, and this in turn may have perturbed the percept of Mooney faces (since Mooney faces did activate PL in this animal). Generalizing from this observation, it is possible that PL (or other parts of IT cortex providing inputs to the face patches) may play a significant role in coding not only Mooney faces but also other non-face images for which face patch stimulation elicited a significant perceptual effect. The fact that cartoon houses elicited significant activation in PL, while clearly non-face objects did not (nor did unambiguous photographs of real houses), further supports this idea, since microstimulation of AM significantly affected the percept of cartoon houses but not clearly non-face objects.
Importantly, the fact that stimulation elicited almost no effect on clearly non-face objects indicates that stimulation is not simply imposing a face phosphene/hallucination on top of the presented stimulus—but instead produces a response that interacts strongly with neural responses to a simultaneously presented visual stimulus for a specific subset of visual stimuli. An important challenge for the future will be to more precisely delineate the subset of visual stimuli for which face patch stimulation can exert a perceptual influence, perhaps through use of parametrically-defined stimuli spanning the gamut from faces to clearly non-face objects.
Our results suggest that the face patches are not the site of storage of short term visual memory. Since the task included a temporal delay between presentation of the first and second cues, the monkey had to correctly remember the first cue. The fact that it responded with a bias to see the first and second cues as different upon stimulation during the second cue suggests that he could remember the first cue correctly—this was not disrupted by stimulation (otherwise, one would have expected him to guess at chance).
In summary, our results show that face patches play a unique role in representing facial identity, as only stimulation precisely targeted to the center of a face patch could elicit large effects on face perception, but may play a role in representing non-face objects as well, as stimulation of face patches affected the percept of a much larger class of objects than just faces. Ultimately, understanding how objects are represented in IT cortex will require recordings beyond IT cortex to clarify how the IT object code is read out by subsequent areas to subserve behavior.
Methods
All procedures conformed to local and US National Institutes of Health guidelines, including the US National Institutes of Health Guide for Care and Use of Laboratory Animals.
Face Patch Localization
Two male rhesus macaques were trained to maintain fixation on a small spot for juice reward. Monkeys were scanned in a 3T TIM Trio (Siemens) magnet equipped with an AC88 gradient insert while passively viewing images on a screen. MION contrast agent (8mg/kg body weight, Feraheme, AMAG) was injected to improve signal to noise ratio. Six face-selective regions were identified in each hemisphere in both monkeys. Additional details are available in2,3,7. We targeted face patches AM, ML, AL, and AF in monkey M1, and face patches AM, ML, and MF in monkey M2 using custom software for designing 3D-printed grids with holes allowing access to specific fMRI-identified regions36. We confirmed the electrode position following many behavioral sessions with an anatomical MRI (T1-weighted, MPRAGE with 0.5 mm isotropic voxel size) immediately after the session was over.
Visual Stimuli and Behavioral Task
Monkeys were head fixed and passively viewed the screen in a dark room. Stimuli were presented on a CRT monitor (DELL P1130). Screen size covered 21.6 × 28.8 visual degrees and stimulus size spanned 7 degrees. The fixation spot size was 0.25 degrees in diameter. During stimulation sessions, we first localized the depth of the face patch by recording while presenting a face localizer stimulus consisting of 96 images comprising: 16 real faces, 16 fruits, 16 technical gadgets, 16 human hands, 16 human bodies, and 16 scrambled images (in a subset of the sessions we also presented 14 monkey faces, 16 monkey bodies. and 16 monkey body parts for a total of 142 images; here we only present data from the consensus set of 96 images). Images were presented in random order using custom software. Eye position was monitored using an infrared eye tracking system (ISCAN). Juice reward was delivered every 2–4 seconds if fixation was properly maintained. Images were presented in rapid succession (5 images/s) and each image was presented 3–5 times to obtain reliable firing rate statistics.
For the behavioral task, each trial began with presentation of a fixation spot (1000 ms), followed by Cue 1 (200 ms), a delay during which the fixation spot remained visible (600 ms), Cue 2 (200 ms), and then the two targets, a red X and a green V. The animal was required to saccade to the V if the two cues depicted the same identity, and to the X if they depicted different identities. The animal was given up to 2000 ms to respond, before the targets were extinguished. Visual stimulation was performed using custom scripts written in MATLAB (MathWorks).
In the main experiment (Experiment 1, 32 faces, 6 exemplars), for each trial we randomly selected one image from all 192 different images as the first cue. The second cue was drawn either from all images showing a different identity (in the same category) as the first cue (one of 186 images), or from all images showing the same identity (one of 6 images). Trials were randomly selected to be same or different (no blocking). Electrical stimulation was delivered on 33% of trials (trials were grouped into groups of six; within these six trials, two had no microstimulation, while four had microstimulation 50% of the time, randomly chosen; we inserted the two no microstimulation trials to maintain electrode integrity by avoiding long sequences of stimulation trials).
For Experiments with different categories (Experiments 3, 4a, and 4b), we changed the category every six trials; for example, for Experiment 3, we presented six trials of apples followed by six trials of faces, etc.
Five different image sets were tested for the behavioral task: (1) Faces: one category: 32 faces at 6 different expressions each (examples in Fig. 1d), (2) Objects: one category: 28 colored objects at 3 views each (examples in Fig. 1e), (3) Round Objects and Faces: five categories: 3 apples, 3 citrus fruits, 3 pots, 3 clocks, and 3 faces: (examples in Fig. 1f). (4) Abstract Faces: four categories: 4 cartoon faces, 4 line drawings of faces, 4 Mooney faces and 4 face silhouettes (examples in Fig. 1h) (5) Abstract houses: five categories: 4 cartoon houses, 4 line drawings of houses, 4 silhouettes of houses, and 4 Mooney faces and the same 4 Mooney faces upside down (examples in Fig. 1g). By presenting faces of the same identity at 6 different expressions in image set 1 and objects of the same identity at 3 different view in image set 2, we ensured that even in the match condition we presented two different images. Face stimuli were artificially generated identities (Singular Inversions FaceGen) using the same texture map and were presented without hair. Of the 28 colored objects, 16 were taken from the Amsterdam Library of Object Images (ALOI, (Geusebroek et al., 2005)) the remainder where photos taken from objects in the animals housing (roughly matched for color and overall shape quality (roundness)).
Behavioral Training
Both monkeys were initially trained on a passive fixation task, which only required them to keep fixation inside a 5 degree diameter window around a central fixation spot. Later, both animals were trained in a number of object categorization tasks all structured as the task reported in the paper (2 sequentially presented images followed by a display of two saccade choice targets, where the animal reported whether the two presented images belonged to the same or different “categories”). Initially we only presented the correct choice target during the choice period (i.e., if the two images were in the same category, then only the “same” choice target; if they belonged to different categories, then only the “different” choice target was shown). After performance on this reached 75%, we then switched to displaying both choice targets simultaneously (standard trials). In early training we started each session with a short block of single choice trials for both conditions to affirm the animal’s association between saccade target and condition; after the initial training sessions we only showed the full choice target display.
The first categorization task that the animals were trained on was an extremely simple one: a single tomato versus a cluster of grapes (images of 5 grapes and 5 tomatoes were taken from the Caltech-256 dataset, http://www.vision.caltech.edu/Image_Datasets/Caltech256/, see Suppl. Fig. 10b left columns). In the same condition, we always used the identical image as first and second cue, while in the different condition we randomly selected the first cue from one category, and randomly selected the second cue from the five exemplars of the other category. The second training task consisted of 5 different images each of 5 different human faces (see Suppl. Fig. 10b right columns for examples); here we excluded the image presented as first cue when selecting the second cue image for the same condition, so that the monkey would perform the task using face identification rather than simple pixel matching. As in the first task, on “different” trials, the first and second cues were each randomly selected. Performance on these two tasks is shown in Suppl. Fig. 10a.
Next, we trained animals on the main task (32 faces, 6 exemplars each). Image selection was exactly as in the second training task except that in the “same identity condition” we drew the second cue from all 6 images of the selected identity. Both animals showed stable, good performance on this task across many sessions (Suppl. Fig. 10c, d).
Finally, we presented stimulus sets consisting of non-face objects (either 16, 19 or 28, see Experiment 2). For this task, both animals instantaneously performed at above 70% correct, indicating that they could generalize the same/different identification task independent of the actual stimuli presented, see Suppl. Fig 10e, f. The same generalization was evident in the round object identification task (see Experiment 3), see Suppl. Fig 10g, h; for the abstracted faces and houses from Experiment 4b, see Suppl. Fig. 10i, j.
Neural Recording and Microstimulation
Platinum Iridium electrodes (FHC, UE(SM09) 80 μm exposed tip, impedance typically 250 KOhm) were back loaded into plastic/silica guide tubes (Polymicro/Molex, TSP530660). Guide tubes length was set to reach approximately 2–3 mm below the surface of the dura mater. The electrode was advanced slowly with a manual advancer (Narishige Scientific Instrument, MO-97A). Neural signals were amplified and extracellular action potentials were isolated using the box method in an on-line spike sorting system (Plexon, MAP). Spikes were sampled at 40 kHz. All spike data was re-sorted with off-line spike sorting clustering algorithms (Plexon, Offline-Sorter). Only well-isolated single and multi-units were considered for further analysis (mainly very short duration on-line confirmation of face selectivity of target areas to confirm proper electrode location in or outside a face patch; during on-line assessment a site was deemed face-selective if either a unit and/or the LFP showed a noticeable different response for any of the two face categories used, human and monkey faces). Stimulation electrodes typically could be reused for several sessions but the recoding quality and unit separation suffered noticeably from each added micro-stimulation session. See Suppl. Fig. 11 for a population overview of units recorded during and after the stimulation sessions that where sufficiently isolated and artifact free. The upper part of each plot shows the normalized mean response (over the full 200ms image duration) for each unit to each of the 96 consensus images, while the bar plots below shows the population mean response as well as the distribution of the face selectivity index for the whole population. For all of the experiments presented in the paper with the exception of Suppl. Fig. 8 and 9, we microstimulated only during presentation of cue 2. During microstimulation, we applied one pulse train per second, lasting 200 ms (with the exception of the session M1: AM (130213) shown in Suppl. Fig. 8d, where we only stimulated for 50 ms, and Suppl. Fig. 9a where we stimulated for 500 ms). We used a stimulus isolator (WPI, A365D) to generate the actual stimulation pulses, driven by a pulse generator (Grass, S88X), that in turn was triggered for each stimulation train by a TTL output of the behavioral control software. For experiments in the more posterior patches ML and MF we delayed the microstimulation for 50 ms; for the anterior patches AF, AL, and AM we delayed the microstimulation for 75 ms relative to cue onset to account for the typical neuronal response latencies of these patches. We used a pulse frequency of 150 Hz. Bipolar, cathodal-first current pulses were charge balanced, with a phase duration of 200 μs and a distance between the two phases of 100 μs. We used current amplitudes of 50, 100, 200, or 300 μA. In microstimulation sessions we typically only electrically stimulated during one third of the trials, to not give the animals an incentive to change their strategy from identification to guessing.
The experiment to illustrate the spatial activation spread around the stimulation electrode tip as a function of stimulation current (Fig. 3b, c) was performed as follows. The animal was scanned awake in a 3T MR-scanner (Allegra Siemens) while performing a simple fixation task; maintenance of fixation on a small fixation dot (0.36° diameter) on an otherwise uniformly gray screen was rewarded with drops of juice. On each run of 544 seconds we interleaved 32 seconds blocks of no-stimulation with 32 second blocks of stimulation (to later determine the contrast stimulation epochs versus baseline epochs), MR data analysis was performed using Freesurfer’s fsfast stream. Signal was enhanced using the iron contrast agent ferumoxtran-10 (Sinerem, Guerbet; concentration: 21 mg Fe/ml in saline; dosage: 8 mg Fe/kg). Unlike BOLD, Sinerem results in a signal reduction at activated voxels. All presented time course data is shown inverted to allow easier comparison with the more typical BOLD time course data. Functional data was acquired in coronal slices. We used a multi-echo sequence (EPI, TR 4 s, TE 25 ms, 64 × 64 matrix, 28 slices at 1.5 mm3 isotropic resolution 136 Volumes per run). See6 supplementary online material for more detail
For the fMRI experiment to compare responses to faces, objects, cartoon houses, and real houses (Supplementary Figure 7), data was acquired at 1 mm istrotropic, with MION contrast agent, in a third monkey that had been trained to fixate. Stimuli were presented in 24 s blocks. The full stimulus set consisted of one face block (16 images of human faces), one object block (4 fruits, 4 human bodies, 4 hands and 4 gadgets), one Mooney face block (4 “Mooney” faces), one cartoon-house block (4 line-drawings of cartoon houses), one real-house block (4 images of real houses) and one scrambled block (40 grid-scrambled images of faces or objects). Each image was presented for 1 s. We always started and ended with a scrambled block.
Data analysis
Data analysis was performed using custom scripts written in MATLAB (MathWorks).
We used the Fisher’s exact test to determine significance of microstimulation on behavioral performance26. This test, performed on the contingency table of correct and incorrect responses for same- and different-identity trials per object category (depending on the experiment) and per micro-stimulation condition, returns the probability of erroneously assuming differences between columns. Unlike the chi-square test, Fisher’s exact test works with small, sparse, or unbalanced data as encountered when the performance reaches 100%. Since we only performed one test per trial type (i.e. same- or different-identity) multiple comparison correction was neither required nor used. In addition we also calculated the signal detection theory measures d’ and criterion c37. For this analysis we interpreted our task as a same-identity detection task with different-identity trials as “noise”; hence negative criterion c values signify a bias to report same-identity, while positive criterion c values signify a bias to report different-identity.
For Suppl. Fig. 11 we first calculated the mean response of each unit to each individual image as well as the baseline response from the grey period between two image presentations in the localizer stimulus set. We selected a time window of 50 to 250 ms after image onset to roughly account for the neuronal latencies in IT cortex. We then calculated the neuronal response by subtracting the average baseline rate from the per-image-average rates for each neuron and normalized by dividing through the absolute largest response for each unit. To calculate the face selectivity index (FSI) we averaged the normalized average responses separately for face and non-face images; we then took the quotient of the difference between these two averages over the sum of them. For the FSI plot we clamped minimum and maximum FSI values to −1 and 1 respectively.
Supplementary Material
Supplementary Figure 3. The dependence of effect magnitude on proximity of the stimulation site to the center of the face patch for the five different object categories from Experiment 3. Same conventions as in Figure 3a. Pooled data for 14 sessions (M1: 9, M2: 5) showing how the magnitude of electrical microstimulation effect on same (left column) and different identity trials (right column) correlates with the face selectivity of the target location as measured by fMRI. Out of the five object categories (faces (a), apples (b), citrus fruit (c), pots (d) and clocks (e)), only for faces was there a significant correlation (same identity trials: p: 0.044706, correlation coefficient r = −0.54319, r2 = 0.2951; different identity trials: p: 0.0053008, correlation coefficient r = 0.70014, r2 = 0.4902).
Supplementary Figure 2. The dependence of effect magnitude for round objects on stimulation current strength and electrode position for subject M1 for three different sessions. (a) Low stimulation current (50 μA) inside face patch AM. (b) Intermediate stimulation current (100 μA) inside face patch AM. (c) Large stimulation current (200 μA) outside the face patches. Top row: Behavioral performance on same and different trials, with and without microstimulation, for stimulation in face patch AM of monkey M1, for faces, apples, citrus fruits, teapots, and clocks. 2nd row: Size of stimulation effect in percentage points for the same five categories. 3rd row: Behavioral performance on same and different identity trials of the face identification task of the same session. 4th row: Size of stimulation effect for the face identification task. Conventions as in Suppl. Fig. 1.
Supplementary Figure 1. The dependence of effect magnitude for faces on stimulation current strength. (a, b) Behavioral performance on same- and different-identity trials, with and without microstimulation, for stimulation strength magnitude of 100 μA (a) and 300 μA (b), with stimulation performed in the same session (AM, M1). (c, d) Another session, comparing effect on behavior of face patch stimulation at 100 μA and 300 μA (AM, M1). (e, f) Effect of face patch stimulation at 100 μA and 200 μA during the same session (AM, M2). (g, h) Effect of face patch stimulation at 100 μA and 200 μA during the same session (AM, M2). (i, j, k) Effect of face patch stimulation at 100 μA, 200 μA, and 300 μA during the same session (ML, M2). Gray bars denote trials without, red bars trials with electrical micro-stimulation; Darker bars show the performance for same identity trials, lighter bars for different identity trials. *: P < 0.05; **: P < 0.01; ***: P < 0.005; Fisher’s exact test. The lower plot in each panel shows the change in percentage points caused by electrical stimulation for same identity trials in dark gray and for the different identity trials in light gray.
Supplementary Figure 4. Experiment 2: Effect of stimulation inside face patch AM on the perception of non-round objects.; conventions as in Fig. 2. (a) Effect of AM stimulation on non-round object perception in monkey M1. Performance was significantly worse on microstimulation “same” trials (reduction by 7.77 percentage points). (c) Performance change in percentage points caused by electrical microstimulation for same- (dark gray bar) and different-identity trials (light gray bar) (b) Same as (a) and (d) same as (c), for stimulation in monkey M2. Stimulation current was 300 μA.
Supplementary Figure 5. Experiment 4b: Effect of stimulation inside face patch AM on perception of non-face objects II in M2. (a) Effect of face patch stimulation on perception of house line drawings, house cartoons, house silhouettes, Mooney faces, and upside down Mooney faces. (b) Effect obtained in same experimental session, for face stimuli of Experiment 1. (c) Performance change in percentage points caused by electrical microstimulation for same- (dark gray bar) and different-identity trials (light gray bar) for each of the five categories of non-face objects II, and (d) for the faces of Experiment 1. Stimulation current was 200 μA. Conventions as in Fig. 4.
Supplementary Figure 6. Electrode position for M1 showing that for the data presented in Fig. 6 the electrode tip was located inside face patch AM. Scale bar (top left) = 1 cm.
Supplementary Figure 8. Experiment 5: The dependence of effect magnitude on stimulation timing. Behavioral performance for same- and different-identity trials, across four different stimulation conditions: no stimulation (gray bars), stimulation during cue 1 and cue 2 (yellow bars), stimulation during cue 1 (green bars), stimulation during cue 2 (red bars). Plots on the right show the change in percentage points caused by electrical stimulation (electrical stimulation during cue1: green; during cue2: red; during both cues: yellow). Darker bars denote same-identity trials, lighter bars different-identity trials. *: P < 0.05; **: P < 0.01; ***: P < 0.005; Fisher’s exact test. (a): ML, M1, (b): AM M1, (c): AM M2. (d): AM M1: Stimulation experiment in M1, with stimulation trains of 50 ms duration (images were presented for 200 ms each), instead of 200 ms (b). All trains were delayed by 75 ms relative to visual stimulation to account for the typical response latency of anterior temporal cortex.
Supplementary Figure 9. Experiment 6: The effect of simultaneous dual hemispheric AM stimulation on face identification behavior. In these two sessions one stimulation electrode was placed into the left and one into the right face patch AM; stimulation was applied during both the first and the second cue image. (a) Top: Composite MR image showing the electrodes in the left and the right hemisphere with face patch positions shown as yellow overlays (overlay threshold p = 10−10, saturation value p = 10−20). The red line in the middle shows where the two halves were merged (since both electrodes were on skew lines each half of the brain was rotated slightly differently to show both electrode trajectories in full). The white scale bar at the top left measured 1cm. Middle: the effect of dual AM microstimulation on the identification of faces (M1 121008, current used 100 μA, cue presentation duration and microstimulation duration 500 ms). Bottom: Difference in percentage points between performance caused by electrical microstimulation for same- (dark gray bar) and different-identity trials (light gray bar). (b) Middle: the effect of dual AM stimulation on the identification of faces, using shorter cue presentation duration (200 ms) and a stronger current (300 μA). Bottom: Performance change in percentage points caused by electrical microstimulation for same- (dark gray bar) and different-identity trials (light gray bar). Gray bars denote trials without, red bar trials with microstimulation, darker bars show same identity trials, lighter bars different identity trials. P-levels as in Fig. 2; P < 0.05; **: P < 0.01; ***: P < 0.005; Fisher’s exact test. Note that in (a) we used a stimulus set that used 3 different view angles per identity to make the task more challenging, explaining the relative low performance compared to the experiments that used facial expression to vary the face images.
Supplementary Figure 10. Behavioral performance from training sessions and from experimental sessions from non-microstimulated trials. This figure shows the task performance over the course of multiple sessions, always starting with the first session a stimulus set was introduced. Performance was averaged over same and different identity trials. (a) M1: The red line shows the initial task that consisted of performing same/different discrimination between five images of grape clusters and five images of single tomatoes; for the same condition we always presented the exact same image, for different we always selected one image from the 5 exemplars of the other category. The green line shows the initial performance on the initial face identity discrimination task. In this task we presented color photographs of 5 persons at 5 different views each, for the same condition we only selected the 2nd cue image from the 4 images of each identity not used as 1st cue, for the different condition we randomly selected one of the 20 images belonging to the remaining identities. Note how the performance for grapes and tomatoes ramps up over 4 sessions and how well the animal transferred to the face identification task (the animal had discriminated different face stimuli in past experiments). (b) Example stimuli. Left: all grape and tomato images used in initial training. Right: three exemplary identities at five views. (c) M1 and (d) M2 performance in >40 sessions with the 32 identities at 6 different facial expressions task (see Experiment 1). Note with M2 there was an initial ramping up from near chance performance, but both animals generalized quickly from the initially trained face set to the new set. (e & f) Performance in the different versions of the object identification task (as described in Experiment 2); both M1 and M2 immediately generalized to the different object sets. Note that we only added more stimuli, so the 16 objects set was a subset of both the 19 and 28 objects sets. (g & h) Performance for Experiment 3: both animals immediately generalized to the five new categories. Note that on the 8th session, M1 changed his strategy to guessing only to return to “normal” performance on the next session. (i & j) Performance on the abstract face and house stimuli from Experiment 4b; M1 immediately generalized to the new stimuli, while M2’s performance improved over the first few sessions before stabilizing.
Supplementary Figure 11. Neuronal response selectivity at the different stimulation sites and subjects. The upper part of each panel shows the normalized mean response for each unit to each of the 96 consensus images, while the lower panel shows the population mean response. Note that most units were recorded for the minimal time to see whether there was difference between face and non-face categories, so often images were not repeated often enough to allow the normalization to work, such occurrences are colored black in the upper panels and ignored for the averaging shown in the middle panels. The lower panels show the distribution of the face selectivity indices for all units per patch and animal, distance from the midpoint at zero correlates with face selectivity. The scale bar at the bottom right of the figure shows the mapping between color and normalized response. The category of each image is color-coded by the rainbow bar between the two panels. The order of the presented population data mainly follows Fig. 2 to facilitate direct comparison: (a) AM of monkey M1 (b) AM of M2, (c) ML of M1, (d) ML of M2, (e) AL of M1, (f) MF of M2, (g) AF of M1 (h) control site outside of the face patches in M1.
Supplementary Figure 7. Activation to faces, cartoon houses, real houses, and real objects. (a) Coronal slices showing fMRI activation to the contrast faces > objects. Face patches are indicated by arrows. (b, c) Slices from the same animal as (a), showing activation to the contrast cartoon houses > objects (b), and real houses > objects (c). (d) Flat maps of the left and right hemisphere visual cortex, showing the same data as (a-c). Face patches are indicated by green outlines. Notice overlap between face patches ML and PL and cartoon house activation (middle two panels), which is absent for real house activation (right two panels). Face patches indicated by green outlines in middle and right panels. (e) Beta values for faces, cartoon houses, real houses, and real objects, from PL/ML, showing strong activation to faces and to cartoon houses.
References
- 1.Gross CG, Rocha-Miranda CE & Bender DB Visual properties of neurons in inferotemporal cortex of the Macaque. J. Neurophysiol 35, 96–111 (1972). [DOI] [PubMed] [Google Scholar]
- 2.Tsao DY, Freiwald WA, Tootell RBH & Livingstone MS A cortical region consisting entirely of face-selective cells. Science 311, 670–674 (2006). [DOI] [PMC free article] [PubMed] [Google Scholar]
- 3.Freiwald WA & Tsao DY Functional compartmentalization and viewpoint generalization within the macaque face-processing system. Science 330, 845–851, doi: 10.1126/science.1194908 (2010). [DOI] [PMC free article] [PubMed] [Google Scholar]
- 4.Issa EB & DiCarlo JJ Precedence of the eye region in neural processing of faces. J Neurosci 32, 16666–16682, doi: 10.1523/JNEUROSCI.2391-12.2012 (2012). [DOI] [PMC free article] [PubMed] [Google Scholar]
- 5.McMahon DB, Jones AP, Bondar IV & Leopold DA Face-selective neurons maintain consistent visual responses across months. Proc Natl Acad Sci U S A 111, 8251–8256, doi: 10.1073/pnas.1318331111 (2014). [DOI] [PMC free article] [PubMed] [Google Scholar]
- 6.Moeller S, Freiwald WA & Tsao DY Patches with links: a unified system for processing faces in the macaque temporal lobe. Science 320, 1355–1359 (2008). [DOI] [PMC free article] [PubMed] [Google Scholar]
- 7.Ohayon S, Freiwald WA & Tsao DY What makes a cell face selective? The importance of contrast. Neuron 74, 567–581, doi: 10.1016/j.neuron.2012.03.024 (2012). [DOI] [PMC free article] [PubMed] [Google Scholar]
- 8.Haxby JV et al. Distributed and Overlapping Representations of Faces and Objects in Ventral Temporal Cortex. Science 293, 2425–2430, doi: 10.1126/science.1063736 (2001). [DOI] [PubMed] [Google Scholar]
- 9.Verhoef B-E, Vogels R & Janssen P Contribution of Inferior Temporal and Posterior Parietal Activity to Three-Dimensional Shape Perception. Current Biology 20, 909–913, doi: 10.1016/j.cub.2010.03.058 (2010). [DOI] [PubMed] [Google Scholar]
- 10.Hasson U, Levy I, Behrmann M, Hendler T & Malach R Eccentricity bias as an organizing principle for human high-order object areas. Neuron 34, 479–490 (2002). [DOI] [PubMed] [Google Scholar]
- 11.Konkle T & Oliva A A real-world size organization of object responses in occipitotemporal cortex. Neuron 74, 1114–1124, doi: 10.1016/j.neuron.2012.04.036 (2012). [DOI] [PMC free article] [PubMed] [Google Scholar]
- 12.Wiggett AJ, Pritchard IC & Downing PE Animate and inanimate objects in human visual cortex: Evidence for task-independent category effects. Neuropsychologia 47, 3111–3117, doi: 10.1016/j.neuropsychologia.2009.07.008 (2009). [DOI] [PubMed] [Google Scholar]
- 13.Haushofer J, Baker CI, Livingstone MS & Kanwisher N Privileged coding of convex shapes in human object-selective cortex. J Neurophysiol 100, 753–762, doi: 10.1152/jn.90310.2008 (2008). [DOI] [PMC free article] [PubMed] [Google Scholar]
- 14.Yue X, Pourladian IS, Tootell RB & Ungerleider LG Curvature-processing network in macaque visual cortex. Proc Natl Acad Sci U S A 111, E3467–3475, doi: 10.1073/pnas.1412616111 (2014). [DOI] [PMC free article] [PubMed] [Google Scholar]
- 15.Srihasam K, Vincent JL & Livingstone MS Novel domain formation reveals proto-architecture in inferotemporal cortex. Nature neuroscience 17, 1776–1783, doi: 10.1038/nn.3855 (2014). [DOI] [PMC free article] [PubMed] [Google Scholar]
- 16.Tootell RB, Nelissen K, Vanduffel W & Orban GA Search for color ‘center(s)’ in macaque visual cortex. Cereb Cortex 14, 353–363 (2004). [DOI] [PubMed] [Google Scholar]
- 17.Lafer-Sousa R & Conway BR Parallel, multi-stage processing of colors, faces and shapes in macaque inferior temporal cortex. Nature neuroscience 16, 1870–1878, doi: 10.1038/nn.3555 (2013). [DOI] [PMC free article] [PubMed] [Google Scholar]
- 18.Salzman CD, Britten KH & Newsome WT Cortical microstimulation influences perceptual judgements of motion direction. Nature 346, 174–177, doi: 10.1038/346174a0 (1990). [DOI] [PubMed] [Google Scholar]
- 19.Histed MH, Ni AM & Maunsell JH Insights into cortical mechanisms of behavior from microstimulation experiments. Prog Neurobiol 103, 115–130, doi: 10.1016/j.pneurobio.2012.01.006 (2013). [DOI] [PMC free article] [PubMed] [Google Scholar]
- 20.Afraz S-R, Kiani R & Esteky H Microstimulation of inferotemporal cortex influences face categorization. Nature 442, 692–695, doi: 10.1038/nature04982 (2006). [DOI] [PubMed] [Google Scholar]
- 21.Penfield W & Perot P The Brain’s Record of Auditory and Visual Experience. A Final Summary and Discussion. Brain 86, 595–696 (1963). [DOI] [PubMed] [Google Scholar]
- 22.Allison T et al. Face recognition in human extrastriate cortex. J Neurophysiol 71, 821–825 (1994). [DOI] [PubMed] [Google Scholar]
- 23.Puce A, Allison T & McCarthy G Electrophysiological studies of human face perception. III: Effects of top-down processing on face-specific potentials. Cereb Cortex 9, 445–458 (1999). [DOI] [PubMed] [Google Scholar]
- 24.Parvizi J et al. Electrical stimulation of human fusiform face-selective regions distorts face perception. J Neurosci 32, 14915–14920, doi: 10.1523/JNEUROSCI.2609-12.2012 (2012). [DOI] [PMC free article] [PubMed] [Google Scholar]
- 25.Afraz A, Boyden ES & DiCarlo JJ Optogenetic and pharmacological suppression of spatial clusters of face neurons reveal their causal role in face gender discrimination. Proc. Natl. Acad. Sci. U.S.A, doi: 10.1073/pnas.1423328112 (2015). [DOI] [PMC free article] [PubMed] [Google Scholar]
- 26.Fisher RA On the Interpretation of χ2 from Contingency Tables, and the Calculation of P. Journal of the Royal Statistical Society 85, 87–94, doi: 10.2307/2340521 (1922). [DOI] [Google Scholar]
- 27.Freiwald WA, Tsao DY & Livingstone MS A Face Feature Space in the Macaque Temporal Lobe. Nature Neurosci. 12, 1187–1196 (2009). [DOI] [PMC free article] [PubMed] [Google Scholar]
- 28.Meyers EM, Borzello M, Freiwald WA & Tsao D Intelligent information loss: the coding of facial identity, head pose, and non-face information in the macaque face patch system. J Neurosci 35, 7069–7081, doi: 10.1523/JNEUROSCI.3086-14.2015 (2015). [DOI] [PMC free article] [PubMed] [Google Scholar]
- 29.Mooney CM Age in the development of closure ability in children. Canadian Journal of Psychology 11, 219–226 (1957). [DOI] [PubMed] [Google Scholar]
- 30.Taubert J, Van Belle G, Vanduffel W, Rossion B & Vogels R Neural Correlate of the Thatcher Face Illusion in a Monkey Face-Selective Patch. The Journal of neuroscience : the official journal of the Society for Neuroscience 35, 9872–9878, doi: 10.1523/JNEUROSCI.0446-15.2015 (2015). [DOI] [PMC free article] [PubMed] [Google Scholar]
- 31.Hung CP, Kreiman G, Poggio T & DiCarlo JJ Fast readout of object identity from macaque inferior temporal cortex. Science 310, 863–866, doi: 10.1126/science.1117593 (2005). [DOI] [PubMed] [Google Scholar]
- 32.Jonas J et al. Focal electrical intracerebral stimulation of a face-sensitive area causes transient prosopagnosia. Neuroscience 222, 281–288, doi: 10.1016/j.neuroscience.2012.07.021 (2012). [DOI] [PubMed] [Google Scholar]
- 33.Knoll M & Kugler J Subjective Light Pattern Spectroscopy in the Encephalographic Frequency Range. Nature 184, 1823–1824, doi: 10.1038/1841823a0 (1959). [DOI] [PubMed] [Google Scholar]
- 34.Brindley GS & Lewin WS The sensations produced by electrical stimulation of the visual cortex. The Journal of Physiology 196, 479–493, doi: 10.1113/jphysiol.1968.sp008519 (1968). [DOI] [PMC free article] [PubMed] [Google Scholar]
- 35.Vignal JP, Chauvel P & Halgren E Localised Face Processing by the Human Prefrontal Cortex: Stimulation-Evoked Hallucinations of Faces. Cognitive Neuropsychology 17, 281–291, doi: 10.1080/026432900380616 (2000). [DOI] [PubMed] [Google Scholar]
- 36.Ohayon S & Tsao DY MR-guided stereotactic navigation. J Neurosci Methods 204, 389–397, doi: 10.1016/j.jneumeth.2011.11.031 (2012). [DOI] [PMC free article] [PubMed] [Google Scholar]
- 37.Stanislaw H & Todorov N Calculation of signal detection theory measures. Behavior Research Methods, Instruments, & Computers 31, 137–149, doi: 10.3758/BF03207704 (1999). [DOI] [PubMed] [Google Scholar]
Associated Data
This section collects any data citations, data availability statements, or supplementary materials included in this article.
Supplementary Materials
Supplementary Figure 3. The dependence of effect magnitude on proximity of the stimulation site to the center of the face patch for the five different object categories from Experiment 3. Same conventions as in Figure 3a. Pooled data for 14 sessions (M1: 9, M2: 5) showing how the magnitude of electrical microstimulation effect on same (left column) and different identity trials (right column) correlates with the face selectivity of the target location as measured by fMRI. Out of the five object categories (faces (a), apples (b), citrus fruit (c), pots (d) and clocks (e)), only for faces was there a significant correlation (same identity trials: p: 0.044706, correlation coefficient r = −0.54319, r2 = 0.2951; different identity trials: p: 0.0053008, correlation coefficient r = 0.70014, r2 = 0.4902).
Supplementary Figure 2. The dependence of effect magnitude for round objects on stimulation current strength and electrode position for subject M1 for three different sessions. (a) Low stimulation current (50 μA) inside face patch AM. (b) Intermediate stimulation current (100 μA) inside face patch AM. (c) Large stimulation current (200 μA) outside the face patches. Top row: Behavioral performance on same and different trials, with and without microstimulation, for stimulation in face patch AM of monkey M1, for faces, apples, citrus fruits, teapots, and clocks. 2nd row: Size of stimulation effect in percentage points for the same five categories. 3rd row: Behavioral performance on same and different identity trials of the face identification task of the same session. 4th row: Size of stimulation effect for the face identification task. Conventions as in Suppl. Fig. 1.
Supplementary Figure 1. The dependence of effect magnitude for faces on stimulation current strength. (a, b) Behavioral performance on same- and different-identity trials, with and without microstimulation, for stimulation strength magnitude of 100 μA (a) and 300 μA (b), with stimulation performed in the same session (AM, M1). (c, d) Another session, comparing effect on behavior of face patch stimulation at 100 μA and 300 μA (AM, M1). (e, f) Effect of face patch stimulation at 100 μA and 200 μA during the same session (AM, M2). (g, h) Effect of face patch stimulation at 100 μA and 200 μA during the same session (AM, M2). (i, j, k) Effect of face patch stimulation at 100 μA, 200 μA, and 300 μA during the same session (ML, M2). Gray bars denote trials without, red bars trials with electrical micro-stimulation; Darker bars show the performance for same identity trials, lighter bars for different identity trials. *: P < 0.05; **: P < 0.01; ***: P < 0.005; Fisher’s exact test. The lower plot in each panel shows the change in percentage points caused by electrical stimulation for same identity trials in dark gray and for the different identity trials in light gray.
Supplementary Figure 4. Experiment 2: Effect of stimulation inside face patch AM on the perception of non-round objects.; conventions as in Fig. 2. (a) Effect of AM stimulation on non-round object perception in monkey M1. Performance was significantly worse on microstimulation “same” trials (reduction by 7.77 percentage points). (c) Performance change in percentage points caused by electrical microstimulation for same- (dark gray bar) and different-identity trials (light gray bar) (b) Same as (a) and (d) same as (c), for stimulation in monkey M2. Stimulation current was 300 μA.
Supplementary Figure 5. Experiment 4b: Effect of stimulation inside face patch AM on perception of non-face objects II in M2. (a) Effect of face patch stimulation on perception of house line drawings, house cartoons, house silhouettes, Mooney faces, and upside down Mooney faces. (b) Effect obtained in same experimental session, for face stimuli of Experiment 1. (c) Performance change in percentage points caused by electrical microstimulation for same- (dark gray bar) and different-identity trials (light gray bar) for each of the five categories of non-face objects II, and (d) for the faces of Experiment 1. Stimulation current was 200 μA. Conventions as in Fig. 4.
Supplementary Figure 6. Electrode position for M1 showing that for the data presented in Fig. 6 the electrode tip was located inside face patch AM. Scale bar (top left) = 1 cm.
Supplementary Figure 8. Experiment 5: The dependence of effect magnitude on stimulation timing. Behavioral performance for same- and different-identity trials, across four different stimulation conditions: no stimulation (gray bars), stimulation during cue 1 and cue 2 (yellow bars), stimulation during cue 1 (green bars), stimulation during cue 2 (red bars). Plots on the right show the change in percentage points caused by electrical stimulation (electrical stimulation during cue1: green; during cue2: red; during both cues: yellow). Darker bars denote same-identity trials, lighter bars different-identity trials. *: P < 0.05; **: P < 0.01; ***: P < 0.005; Fisher’s exact test. (a): ML, M1, (b): AM M1, (c): AM M2. (d): AM M1: Stimulation experiment in M1, with stimulation trains of 50 ms duration (images were presented for 200 ms each), instead of 200 ms (b). All trains were delayed by 75 ms relative to visual stimulation to account for the typical response latency of anterior temporal cortex.
Supplementary Figure 9. Experiment 6: The effect of simultaneous dual hemispheric AM stimulation on face identification behavior. In these two sessions one stimulation electrode was placed into the left and one into the right face patch AM; stimulation was applied during both the first and the second cue image. (a) Top: Composite MR image showing the electrodes in the left and the right hemisphere with face patch positions shown as yellow overlays (overlay threshold p = 10−10, saturation value p = 10−20). The red line in the middle shows where the two halves were merged (since both electrodes were on skew lines each half of the brain was rotated slightly differently to show both electrode trajectories in full). The white scale bar at the top left measured 1cm. Middle: the effect of dual AM microstimulation on the identification of faces (M1 121008, current used 100 μA, cue presentation duration and microstimulation duration 500 ms). Bottom: Difference in percentage points between performance caused by electrical microstimulation for same- (dark gray bar) and different-identity trials (light gray bar). (b) Middle: the effect of dual AM stimulation on the identification of faces, using shorter cue presentation duration (200 ms) and a stronger current (300 μA). Bottom: Performance change in percentage points caused by electrical microstimulation for same- (dark gray bar) and different-identity trials (light gray bar). Gray bars denote trials without, red bar trials with microstimulation, darker bars show same identity trials, lighter bars different identity trials. P-levels as in Fig. 2; P < 0.05; **: P < 0.01; ***: P < 0.005; Fisher’s exact test. Note that in (a) we used a stimulus set that used 3 different view angles per identity to make the task more challenging, explaining the relative low performance compared to the experiments that used facial expression to vary the face images.
Supplementary Figure 10. Behavioral performance from training sessions and from experimental sessions from non-microstimulated trials. This figure shows the task performance over the course of multiple sessions, always starting with the first session a stimulus set was introduced. Performance was averaged over same and different identity trials. (a) M1: The red line shows the initial task that consisted of performing same/different discrimination between five images of grape clusters and five images of single tomatoes; for the same condition we always presented the exact same image, for different we always selected one image from the 5 exemplars of the other category. The green line shows the initial performance on the initial face identity discrimination task. In this task we presented color photographs of 5 persons at 5 different views each, for the same condition we only selected the 2nd cue image from the 4 images of each identity not used as 1st cue, for the different condition we randomly selected one of the 20 images belonging to the remaining identities. Note how the performance for grapes and tomatoes ramps up over 4 sessions and how well the animal transferred to the face identification task (the animal had discriminated different face stimuli in past experiments). (b) Example stimuli. Left: all grape and tomato images used in initial training. Right: three exemplary identities at five views. (c) M1 and (d) M2 performance in >40 sessions with the 32 identities at 6 different facial expressions task (see Experiment 1). Note with M2 there was an initial ramping up from near chance performance, but both animals generalized quickly from the initially trained face set to the new set. (e & f) Performance in the different versions of the object identification task (as described in Experiment 2); both M1 and M2 immediately generalized to the different object sets. Note that we only added more stimuli, so the 16 objects set was a subset of both the 19 and 28 objects sets. (g & h) Performance for Experiment 3: both animals immediately generalized to the five new categories. Note that on the 8th session, M1 changed his strategy to guessing only to return to “normal” performance on the next session. (i & j) Performance on the abstract face and house stimuli from Experiment 4b; M1 immediately generalized to the new stimuli, while M2’s performance improved over the first few sessions before stabilizing.
Supplementary Figure 11. Neuronal response selectivity at the different stimulation sites and subjects. The upper part of each panel shows the normalized mean response for each unit to each of the 96 consensus images, while the lower panel shows the population mean response. Note that most units were recorded for the minimal time to see whether there was difference between face and non-face categories, so often images were not repeated often enough to allow the normalization to work, such occurrences are colored black in the upper panels and ignored for the averaging shown in the middle panels. The lower panels show the distribution of the face selectivity indices for all units per patch and animal, distance from the midpoint at zero correlates with face selectivity. The scale bar at the bottom right of the figure shows the mapping between color and normalized response. The category of each image is color-coded by the rainbow bar between the two panels. The order of the presented population data mainly follows Fig. 2 to facilitate direct comparison: (a) AM of monkey M1 (b) AM of M2, (c) ML of M1, (d) ML of M2, (e) AL of M1, (f) MF of M2, (g) AF of M1 (h) control site outside of the face patches in M1.
Supplementary Figure 7. Activation to faces, cartoon houses, real houses, and real objects. (a) Coronal slices showing fMRI activation to the contrast faces > objects. Face patches are indicated by arrows. (b, c) Slices from the same animal as (a), showing activation to the contrast cartoon houses > objects (b), and real houses > objects (c). (d) Flat maps of the left and right hemisphere visual cortex, showing the same data as (a-c). Face patches are indicated by green outlines. Notice overlap between face patches ML and PL and cartoon house activation (middle two panels), which is absent for real house activation (right two panels). Face patches indicated by green outlines in middle and right panels. (e) Beta values for faces, cartoon houses, real houses, and real objects, from PL/ML, showing strong activation to faces and to cartoon houses.