Abstract
Human Immunodeficiency Virus type-1 (HIV-1)-infected individuals show metabolic alterations of CD4 T cells through unclear mechanisms with undefined consequences. We analyzed the transcriptome of CD4 T cells from HIV-1 patients and revealed that elevated oxidative phosphorylation (OXPHOS) pathway is associated with poor outcomes. Inhibition of OXPHOS by the FDA-approved drug metformin, which targets mitochondrial respiratory chain complex I, suppresses HIV-1 replication in human CD4 T cells and humanized mice. In patients, HIV-1 peak viremia positively correlates with the expression of NLRX1, a mitochondrial innate immune receptor. Quantitative proteomics and metabolic analyses reveal that NLRX1 enhances OXPHOS and glycolysis during HIV-1-infection of CD4 T cells to promote viral replication. At the mechanistic level, HIV infection induces the association of NLRX1 with the mitochondrial protein, FASTKD5, to promote the expression of mitochondrial respiratory complex components. This study uncovers the OXPHOS pathway in CD4 T cells as a target for HIV-1 therapy.
INTRODUCTION
Although the combination antiretroviral therapy (cART) effectively suppresses HIV-1 viremia, approximately 20% of patients fail to achieve CD4 T cell recovery and exhibit abnormality of immune functions, which are likely caused by residue HIV-1 replication in certain tissue compartments in part due to virus mutations that support escape from the antiviral therapeutics1, 2. A complementary approach to cART is to target host factors to restrict virus replication and thus reduce virus mutation escape. Immune cell metabolism (immunometabolism) correlates with HIV-1 restriction in elite controllers and is an emerging field for developing novel HIV-1 therapies3.
HIV-1 infection causes up-regulated metabolism of glucose, lipid, and tryptophan and elevated oxidative stress in immune cells4. Among these, the glucose metabolism is the most critical to meet the energy and biosynthesis needs for both HIV-1 replication and the responses of immune cells5, 6, as evident by up-regulated expression of glucose transporter 1 (GLUT1) which resulted in increased uptake of glucose in inflammatory monocytes and CD4 T cells from HIV-1 patients2, 7. The reprogramming of glucose breakdown, glycolysis and oxidative phosphorylation in HIV-1 patients has been documented2, 4, 8, however the mechanisms are unknown. Although the metabolic alteration has been associated with HIV-1 replication, immune abnormalities, and disease complications, how HIV-1 infection reprograms immunometabolism is unknown. This hinders the development of novel HIV-1 disease therapy by targeting metabolism3.
The nucleotide-binding domain and leucine-rich repeat-containing receptor X1 (NLRX1), a multifunctional innate immune regulator9–12, contributes to CD4 T cell polarization and proliferation. NLRX1 also regulates mitochondrial reactive oxygen species production, suggesting a potential role in metabolism13. Intriguingly, the role of NLRX1 in facilitating HIV-1 replication has been demonstrated in myeloid cells14; furthermore, NLRX1 expression in nonhuman primates is positively correlated with simian immunodeficiency virus viremia15. However, whether and how NLRX1 plays a role in HIV-1 replication in CD4 T cells, the major cell type that produces HIV-1 in vivo, remains unstudied and unknown.
This report used transcriptomic and proteomic analyses to reveal that an enhancement of OXPHOS is associated with HIV-1 infection and disease progression. Repurposing the FDA-approved agent metformin, which targets mitochondrial complex-I and therefore OXPHOS, suppresses HIV-1 replication in both primary CD4 T cell cultures and humanized mice. Mechanistically, NLRX1 interacts with another mitochondrial protein, FAST kinase domain-containing protein 5 (FASTDK5), and cooperatively promotes both OXPHOS and HIV-1 replication in CD4 T cells. These results raise the promise of controlling HIV-1 replication by targeting the NLRX1-OXPHOS axis.
RESULTS
HIV-1 viral load set-point in patients positively correlates with oxidative phosphorylation
Immunometabolism is dysregulated in HIV-1 patients and is associated with HIV-1 cellular susceptibility and reactivation in in vitro assays16–19. To address how immunometabolic changes contribute to HIV-1 replication, we first analyzed gene expression data from the RV217 transcriptomic study of human subjects acutely infected with HIV-1 in Asia and Africa20. Transcriptomes of CD4 T cells from the Asian (all males, n = 23) and African (all females, n = 18) cohort were clustered together regardless of geography (Fig. 1a), and the key prognosis parameter of HIV-1 disease progression, set-point viral load21, was not significantly different between these two cohorts (Fig. 1b). Linear regression analysis between gene expression and set-point viral load is used to assess how major metabolic pathways of interest are correlated with the magnitude of set-point viral load in sorted CD4 T cells from HIV-1-infected subjects in both Asian and African cohorts. We found that the OXPHOS pathway from the KEGG database (C2, Molecular Signatures Database) was the most positively correlated pathway with poor outcome (higher set-point viral load). This observation was consistent in the Asian cohort (P = 0.0057) and the African cohort (P = 0.0063). Importantly, only the OXPHOS pathway was significantly correlated to a poor outcome when pooling both geographical sites (P = 0.0191) (Fig. 1c and Supplementary Table 1), suggesting that OXPHOS could serve as a prognosis biomarker for acquired immunodeficiency syndrome (AIDS) progression regardless the geographic variation. Furthermore, this observation was validated using the OXPHOS pathway from the Hallmark database (P < 0.001) (Supplementary Table 2). Leading Edge analysis was performed to examine the particular genes of a gene-set contributing the most to the enrichment (Asian + African cohort, Supplementary Table 1). The co-expression and interaction network of the leading edge genes of the OXPHOS pathway was established to highlight the top genes contributing to enrichment (Fig. 1d and Extended Data Fig. 1). The peak viremia of HIV-1 in acute infection usually predicts the viral load at the set-point22. It is highly likely that the OXPHOS-associated higher set-point viral load is attributed to a higher HIV-1 replication in the acute infection phase. Therefore, it is of interest to assess if altering the metabolic pathways, particularly OXPHOS, can affect HIV replication and hence pathogenesis.
Fig. 1. Transcriptome analysis of CD4 T cells from HIV-1 patients.
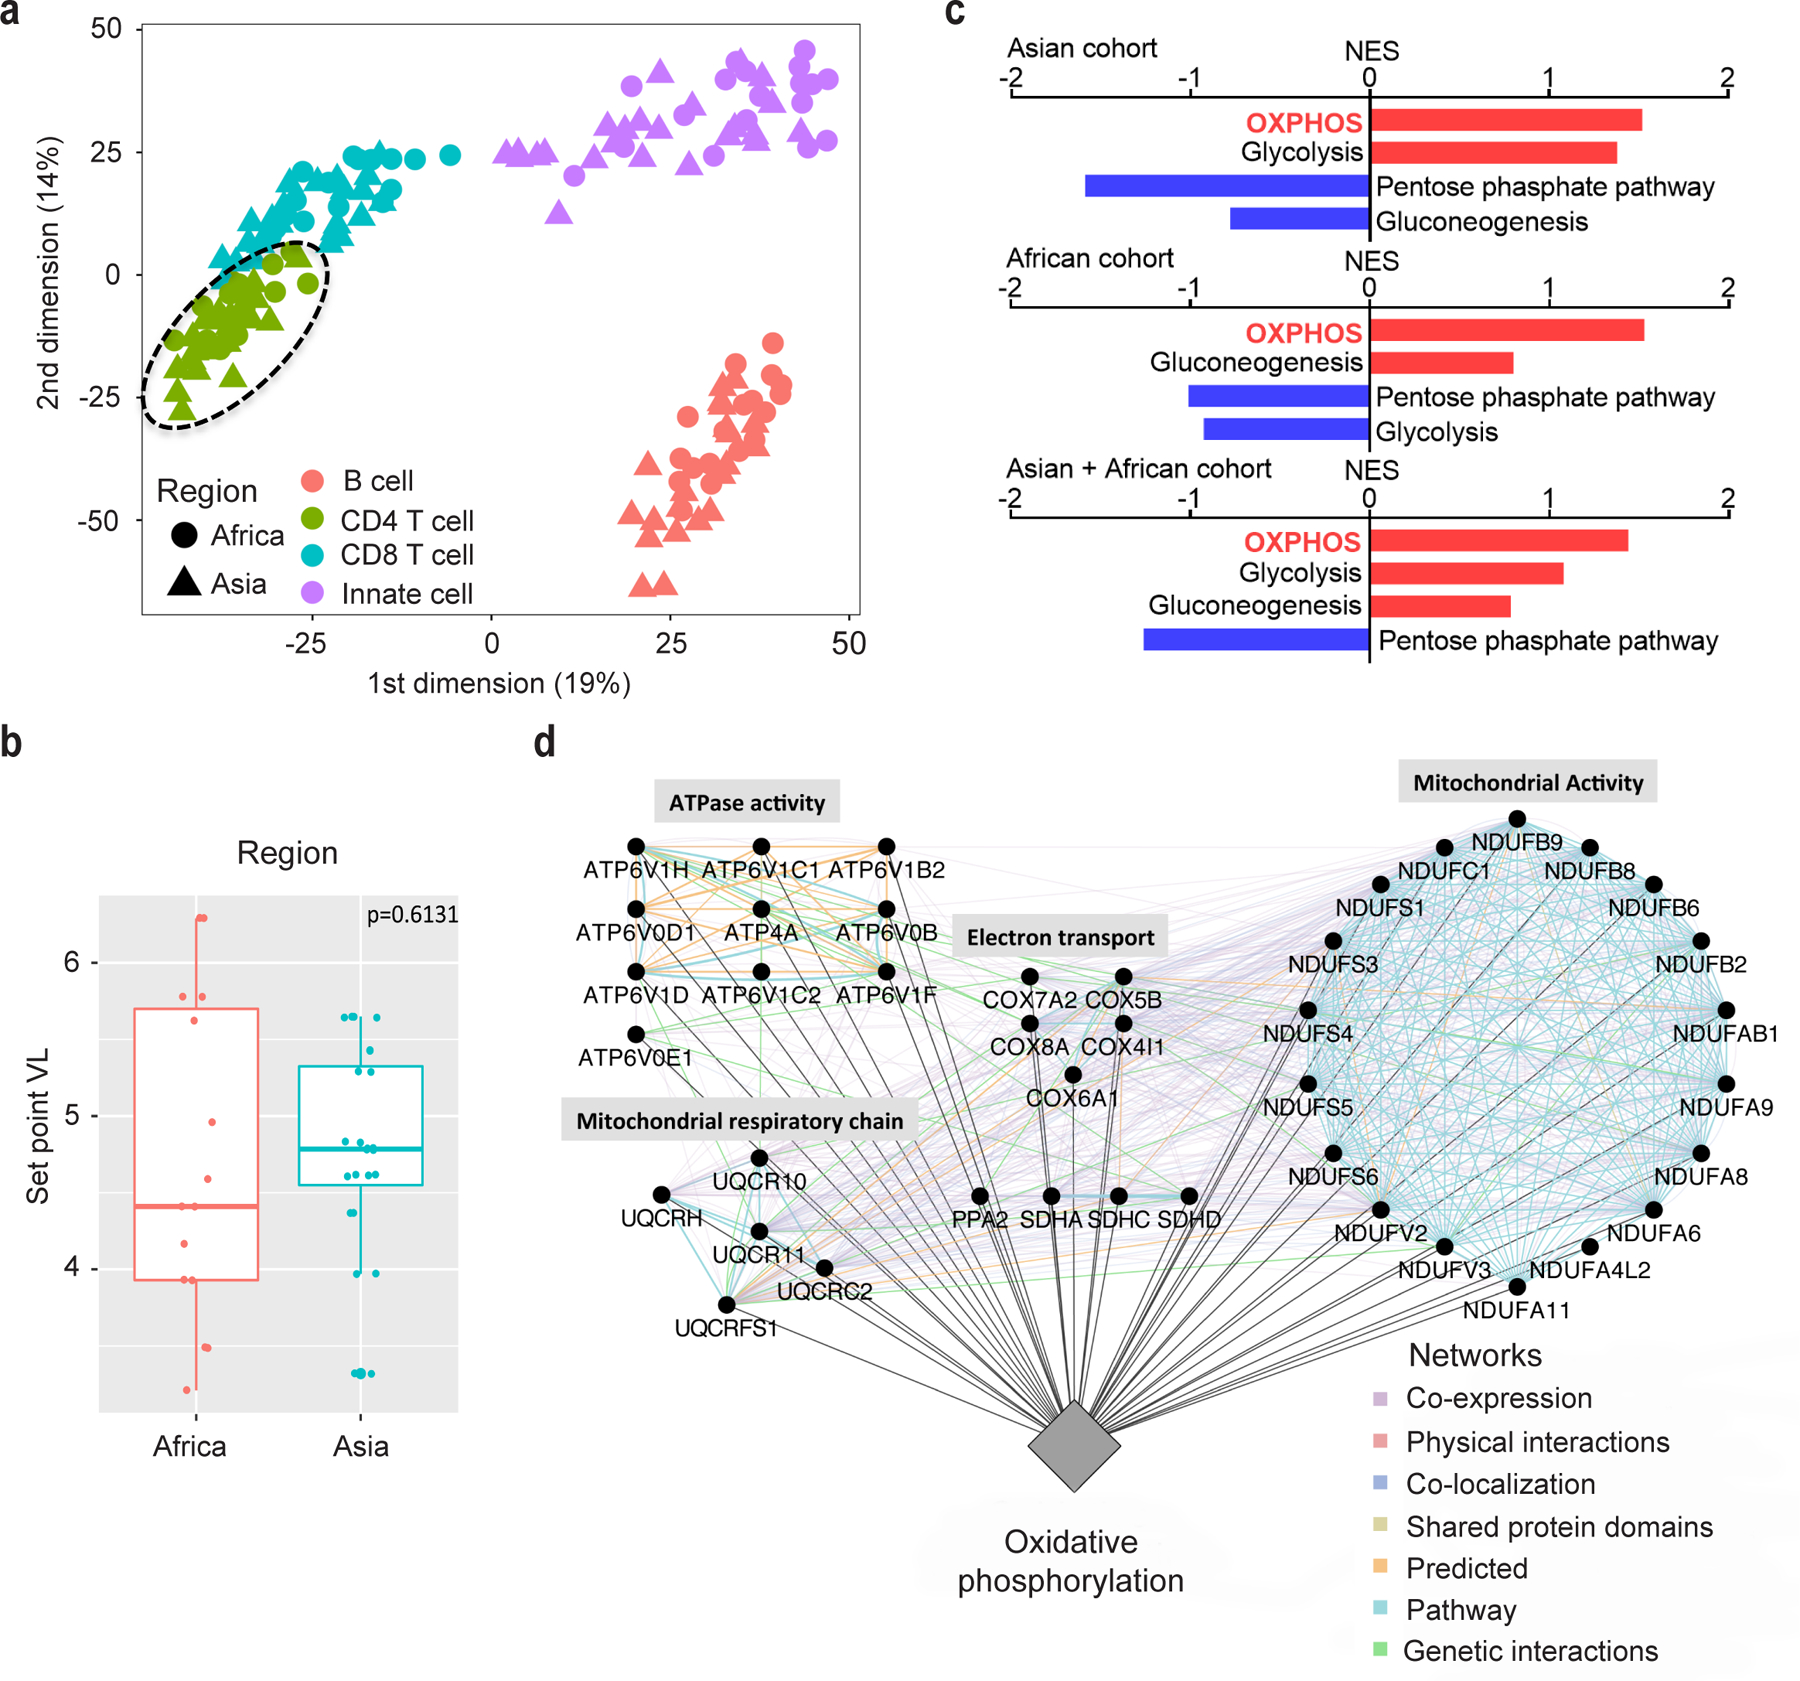
a, Multi-dimensional Scaling highlighting the transcriptomic variance of the full cell-sorted RV217 dataset. Euclidean distance was used. Circle = African cohort, triangle = Asian cohort, Red = B cells, Green = CD4 T cells, Blue = CD8 T cells, Purple = Innate cells.
b, Set-point viral load (VL) is not significantly different between Asian and African RV217 cohorts. Africa, n = 18, minima = 3.21, maxima = 6.29; Asia, n = 22, minima = 4.61, maxima = 5.65. Jitter plot displays the first (bottom of the box) and third quartiles (top of the box), the median (the line inside the box), and 1.5 interquartile range of the upper or lower quartile (whiskers). Significance was assessed by Wilcoxon rank-sum test (one-tailed).
c, Linear regression analysis between gene expression and set-point VL. Normalized enrichment score (NES) reflects the degree to which a set of genes is overrepresented among genes that are differentially expressed. Bar-plot represents positively (red) and negatively (blue) correlated pathways. Supplementary Table 1 provides statistical results for the enrichment of these pathways.
d, The highlight of the leading edge genes of the OXPHOS pathway, which are associated with set-point VL. Circular nodes represent genes, and edges reflect the association between these features. Color of the edge highlights the association between nodes. Biological annotation (diamond nodes) reflecting the function of sets of genes is represented; sub-functions within the network are labeled above groups of genes.
HIV-1 replication is suppressed by targeting metabolic pathways
To assess the importance of OXPHOS in HIV-1 infection, pharmacological inhibitors for OXPHOS including rotenone and antimycin A, which target mitochondrial complex I and mitochondrial complex III respectively, significantly suppressed HIV-1 pseudovirus (the vesicular stomatitis virus envelope glycoprotein [VSV-G]-pseudotyped HIV-1 NL4–3-Luc) replication in the human Jurkat T cell line (Extended Data Fig. 2a). Furthermore, the FDA-approved antidiabetic agent metformin, which has been shown to target mitochondrial complex I23, suppressed OXPHOS in HIV-1 pseudovirus-infected Jurkat cells (Extended Data Fig. 2b, c) and had a similar suppressive effect on HIV-1 replication compared to rotenone (Extended Data Fig. 2a). These data suggest a critical role of OXPHOS in HIV-1 replication in CD4 T cells. Combined data from the Asian and African cohort of HIV-1 patients demonstrate that glycolysis also positively correlates with HIV-1 set-point viremia, although with less significance than OXPHOS (Fig. 1c). Blocking glycolysis with 2-deoxyglucose (2-DG) also significantly suppressed VSV-G-NL4–3-Luc replication in Jurkat cells (Extended Data Fig. 2d), congruent with the previous work19.
Metformin inhibits HIV-1 replication in both primary CD4 T cells and humanized mice reconstituted with human CD4 T cells
We next explored the therapeutic value that HIV-1 replication requires OXPHOS in more physiologically relevant systems by testing human primary CD4 T cells in culture and in humanized mice. Human primary CD4 T cells were infected with HIV-1 clinical isolates #409, #413, and #414. Metformin suppressed the replication of all three clinical isolates to a similar extent as rotenone and antimycin A, as measured by intracellular HIV-1 RNA and virion production (Fig. 2a, b). 2-DG offered the best effectiveness in inhibiting HIV-1 replication, likely due to its suppression of both glycolysis and OXPHOS (Fig. 2a, b).
Fig. 2. Inhibition of OXPHOS reduces HIV-1 replication in human primary CD4 T cells and NRG-hu CD4 mice.
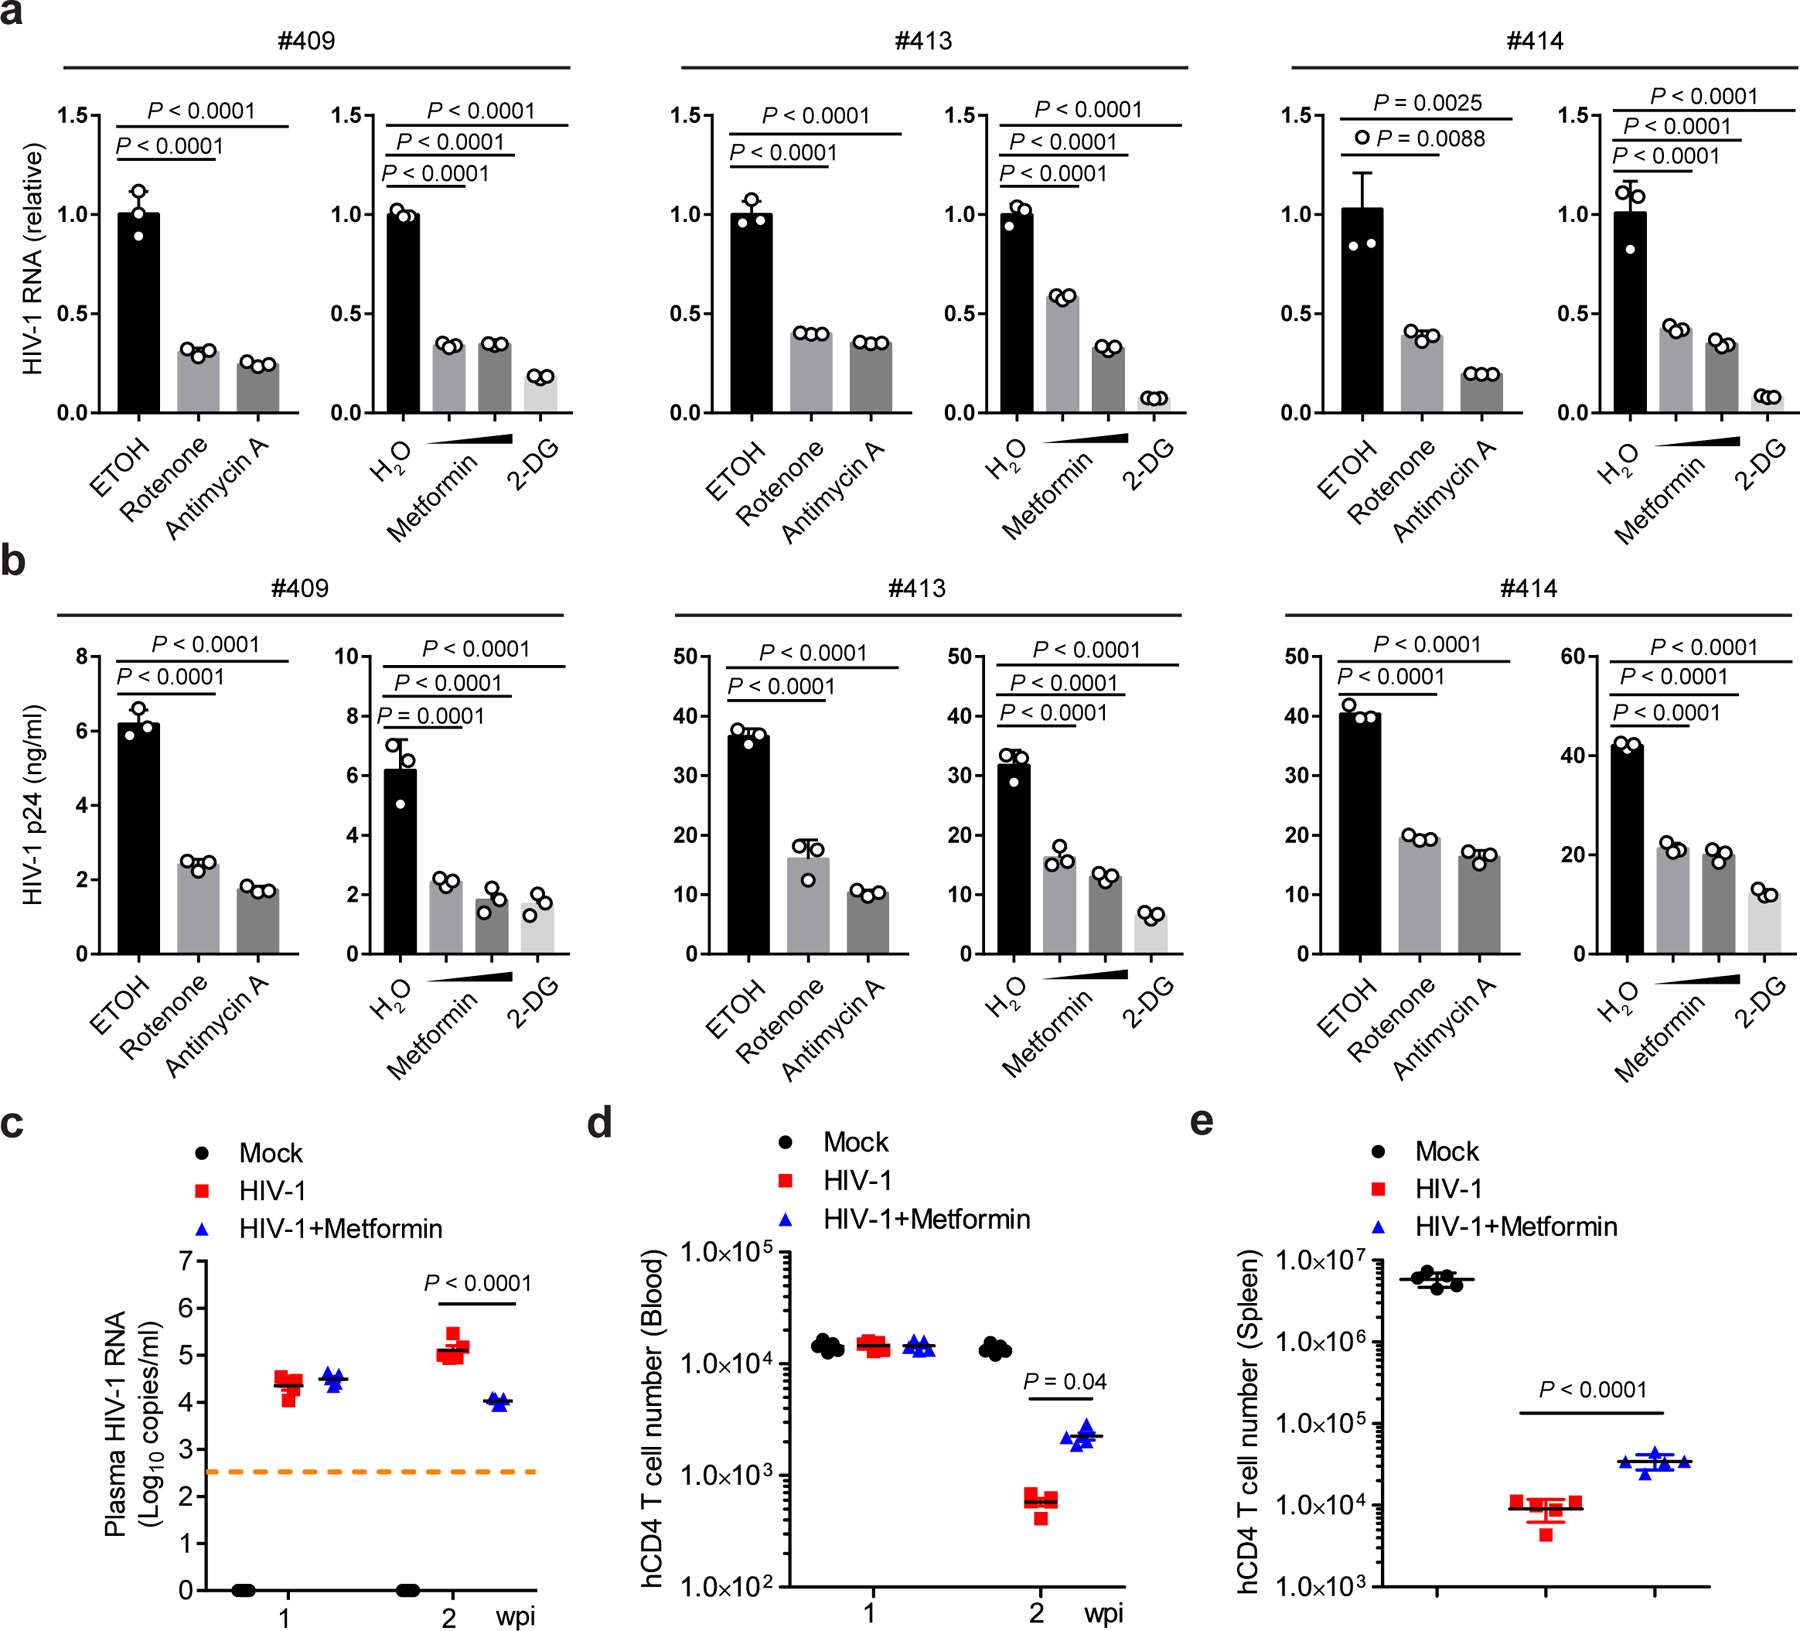
a, b, Human primary CD4 T cells were infected with 3 different HIV-1 clinical strains (#409, #413, and #414, 10 ng p24) in the presence of rotenone (1 µM), antimycin A (1 µM), metformin (1 mM and 5 mM), or 2-DG (10 mM). Cell-associated HIV-1 RNA (a) and cell-released virions (b) were assessed by qPCR and p24 ELISA, respectively. Ethanol (ETOH) or sterile water (H2O) was used as vehicle control. n = 3 cell cultures per experiment.
c, HIV-1 viremia in HIV-1 R3A-infected NRG-hu CD4 mice at 1 and 2 weeks post-infection (wpi). n = 5 mice per group.
d, Human CD4 T cell counts in peripheral blood of NRG-hu CD4 mice as determined by flow cytometry at 1 and 2 wpi. n = 5 mice per group.
e, Human CD4 T cells in the spleen of NRG-hu CD4 mice as quantified by flow cytometry at 17 days post-infection (dpi). n = 5 mice per group.
Representative data of three independent experiments with similar results are presented as mean ± standard error of the mean (s.e.m). Statistical significance was tested by one-way ANOVA with Dunnett’s multiple comparisons test (a, b) or two-way ANOVA with Tukey’s (c) or Sidak’s (d) multiple comparisons test or unpaired two-tailed Student’s t-test (e).
To test the impact of these treatments in vivo in human cells, we used a human CD4 T cell-reconstituted NOD-Rag1null IL2rgnull (NRG) mouse model (hereafter referred to as NRG-hu CD4 mice), which supports HIV-1 replication and pathogenesis in vivo24. NRG-hu CD4 mice were infected with the CCR5/CXCR4 dual-tropic HIV-1 strain R3A. One day before infection, half of the NRG-hu CD4 mice were given metformin in drinking water, while the other half were left untreated. The dose of metformin delivered in vivo was based on the literature to assure minimal toxicity23, 25. At 2 weeks post-infection (wpi), HIV-1 titer in the metformin-treated group was approximately one order of magnitude lower than that of the untreated control group (Fig. 2c). The depletion of CD4 T cells is the hallmark of HIV-1 pathogenesis and HIV-1-induced immunodeficiency in patients26. Metformin did not alter human CD4 T cell numbers in peripheral blood at 1 wpi when HIV-1-induced CD4 T cell depletion had not begun. The drug partially protected human CD4 T cells from depletion at 2 wpi compared to untreated but HIV-1-infected mice as we observed more 7AAD negative CD4 T cells in metformin-treated mice (Fig. 2d and Extended Data Fig. 2e). In addition, human CD4 T cell depletion by HIV in the spleen of NRG-hu CD4 mice treated with metformin was partially protected (Fig. 2e). Since metformin is routinely and safely used for treating diabetes27, these results suggest that repurposing this drug has the potential to supplement cART for better containment of HIV-1.
NLRX1 positively correlates with both HIV-1 viremia and OXPHOS of CD4 T cells in patients
We next explored the molecular pathway by which HIV-1 can dynamically regulate OXPHOS to favor its own replication in CD4 T cells. When we screened the individual gene product correlated with HIV-1 viremia in the RV217 cohort, the mitochondrial protein NLRX1 drew our attention. NLRX1 transcript levels in CD4 T cells positively correlated with peak HIV-1 viremia in the RV217 cohort (all males, n = 22) (Fig. 3a). To confirm this observation, we examined the expression level of NLRX1 in HIV-1 infected CD4 T cells in vitro. Staining of endogenous NLRX1 followed by imaging flow cytometry (Extended Data Fig. 3a) showed that NLRX1 protein level was enhanced in Jurkat cells infected with an HIV-1 pseudovirus that expressed GFP (VSV-G-NL4–3-EGFP) compared to uninfected cells in the same culture (Extended Data Fig. 3b). The expression level of NLRX1 was positively correlated with HIV-1 replication represented by GFP expression (Extended Data Fig. 3c), which is congruent with the analysis of the RV217 cohort. NLRX1 messenger RNA (mRNA) was also significantly up-regulated in Jurkat cells infected with VSV-G-NL4–3-EGFP (Extended Data Fig. 3d). To provide a more physiologic context, we found that NLRX1 mRNA was increased in human primary CD4 T cells infected with any one of three different HIV-1 clinical isolates (Extended Data Fig. 3e). NLRX1 is located in the mitochondria, which leads us to hypothesize that NLRX1 may regulate OXPHOS during HIV-1 infection of CD4 T cells and thus influence viral replication. In fact, we found that in CD4 T cells sorted from the RV217 cohort, genes whose expression positively correlate with NLRX1 expression level were significantly enriched in the OXPHOS pathway regardless of the geographic differences (Fig. 3b and Supplementary Table 3). The expression of leading edge genes in HIV-1 infected individuals contributing to this enrichment was represented in a heatmap along with NLRX1 expression (Fig. 3c and Supplementary Table 3). These data led us to investigate if NLRX1 regulates HIV-1-induced oxidative phosphorylation to alter viral replication.
Fig. 3. NLRX1 expression positively correlates with HIV-1 viremia and the OXPHOS pathway.
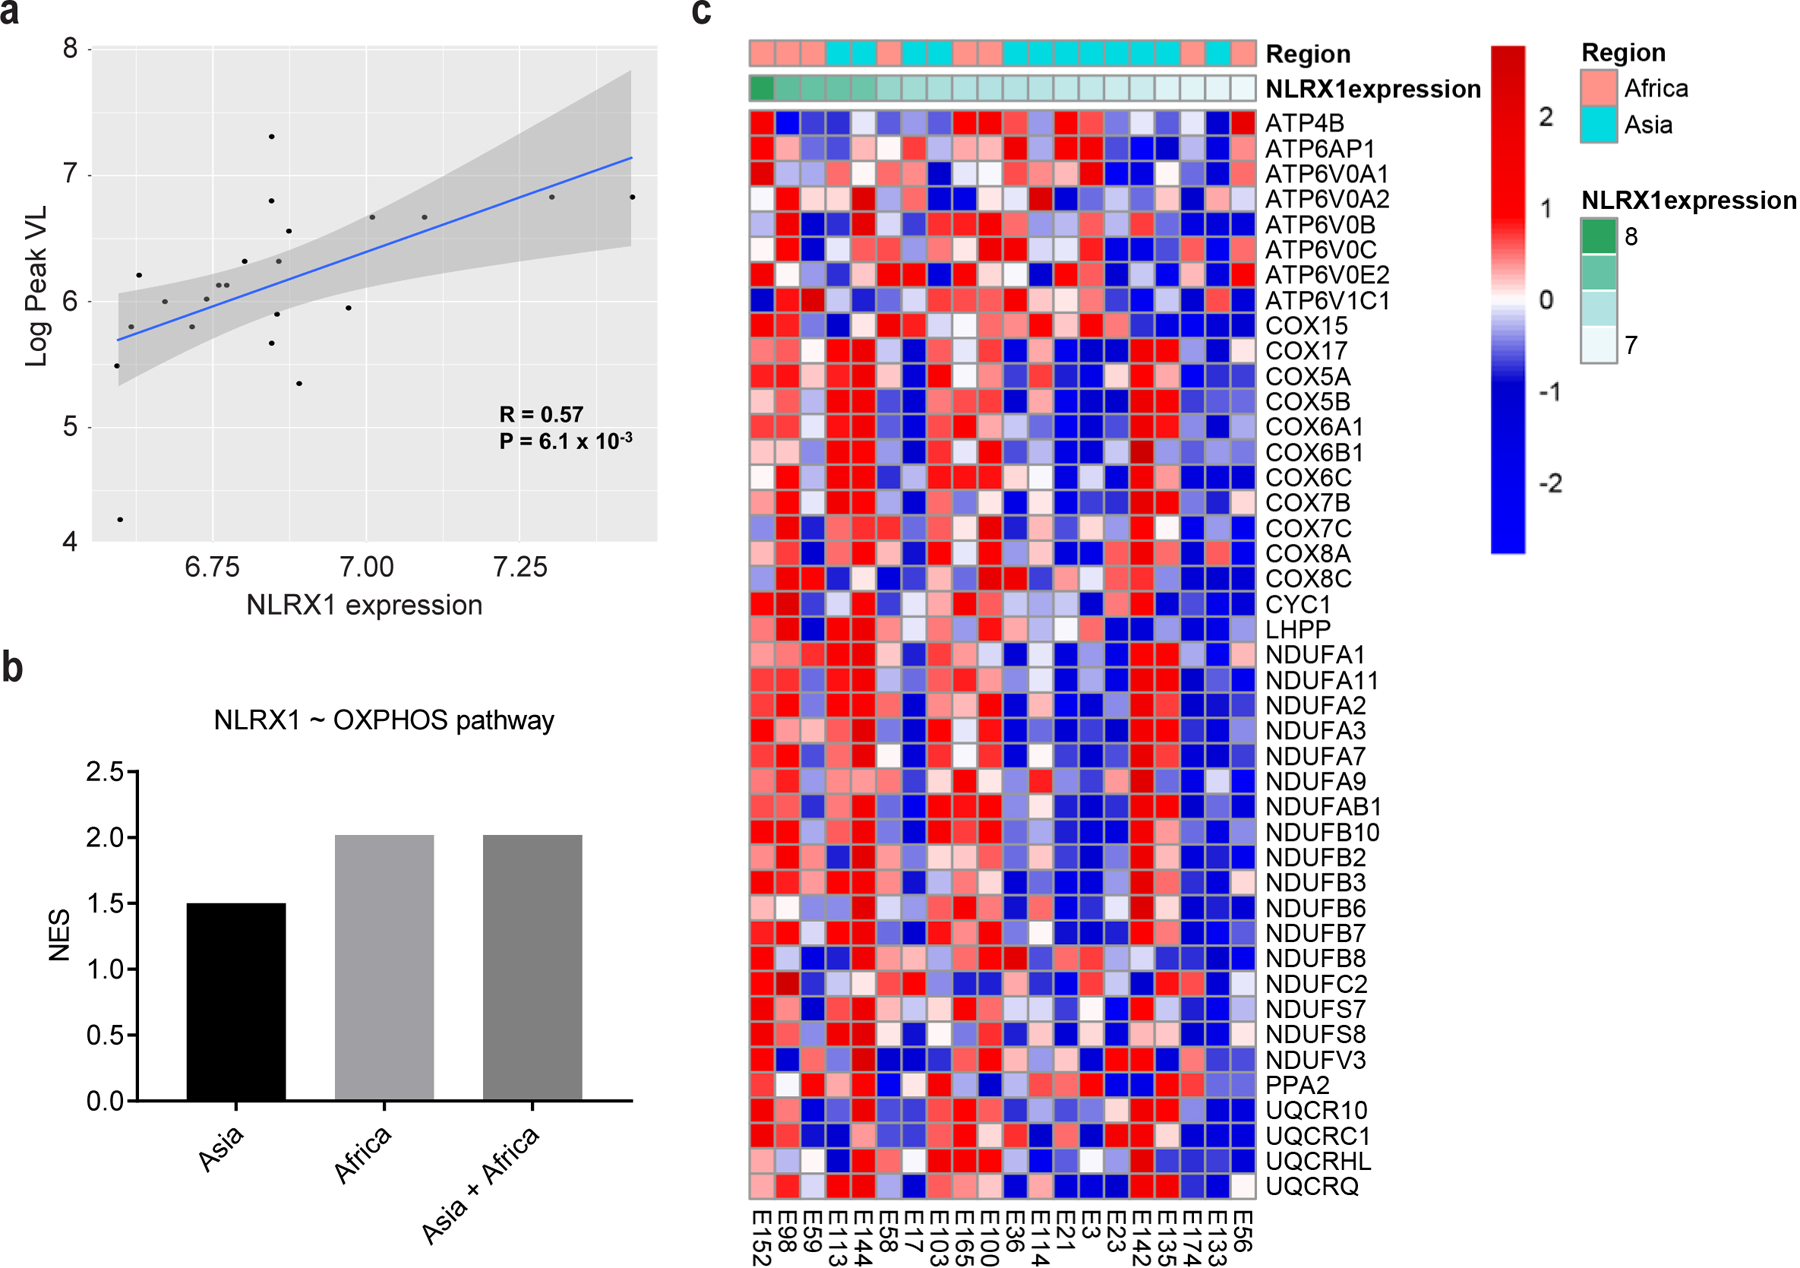
a, Scatter plot highlighting the significant positive correlation between NLRX1 expression levels (PBMC) and Log10 Peak VL in the RV217 dataset. A Pearson correlation was used to assess significance. P value was not adjusted and calculated by one-tailed test. The grey band around the line represents 95% confidence interval.
b, NLRX1 expression is positively correlated with the OXPHOS pathway genes expression. Linear regression analysis between NLRX1 and other gene expression was performed using the R package LIMMA, and GSEA was used to assess how the OXPHOS pathway is correlated with the magnitude of NLRX1 expression in sorted CD4 T cells from HIV-1-infected subjects in both Asian and African cohorts. NES reflects the degree to which genes of the OXPHOS pathway is correlated with NLRX1 expression. Supplementary Table 2 provides statistical results for the enrichment and leading-edge genes of the OXPHOS pathway.
c, Heatmap illustrating the leading edge genes from the OXPHOS pathway that correlate with NLRX1 expression levels (Regression analysis, KEGG: OXPHOS gene-set ~ NLRX1 expression levels, GSEA: NES=2.02,P < 0.0001). Rows represent the z-score normalized genes in the leading edge of the OXPHOS pathway, and columns represent samples of the RV217 cohort: Africa (red), Asia (green). The magnitude of NLRX1 expression (green) is plotted as annotation at the top of the heatmap. Gene expression is represented as a gene-wise standardized expression (Z score). Red and blue correspond to up- and downregulated genes, respectively.
NLRX1 is required for HIV-induced oxidative phosphorylation
To further test the connection between NLRX1 and metabolism alteration during HIV-1 replication in CD4 T cells, we diminished NLRX1 expression in the human Jurkat T cell line by two short hairpin RNA (sh-NLRX1#1 and #2) and profiled the proteome of VSV-G-NL4–3-Luc-infected and uninfected Jurkat cells by quantitative mass spectrometry. We normalized the protein levels in VSV-G-NL4–3-Luc infected cells containing two individual sh-NLRX1 (Jurkat-sh-NLRX1 line 1 and line 2) and cells containing a control shRNA (Jurkat-sh-Ctr) by the protein levels in the uninfected cells. Compared to Jurkat-sh-Ctr cells, 336 proteins in Jurkat-sh-NLRX1 line 1 and 294 proteins in Jurkat-sh-NLRX1 line 2 had more than a twofold change, with 210 proteins shared by the two lines as shown by the heatmap (Fig. 4a, b and Supplementary Table 4). A distinct protein expression pattern was evident between Jurkat-sh-NLRX1 cells and Jurkat-sh-Ctr cells upon VSV-G-NL4–3-Luc infection, although two infected Jurkat-sh-NLRX1 cell lines showed a similar pattern of enhanced and reduced protein levels compared to Jurkat-sh-Ctr cells (Fig. 4b). When comparing virus-infected cells to uninfected cells, differentially expressed proteins (infection/mock, ∣fold change∣ ≥ 2) in the sh-Ctr group were clustered in the OXPHOS pathway with the most significance (P-value), and most of the proteins detected in this pathway were up-regulated (Z-score) (Fig. 4c). This observation echoed our transcriptomic analysis of the RV217 cohort showing that OXPHOS positively correlated with HIV-1 set-point viral load. Importantly, although proteins in the OXPHOS pathway were predominantly up-regulated in Jurkat-sh-Ctr cells upon VSV-G-NL4–3-Luc infection, they were up-regulated to a lesser extent in Jurkat-sh-NLRX1 cells (Fig. 4c, d and Supplementary Table 5). The proteome analysis showed an association of NLRX1 with genes in the OXPHOS pathway. However, it is essential to test if NLRX1 is a bona fide regulator of OXPHOS during HIV-1 infection by metabolic assays.
Fig. 4. NLRX1-dependent up-regulation of OXPHOS in HIV-1-infected T cells.
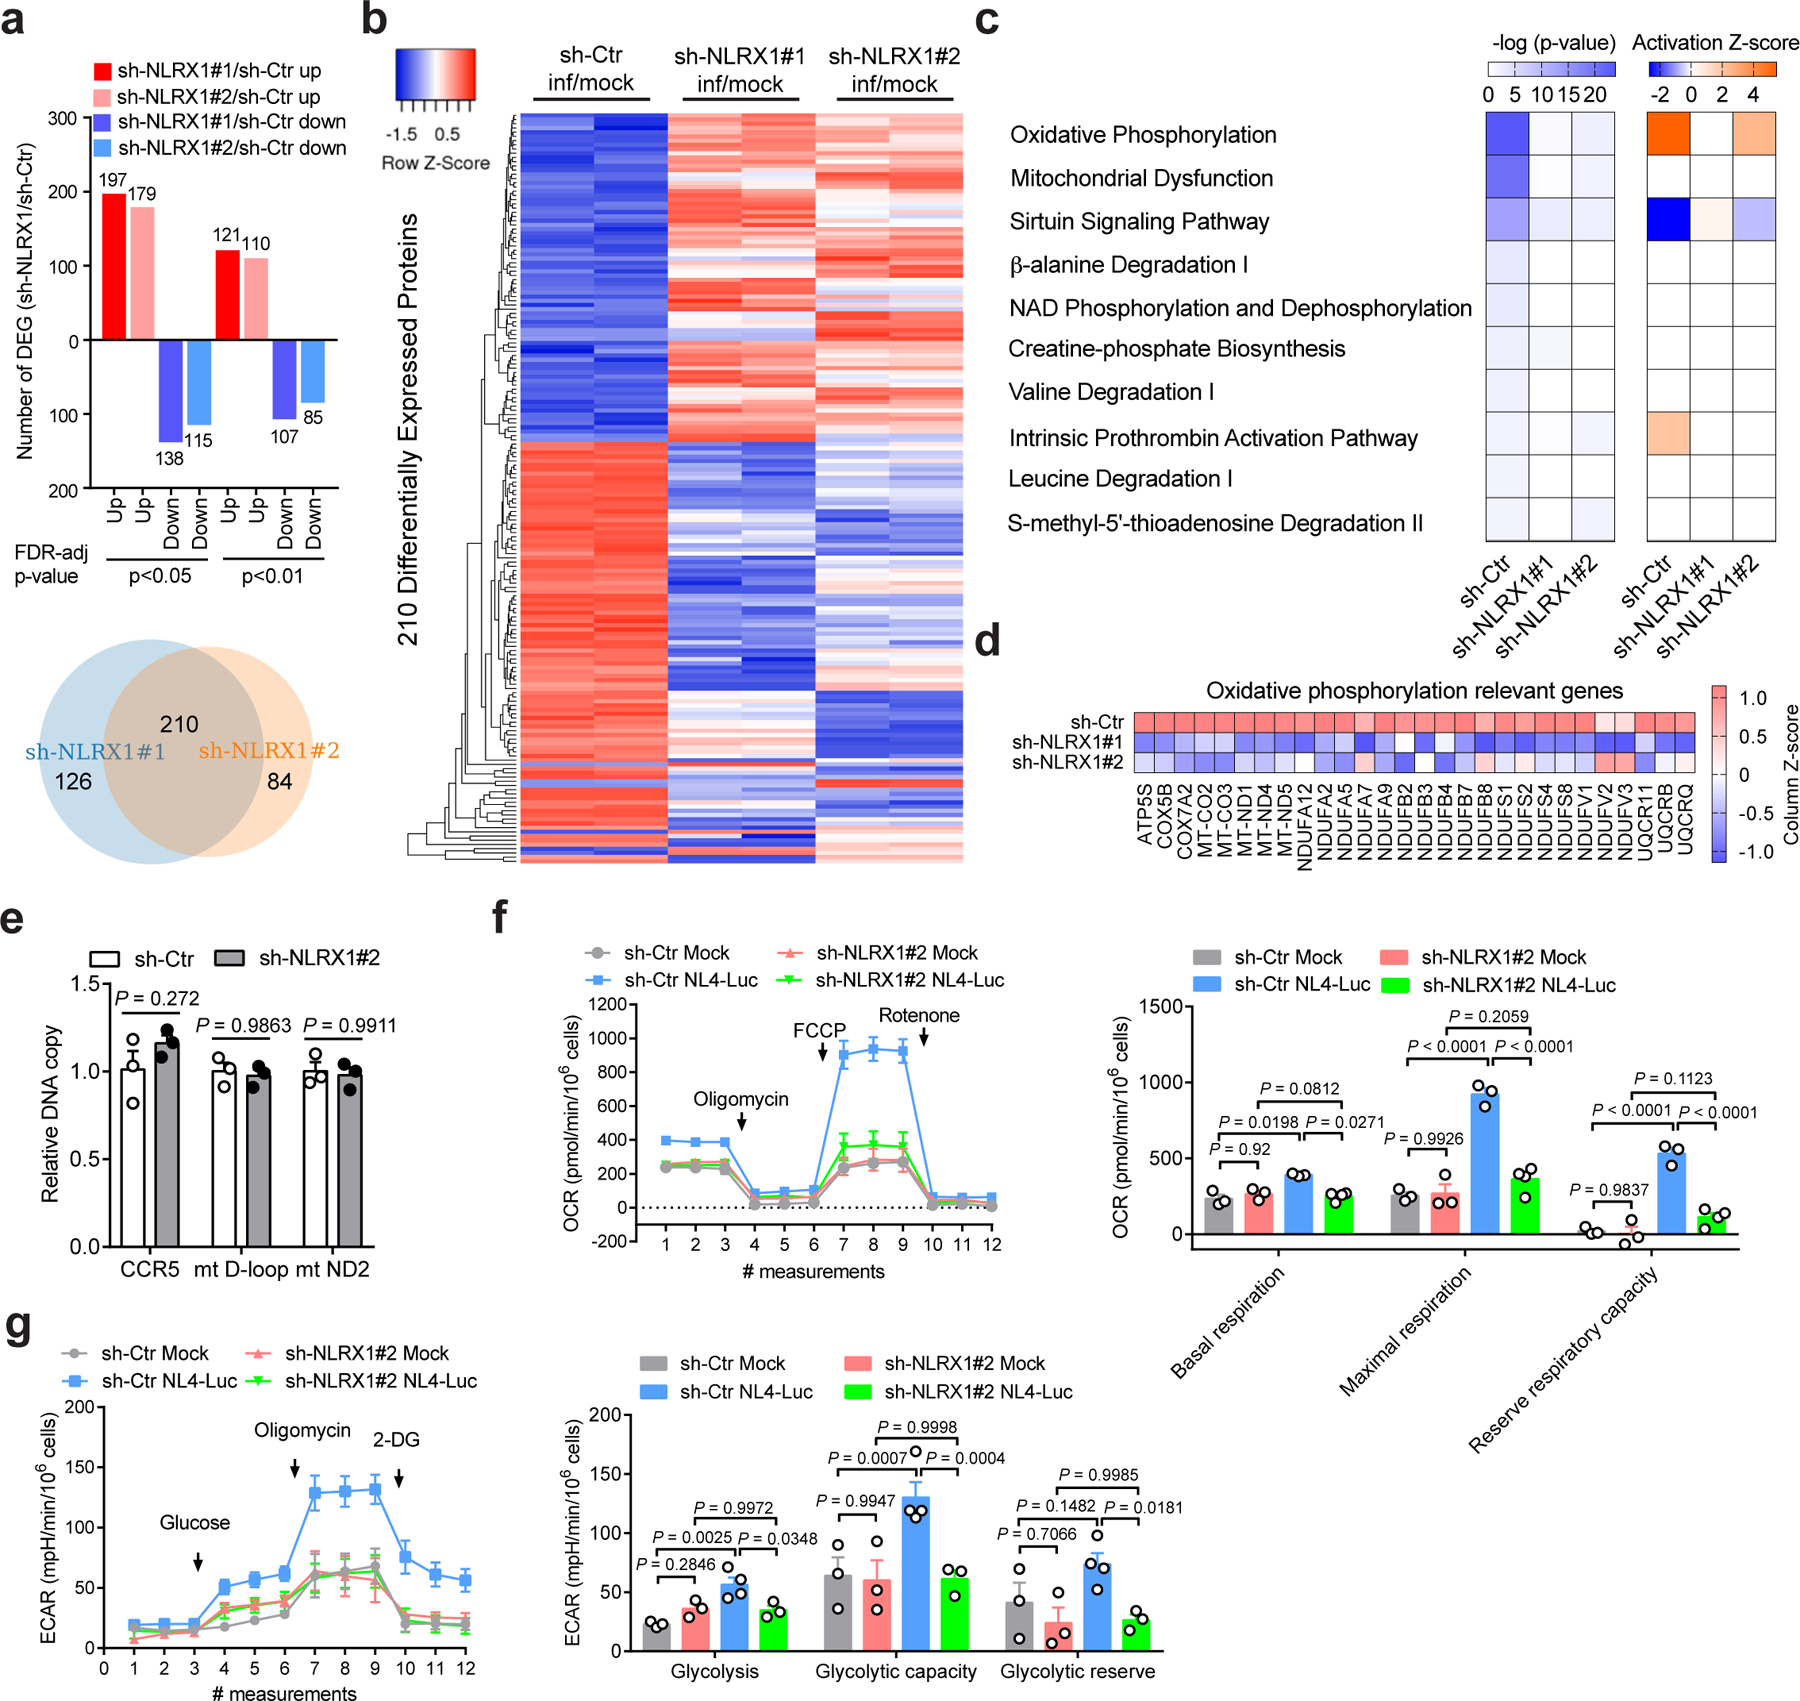
a, Upper panel: Bar diagrams represent numbers of upregulated and downregulated proteins in VSV-G-NL4–3-Luc-infected Jurkat-sh-NLRX1 compared to Jurkat-sh-Ctr at indicated levels of FDR-adjusted significance. Lower panel: Venn diagram shows the number of upregulated and downregulated proteins (sh-NLRX1/sh-Ctr) co-identified using two different NLRX1 shRNA-transduced Jurkat cells. Two hundred and ten co-identified proteins were used to plot the heatmap.
b, Heatmap comparing the differentially expressed proteins between Jurkat-sh-Ctr and Jurkat-sh-NLRX1#1 and Jurkat-sh-NLRX1#2 cells infected with VSV-G-NL4–3-Luc. Samples were run in biological duplicates. c, Predicted canonical pathways of differentially expressed proteins (infection/mock, fold change ≥ 2), based on Ingenuity Pathway Analysis. The left panel: P-value; the right panel: activation Z-score.
d, Expression change of proteins involved in the OXPHOS pathway (infection/mock).
e, The measurement of nuclear and mitochondrial DNA content in Jurkat cells containing sh-Ctr or sh-NLRX1. sh-Ctr was set as 1. For each gene region, n = 3 cell cultures per experiment.
f, g, The oxygen consumption rate (OCR, f) and extracellular acidification rate (ECAR, g)in Jurkat-sh-Ctr or Jurkat-sh-NLRX1 cells infected with VSV-G-NL4–3-Luc (NL4-Luc) or left uninfected (mock). Each dot represents one cell culture.
Data are the pool (a, b) or mean (c, d) of two biological replicates. Data (e–g) are representative of three independent experiments shown as the mean ± s.e.m. Statistical significance was tested by two-way ANOVA followed by Sidak’s (e) or Tukey’s (f, g) multiple comparisons test.
NLRX1-depletion did not affect the amount of mitochondrial DNA (Fig. 4e) or OXPHOS in Jurkat cells under the non-infected condition (Fig. 4f); however, there was a substantial increase of OXPHOS in Jurkat-sh-Ctr cells upon VSV-G-NL4–3-Luc infection. This increase was abolished in Jurkat-sh-NLRX1 cells at both basal and maximal respiration and reserved respiratory capacity (Fig. 4f). This indicates that NLRX1 is required for increased OXPHOS upon HIV-1 infection. An increased OXPHOS might be accompanied by increased glycolysis. Indeed, a significant increase of glycolysis and glycolytic capacity was observed upon HIV-1 pseudovirus infection (Fig. 4g), which is in line with the literature28. Collectively, these data indicate that NLRX1 is involved in the reprogramming of OXPHOS upon HIV-1 infection of CD4 T cells.
NLRX1 facilitates HIV-1 replication in human CD4 T cells
Although NLRX1 suppresses type I interferon (IFN-I) to facilitate HIV-1 replication in myeloid cells14, whether it regulates HIV-1 replication in its primary target CD4 T cells has not been studied. The observed positive correlation between NLRX1 expression and HIV-1 viremia and increased expression of NLRX1 upon HIV-1 infection suggested a role of NLRX1 in HIV-1 replication in CD4 T cells. In line with this hypothesis, HIV-1 replication, reflected by the luciferase activity, decreased 3 to 5 fold in Jurkat-sh-NLRX1 cells compared to Jurkat-sh-Ctr cells over time (Fig. 5a). Consistent with the luciferase data, the synthesis of HIV-1 Gag protein was also significantly decreased in Jurkat-sh-NLRX1 cells (Fig. 5b). Furthermore, the CCR5/CXCR4 dual-tropic HIV-1 strain R3A also exhibited a dramatic drop of virus replication in Jurkat-sh-NLRX1 cells over time, determined by the quantification of cell-free HIV-1 virions (Fig. 5c) and intracellular staining of HIV-1 capsid antigens p24 (Fig. 5d), respectively. To assess the veracity of these data in primary cells, we decreased NLRX1 expression in primary human CD4 T cells with shRNA and found a reduced replication of HIV-1 R3A (Fig. 5e). As we have shown, inhibition of OXPHOS could suppress HIV-1 replication. NLRX1 was required for upregulation of OXPHOS upon HIV-1 infection in CD4 T cells. Therefore, a possible model is that NLRX1 would promote HIV-1 replication in CD4 T cells via OXPHOS. In fact, OXPHOS inhibitors, rotenone, antimycin A, and metformin, which significantly suppressed HIV-1 replication in Jurkat-sh-Ctr cells, had less or no effect on HIV-1 replication in Jurkat-sh-NLRX1 cells, indicating that the effect of OXPHOS on HIV-1 replication is NLRX1-dependent (Fig. 5f, g). Interestingly, NLRX1 expression was significantly increased in the metformin-treated primary CD4 T cells (Extended Data Fig. 4), which may reflect compensatory feedback for the reduced OXPHOS by metformin. More importantly, resveratrol, which can upregulate the expression of electron transport chain constituents29, 30, restored both HIV-1 replication (Fig. 5h) and OXPHOS (Fig. 5i) in Jurkat-sh-NLRX1 cells to a similar level as in control cells. Collectively, these results suggest that NLRX1 is a host factor that promotes HIV-1 replication in CD4 T cells via the OXPHOS pathway.
Fig. 5. NLRX1 is required for HIV-1 replication in human CD4 T cells.
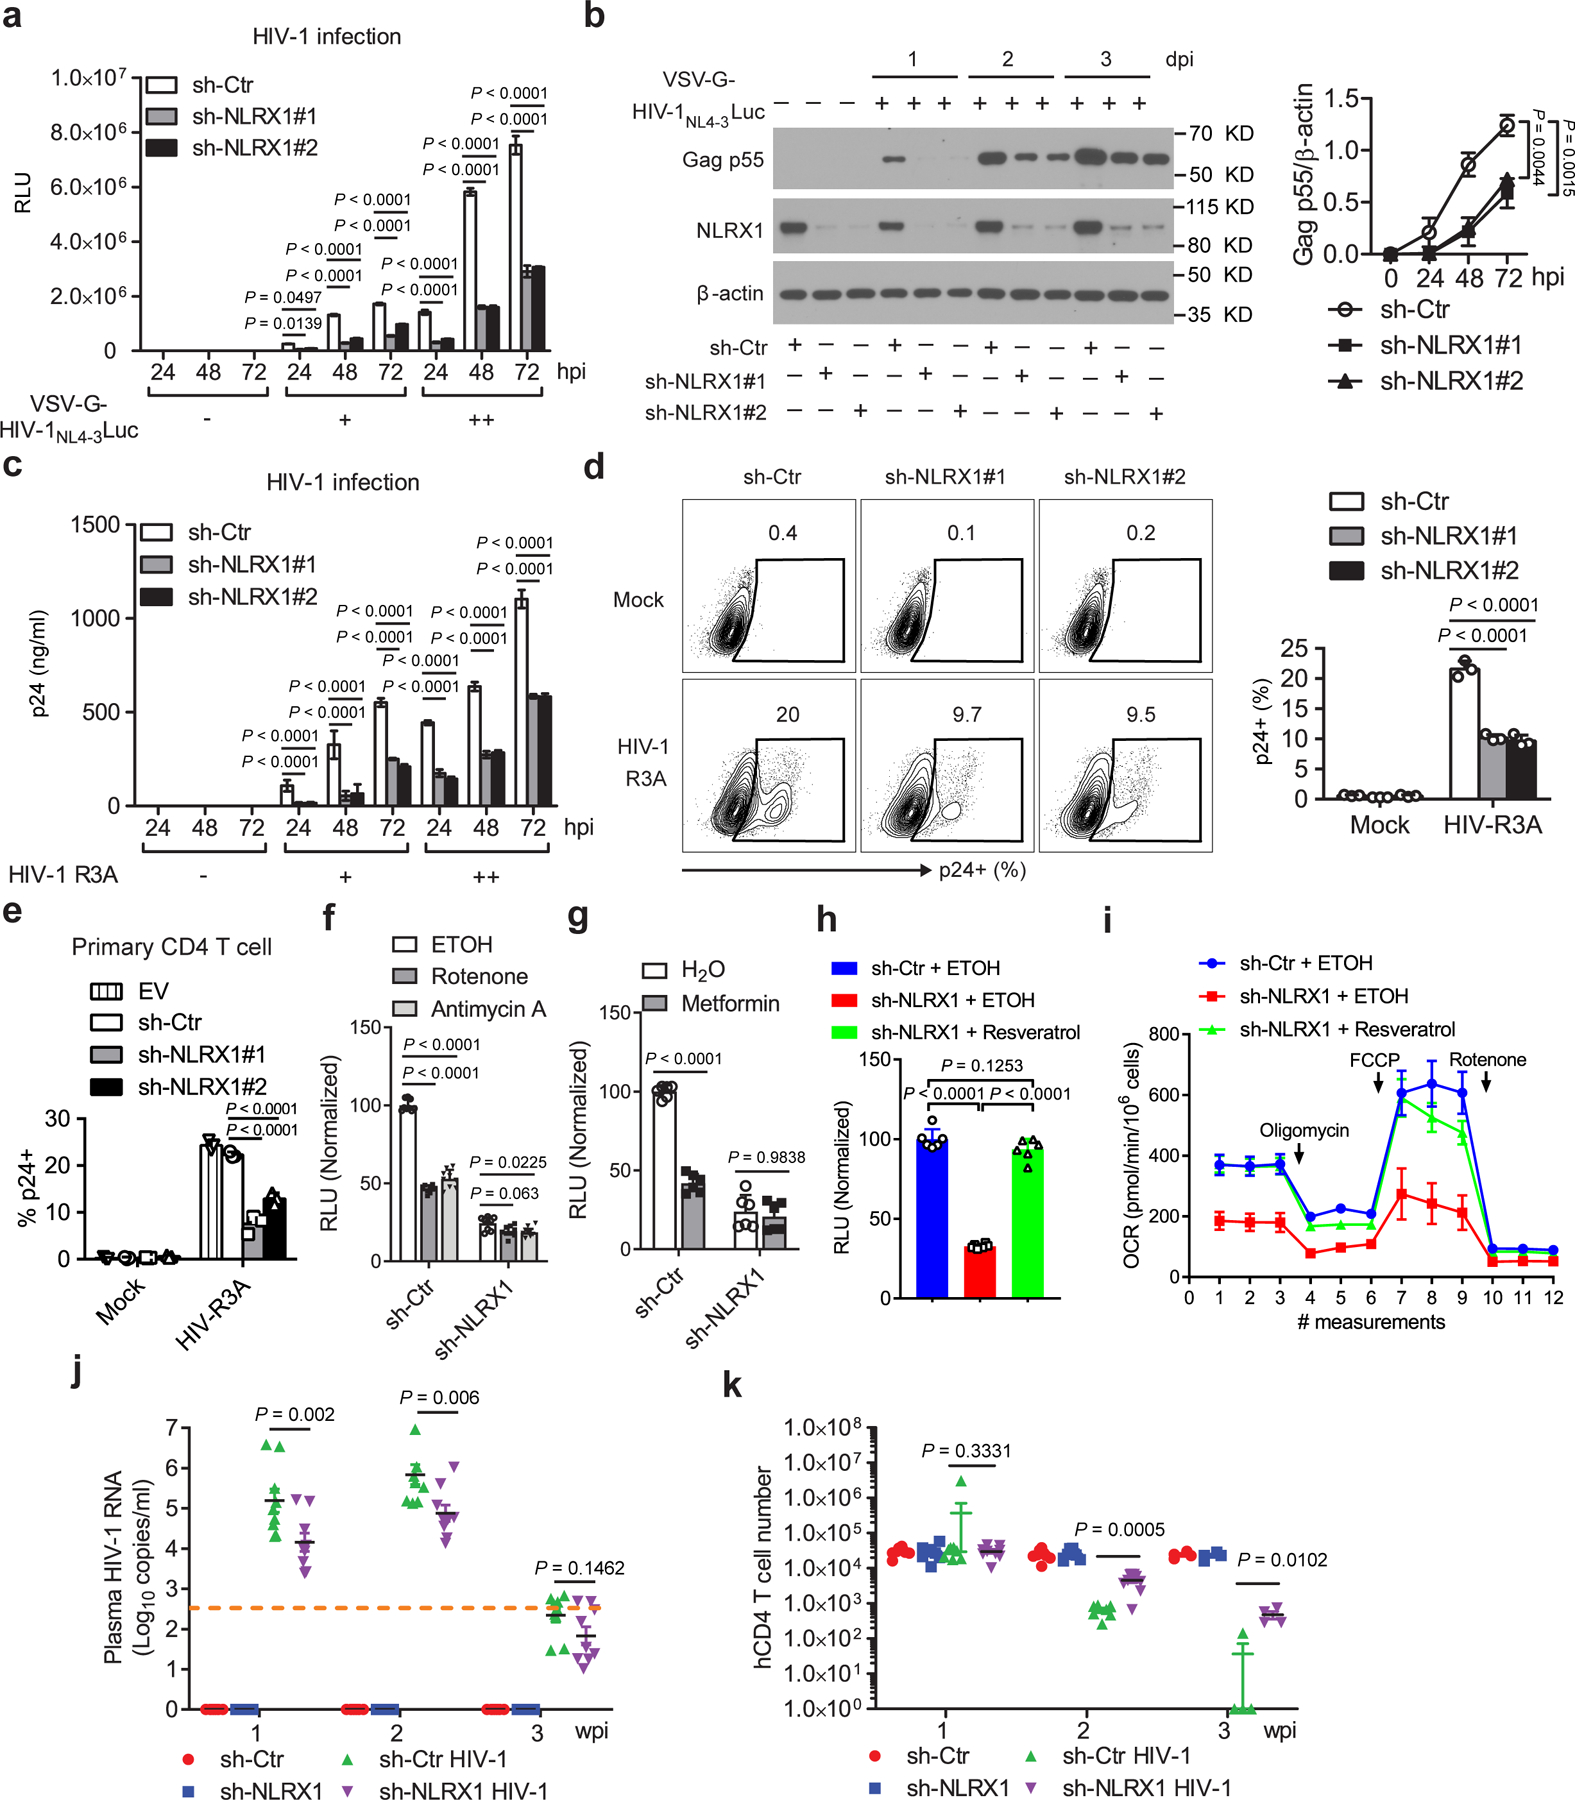
a, b, Luciferase activities (RLU, a) and HIV-1 Gag p55 protein levels (b, left). Densitometry analysis of Gag p55 levels (b, right). β-actin was the loading control. n = 3 cell cultures per experiment. hpi: hours post infection.
c, Extracellular HIV-1 p24 levels. n = 3 cell cultures per experiment.
d, Intracellular HIV-1 p24 levels at 48 hpi. n = 3 cell cultures per experiment.
e, Intracelluar HIV-1 p24 levels in NLRX1-silenced human primary CD4 T cells at 48 hpi. n = 3 cell cultures per experiment.
f, RLU in 0.2 µM rotenone, 0.2 µM antimycin A or the vehicle control ethanol (ETOH) treated cells at 24 hpi. n = 9 cell cultures per experiment.
g, RLU in 5 mM metformin or the vehicle control sterile water treated cells at 24 hpi. n = 6 cell cultures per experiment.
h, RLU in 5 µM resveratrol or the vehicle control ethanol treated cells at 48 hpi. n = 6 cell cultures per experiment.
i, OCR in 5 µM resveratrol or the vehicle control ethanol treated cells at 24 hpi. n = 5 cell cultures per experiment; multiple t tests (two-tailed).
j, k, HIV-1 viremia (j) and peripheral blood human CD4 T cell count (k) in the NRG-hu CD4 mice serum. n = 8 mice for uninfected and n = 9 mice for infected groups.
Data (a–i) are representative of three independent experiments shown as the mean ± s.e.m. Data (j, k) are from pooled mice of two independent experiments. Statistical significance was tested by one-way or two-way ANOVA followed by Tukey’s (a–f, h, j) or Sidak’s (g) multiple comparisons test.
Diminishing NLRX1 reduces HIV-1 replication in humanized mice reconstituted with human CD4 T cells
To investigate the function of NLRX1 in HIV-1 replication in vivo, NRG mice were reconstituted with human CD4 T cells containing sh-NLRX1 or sh-Ctr, infected with HIV-1, and monitored for viremia and human CD4 T cell count weekly. Consistent with results from in vitro CD4 T cell cultures, NRG-hu CD4 mice containing sh-NLRX1 had one order of magnitude drop in viral load in peripheral blood over time when compared to those with sh-Ctr (Fig. 5j). Reducing NLRX1 expression did not affect human CD4 T cell reconstitution, demonstrated by similar CD4 T cell counts in peripheral blood of NRG-hu CD4 mice bearing sh-Ctr or sh-NLRX1 prior to HIV-1 infection (Fig. 5k). Human CD4 T cells were depleted by HIV-1 starting from 2 wpi in the NRG-hu CD4 model. In line with the viral load data, diminishing NLRX1 resulted in the protection of human CD4 T cells from depletion, demonstrated by nearly a log higher CD4 T cell count in peripheral blood of NRG-hu CD4 mice bearing sh-NLRX1 assayed at 2 and 3 wpi (Fig. 5k and Extended Data Fig. 5a). In addition to the peripheral blood, the silence of NLRX1 also significantly protected human CD4 T cells from depletion by HIV-1 in the NRG-hu CD4 mouse spleen, reflected by an attenuated reduction of spleen size and splenocyte counts (Extended Data Fig. 5b, c). Together, these data indicate that diminishing NLRX1 partially protected CD4 T cells from HIV-1-mediated depletion by suppressing viral replication in vivo.
Endogenous NLRX1 interacts with endogenous FASTKD5 to promote HIV-1 replication
To decipher the mechanism underlying NLRX1-regulated cellular metabolism and HIV-1 replication in CD4 T cells, we first examined the previously reported functions of NLRX1. In addition to regulating IFN-I responses, NLRX1 has been reported to promote autophagy and endoplasmic reticulum (ER) stress31, 32. Since IFN-I produced by CD4 T cells is too low to limit HIV-1 replication at the first round33, the role of NLRX1 in CD4 T cells is unlikely to be attributed to IFN-I. Indeed, blockage of IFN-I downstream signaling with the Janus kinase inhibitor, ruxolitinib, did not affect HIV-1 replication in either Jurkat-sh-Ctr or Jurkat-sh-NLRX1 cells (Extended Data Fig. 6a), although it did diminish the phosphorylation of STAT1, indicating the efficacy of the inhibitor (Extended Data Fig. 6b). An autophagy inhibitor 3-Methyladenine (3-MA) significantly but equally suppressed VSV-G-NL4–3-Luc replication in Jurkat-sh-Ctr or Jurkat-sh-NLRX1 cells, suggesting that NLRX1-regulated HIV-1 replication is independent of the autophagy pathway (Extended Data Fig. 6c). Pharmacological inhibition of ER stress did not alter VSV-G-NL4–3-Luc replication in either Jurkat-sh-Ctr or Jurkat-sh-NLRX1 cells (Extended Data Fig. 6d), suggesting that this pathway is also not involved. These experiments excluded previously known functions of NLRX1 as the molecular basis of its enhancement of HIV-1 replication in CD4 T cells and justified a focus on the link of NLRX1-regulated metabolic changes with HIV-1 replication.
To explore this unknown mechanism, we searched NLRX1 interaction proteins based on a published database describing the interaction networks of innate immune proteins by the co-immunoprecipitation and mass spectrometry approach34. NLRX1 resides in the mitochondria and potentially regulates OXPHOS by interacting with its mitochondrial partners. Mitochondrial proteins FASTKD5, PRDX3, and SPNS1were screened as NLRX1 interaction partners previously using overexpressed NLRX1 as the bait for immunoprecipitation followed by mass spectrometry (Extended Fig. 7a)34. We assessed the physiologic relevance of these interactions by examining interactions between the endogenous proteins in T cells. A strong specific association was detected between endogenous NLRX1 and FASTKD5 (Fig. 6a and 6b), while NLRX1-PRDX3 and NLRX1-SPNS1 interactions were not detected (Fig. 6a). Further, HIV-1 infection enhanced the interaction between NLRX1 and FASTKD5, although it did not alter FASTKD5 expression at both the transcript and protein level (Fig. 6c and Extended Data Fig. 7b, c).
Fig. 6. NLRX1 associates with FASTKD5 and modulates the OXPHOS pathway and HIV-1 replication in T cells.
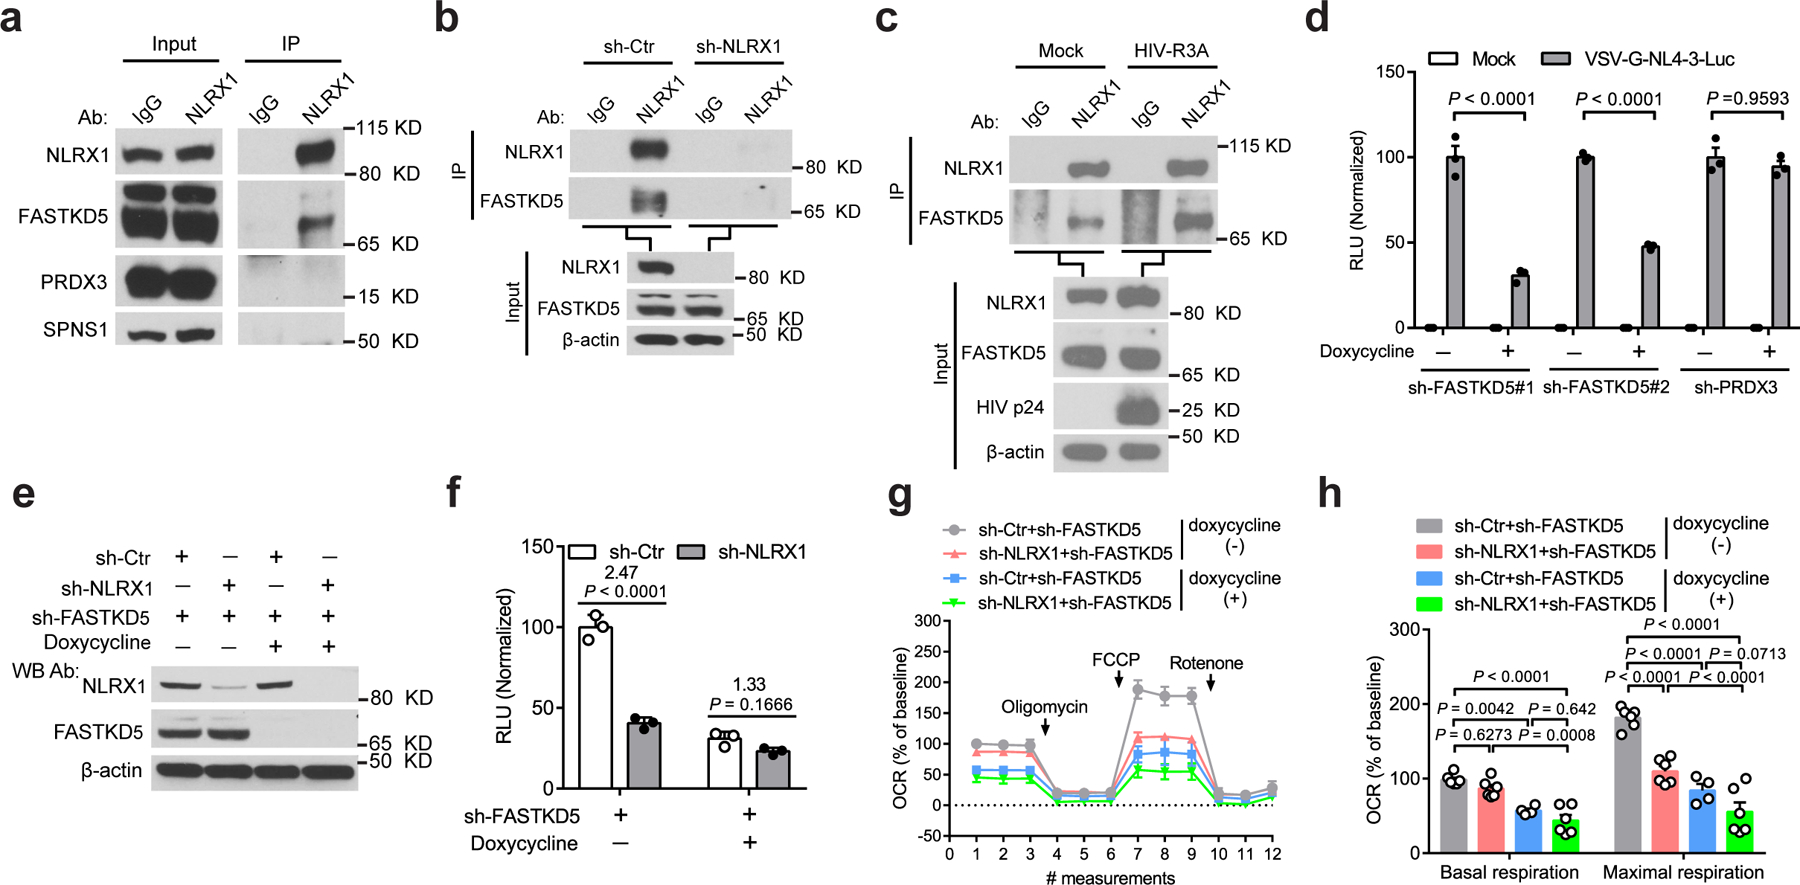
a, Interactions between NLRX1 and the mitochondrial proteins at the endogenous level. cell lysate: input; immunoprecipitated sample: IP. IgG: IP negative control.
b, NLRX1 interacted with FASTKD5 at the endogenous level. IgG: IP negative control. β-actin: loading control.
c, HIV-1 infection enhanced the association of NLRX1 and FASTKD5. HIV-1 R3A-infected Jurkat cells were subjected to IP by NLRX1 antibody or IgG at 72 hpi. β-actin: loading control.
d, RLU in FASTKD5- or PRDX3-silenced Jurkat cells at 24 hpi. n = 3 cell cultures per experiment.
e, Jurkat-sh-Ctr and Jurkat-sh-NLRX1 transduced with a lentivirus that contains a Tet-on promoter-controlled shRNA for FASTKD5 were treated with doxycycline for 72 hr or left untreated. Immunoblot shows the silencing of FASTKD5 and NLRX1. β-actin: loading control.
f, Cells were treated as described in e, followed by infection with VSV-G-NL4–3-Luc. RLU was measured at 24 hpi. n = 3 cell cultures per experiment.
g, Silencing of FASTKD5 in Jurkat-sh-Ctr and Jurkat-sh-NLRX1 was induced by doxycycline for 72 hr, followed by the infection of VSV-G-NL4–3-Luc. OCR was determined at 24 hpi. n = 6 cell cultures per experiment.
h, Basal respiration and maximal respiration. Each dot represents one cell culture.
Data are representative of three independent experiments, and panels d, f, g, and h are shown as the mean ± s.e.m. Statistical significance was tested by two-way ANOVA followed by Tukey’s (d, h) or Sidak’s (f) multiple comparisons test.
We next tested the hypothesis that NLRX1 and FASTKD5 work together to regulate OXPHOS and HIV-1 replication in T cells. To test the role of FASTKD5, we silenced FASTKD5 expression in Jurkat cells by doxycycline-inducible shRNA, and we also silenced a negative control PRDX3 that did not endogenously interact with NLRX1 in our validation experiment (Extended Data Fig. 7d, e). This was followed by VSV-G-NL4–3-Luc infection. Silencing FASTKD5 resulted in significant suppression of viral replication at 24 hpi (Fig. 6d). Silencing PRDX3 showed no significant effect on viral replication (Fig. 6d). The latter excluded the unintended effect from doxycycline treatment and provided a specificity control. Silencing FASTKD5 in Jurkat cells that also silenced NLRX1 with sh-NLRX1 did not further reduce VSV-G-NL4–3-Luc replication, suggesting that these two proteins are in the same pathway and thus exhibited redundant activity (Fig. 6e, f). Similar to the earlier study showing that the silencing of NLRX1 dampened HIV-1-induced up-regulation of OXPHOS, silencing FASTKD5 also reduced OXPHOS (Fig. 6g, h). Again, silencing both NLRX1 and FASTKD5 provided no significant additive effect over the silencing of each individual gene in their impact on OXPHOS, reinforcing the concept that these two are in the same pathway (Fig. 6g, h). Taken together, these results identified a new NLRX1- and FASTKD5-dependent pathway that regulates HIV-1 replication and the OXPHOS state of HIV-1-infected T cells.
Silencing FASTKD5 generally reduces the expression of mitochondrial electron transport chain components
To further explore the molecular mechanism underlying FASTKD5 regulated OXPHOS in the context of HIV-1 infection, we profiled the proteome of HIV-1 pseudovirus-infected FASTKD5-silenced Jurkat cells (sh-FASTKD5_inf) and its control cells (sh-Ctr_inf) by quantitative mass spectrometry. Compared to control cells, the differential expressed proteins (∣fold change∣ ≥ 1.5, P < 0.05) showed more downregulation than upregulation in FASTKD5-silenced cells (Fig. 7a and Supplementary Table 6). When analyzing by Ingenuity Pathway Analysis, these differentially expressed proteins (sh-FASTKD5_inf/sh-Ctr_inf) were most enriched in the OXPHOS pathway with a negative Z-score, suggesting downregulation of OXPHOS in FASTKD5-silenced Jurkat cells (Fig. 7b). In line with this, we observed a general decrease of electron transport chain components which spanned mitochondrial complex I to V (Fig. 7c). To pinpoint how FASTKD5 regulates protein levels in the OXPHOS pathway, we performed the ReactomeFI network analysis of downregulated proteins in FASTKD5-silenced cells and found that, in addition to clustered pathways involved in mitochondrial respiration, metabolism and RNA and mitochondrial rRNA and tRNA processing were enriched (Fig. 7d). By performing Molecular Complex Detection (MCODE), we found that mitochondrial complex I and IV and interestingly a molecular complex for mRNA splicing were among the downregulated proteins (Fig. 7e). The proteomic analysis agrees with previous reports that FASTKD5 binds to mitochondrial ribosomal RNA and mRNA, which is critical for the mitochondrial mRNA maturation and subsequent mitochondrial protein translation and electron transport chain complexes assembly35, 36. Thus, combined with the proteomic analysis of NLRX1-silenced T cells in the context of HIV-1 infection (Fig. 4d), we found both NLRX1 and FASTKD5 positively regulate the expression of genes in the OXPHOS pathway. These data reinforced the concept that NLRX1 and FASTKD5 cooperatively promote OXPHOS in HIV-1-infected T cells.
Fig. 7. FASTKD5 upregulates electron transport chain components upon HIV-1 infection.
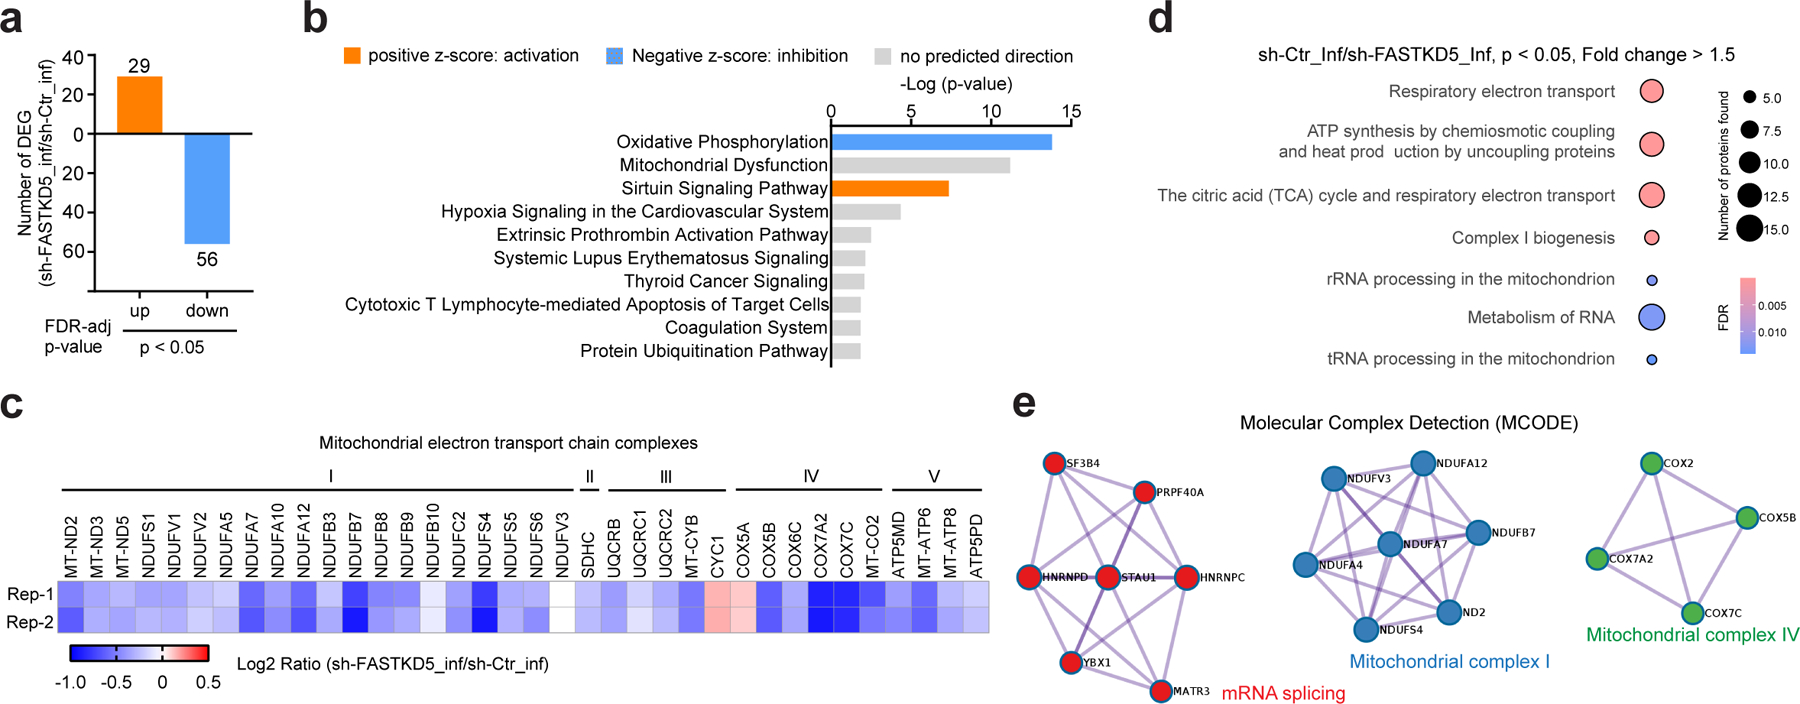
a, Characterization of FASTKD5-regulated protein expression by tandem mass tag (TMT) based quantitative mass spectrometry. Bar diagrams represent numbers of upregulated and downregulated proteins in VSV-G-NL4–3-Luc-infected Jurkat cells induced by doxycycline to express shRNA against FASTKD5 (sh-FASTKD5) compared to un-induced Jurkat cells (sh-Ctr) at indicated levels of FDR-adjusted significance. The mean value of two biological replicates was used to calculate the fold change (FC, sh-FASTKD5/sh-Ctr). Proteins with ∣FC∣ > 1.5 and FDR < 0.05 were identified as differentially expressed proteins.
b, Predicted canonical pathways of differentially expressed proteins based on Ingenuity Pathway Analysis. Top 10 enriched pathways based on P-value were plotted. Positive Z-score indicating activation was presented as orange color, and negative Z-score indicating inhibition was presented as blue.
c, Heatmap presenting changes in the expression of proteins in mitochondrial electron transport chain complexes (sh-FASTKD5/sh-Ctr, VSV-G-NL4–3-Luc infection). Samples were run in biological duplicates. P-value < 0.05 was used as the filter.
d, ReactomeFI network analysis of proteins downregulated in panel a. Circle size represents the number of proteins found in the pathway, and color shows the FDR for enrichment. Pathways with FDR < 0.05 were plotted.
e, Molecular Complex Detection (MCODE) analysis of proteins downregulated in panel a was performed by Metascape.
DISCUSSION
Immunometabolism is altered in HIV-1 positive individuals. Although metabolic reprogramming is associated with persistent HIV-1 spontaneous control by CD8 T cells37, the metabolic signatures of CD4 T cells accountable for HIV-1 disease progression are unclear3. In this report, we took advantage of the RV217 Early Capture HIV Cohort Study in which the patient’s HIV status and progression were characterized through the acute stages of HIV infection20. We analyzed the transcriptome of CD4 T cells and found that the expression of genes in the OXPHOS pathway positively correlates with HIV-1 set-point viral load. As a higher level of HIV-1 set-point viral load is usually associated with a faster progression to AIDS21, it is reasonable to recognize OXPHOS as a metabolic signature in the acute infection phase for predicting AIDS progression.
It was previously shown that HIV-1 preferentially infects CD4 T cells harboring a higher glycolytic and respiratory activity, but whether and how HIV-1 infection directly alters glycolysis and OXPHOS pathways are unclear6. This study used single-round replication HIV-1 pseudovirus VSV-G-NL4–3-Luc and found that both OXPHOS and glycolysis are up-regulated upon virus infection. Meanwhile, by using quantitative mass spectrometry, we found an enrichment of genes in the OXPHOS pathway with the most significance among all the canonical pathways analyzed by Ingenuity Pathways Analysis.
An interesting finding in our report is that mitochondria-localized innate immune protein NLRX1 and FASTKD5 mediate the up-regulation of OXPHOS in HIV-1 infected CD4 T cells. Mechanistically, NLRX1 associates with FASTKD5, a mitochondrial protein critical for mitochondrial protein translation and respiratory complexes assembly by binding with and processing mitochondrial RNA35, 36. This is the first study to show this NLRX1-FASTKD5 interaction at the endogenous expression level in CD4 T cells. This association is increased in HIV-1 infected cells over uninfected cells. Silencing either NLRX1 or FASTKD5 in CD4 T cells dampened the expression of genes in the OXPHOS pathway and mitochondrial respiration. It is notable that, based on our proteome data, the restricted expression of OXPHOS proteins by silencing NLRX1 or FASTKD5 was not limited to the mitochondrial encoded electron transport complexes components but extended to nuclear-encoded components. A possible explanation is that reduced mitochondrial proteins cause mitochondrial respiration dysfunction, which dampens cellular metabolism and, thereafter, general gene expression.
In line with NLRX1 and FASTKD5-orchestrated up-regulation of OXPHOS in HIV-1 infected CD4 T cells, both genes are required for HIV-1 replication in CD4 T cells. Currently, it is challenging to target NLRX1 and FASTKD5 for treating HIV-1 infection due to the lack of commercialized inhibitors; thus, we use regulators of OXPHOS to modulate HIV-1 replication. We showed that the FDA-approved anti-diabetic agent metformin, which is shown to suppress OXPHOS by targeting the mitochondrial complex-I, reduced HIV-1 replication in primary CD4 T cells in vitro and in mice reconstituted with human CD4 T cells in vivo. Importantly, clinical data showed that HIV-1 positive individuals with type-2 diabetes mellitus co-morbidity (HIV-T2DM) exhibited an average 1.33-fold lower HIV-1 viral load than non-diabetic HIV patients among the early cART treated cohort (6 months)38. In line with the viral load data, HIV-T2DM patients had a higher CD4 T cell baseline and faster recovery of CD4 T cell number after cART, which was correlated with metformin use38, 39. These clinical observations strengthen the supplementation of early-stage cART with drugs such as metformin to further restricting HIV-1 replication in patients. The toxic side effect of cART usually leads to treatment interruption, which results in a rebound of HIV-1 viremia and a decline of CD4 T cells40. Administration of metformin during the cART interruption may delay the rebound of HIV-1 viremia and offer a more extended period before the next round of cART. It is noted that the safety of administration of metformin for HIV patients, especially combined with cART, remains to be explored. A clinical trial (NCT02659306) registered to treat non-diabetic HIV-1 patients with metformin combined with anti-HIV drugs will shed light on the safety and effectiveness of metformin in non-diabetic HIV patient41.
In conclusion, we discovered a critical role of OXPHOS in HIV-1 replication in CD4 T cells and a novel NLRX1 and FASTKD5-dependent mechanism underlying immunometabolism regulation by HIV-1 in CD4 T cells. These findings build the premise to repurpose drugs that target OXPHOS for the treatment of HIV-1 infection.
METHODS
Ethics statement
All experiments using animals and human blood were conducted according to guidelines for the housing and care of laboratory animals42 and in accordance with protocols approved by the Institutional Animal Care and Use Committee and Institutional Review Boards at the University of North Carolina at Chapel Hill (UNC-CH). Human blood was purchased from the Gulf Coast Regional Center, Houston, TX. The protocol for RV217 study was approved by the local ethics review boards and the Walter Reed Army Institute of Research. Written informed consent was obtained from all participants.
Cell culture
Jurkat cells (TIB-152, ATCC) and the derived lines were maintained in RPMI1640 medium (Gibco) containing 10% fetal bovine serum (FBS), 1% penicillin and 100 μg/ml streptomycin (here referred to as complete RPMI medium). HEK293T cells (CRL-3216, ATCC) were maintained in DMEM medium (Gibco) containing 10% FBS, 1% penicillin and 100 μg/ml streptomycin. All cell lines were tested as mycoplasma-free. Human primary CD4 T cells isolated from human peripheral blood mononuclear cells using Dynabeads human CD4 T cell kit (11352D, Invitrogen) were stimulated and expanded with anti-CD3/anti-CD28-coated magnetic beads (11131D, Gibco) at a bead-to-cell ratio of 1:1 and maintained in a complete RPMI medium supplemented with 200 IU/ml IL-2 (NIH AIDS Reagent Program).
Virus propagation and infection
Single round virus vectors pNL4–3.Luc.E-R- were obtained from the NIH AIDS Reagent Program and pNL4–3.EGFP.E- was shared by Dr. Sumit K. Chanda at Sanford Burnham Prebys Medical Discovery Institute. VSV-G-pseudotyped HIV was produced as described previously43. Viruses were concentrated (30 fold) using the Lenti concentrator (TR30026, OriGene). Viral titer was determined by intracellularly staining with HIV-1 p24 antibody (KC57-FITC, Beckman Coulter) at 3 days post-infection (dpi). HIV-1 R3A was produced by transfecting proviral plasmid into HEK293T cells as described previously44. Virions were quantified by the HIV-1 p24 Antigen Capture Assay Kit (NIH AIDS Reagent Program). HIV-1 clinical isolates recovered from human resting CD4 cells from HIV-1 infected donors were provided by Dr. David Margolis (UNC-CH). Jurkat and human primary CD4 T cells were infected with VSV-G-pseudotyped HIV-1, HIV-1 R3A, or HIV-1 clinical isolates in the presence of 8 µg/ml polybrene (TR-1003-G, Sigma-Aldrich) at the multiplicity of infection (MOI) indicated in the figure legends or below. For drug treatment, 2.5 mM 3- MA (tlrl-3ma, Invivogen), 200 µM tauroursodeoxycholate (TUDCA) (T0266, Sigma-Aldrich), 0.2 or 1 µM rotenone (R8875, Sigma-Aldrich), 0.2 or 1 µM antimycin A (R8674, Sigma-Aldrich), 1 or 5 mM metformin (PHR1084, Sigma-Aldrich), 5 or 10 mM 2-DG (D8375, Sigma-Aldrich), or 5 µM resveratrol (R5010, Sigma-Aldrich) was used to treat cells 1 hour prior and during virus infection.
Real-Time PCR and oligonucleotides
Total cellular RNA was extracted using TRIzol reagent at indicated time point in the figure legend, followed by reverse transcription by iScript™ cDNA Synthesis Kit (1708891, Bio-Rad). NLRX1, FASTKD5, GAPDH, or ACTB TaqMan gene expression assay (Hs00226360_m1, Hs01855817_s1, Hs02758991_g1, or Hs99999903_m1, Applied Biosystems) was used to quantify gene expression by Real-Time PCR. HIV-1 replication was quantified by Real-Time PCR using the probe (FAM-5’-AAAATTCGGTTAAGGCCAGGGGGAAAGAA-3’-TAMRA, Applied Biosystems) and primers (5’-GGTGCGAGAGCGTCAGTATTAAG-3’, 5’-AGCTCCCTGCTTGCCCATA-3’, Integrated DNA Technologies) targeting the HIV-1 Gag region. Gene expressions were normalized to ACTB or GAPDH mRNA levels. Cellular DNA was extracted from 2×10⁵ cells by using DNeasy Blood & Tissue Kit (Qiagen). Mitochondrial DNA (within D-loop or MT-ND2) and nuclear DNA (within nuclear gene CCR5) content was measured by Real-Time PCR using SYBR Green (4309155, Applied Biosystems) and normalized by the nuclear DNA (within the TBP nuclear regions on chromosome 6). Primers: CCR5: 5’-CCAGAAGAGCTGAGACATCCG-3’, 5’-GCCAAGCAGCTGAGAGGTTACT-3’; D-loop: 5’-GATTTGGGTACCACCCAAGTATTG-3’, 5’-GTACAATATTCATGGTGGCTGGCA-3’; MT-ND2: 5’-AGCACCACGACCCTACTACT-3’, 5’-TGGTGGGGATGATGAGGCTA-3’; TBP: 5’-TTCACTTCCCCTTGGCCACAACAT-3’, 5’-TGTTCCATGCAGGGGAAAACAAGC-3’. Analyses for relative gene expression and mitochondrial DNA contents and HIV-1 replication were performed using the 2−∆∆CT approach45.
Lentiviruses preparation and cell transduction
TRC Lentiviral pLKO.1 empty vector and pLKO.1 containing NLRX1 targeting shRNAs (TRCN0000128446, sh-NLRX1#1: 5’- GTCTGGAATCTCCAAGTTAAA −3’, TRCN0000130325, sh-NLRX1#2: 5’- GAGTCTGGAATCTCCAAGTTA −3’) were obtained from TRC-Hs1.0 (Human) library provided by the Lenti-shRNA Core Facility at UNC-CH. TRC Lentiviral Non-targeting shRNA (sh-Ctr) was purchased from Horizon Discovery (Catalog# RHS6848). SMARTvector Inducible Lentiviral shRNA targeting FASTKD5 (sh-FASTKD5#1: V3SH11252–226616423 and sh-FASTKD5#2: V3SH11252–228281042) or PRDX3 (sh-PRDX3#1: V3SH11252–224976620 and sh-PRDX3#2: V3SH11252–224980877) were purchased from Horizon Discovery. Lentiviruses were made by cotransfection of the lentiviral vector, VSV-G, and ΔNRF into HEK293T cells. Jurkat cells were infected with lentiviruses containing shRNA by spinoculation (1,000 × g and 25 °C for 3 h) to generate the relevant knockdown cell lines. Silencing of FASTKD5 and PRDX3 was induced by 1 μg/ml doxycycline (D3447, Sigma-Aldrich) for 72 hr. To double knock down NLRX1 and FASTKD5, Jurkat-sh-NLRX1#2 cells were transduced with sh-FASTKD5#1. To reduce NLRX1 expression in human primary CD4 T cells, cells were stimulated with anti-CD3/anti-CD28-coated magnetic beads for 24 hr and then transduced with concentrated lentiviruses expressing sh-NLRX1 (MOI=5). Beads were removed at day 5 after stimulation. Transduced CD4 T cells were expanded in a complete RPMI medium containing 200 IU/ml of IL-2.
Luciferase assay
Various Jurkat cell lines were seeded in U-bottom 96-well plates at a density of 1.0×10⁵ per well and infected with VSV-G-NL4–3-Luc at the MOI as indicated in the figure legend. At indicated time points, cells were harvested and measured for firefly luciferase activity by the Luciferase Assay Reagent II (Promega) according to the manufacturer’s instruction. Total proteins were quantified by the Pierce™ BCA Protein Assay Kit. Luciferase activity was normalized by 1 µg of total proteins.
Immunoblotting
Jurkat cells infected with HIV pseudoviruses or lentiviruses as indicated in the figure legend were harvested and subjected to immunoblot as previously described14. Primary antibodies included anti-NLRX1 (generated by Ting lab, 1:2000), anti-HIV-1 p24 (39/5.4A, 1:500), anti-STAT1 (#9172, 1:1000), anti-phospho-STAT1 (Y701, #9171, 1:1000) (Cell Signaling Technology), anti-FASTKD5 (ab111548, 1:1000), anti-PRDX3 (ab73349, 1:1000), anti-SPNS1 (ab59971, 1:1000) (Abcam) and anti-β-actin (sc-1615, HRP conjugate, 1:5000) (Santa Cruz Biotechnology). Appropriate HRP-conjugated secondary antibodies were used, and proteins were detected using Enhanced Chemiluminescent reagent (Thermo Fisher Scientific). Densitometry analysis was performed for Gag p55 levels by normalizing to β-actin using Image J (NIH).
Measurement of HIV-1 replication by flow cytometry
Jurkat cells and human primary CD4 T cells infected with HIV-1 R3A were harvested at 48 hpi and fixed and permeabilized using Fixation/Permeabilization Solution Kit (BD Biosciences) according to manufacturer’s instructions, followed by intracellular staining with anti-HIV-1 p24-FITC for 30 min. HIV-1 p24 positive cells were determined using the CyAn ADP flow cytometer. Summit v5.0 was used for samples collection and FlowJo v9 was used for data analysis.
Measurement of NLRX1 expression by Imaging Flow Cytometry
Jurkat cells were infected with VSV-G-NL4–3-EGFP (MOI=0.5). At 48 hpi, cells were fixed and permeabilized using Fixation/Permeabilization Solution Kit. Intracellular staining of NLRX1 was conducted using 1 µg/ml anti-NLRX1 (PA5–21018, Invitrogen) and then 1 µg/ml Alexa Fluor 647 Donkey anti-rabbit IgG (406414, Biolegend) for 30 min on ice, respectively. After staining, images of cells expressing GFP and NLRX1 were obtained by ImageStreamX MkII (Luminex Corporation). Data were analyzed by IDEAS6.2 software.
Human CD4 T cell-reconstituted mouse model for HIV-1 infection
To test the efficacy of NLRX1 silencing in HIV-1 infection using an in vivo model, total CD4 T cells isolated from one healthy donor were activated and transduced by lentiviruses to generate NLRX1-silenced cells as described above. NRG mice (007799, Jackson Laboratory) bred and housed in specific-pathogen-free conditions at 19–23 °C with a 12 hr light–dark cycle were irradiated as previously described24. Mice at 4 to 6 weeks of age were randomly assigned to 4 groups (n = 4 for each uninfected group and n = 5 for each infected group) to control for sex and age effects. On the day of transfusion, 1.0×10⁷ human CD4 T cells transduced with lentiviruses expressing sh-Ctr or sh-NLRX1 in 100 µl PBS were injected into each mouse via the tail vein to generate human CD4 T cell-reconstituted mice (NRG-hu CD4). The day after, each mouse was infected with 1 ng p24 HIV-1 R3A via the retro-orbital route. Blood was collected weekly after infection through the tail, with plasma and cell pellets separated by centrifugation at 5,000 rpm for 5 min and plasma stored at −80°C for further viral RNA extraction. For viral load determination, viral RNA extracted from standard plasma (3443, NIH AIDS Reagent Program) and plasma from each infected mouse (QIAamp viral RNA minikit, Qiagen) was analyzed by reverse transcription-quantitative PCR (RT-qPCR) (TaqMan One-Step RT-qPCR master mix, Applied Biosystems). The primers and probe used here are the same as those used to quantify HIV-1 replication described above. Cell pellets were used to quantify human CD4 T cells. Briefly, red blood cells were lysed using Ammonium-Chloride-Potassium (ACK) lysis buffer (A1049201, Gibco) at room temperature for 5 min. Cells were then resuspended in fluorescence activated cell sorting (FACS) buffer (PBS containing 2% FBS) and stained for cell viability (7-aminoactinomycin D, A1310, Life Technologies) and surface markers, including mouse CD45 (PE-Cy5 conjugated, Clone 30-F11, BioLegend, 1:330), human CD3 (PE conjugated, clone HIT3a, BioLegend, 1:330) and human CD4 (FITC conjugated, RPA-T4, BioLegend, 1:330). After staining, cell populations were analyzed by flow cytometry analysis using the CyAn ADP flow cytometer. Stained cells were counted by using a Guava easyCyte flow cytometer (Millipore). After 3 weeks post-infection (wpi), spleens were isolated following euthanasia, and splenocytes were counted using a Guava easyCyte flow cytometer after staining of live/dead cells.
For in vivo testing of metformin in HIV-1 replication, NRG-hu CD4 mice were administered metformin by drinking water (5 mg/ml) 1-day prior to infection and during the whole infection period. The water bottles containing freshly made metformin solution were changed every 3 or 4 days. Viremia and human CD4 T cell counts were determined as described above.
Immunoprecipitation
Jurkat-sh-Ctr or Jurkat-sh-NLRX1 cells (5 ×10⁷) were washed twice by PBS and then resuspended in 1 ml lysis buffer (50 mM Tris, 150 mM NaCl, 1% Triton X-100, protease inhibitor cocktail, phosphatase inhibitor cocktail, pH 7.4). Cell lysates were rotated at 4°C for 30 min to obtain complete cell lysis, and cell debris was pelleted by centrifugation at 16,000 × g for 30 min at 4°C. Partially cleared lysates (80 µl) were kept for use as the input for immunoblotting. Immunoprecipitation was performed by incubating cell lysates with 10 µg anti-NLRX1 or control mouse IgG1 antibody (5415, Cell Signaling) plus 50 μl protein A/G conjugated agarose beads (53133, ThermoFisher Scientific) for 8 hours, followed by 3 times wash with lysis buffer. The proteins pulled down by antibodies were subjected to immunoblotting with antibodies specific for NLRX1, FASTKD5, PRDX3, and SPNS1. To determine the interaction of NLRX1 and FASTKD5 upon the HIV-1 infection, 1 ×10⁸ Jurkat cells were infected with 100 ng p24 HIV-1 R3A. At 72 hpi, immunoprecipitation and immunoblotting were conducted as described above.
Metabolism assays
Jurkat cells containing various shRNAs were infected with VSV-G-NL4–3-Luc (MOI=3) or left uninfected. For drug treatment, 5 mM metformin was maintained in the cell cultures through the virus infection and metabolic assays; 5 µM resveratrol was added in the cell culture during infection but was removed during metabolic assays. At 24 hpi, each group was plated in quintuplicate in the Seahorse XF24 Cell Culture Microplates (Agilent) (1×10⁶ per well) with 500 µl Seahorse XF base medium (Agilent), 100 mM sodium pyruvate (11360070, Gibco) and 2.5 M glucose (A2494001, Gibco) for OCR measurements, and with 500 µl Seahorse XF base medium with 100 mM sodium pyruvate and 2 mM glutamine (25030081, Gibco) for ECAR measurements for 1 hr in the absence of CO2 at 37°C prior to the start of the metabolism assay. OCR and ECAR were assessed as previously described46. In some experiments, OCR and ECAR were normalized to the basal levels initially recorded. The following parameters were assessed as indices of mitochondrial respiratory function: basal respiration (the difference between basal and rotenone-induced OCR), maximal respiration (the difference between FCCP-induced and rotenone-induced OCR), and reserved respiratory capacity (the difference between maximal and basal respiration). The glycolytic flux activation was determined by the levels of glycolysis (ECAR in response to glucose), glycolytic capacity (maximal ECAR following oligomycin exposure), and glycolytic reserve (the difference between 2-DG-induced and oligomycin-induced ECAR).
Quantitative proteomics analysis
Stable Isotope Labeling by Amino Acids in Cell Culture (SILAC)-based quantitative proteomics has been previously described47. Five million SILAC-labeled Jurkat-sh-Ctr or Jurkat-sh-NLRX1 cells were infected with VSV-G-NL4–3-Luc (MOI=5) or left uninfected. At 24 hpi, cells were harvested and subjected to mass spectrometry. For Tandem Mass Tag (TMT)-based quantitative proteomics, 5×10⁶ Jurkat cells expressing sh-FASTKD5 or the control cells were infected with VSV-G-NL4–3-Luc (MOI=5) or left uninfected. At 24 hpi, cells were harvested and cell pellets were resuspended in 8M Urea, 50mM Tris-HCl pH8.0, reduced with 5 mM dithiothreitol for 30 min at room temperature, and alkylated with 15 mM iodoacetamide for 45min in the dark at room temperature. Samples were diluted 4-fold with 25 mM Tris-HCl pH8.0, 1 mM CaCl2, and digested with trypsin at 1:100 (w/w, trypsin : protein) ratio overnight at room temperature. Peptides were desalted on homemade C18 stagetips. 100 µg of each peptide sample was labeled with TMT11plex Isobaric Label Reagent (A34808, Thermo Fisher Scientific) following the optimal protocol48. The mixture of labeled peptides was desalted and fractionated into 24 fractions in 10 mM trimethylammonium bicarbonate (TMAB) buffer containing 5–40% acetonitrile. For mass spectrometry analysis, dried peptides were dissolved in 0.1% formic acid, 2% acetonitrile. For global profiling samples, peptide concentration was measured with Pierce™ Quantitative Colorimetric Peptide Assay (23275, Thermo Fisher Scientific). 0.5 μg of each fraction was analyzed on a Q-Exactive HF-X coupled with an Easy nanoLC 1200 (Thermo Fisher Scientific). Peptides were loaded on to a nanoEase MZ HSS T3 Column (100Å, 1.8 µm, 75 µm x 150 mm, Waters). Analytical separation of all peptides was achieved with a 100-min gradient. A linear gradient of 5 to 10% buffer B over 5 min, 10% to 31% buffer B over 70 min, and 31% to 75% buffer B over 15 minutes was executed at a 300 nl/min flow rate followed a ramp to 100%B in 1 min and 9-min wash with 100%B, where buffer A was aqueous 0.1% formic acid, and buffer B was 80% acetonitrile and 0.1% formic acid. LC-MS experiments were also carried out in a data-dependent mode with full MS (externally calibrated to a mass accuracy of < 5 ppm and a resolution of 120,000 for TMT-labeled samples at m/z 200) followed by high energy collision-activated dissociation-MS/MS with a resolution of 45,000 for TMT-labeled global samples at m/z 200. High energy collision-activated dissociation-MS/MS was used to dissociate peptides at a normalized collision energy of 32 eV (for TMT-labeled sample) in the presence of nitrogen bath gas atoms. Dynamic exclusion was 45 or 20 seconds. For raw proteomics data processing and analysis, mass spectra were processed, and peptide identification was performed using the MaxQuant software version 1.6.10.43 (Max Planck Institute, Germany). All protein database searches were performed against the UniProt human protein sequence database (UP000005640). A false discovery rate (FDR) for both peptide-spectrum match (PSM) and protein assignment was set at 1%. Search parameters included up to two missed cleavages at Lys/Arg on the sequence, oxidation of methionine, and protein N-terminal acetylation as a dynamic modification. Carbamidomethylation of cysteine residues was considered as a static modification. Peptide identification was perforned by filtering reverse and contaminant entries and assigning them to their leading razor protein. The TMT reporter intensity found in MaxQuant was for quantitation. Data processing and statistical analysis were performed on Perseus (Version 1.6.10.50). Protein quantitation was performed using TMT reporter intensity, and a two-sample t-test statistics on two biological replicates was used with a p-value of 5% to report statistically significant protein abundance fold-changes. Functional analysis was performed by Ingenuity Pathway Analysis (Qiagen), ReactomeFIplugin in Cytoscape, and Metascape. Heatmap was generated by Morpheus. The Venn diagram was generated through https://www.meta-chart.com.
Analysis of RV217 transcriptome data
For microarray analysis, the LIMMA package was used to fit a linear model and calculate the association of gene expression to the magnitude of set-point viremia49. For pathway analysis, Gene Set Enrichment Analysis (GSEA) using the KEGG database was performed to identify pathways associated set-point viral load or NLRX1 expression50. GSEA is a statistical method to determine whether members of a particular gene set preferentially occur toward the top or bottom of a ranked-ordered gene list where genes are ranked by the strength of their association with the outcome of interest (set-point viral load). More specifically, GSEA calculates a normalized enrichment score (NES) that reflects the degree to which a set of genes is overrepresented among genes differentially expressed along with set-point viral load. The significance of an observed NES was obtained by permutation testing: re-sorting the gene list to determine how often an observed NES occurs by chance. An analysis for the association of gene expression to NLRX1 expression level was also performed by LIMMA package and GSEA similar to the above description. Leading Edge analysis was performed to examine the particular genes of a gene-set contributing the most to the enrichment. For Network Mapping/Visualization, GeneMANIA Networks (Genemania.org) and were plotted to represent co-expression of leading edge genes of the OXPHOS pathway51. The overlap between the genes included in the networks and Gene Ontology (GO) biological process was assessed using a Fisher exact test. Gene Mania is a flexible, user-friendly web interface for generating hypotheses about gene function, analyzing gene lists, and prioritizing genes for functional assays. Given a query list, GeneMANIA extends the list with functionally similar genes that it identifies using available genomics and proteomics data. GeneMANIA also reports weights that indicate the predictive value of each selected data set for the query. The Cytoscape (cytoscape.org) plugin was used to plot the networks. An alternative network for leading edge genes of the OXPHOS pathway was generated by ClueGO or STRING v11.
Statistical Analysis
Statistical significance was assessed by unpaired Student’s t-test or analysis of variance (ANOVA) followed by Dunnett’s, Sidak’s, or Tukey’s multiple comparisons test in GraphPad Prism 8.4.3 software or Wilcoxon rank-sum test or Pearson correlation. In all tests, P values were shown in the figures.
Reporting Summary
Further information on research design is available in the Nature Research Reporting Summary linked to this article.
Extended Data
Extended Data Fig. 1. The network of leading edge genes in the OXPHOS pathway associated with set point viral load.
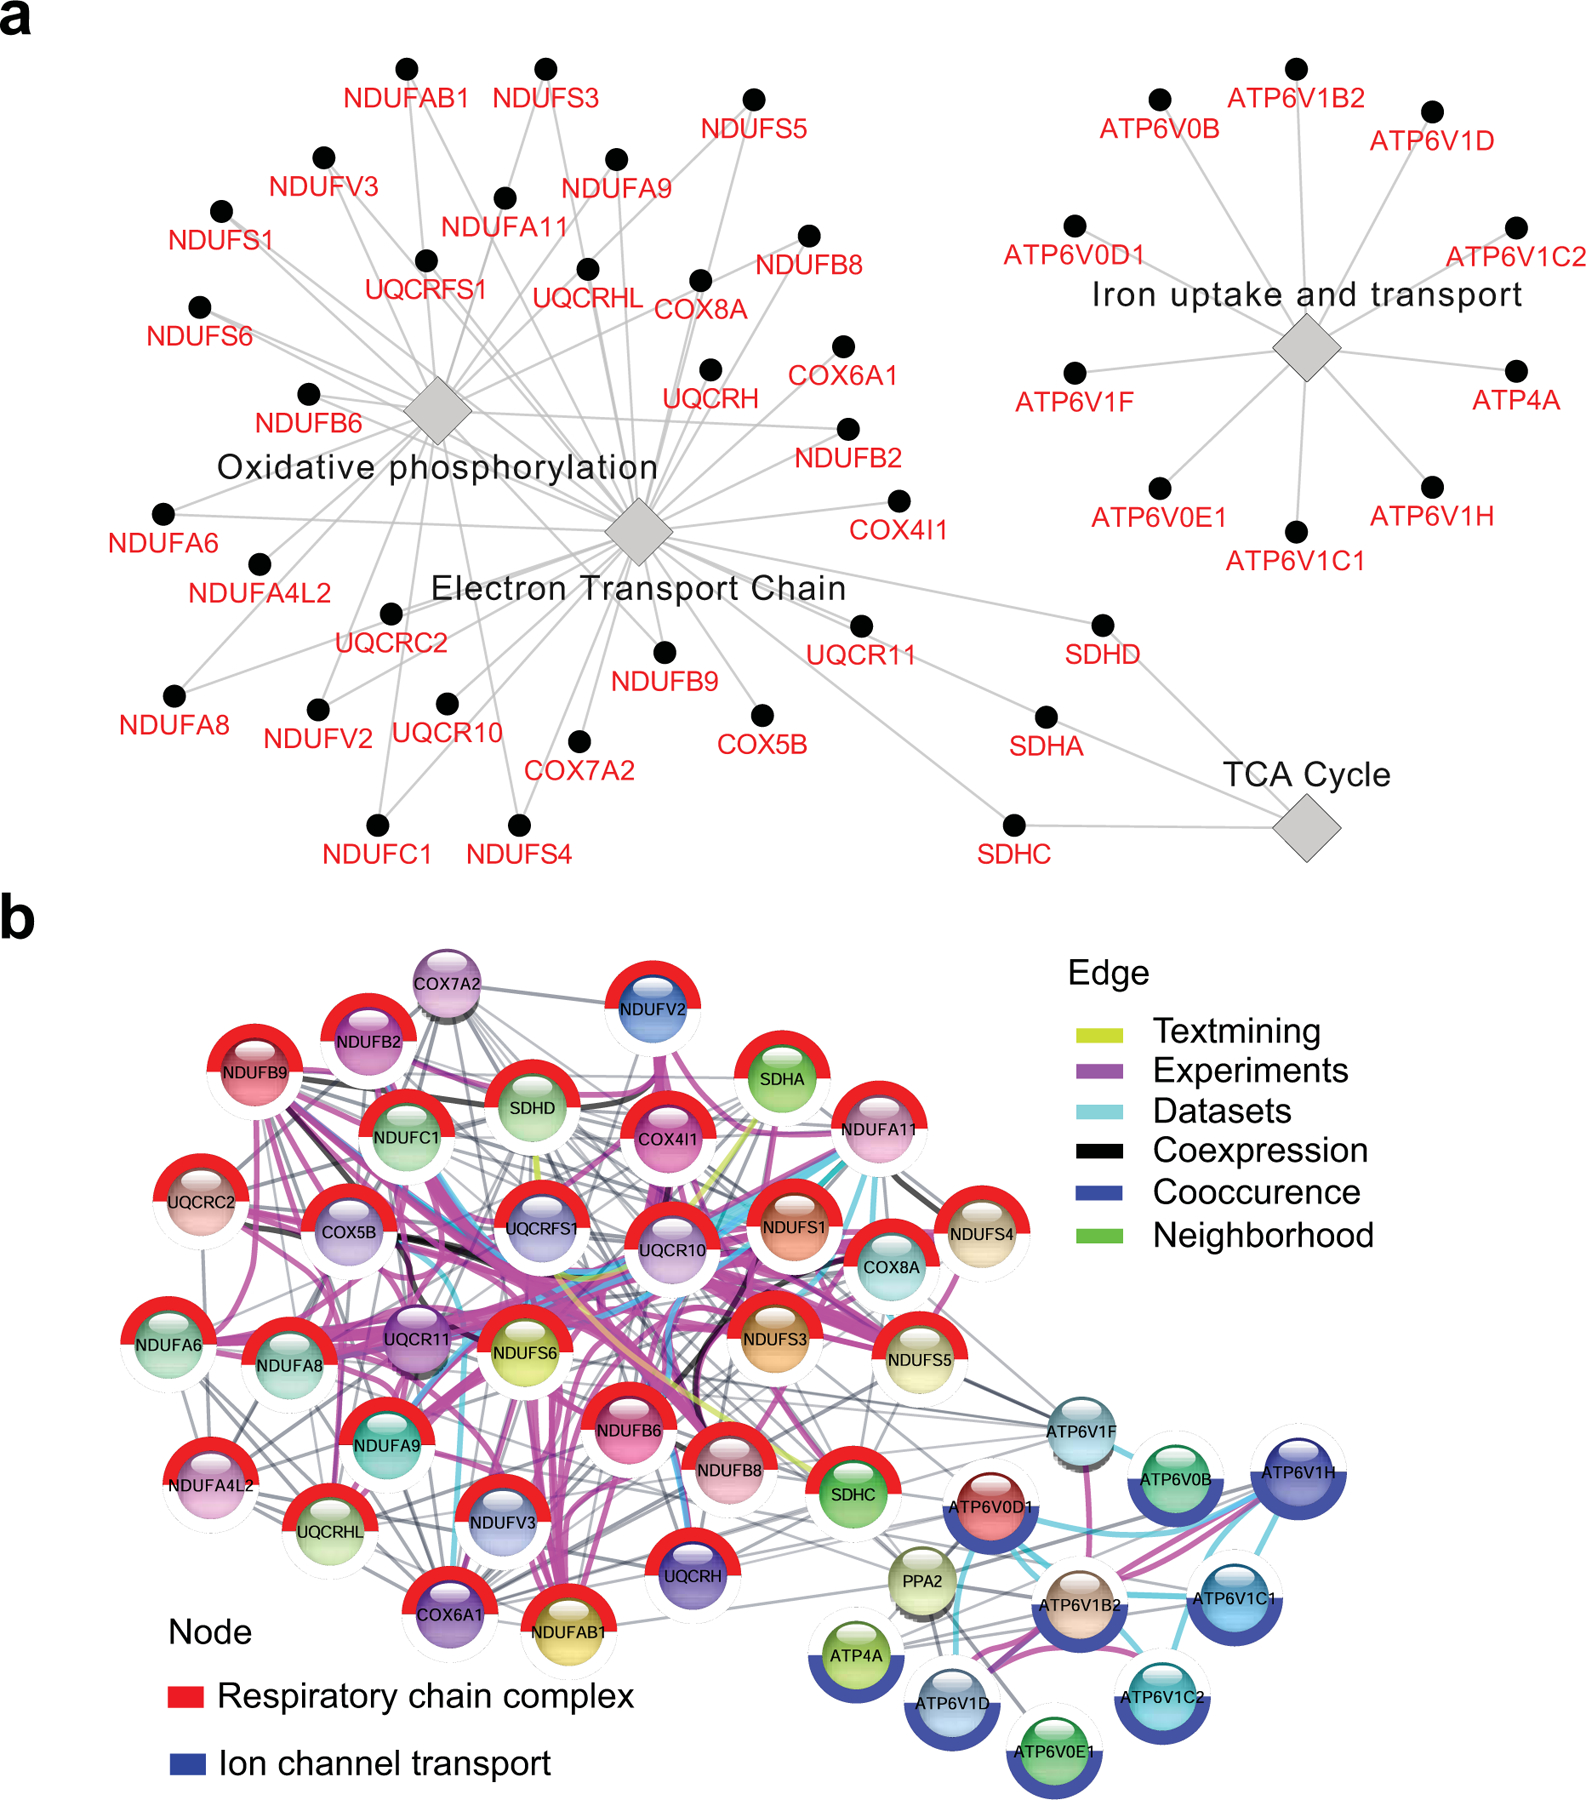
a. Cytoscape was used to plot a network highlighting the top genes contributing to enrichment. The ClueGO app was used to infer network connections. Nodes represent genes, and edges reflect the association between these genes.
b. STRING was used to plot a network highlighting the top genes contributing to enrichment. Nodes represent genes, and edges reflect the association between these genes.
Extended Data Fig. 2. Metabolic inhibitors suppress HIV-1 replication in CD4 T cells and NRG-hu CD4 mice.
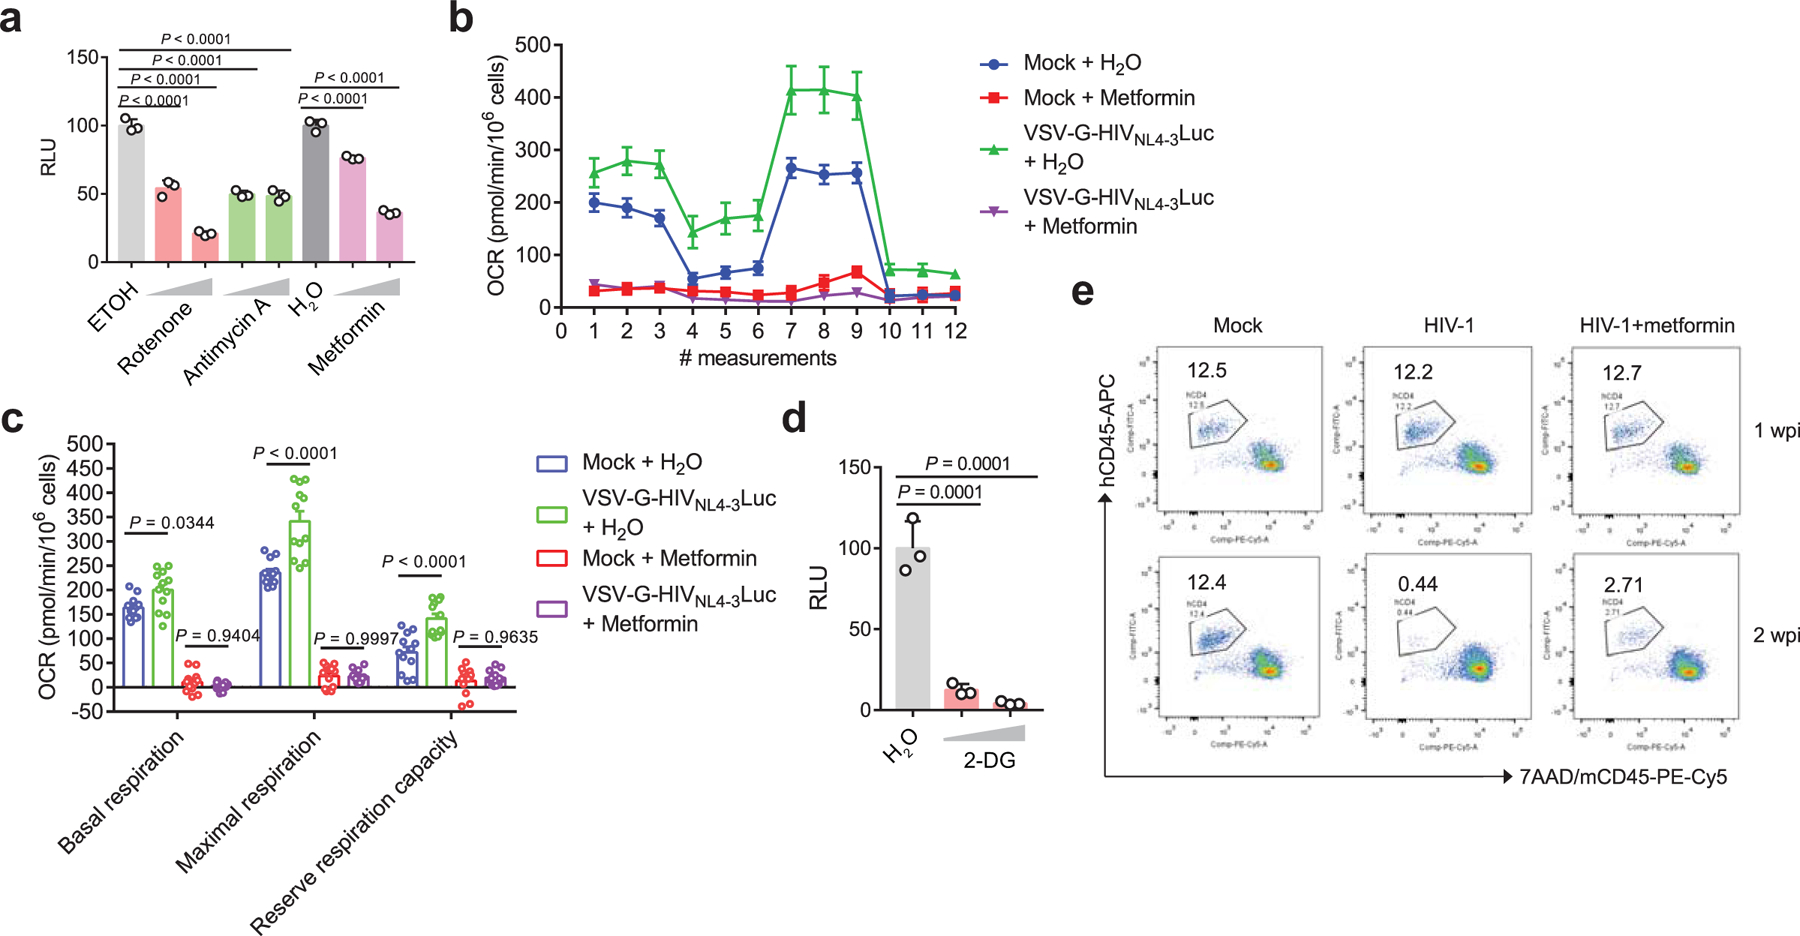
a. The effect of OXPHOS inhibitors on virus replication in VSV-G-NL4–3-Luc-infected Jurkat cells. Rotenone (0.2 µM or 1 µM), metformin (1 mM or 5 mM, mitochondrial complex I inhibitor) and antimycin A (0.2 µM or 1 µM, mitochondrial complex III inhibitor). Ethanol is the vehicle control for rotenone and antimycin A, and sterile water is the vehicle control for metformin. n = 3 cell cultures per experiment.
b. The oxygen consumption rate (OCR) was measured in Jurkat cells infected with VSV-G-NL4–3-Luc or left uninfected (mock) in the presence of metformin or the vehicle control (H2O). n = 4 cell cultures per experiment.
c. The basal and maximal OCR and reserved respiratory capacity of Jurkat cells infected with VSV-G-NL4–3-Luc or left uninfected (mock) in the presence of metformin or vehicle control (H2O). n = 12 cell cultures per experiment.
d. The effect of 2-DG (5 mM or 10 mM), a glycolysis inhibitor, on virus replication in VSV-G-NL4–3-Luc infected Jurkat cells. H2O was used as vehicle control. n = 3 cell cultures per experiment.
e. Representative FACS plots of human CD4 T cells from peripheral blood stained with the indicated markers. Cells were obtained from mock or HIV-1 R3A infected NRG-hu CD4 mice with or without metformin treatment.
Data are representative of three independent experiments shown as the mean ± s.e.m. Statistical significance was tested by one-way ANOVA (a, d) or two-way ANOVA followed by Tukey’s multiple comparisons test (c).
Extended Data Fig. 3. NLRX1 is upregulated in HIV-1 infected CD4 T cells.
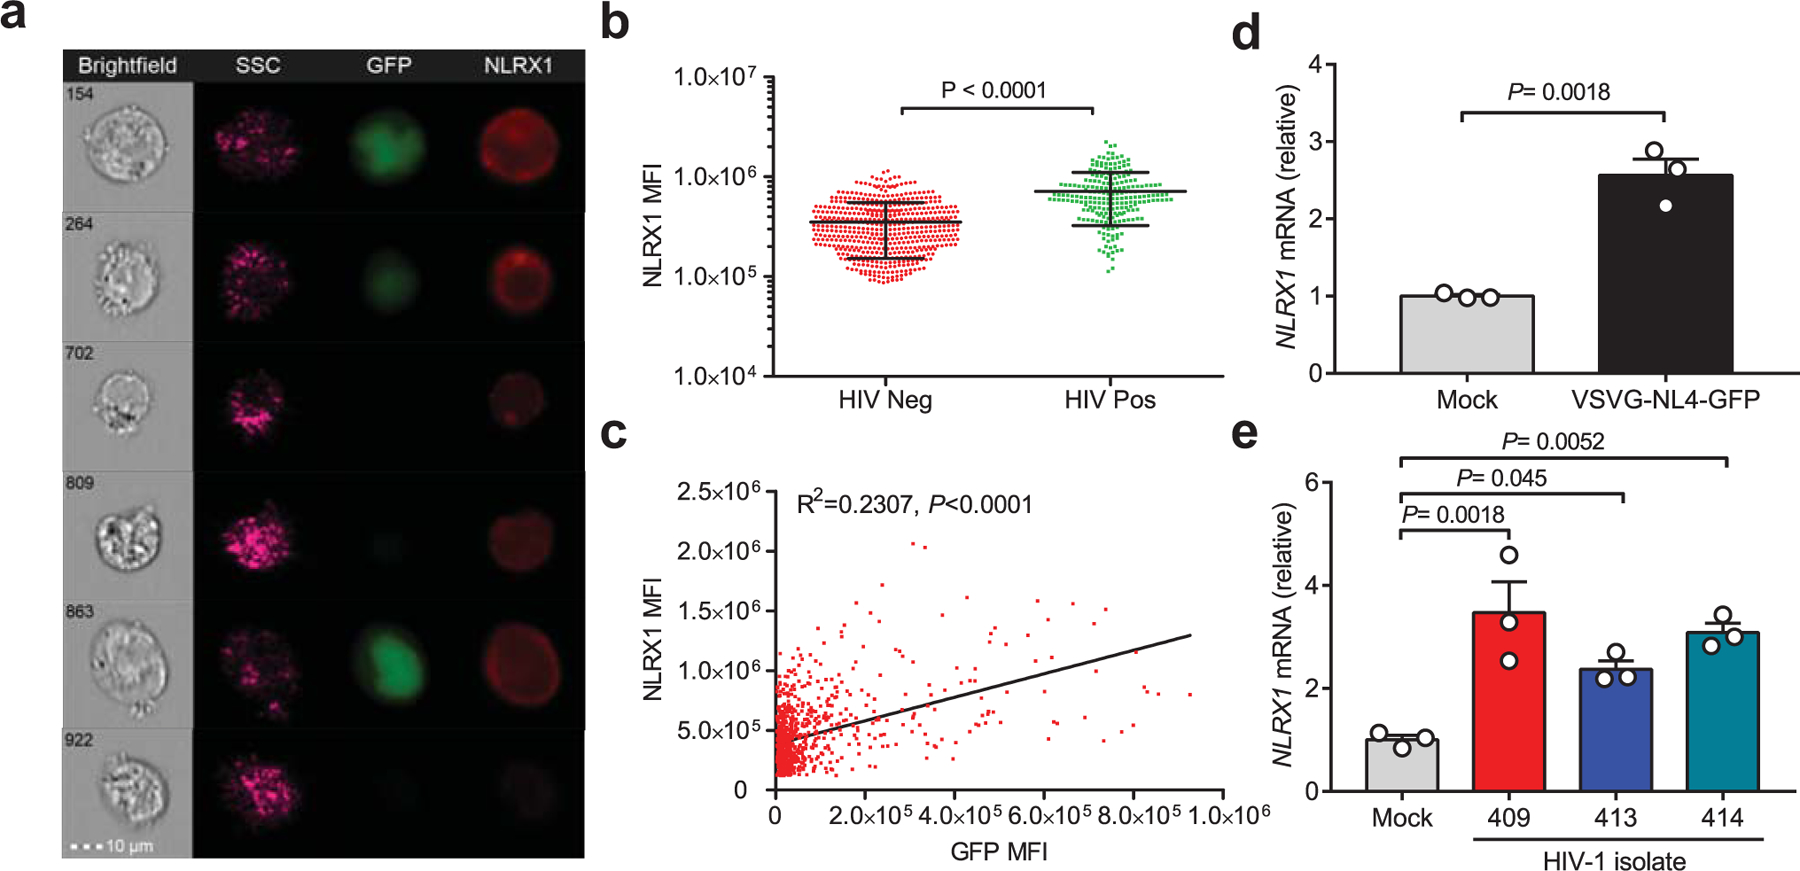
a. Jurkat cells were infected with VSV-G-pseudotyped HIV NL4–3-EGFP virus (MOI = 0.5). After 48 hours post-infection (hpi), cells were stained with an anti-NLRX1 antibody and subjected to ImageStreamX MkII imaging flow cytometry. GFP positive cells indicate HIV-1 infection.
b. The mean fluorescence intensity (MFI) of NLRX1 staining in GFP negative (n = 532 cells) and positive cells (n = 222 cells). P value was calculated by two-tailed unpaired Student’s t-test.
c. The linear relationship between the expression of NLRX1 and GFP. R, Pearson’s correlation coefficient; Correlation is significant at P < 0.0001.
d. Jurkat cells were infected by VSV-G-NL4–3-EGFP pseudovirus (MOI = 1). At 48 hpi, NLRX1 transcripts were assessed by qPCR. n = 3 cell cultures per experiment. P value was calculated by two-tailed unpaired Student’s t-test.
e. NLRX1 transcripts were assessed in human primary CD4 T cells infected by three different HIV-1 clinical isolates at 48 hpi by qPCR. n = 3 cell cultures per experiment. Significance was tested by one-way ANOVA followed by Dunnett’s multiple comparisons test.
All data are representative of three independent experiments. Error bar is s.e.m.
Extended Data Fig. 4. The effect of metformin on NLRX1 expression in CD4 T cells.
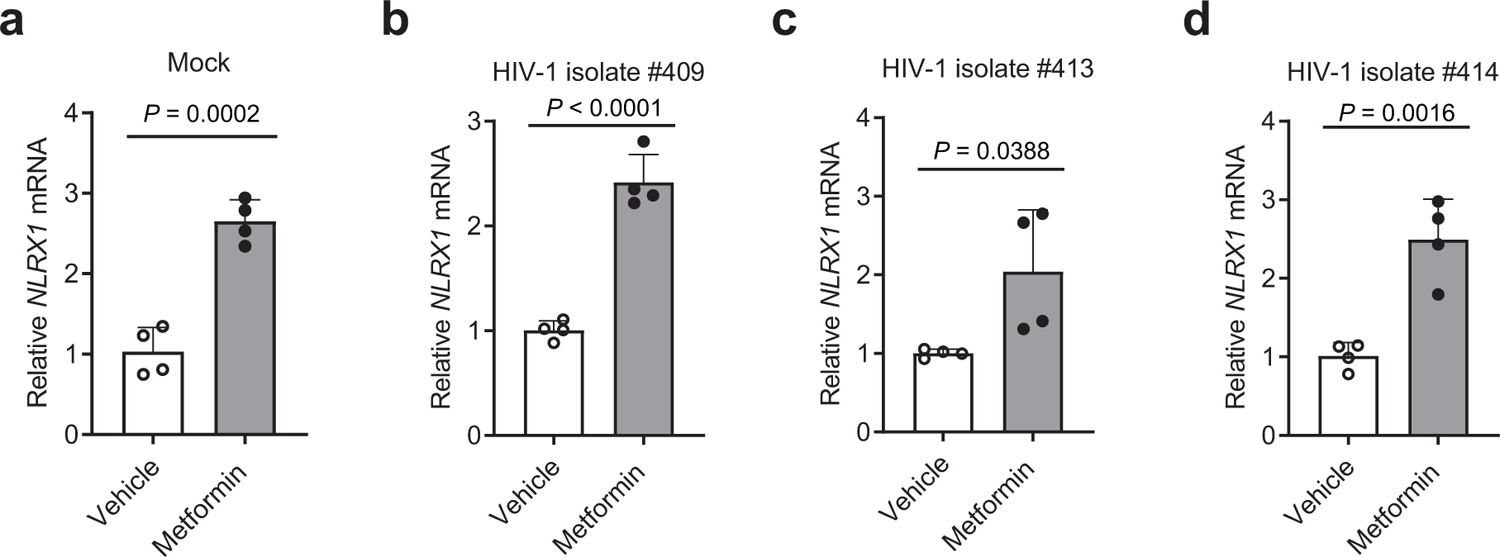
a–d. CD3/CD28 antibody-activated human primary CD4 T cells were left uninfected (a) or infected by three different HIV-1 clinical isolates, #409 (b), #413 (c), and #414 (d) in the presence of 5 mM metformin or the vehicle control, sterile water. NLRX1 transcripts were assessed at 48 hpi by qPCR.
Representative data of three independent experiments are shown as the mean ± standard deviation (s.d). n = 4 cell cultures per experiment. Statistical significance was tested by two-tailed unpaired Student’s t-test.
Extended Data Fig. 5. Silencing NLRX1 protects HIV-1 caused human CD4 T cell depletion in the NRG-hu CD4 mouse model.
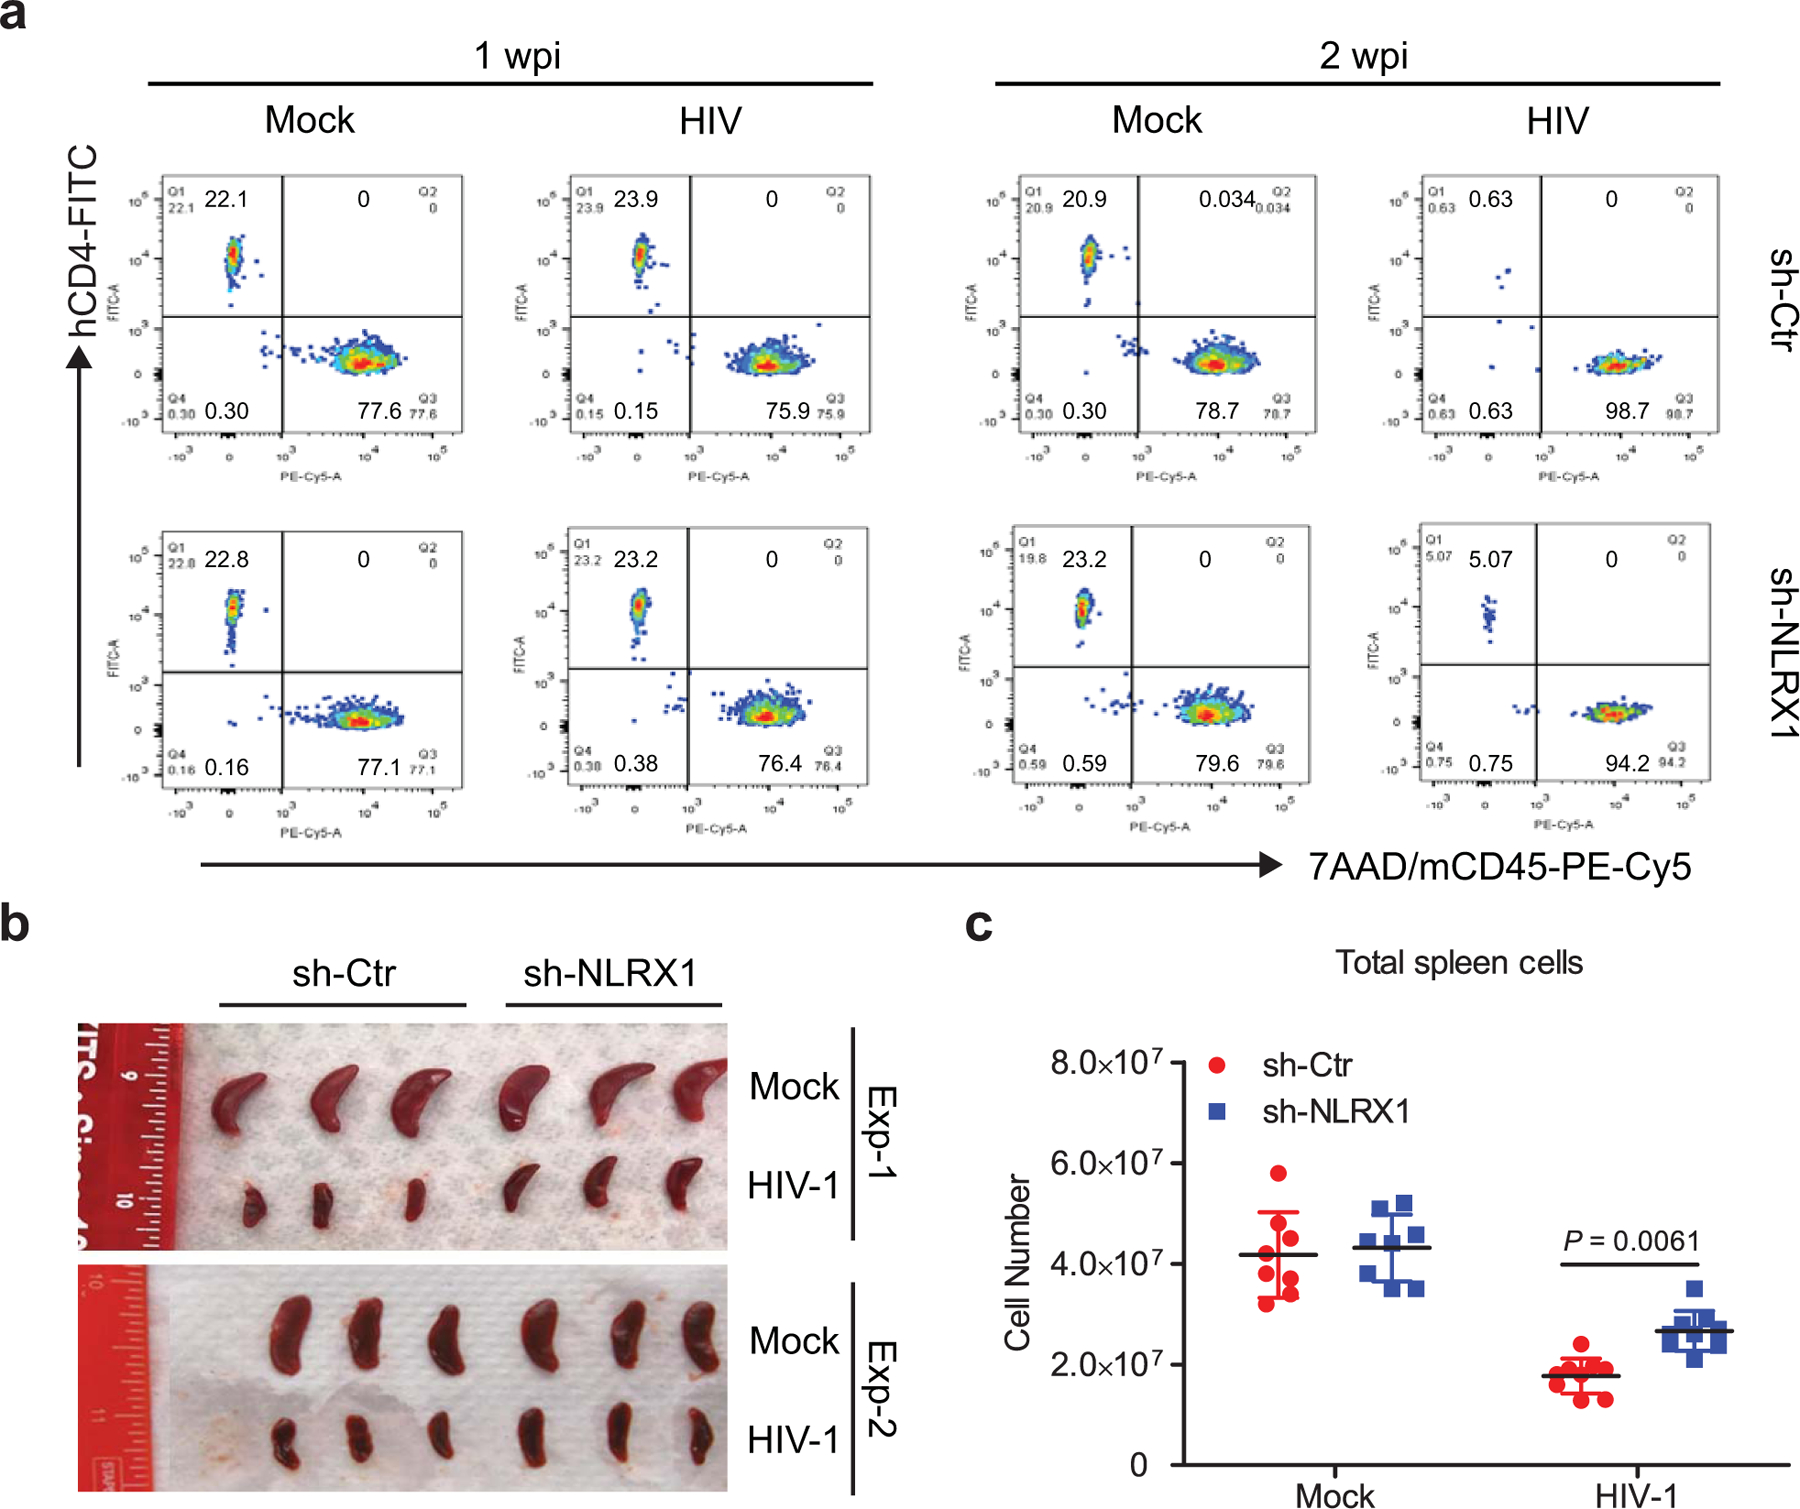
a. Representative fluorescence-activated cell sorting (FACS) plot of human CD4 T cells expressing the indicated markers in peripheral blood from mock or HIV-1 R3A infected NRG-hu CD4 mice at 1 and 2 wpi.
b. Spleens from mock or HIV-1 R3A infected NRG-hu CD4 mice at 3 wpi. n = 6 mice per group.
c. Splenocyte numbers of mock or HIV-1 R3A infected NRG-hu CD4 mice at 3 wpi. The data are a pool of two independent experiments. n = 8 mice for mock groups; n = 9 mice for HIV-1 infection groups. Data are presented as the mean ± s.e.m. Statistical significance was tested by two-way ANOVA followed by Sidak’s multiple comparisons test.
Extended Data Fig. 6. NLRX1 promotion of HIV-1 replication in CD4 T cells is independent of IFN-I, autophagy, or ER stress.
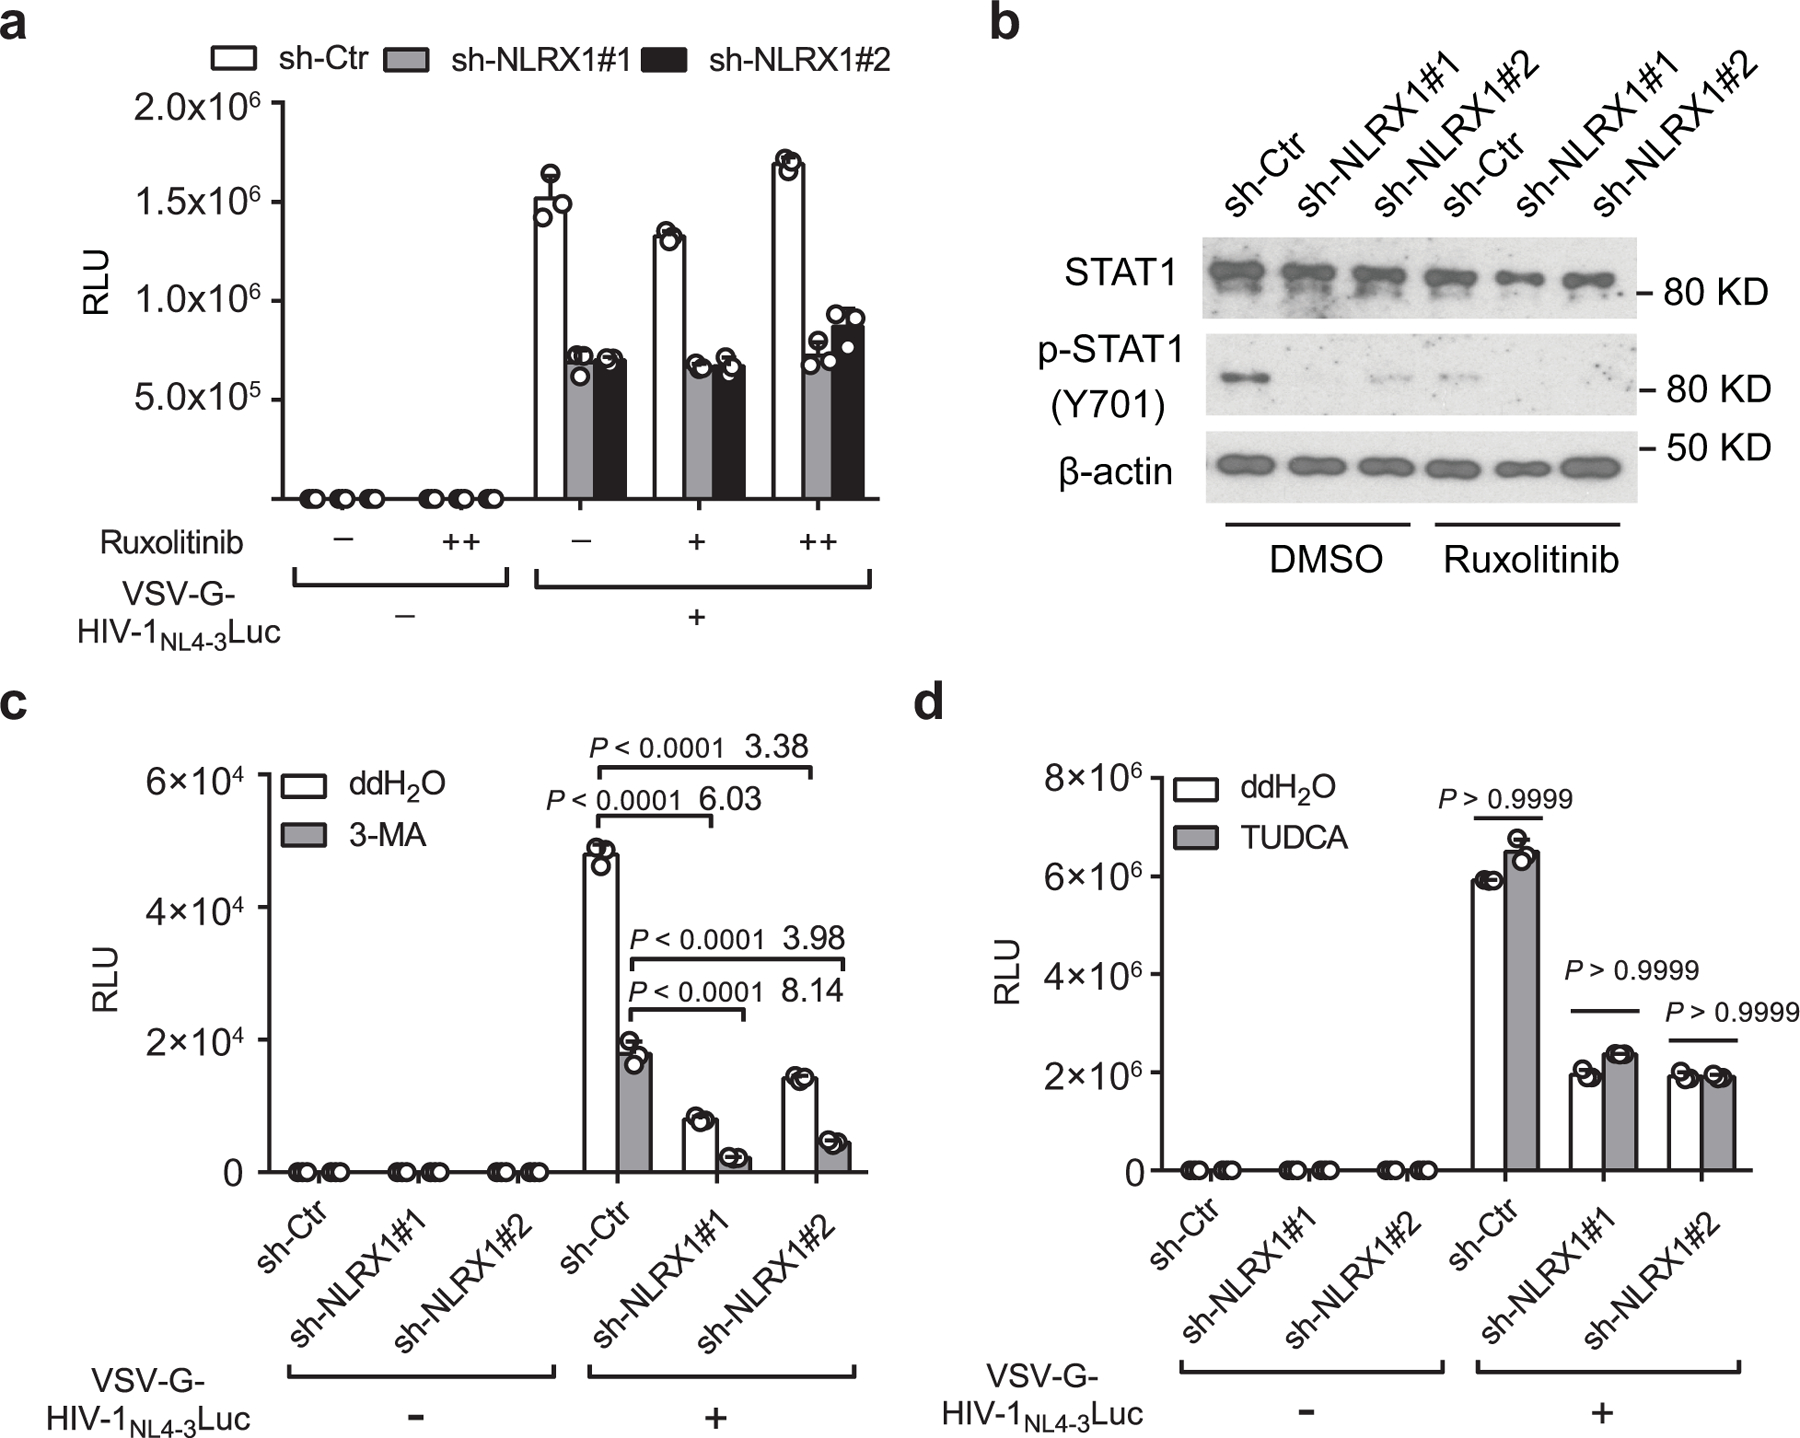
a. RLU in Jurkat sh-Ctr or sh-NLRX1 cells infected with VSV-G-NL4–3-Luc (MOI=1) or left uninfected in the presence or absence of JAK1/2 inhibitor Ruxolitinib at 24 hpi. n = 3 cell cultures per experiment.
b. Ruxolitinib suppressed VSV-G-NL4–3-Luc infection-induced phosphorylation of STAT1 at 24 hpi. β-actin was used as the loading control.
c. Similar to a except for using autophagy inhibitor 3-Methyladenine (3-MA) to treat cells. Numbers on top of the bar are the fold differences. n = 3 cell cultures per experiment.
d. Similar to a except for using ER stress inhibitor sodium tauroursodeoxycholate (TUDCA) to treat cells. Luciferase activities were determined at 48 hpi. n = 3 cell cultures per experiment.
Representative data of three independent experiments are presented as the mean ± s.e.m. Two-way ANOVA followed by Sidak’s multiple comparisons test.
Extended Data Fig. 7. Expression of FASTKD5 in Jurkat cells and primary human CD4 T cells.
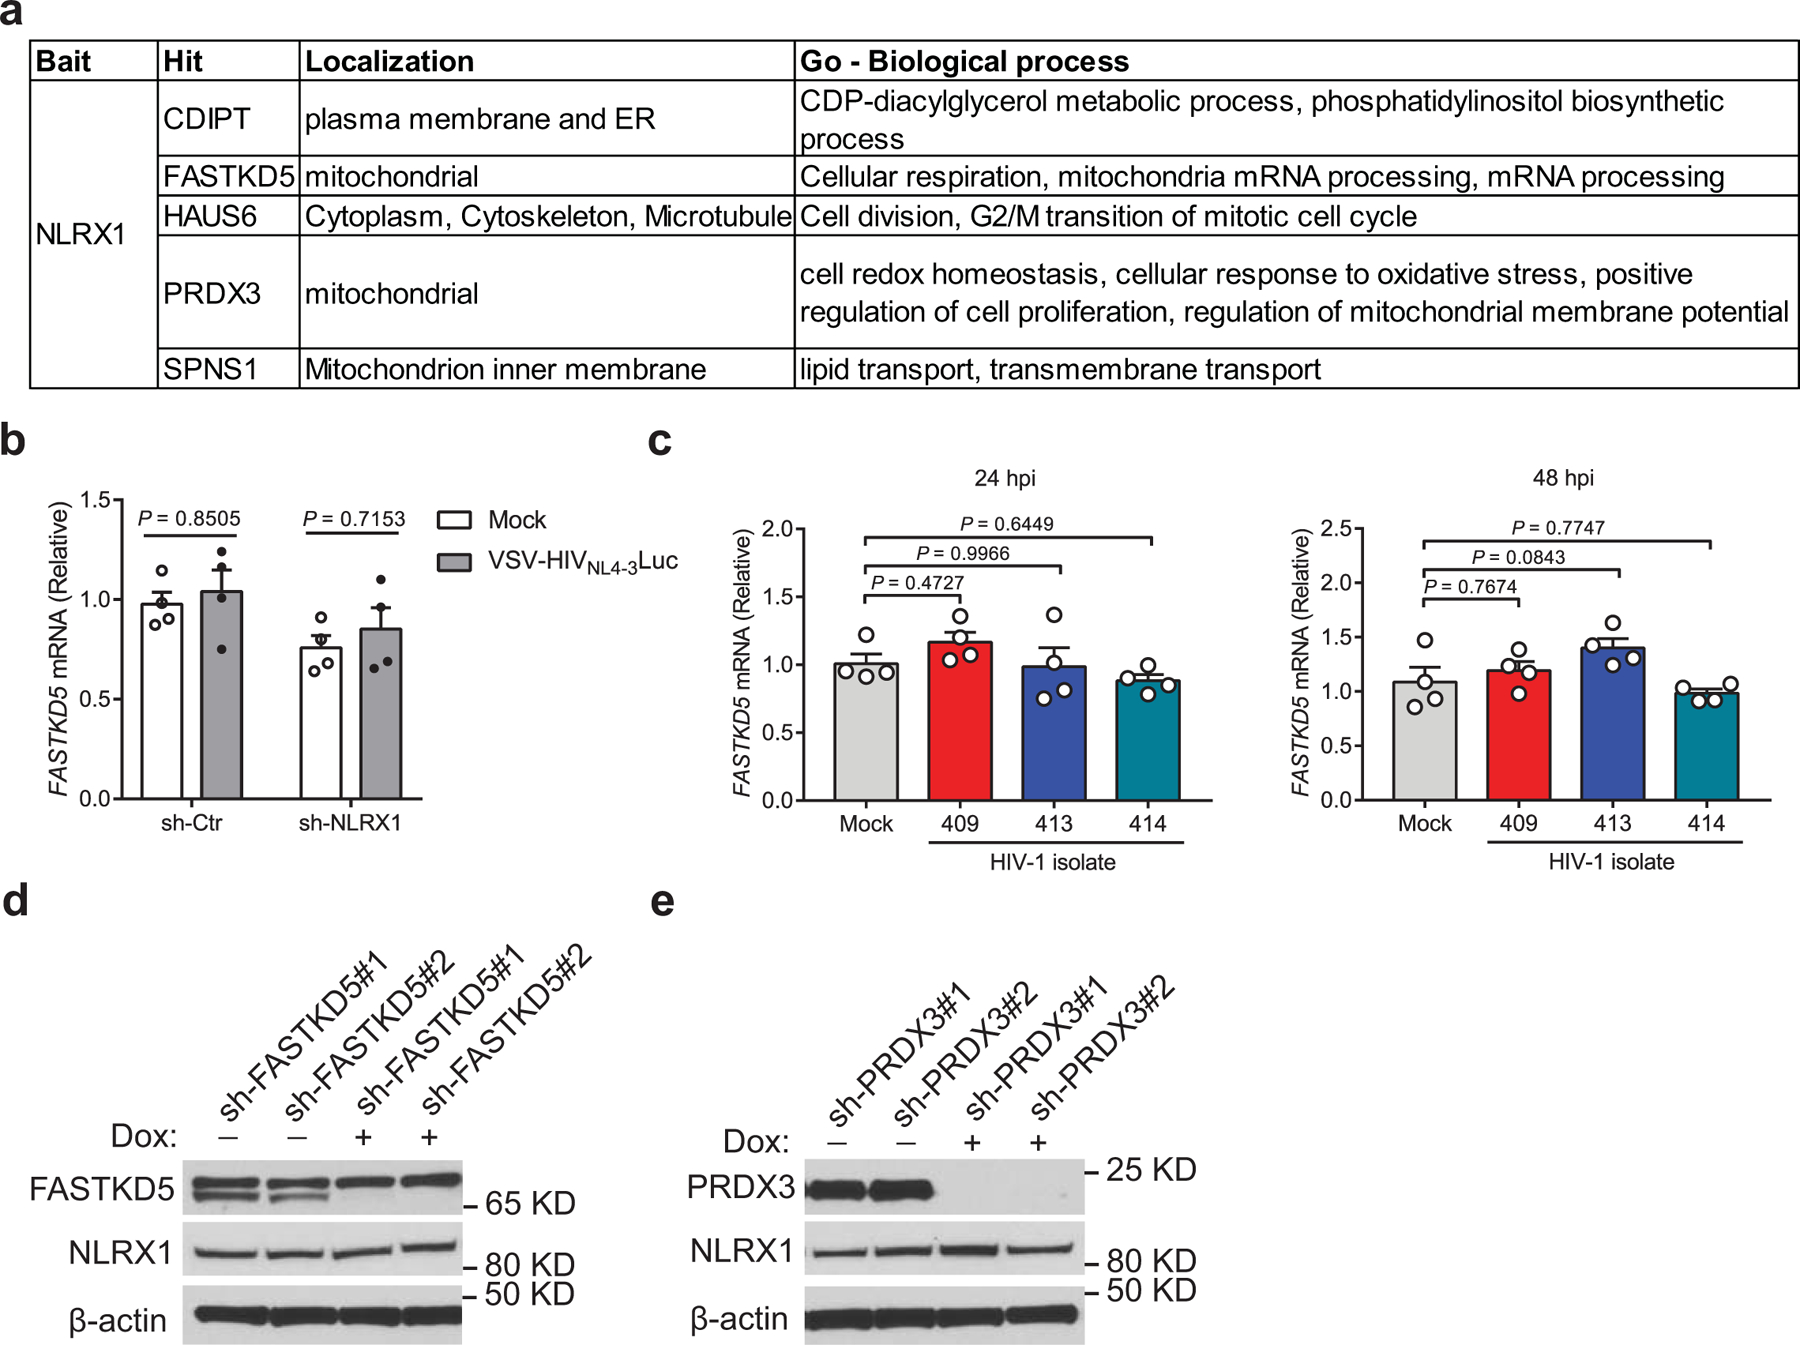
a. Candidates of NLRX1 interacting proteins identified by immunoprecipitation (IP)-mass spectrometry (MS) using overexpressed NLRX1 as the bait in a previous publication.
b. Jurkat-sh-Ctr and Jurkat-sh-NLRX1 cells were left uninfected (mock) or infected by VSV-G-NL4–3-Luc pseudovirus (MOI = 1). FASTKD5 transcripts were assessed at 24 hpi by qPCR. Data are shown as the mean ± s.e.m. n = 4 cell cultures per experiment. Statistical significance was tested by two-way ANOVA followed by Sidak’s multiple comparisons test.
c. CD3/CD28 antibody-activated human primary CD4 T cells were infected by three different HIV-1 clinical isolates (10 ng p24), and FASTKD5 transcripts were assessed at 24 and 48 hpi by qPCR. Data are shown as the mean ± s.e.m. n = 4 cell cultures per experiment. Statistical significance was tested by one-way ANOVA followed by Dunnett’s multiple comparisons test.
d, e. Doxycycline-induced silencing of FASTKD5 (d) and PRDX3 (e) in Jurkat cells transduced by 2 different shRNA containing lentiviruses. β-actin was used as the loading control.
Data (b – e) are representative of three independent experiments.
Supplementary Material
ACKNOWLEDGMENT
We thank the UNC Flow Cytometry Core Facility supported in part by P30 CA016086 Cancer Center Core Support Grant to the UNC Lineberger Comprehensive Cancer Center, for assistance with flow cytometry. We thank Dr. Sumit K. Chanda at Sanford Burnham Prebys Medical Discovery Institute for providing the pNL4–3.EGFP.E- construct. This work was supported by the NIH grants R01-AI029564 (J.P.-Y.T.), U19AI109965 (J.P.-Y.T.), AI127346 (L.S.), and DK119937 (L.S.); and UNC CFAR Award P30 AI50410 (H.G.). The RV217 study was supported by a cooperative agreement (W81XWH-18–2-0040) between the Henry M. Jackson Foundation for the Advancement of Military Medicine, Inc., and the U.S. Department of Defense (DOD).
Footnotes
COMPETING INTERESTS
The authors declare no competing interests. The views expressed are those of the authors and should not be construed to represent the positions of the U.S. Army, the Department of Defense, or Henry M. Jackson Foundation.
DATA AVALAIBILITY
The authors declare that the data supporting the findings of this study are available with the paper and its supplementary information files. Source data for all figures are provided with the paper. The RV217 CD4 T cell transcriptome data have been uploaded to the Gene Expression Omnibus (accession number: GSE165841). The mass spectrometry proteomics data have been deposited to the ProteomeXchange with identifier PXD023565. The public databases used include UniProt human protein sequence database: https://www.uniprot.org/proteomes/UP000005640; KEGG PATHWAY Database: https://www.genome.jp/kegg/pathway.html; HALLMARK Gene Set: https://www.gsea-msigdb.org/gsea/msigdb/genesets.jsp?collection=H; Reactome Pathway Database: https://reactome.org/.
REFERENCES
- 1.Gaardbo JC, Hartling HJ, Gerstoft J & Nielsen SD Incomplete immune recovery in HIV infection: mechanisms, relevance for clinical care, and possible solutions. Clinical & developmental immunology 2012, 670957 (2012). [DOI] [PMC free article] [PubMed] [Google Scholar]
- 2.Palmer CS et al. Increased glucose metabolic activity is associated with CD4+ T-cell activation and depletion during chronic HIV infection. AIDS 28, 297–309 (2014). [DOI] [PMC free article] [PubMed] [Google Scholar]
- 3.Palmer CS, Palchaudhuri R, Albargy H, Abdel-Mohsen M & Crowe SM Exploiting immune cell metabolic machinery for functional HIV cure and the prevention of inflammaging. F1000Research 7, 125 (2018). [DOI] [PMC free article] [PubMed] [Google Scholar]
- 4.Dagenais-Lussier X et al. Current topics in HIV-1 pathogenesis: The emergence of deregulated immuno-metabolism in HIV-infected subjects. Cytokine & growth factor reviews 26, 603–613 (2015). [DOI] [PubMed] [Google Scholar]
- 5.Gerriets VA & Rathmell JC Metabolic pathways in T cell fate and function. Trends in immunology 33, 168–173 (2012). [DOI] [PMC free article] [PubMed] [Google Scholar]
- 6.Valle-Casuso JC et al. Cellular Metabolism Is a Major Determinant of HIV-1 Reservoir Seeding in CD4(+) T Cells and Offers an Opportunity to Tackle Infection. Cell metabolism 29, 611–626 e615 (2019). [DOI] [PubMed] [Google Scholar]
- 7.Palmer CS et al. Glucose transporter 1-expressing proinflammatory monocytes are elevated in combination antiretroviral therapy-treated and untreated HIV+ subjects. J Immunol 193, 5595–5603 (2014). [DOI] [PubMed] [Google Scholar]
- 8.Korencak M et al. Effect of HIV infection and antiretroviral therapy on immune cellular functions. JCI insight 4 (2019). [DOI] [PMC free article] [PubMed] [Google Scholar]
- 9.Xia X et al. NLRX1 negatively regulates TLR-induced NF-kappaB signaling by targeting TRAF6 and IKK. Immunity 34, 843–853 (2011). [DOI] [PMC free article] [PubMed] [Google Scholar]
- 10.Moore CB et al. NLRX1 is a regulator of mitochondrial antiviral immunity. Nature 451, 573–577 (2008). [DOI] [PubMed] [Google Scholar]
- 11.Allen IC et al. NLRX1 protein attenuates inflammatory responses to infection by interfering with the RIG-I-MAVS and TRAF6-NF-kappaB signaling pathways. Immunity 34, 854–865 (2011). [DOI] [PMC free article] [PubMed] [Google Scholar]
- 12.Koblansky AA et al. The Innate Immune Receptor NLRX1 Functions as a Tumor Suppressor by Reducing Colon Tumorigenesis and Key Tumor-Promoting Signals. Cell reports 14, 2562–2575 (2016). [DOI] [PMC free article] [PubMed] [Google Scholar]
- 13.Stokman G et al. NLRX1 dampens oxidative stress and apoptosis in tissue injury via control of mitochondrial activity. The Journal of experimental medicine 214, 2405–2420 (2017). [DOI] [PMC free article] [PubMed] [Google Scholar]
- 14.Guo H et al. NLRX1 Sequesters STING to Negatively Regulate the Interferon Response, Thereby Facilitating the Replication of HIV-1 and DNA Viruses. Cell host & microbe 19, 515–528 (2016). [DOI] [PMC free article] [PubMed] [Google Scholar]
- 15.Barouch DH et al. Rapid Inflammasome Activation following Mucosal SIV Infection of Rhesus Monkeys. Cell 165, 656–667 (2016). [DOI] [PMC free article] [PubMed] [Google Scholar]
- 16.Chan EY et al. Dynamic host energetics and cytoskeletal proteomes in human immunodeficiency virus type 1-infected human primary CD4 cells: analysis by multiplexed label-free mass spectrometry. Journal of virology 83, 9283–9295 (2009). [DOI] [PMC free article] [PubMed] [Google Scholar]
- 17.Ringrose JH, Jeeninga RE, Berkhout B & Speijer D Proteomic studies reveal coordinated changes in T-cell expression patterns upon infection with human immunodeficiency virus type 1. Journal of virology 82, 4320–4330 (2008). [DOI] [PMC free article] [PubMed] [Google Scholar]
- 18.Stanley TL & Grinspoon SK Body composition and metabolic changes in HIV-infected patients. The Journal of infectious diseases 205 Suppl 3, S383–390 (2012). [DOI] [PMC free article] [PubMed] [Google Scholar]
- 19.Valle-Casuso JC et al. Cellular Metabolism Is a Major Determinant of HIV-1 Reservoir Seeding in CD4(+) T Cells and Offers an Opportunity to Tackle Infection. Cell metabolism (2018). [DOI] [PubMed]
- 20.Robb ML et al. Prospective Study of Acute HIV-1 Infection in Adults in East Africa and Thailand. The New England journal of medicine 374, 2120–2130 (2016). [DOI] [PMC free article] [PubMed] [Google Scholar]
- 21.Mellors JW et al. Prognosis in HIV-1 infection predicted by the quantity of virus in plasma. Science 272, 1167–1170 (1996). [DOI] [PubMed] [Google Scholar]
- 22.Kelley CF, Barbour JD & Hecht FM The relation between symptoms, viral load, and viral load set point in primary HIV infection. J Acquir Immune Defic Syndr 45, 445–448 (2007). [DOI] [PubMed] [Google Scholar]
- 23.Wheaton WW et al. Metformin inhibits mitochondrial complex I of cancer cells to reduce tumorigenesis. eLife 3, e02242 (2014). [DOI] [PMC free article] [PubMed] [Google Scholar]
- 24.Ye C et al. Glycosylphosphatidylinositol-Anchored Anti-HIV scFv Efficiently Protects CD4 T Cells from HIV-1 Infection and Deletion in hu-PBL Mice. Journal of virology 91 (2017). [DOI] [PMC free article] [PubMed] [Google Scholar]
- 25.Martin-Montalvo A et al. Metformin improves healthspan and lifespan in mice. Nature communications 4, 2192 (2013). [DOI] [PMC free article] [PubMed] [Google Scholar]
- 26.McCune JM The dynamics of CD4+ T-cell depletion in HIV disease. Nature 410, 974–979 (2001). [DOI] [PubMed] [Google Scholar]
- 27.Pernicova I & Korbonits M Metformin--mode of action and clinical implications for diabetes and cancer. Nature reviews. Endocrinology 10, 143–156 (2014). [DOI] [PubMed] [Google Scholar]
- 28.Hegedus A, Kavanagh Williamson M & Huthoff H HIV-1 pathogenicity and virion production are dependent on the metabolic phenotype of activated CD4+ T cells. Retrovirology 11, 98 (2014). [DOI] [PMC free article] [PubMed] [Google Scholar]
- 29.Lagouge M et al. Resveratrol improves mitochondrial function and protects against metabolic disease by activating SIRT1 and PGC-1alpha. Cell 127, 1109–1122 (2006). [DOI] [PubMed] [Google Scholar]
- 30.Csiszar A et al. Resveratrol induces mitochondrial biogenesis in endothelial cells. Am J Physiol Heart Circ Physiol 297, H13–20 (2009). [DOI] [PMC free article] [PubMed] [Google Scholar]
- 31.Lei Y et al. The mitochondrial proteins NLRX1 and TUFM form a complex that regulates type I interferon and autophagy. Immunity 36, 933–946 (2012). [DOI] [PMC free article] [PubMed] [Google Scholar]
- 32.Lei Y et al. EGFR-targeted mAb therapy modulates autophagy in head and neck squamous cell carcinoma through NLRX1-TUFM protein complex. Oncogene 35, 4698–4707 (2016). [DOI] [PMC free article] [PubMed] [Google Scholar]
- 33.Vermeire J et al. HIV Triggers a cGAS-Dependent, Vpu- and Vpr-Regulated Type I Interferon Response in CD4(+) T Cells. Cell reports 17, 413–424 (2016). [DOI] [PubMed] [Google Scholar]
- 34.Li S, Wang L, Berman M, Kong YY & Dorf ME Mapping a dynamic innate immunity protein interaction network regulating type I interferon production. Immunity 35, 426–440 (2011). [DOI] [PMC free article] [PubMed] [Google Scholar]
- 35.Jourdain AA et al. A mitochondria-specific isoform of FASTK is present in mitochondrial RNA granules and regulates gene expression and function. Cell reports 10, 1110–1121 (2015). [DOI] [PubMed] [Google Scholar]
- 36.Antonicka H & Shoubridge EA Mitochondrial RNA Granules Are Centers for Posttranscriptional RNA Processing and Ribosome Biogenesis. Cell reports 10, 920–932 (2015). [DOI] [PubMed] [Google Scholar]
- 37.Tarancon-Diez L et al. Immunometabolism is a key factor for the persistent spontaneous elite control of HIV-1 infection. EBioMedicine 42, 86–96 (2019). [DOI] [PMC free article] [PubMed] [Google Scholar]
- 38.Zuniga JA, Easley KA, Shenvi N, Nguyen ML & Holstad M The impact of diabetes on CD4 recovery in persons with HIV in an urban clinic in the United States. Int J STD AIDS 29, 63–71 (2018). [DOI] [PubMed] [Google Scholar]
- 39.Moyo D et al. Cohort study of diabetes in HIV-infected adult patients: evaluating the effect of diabetes mellitus on immune reconstitution. Diabetes Res Clin Pract 103, e34–36 (2014). [DOI] [PMC free article] [PubMed] [Google Scholar]
- 40.Carr A Toxicity of antiretroviral therapy and implications for drug development. Nat Rev Drug Discov 2, 624–634 (2003). [DOI] [PubMed] [Google Scholar]
- 41.Routy JP et al. Effect of metformin on the size of the HIV reservoir in non-diabetic ART-treated individuals: single-arm non-randomised Lilac pilot study protocol. BMJ Open 9, e028444 (2019). [DOI] [PMC free article] [PubMed] [Google Scholar]
METHODS-ONLY REFERENCES
- 42.Council NR Guide for the care and use of laboratory animals Edn. 8th (National Academies Press, Washington, DC.; 2011). [PubMed] [Google Scholar]
- 43.Konig R et al. Global analysis of host-pathogen interactions that regulate early-stage HIV-1 replication. Cell 135, 49–60 (2008). [DOI] [PMC free article] [PubMed] [Google Scholar]
- 44.Guo H, Gao J, Taxman DJ, Ting JP & Su L HIV-1 infection induces interleukin-1beta production via TLR8 protein-dependent and NLRP3 inflammasome mechanisms in human monocytes. The Journal of biological chemistry 289, 21716–21726 (2014). [DOI] [PMC free article] [PubMed] [Google Scholar]
- 45.Livak KJ & Schmittgen TD Analysis of relative gene expression data using real-time quantitative PCR and the 2(−Delta Delta C(T)) Method. Methods 25, 402–408 (2001). [DOI] [PubMed] [Google Scholar]
- 46.Uchimura T et al. The Innate Immune Sensor NLRC3 Acts as a Rheostat that Fine-Tunes T Cell Responses in Infection and Autoimmunity. Immunity 49, 1049–1061 e1046 (2018). [DOI] [PMC free article] [PubMed] [Google Scholar]
- 47.Chen X, Smith LM & Bradbury EM Site-specific mass tagging with stable isotopes in proteins for accurate and efficient protein identification. Analytical chemistry 72, 1134–1143 (2000). [DOI] [PubMed] [Google Scholar]
- 48.Zecha J et al. TMT Labeling for the Masses: A Robust and Cost-efficient, In-solution Labeling Approach. Mol Cell Proteomics 18, 1468–1478 (2019). [DOI] [PMC free article] [PubMed] [Google Scholar]
- 49.Smyth GK, Gentleman R, Carey V, Dudoit S, Irizarry R, and Huber Limma W: linear models for microarray data, in In Bioinformatics and Computational Biology Solutions using R and Bioconductor, Edn. 1 379–420 (N. Y. Springer, 2005). [Google Scholar]
- 50.Subramanian A et al. Gene set enrichment analysis: a knowledge-based approach for interpreting genome-wide expression profiles. Proceedings of the National Academy of Sciences of the United States of America 102, 15545–15550 (2005). [DOI] [PMC free article] [PubMed] [Google Scholar]
- 51.Mostafavi S, Ray D, Warde-Farley D, Grouios C & Morris Q GeneMANIA: a real-time multiple association network integration algorithm for predicting gene function. Genome biology 9 Suppl 1, S4 (2008). [DOI] [PMC free article] [PubMed] [Google Scholar]
Associated Data
This section collects any data citations, data availability statements, or supplementary materials included in this article.
Supplementary Materials
Data Availability Statement
The authors declare that the data supporting the findings of this study are available with the paper and its supplementary information files. Source data for all figures are provided with the paper. The RV217 CD4 T cell transcriptome data have been uploaded to the Gene Expression Omnibus (accession number: GSE165841). The mass spectrometry proteomics data have been deposited to the ProteomeXchange with identifier PXD023565. The public databases used include UniProt human protein sequence database: https://www.uniprot.org/proteomes/UP000005640; KEGG PATHWAY Database: https://www.genome.jp/kegg/pathway.html; HALLMARK Gene Set: https://www.gsea-msigdb.org/gsea/msigdb/genesets.jsp?collection=H; Reactome Pathway Database: https://reactome.org/.


