

Abstract
Background:
Epidemiological data link traffic-related air pollution (TRAP) to increased risk of Alzheimer’s disease (AD). Preclinical data corroborating this association are largely from studies of male animals exposed acutely or subchronically to high levels of isolated fractions of TRAP. What remains unclear is whether chronic exposure to ambient TRAP modifies AD risk and the influence of sex on this interaction.
Objectives:
This study sought to assess effects of chronic exposure to ambient TRAP on the time to onset and severity of AD phenotypes in a preclinical model and to determine whether sex or genetic susceptibility influences outcomes.
Methods:
Male and female TgF344-AD rats that express human AD risk genes and wildtype littermates were housed in a vivarium adjacent to a heavily trafficked tunnel in Northern California and exposed for up to 14 months to filtered air (FA) or TRAP drawn from the tunnel and delivered to animals unchanged in real time. Refractive particles in the brain and AD phenotypes were quantified in 3-, 6-, 10-, and 15-month-old animals using hyperspectral imaging, behavioral testing, and neuropathologic measures.
Results:
Particulate matter (PM) concentrations in TRAP exposure chambers fluctuated with traffic flow but remained below 24-h PM with aerodynamic diameter less than or equal to 2.5 micrometers () U.S. National Ambient Air Quality Standards limits. Ultrafine PM was a predominant component of TRAP. Nano-sized refractive particles were detected in the hippocampus of TRAP animals. TRAP-exposed animals had more amyloid plaque deposition, higher hyperphosphorylated tau levels, more neuronal cell loss, and greater cognitive deficits in an age-, genotype-, and sex-dependent manner. TRAP-exposed animals also had more microglial cell activation, but not astrogliosis.
Discussion:
These data demonstrate that chronic exposure to ambient TRAP promoted AD phenotypes in wildtype and genetically susceptible rats. TRAP effects varied according to age, sex, and genotype, suggesting that AD progression depends on complex interactions between environment and genetics. These findings suggest current regulations are insufficient to protect the aging brain. https://doi.org/10.1289/EHP8905
Introduction
Epidemiological data indicate a strong association between traffic-related air pollution (TRAP) and increased risk of age-related dementia, including Alzheimer’s disease (AD) (Fu and Yung 2020; Peters et al. 2019). Although preclinical studies support a causal relationship between TRAP and AD [reviewed in (Costa et al. 2020; Haghani et al. 2020a; Kilian and Kitazawa 2018)], significant caveats regarding the exposure paradigms used in prior research complicate translation of these data to the human condition. TRAP is a dynamic and complex mixture of semivolatile, volatile, and nonvolatile components (Ning and Sioutas 2010). However, most animal studies have tested isolated fractions of TRAP [particulate matter (PM) or individual gaseous components, or experimentally generated diesel exhaust], typically using acute or subchronic exposures to levels of these pollutants significantly above regulatory limits (Calderón-Garcidueñas and Villarreal-Ríos 2017; Haghani et al. 2020b; Kilian and Kitazawa 2018). Data demonstrating that dose, composition, and exposure duration influence lung responses to air pollution (Carosino et al. 2015; Plummer et al. 2015) raise questions about the translatability of prior preclinical studies to AD risk in humans chronically exposed to ambient TRAP.
To better validate the epidemiological data, we designed a preclinical study to test the hypothesis that chronic exposure to ambient TRAP decreases the time to onset and/or exacerbates AD-relevant phenotypes. Rats were housed from 1 month of age up to 15 months of age in a vivarium adjacent to a heavily trafficked tunnel in Northern California. The air in this tunnel contains gases and particles emitted by vehicular traffic that are inhaled by commuters daily (Ban-Weiss et al. 2010; Geller et al. 2005) and is representative of near roadway residential exposures (Kuykendall et al. 2009). Animals were continuously exposed to filtered air (FA) or TRAP drawn directly from the tunnel and delivered unaltered in real time. To investigate interactions between TRAP, sex, and genetic susceptibility, we exposed male and female wildtype (WT) F344 rats, a strain previously used to demonstrate that subchronic exposure to diesel exhaust elicits a neuroinflammatory response (Levesque et al. 2011a, 2011b), and TgF344-AD transgenic rats derived from this same strain (Cohen et al. 2013). TgF344 rats express the human mutant “Swedish” amyloid precursor protein (APPswe) and 9 presenilin-1 () genes, and recapitulate the human progression of key clinical features of AD, including age-dependent neuroinflammatory responses, cerebral amyloidosis that precedes tauopathy, loss of neurons in the cerebral cortex and hippocampus, and cognitive deficits (Cohen et al. 2013). To monitor the influence of TRAP on AD progression, we collected tissues from 3-, 6-, 10-, and 15-month-old rats for biochemical and immunohistochemical assays and assessed cognitive behavior in 9.5- and 14.5-month-old animals (Figure 1A).
Figure 1.
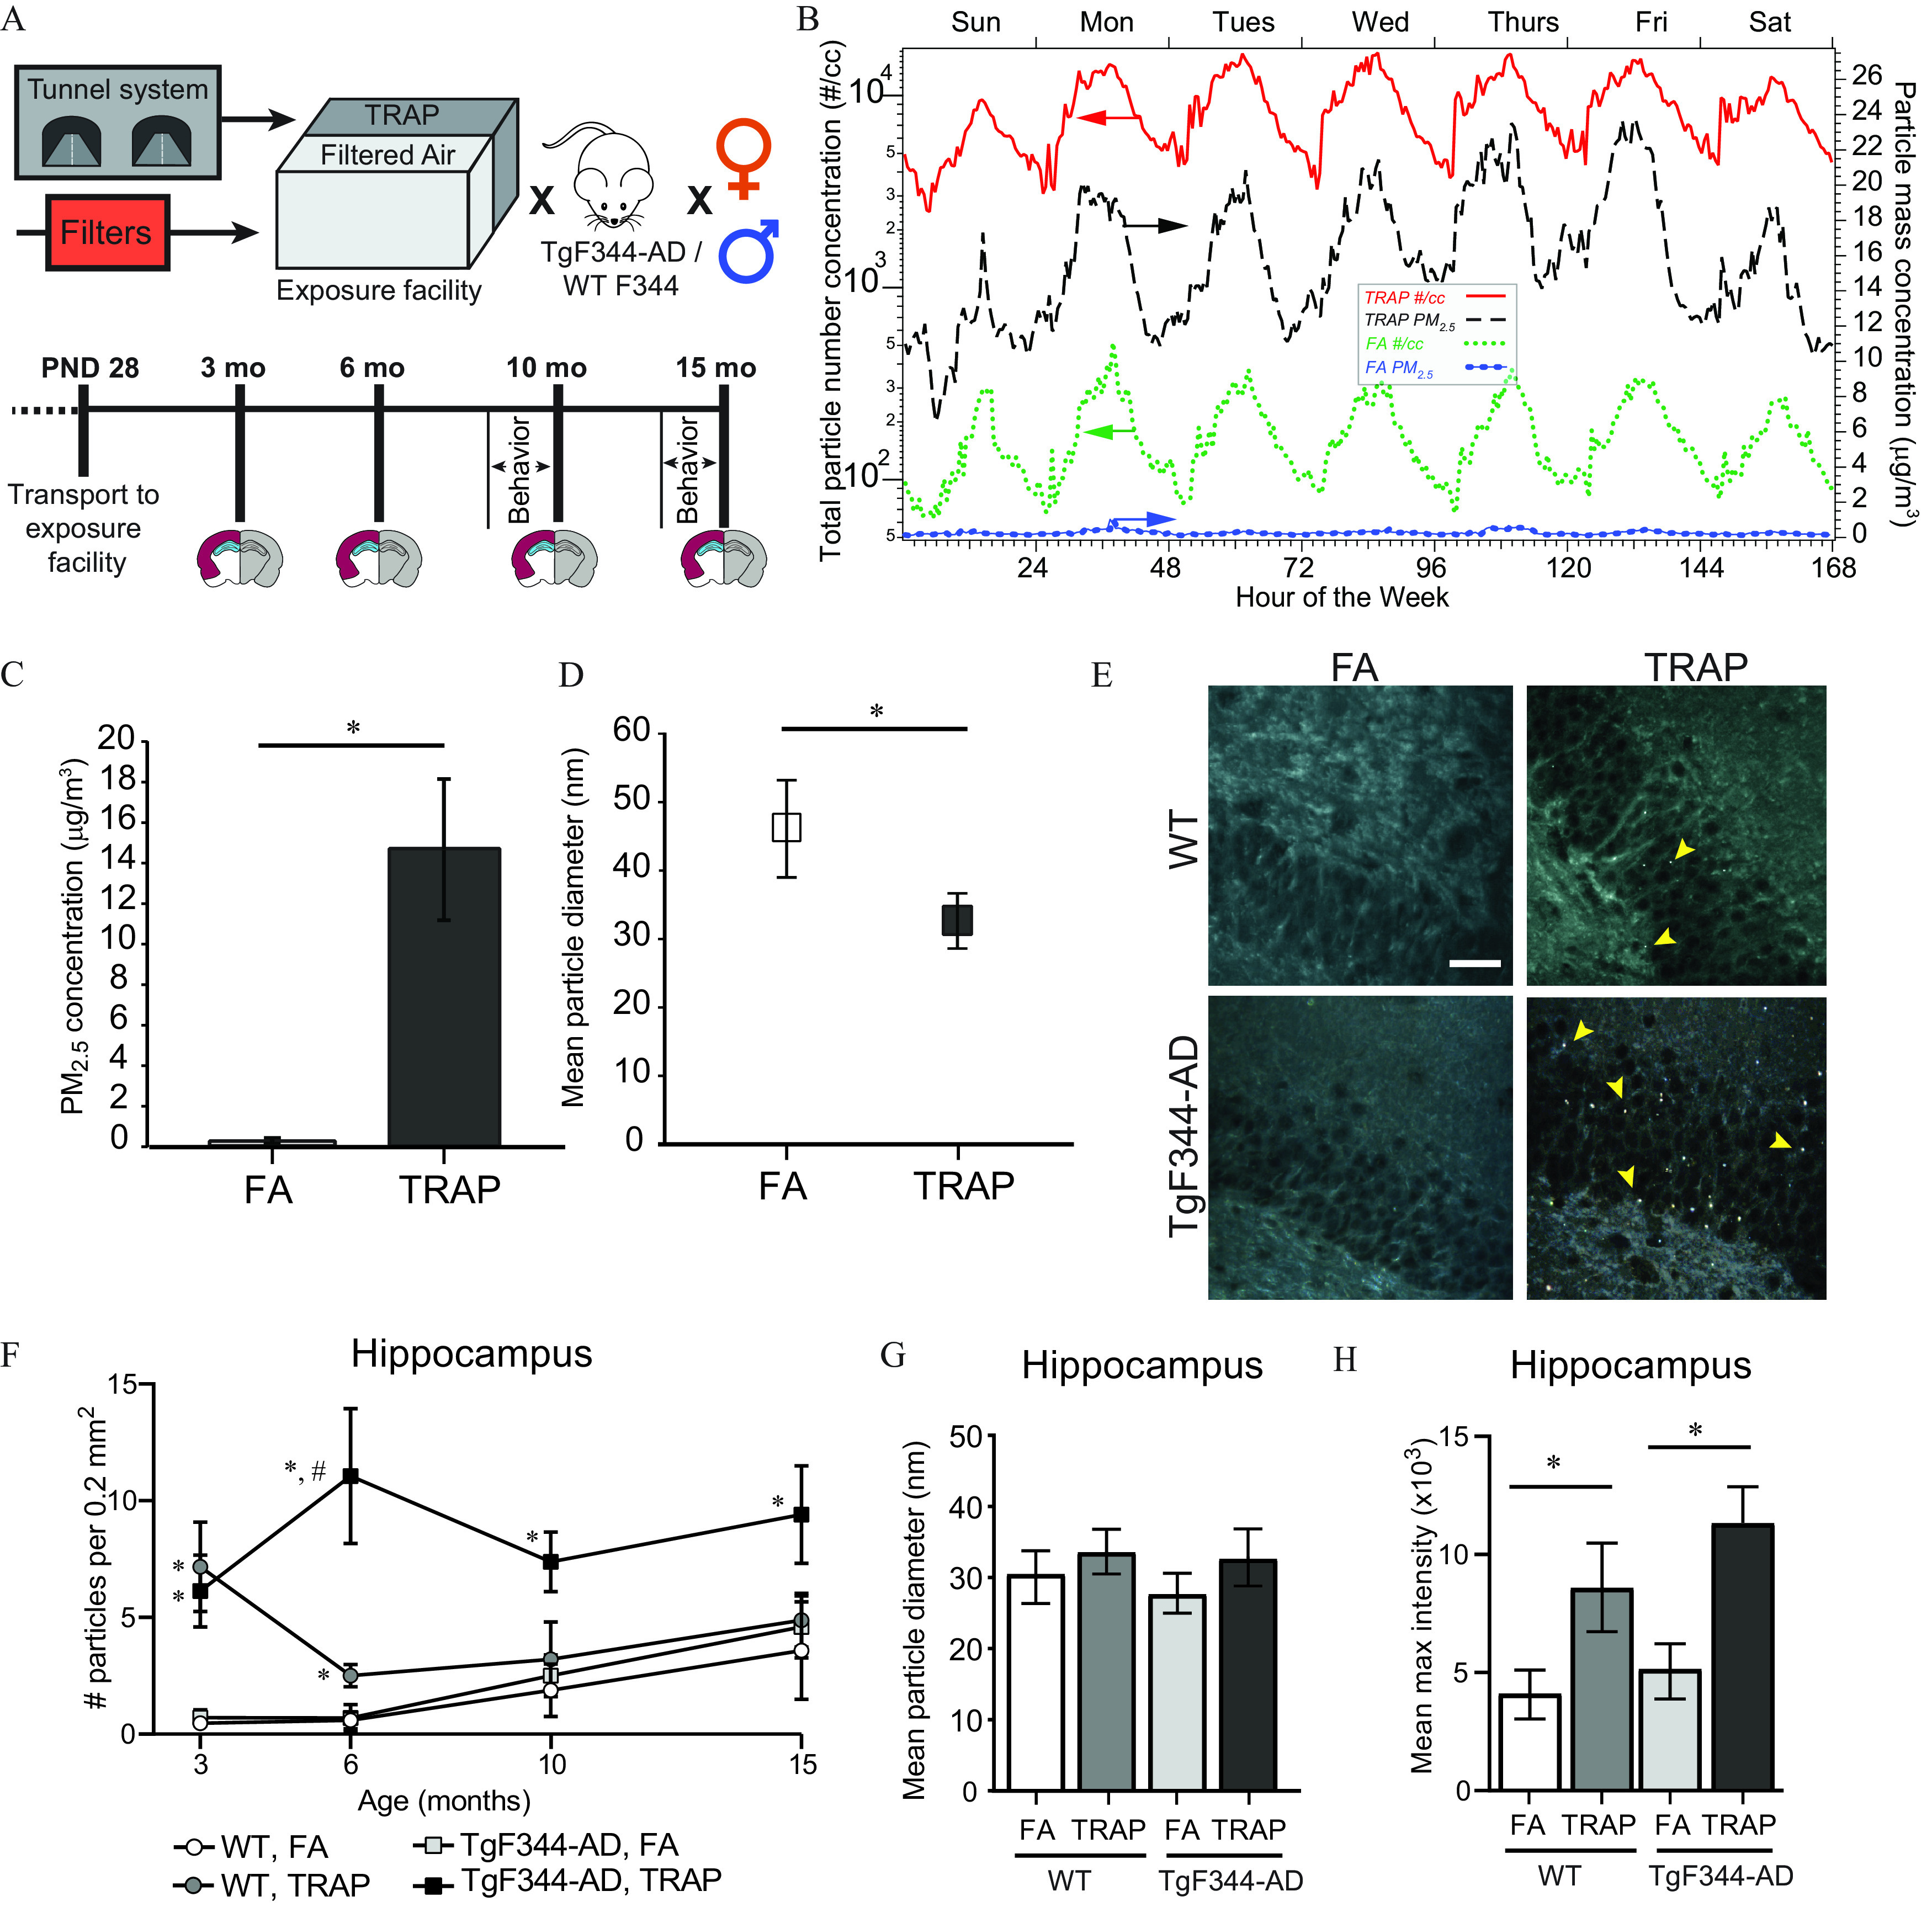
Schematic of experimental design and analyses of particulate matter in TRAP and the hippocampus of TRAP- and FA-exposed animals. (A) TgF344-AD and WT rats were transported to the tunnel facility at postnatal day 28 (P28) and continuously exposed to TRAP or filtered air (FA) until 3, 6, 10, or 15 months of age before being transported back to the laboratory for tissue collection. Behavior was performed on-site during the last 2 wk of exposure for animals euthanized at 10 and 15 months of age. One hemisphere of each brain was used for histological analyses (gray) and the other for biochemical analyses (maroon: cortex; blue: hippocampus). (B) Characterization of fluctuations in TRAP and FA total particle numbers (left axis, solid and dotted lines) and levels (right axis, dashed and line-dotted lines) by hour of week. Data represent the mean ( for and for particle number). Study concentrations (C) and particle diameter (D) in FA and TRAP exposure chambers ( and for C and D, respectively). (E) Representative hyperspectral images of refractive particles in the hippocampus of 6-month-old females; arrowheads point to refractive particles. . (F) Number of particles in the hippocampus per unit area as a function of age ( animals). (G) Mean diameter and (H) maximum hyperspectral intensity of refractive particles in the hippocampus (all ages combined) ( animals/group). Data in C, D, and F–H represent F–H: Data from male and female animals were combined because no significant sex differences were identified. (C–D): *Significantly different from FA control as determined using independent two-sample t-test. (F–G): *Significantly different from FA control; #significantly different from TRAP-exposed WT as determined using two-way ANOVA with post hoc Sidak’s test, . For specific values, see Table S4. Note: ANOVA, analysis of variance; FA, filtered air; PM, particulate matter; , PM with an aerodynamic diameter ; SD, standard deviation; TRAP, traffic-related air pollution; WT, wildtype.
Methods
Animals
All animal procedures were performed in compliance with protocols approved by the University of California Davis (UC Davis) Institutional Animal Care and Use Committee (IACUC), with the goal of minimizing pain and suffering. Male TgF344-AD rats were obtained from Emory University to establish a breeding colony at UC Davis. Male and female rats hemizygous for two human transgenes, APPswe and , which are inherited together in a simple Mendelian fashion, exhibit the full AD phenotype (Cohen et al. 2013). Thus, breeding of hemizygous male TgF344-AD rats with female WT Fischer (CDF) rats (purchased from Charles River Laboratories) yielded litters of transgenic and WT animals with genotypes evenly distributed between the sexes. We synchronously mated 52 females for this project, and were successfully produced, yielding a total of 416 pups, with an average of 8 pups per litter. The distribution of genotypes and sex among the 416 pups was: WT females, 103 pups comprising 24.8% of the total pups; TgF344-AD females, 98 pups comprising 23.5% of the total pups; WT males, 112 pups comprising 26.9% of the total pups; and TgF344-AD males, 103 pups comprising 24.8% of the total pups. We used a random number generator to randomly assign pups to the 8 experimental groups (Male/Female, WT/Tg, FA/TRAP), with a sample size of 45 pups per group. In total, 360 pups were transported to the tunnel, 90 pups for each sex–genotype combination. At postnatal day 2 (P2), pups were tattooed with coded identification numbers using nontoxic animal tattoo ink (Ketchum Manufacturing Inc.). Pups were genotyped at P8 as previously described (Cohen et al. 2013) and weaned at P21. For each sex, TgF344-AD and WT animals were numbered sequentially, the sequence was randomized, and animals were alternately allocated to either TRAP or FA groups in sex-separated cages. At , animals were transported to the tunnel and housed in an onsite vivarium approved by the UC Davis IACUC. The tunnel vivarium, which has been previously described (Berg et al. 2020; Edwards et al. 2020; Patten et al. 2020), was maintained under controlled environmental conditions (20°–26°C, 12:12 light:dark cycle) with food (Envigo Global 18% Protein Rodent Diet) and tap water provided ad libitum. A subset of animals was tested for cognitive behavior on site after 9.5–10 or 14.5–15 months of age. At 3, 6, 10, and 15 months of age, subsets of animals were transported back to the UC Davis campus and then euthanized 18 h later to collect tissues. While at UC Davis, the animals were housed in an IACUC-approved rodent vivarium at the UC Davis Center for Health and the Environment (CHE). The husbandry conditions and procedures at CHE were the same as those at the tunnel facility, with the following exceptions: absence of background traffic noise and vibration, exposure to standard vivarium air, and all cages were housed within the same room/space.
Animal Exposures
TRAP animals were continuously exposed to air drawn from a tunnel bore that permitted both light- and heavy-duty vehicles. TRAP was delivered unchanged in real time to exposure chambers within the tunnel vivarium. FA control animals were exposed to background ambient air collected from a storage shed immediately adjacent to the vivarium that was subjected to multiple emission control technologies to remove residual air pollutants as previously described (Edwards et al. 2020). Emissions controls used to purify FA included coarse filtration for removing large debris and dust, inline activated carbon for removing volatile organic compounds (VOCs), barium oxide-based catalytic converters for removing nitrogen oxides (), and a 6-port ultrahigh-efficiency particle filtering system for removing ultrafine [PM with aerodynamic diameter less than or equal to 10 micrometers (), fine [PM with aerodynamic diameter less than or equal to 2.5 micrometers ()], and coarse mode PM; see Supplemental Materials, “Tunnel Exposure Facility” and Edwards et al. (2020) for further details on the exposure facility. The airflow rate in the exposure chambers was 35 cubic feet per min, in accordance with IACUC specifications.
TRAP Characterization
TRAP was characterized as previously described (Edwards et al. 2020; Patten et al. 2020). Briefly, we performed a combination of real-time measurements and off-line analyses of PM filter samples. Particle size distribution was measured at 3-min resolution via a Scanning Mobility Particle Sizer (Model 3938; TSI Inc.); , , , and total suspended particle (TSP) mass concentrations were obtained at 5-s resolution using a DustTrak™ DRX Aerosol Monitor (Model 8533; TSI Inc.).
Biochemical Analyses
Rats were anesthetized using 4% isoflurane (Southmedic Inc.) in a 2:1 mixture of medical-grade air and oxygen delivered at a rate of . Whole blood was collected from the heart via cardiac puncture into serum separator tubes (Becton-Dickinson) and allowed to stand for 30 min at room temperature before centrifugation at for 10 min to collect serum, which was immediately frozen and stored at . Immediately after collection of blood, rats were transcardially perfused with of cold phosphate buffered saline (PBS; pH 7.2, NaCl, sodium phosphate dibasic, potassium phosphate monobasic) at a rate of using a Masterflex® peristaltic pump (Cole Parmer). After removal from the skull, brains were bisected sagittally using a stainless-steel rat brain matrix (Zivic Instruments). The hippocampus, cortex, and cerebellum were microdissected from the left hemisphere and flash frozen for biochemical analyses. Samples were stored at until further processed.
peptides were isolated from frozen cortical tissue using a two-step extraction method (Johnson-Wood et al. 1997) to obtain the detergent-soluble (Triton-soluble) and the guanidine hydrochloride (GuHCl) fractions. The level in each sample was normalized to total protein in the sample using a bicinchoninic acid (BCA) assay (Pierce Biotechnology). Levels of were quantified using human sandwich enzyme-linked immunosorbent assays (ELISAs) (Cat no. KHB3481, KHB3441, respectively; Invitrogen) in accordance with manufacturer’s recommendations.
Phosphorylated tau was quantified in the crude pellet and sarkosyl-insoluble fractions of cortical tissue by western blotting as previously described (Cohen et al. 2013). Next, of total protein per sample, determined using a commercial BCA assay (Pierce), was run on 10% Bis-Tris gels (ThermoFisher Scientific) and transferred to PVDF membranes (Invitrogen). Membranes were blocked for 1 h at 4°C in blocking buffer composed of 5% wt/vol dry powdered milk in Tris-buffered saline (TBS; Tris, NaCl, pH 7.4) and then incubated overnight at 4°C with primary antibodies diluted in blocking buffer. These included antibodies specific for paired helical fragment-1 (PHF1) (mouse monoclonal, 1:100, gift of Peter Davies, Albert Einstein College of Medicine) (Greenberg et al. 1992) and glyceraldehyde-3-phosphate dehydrogenase (GAPDH; mouse monoclonal, 1:2000; Cat No. 2118, Cell Signaling). After three washes in TBS with 0.03% vol/vol Triton™ X-100, membranes were incubated for 1 h at room temperature with Li-Cor® infrared secondary antibodies (Li-Cor, Inc.) diluted 1:10,000 in TBS. After three additional washes in TBS, membranes were imaged on an Odyssey® Li-Cor® Imaging System (Li-Cor). After stripping with incubations in a solution of 1.5% wt/vol glycine, 0.1% wt/vol SDS, 1% vol/vol Tween 20 in distilled water, membranes were blocked and reprobed using a total tau antibody (Cat. No. MAB3420, 1:500; Chemicon). Band densities were measured using ImageJ, and relative levels of phosphorylated tau were normalized to total tau and to GAPDH.
Immunohistochemical Analyses
For immunohistochemical analyses, the right hemisphere of the brain from perfused animals was cut into 2-mm coronal blocks and fixed in 4% wt/vol paraformaldehyde (PFA; Sigma Chemical) in phosphate buffer (pH 7.2, sodium phosphate dibasic, potassium phosphate monobasic) for 24 h at 4°C. After washes in PBS, blocks were sunk in 30% wt/vol sucrose (ThermoFisher Scientific) in PBS for 1 wk, before being embedded in Optimal Cutting Temperature (OCT) compound (ThermoFisher Scientific) and flash frozen in a bath of dry ice and methanol. Cryosections thick were obtained from frozen PFA-fixed brain blocks as previously described (Patten et al. 2020). For each animal, three or four sections from the dorsal hippocampus (Bregma to ; confirmed using a photographic atlas of the rat brain) were immunostained as previously described (Patten et al. 2020) using the antibodies described in Table S1. The one exception was that sections immunostained for PHF1 were blocked in 5% wt/vol nonfat dry milk (Millipore) in TBS. To eliminate lipofuscin autofluorescence in animals 10 or 15 months of age, sections were counterstained with the autofluorescence quencher TrueBlack (Biotium), in accordance with manufacturer’s instructions. Sections were mounted in ProLong™ Gold with 4′,6-diamidino-2-phenylindole (DAPI) (ThermoFisher Scientific). Negative controls were similarly processed, except blocking buffer was used in place of primary antibody. For Thioflavin S (ThioS) analyses, fixed brain sections were stained with 0.02% wt/vol Thioflavin S (Sigma Chemical) in water for 8 min and then de-stained with 50% vol/vol ethanol (ThermoFisher Scientific) for . Slides were mounted in ProLong™ Gold without DAPI (ThermoFisher Scientific).
Fluorescence Imaging and Analysis
An investigator blinded to experimental group performed image acquisition and analyses. Fluorescent images were acquired using a 20× objective on an ImageExpress MicroXLS High-Content Analysis System using MX6 software (Molecular Devices), or in the case of PHF1, a 60× objective on an Olympus IX81 inverted fluorescent microscope with a mounted DSU Spinning Disk Confocal Scanner (Olympus Life Science Solutions).
Fluorescence intensity twice the background fluorescence in negative control samples was considered positive for each biomarker. For analyses of cluster of differentiation 68/ionized calcium-binding adapter molecule 1 (CD68/IBA1) co-labeling, we used secondary wavelengths of 488 and 594, respectively. Nine overlapping image tiles were stitched together using MX6 software to create final images for brain regions of interest (dentate gyrus, cornu ammonis 1 (CA1), cornu ammonis 3 (CA3), thalamus, entorhinal cortex, and cerebellum). OC, ThioS, glial fibrillary acidic protein (GFAP), neuronal nuclei (NeuN), and PHF1 images were analyzed using ImageJ [version 1.8.0; National Institutes of Health (https://imagej.nih.gov/ij/)], and data were averaged for each animal () across all imaged sections ( per animal) for each region. GFAP, OC, and ThioS fluorescence was quantified as the percent immunopositive area within the region of interest. deposits were also counted and measured for area and diameter using Image J, as previously described (Guillot-Sestier et al. 2015). For NeuN and IBA1, immunopositive cells were counted using automated ImageJ analyses, using a constant region of interest for each image. Fluorescent images of sections co-labeled for CD68 and IBA1 were converted into binary masks for IBA1 and CD68 channels, using MatLab (version 2014b; MATLAB). CD68 intensity was then quantified for the area within each cell mask.
Hyperspectral Imaging of Refractive Particles
To assess refractive particle deposition, thick PFA-fixed brain sections were imaged using a CytoViva Hyperspectral Imaging System (CytoViva Inc.) as previously described (Austin et al. 2016; Meyer et al. 2010). Briefly, this method uses oblique-angle lighting to analyze the visible and near-infrared spectrum of each pixel within a field of view. Metallic particles have high light-scattering capability, so they appear reflective in a biological matrix (Austin et al. 2016; SoRelle et al. 2016). Tissue itself has variable refractive intensity, and contaminants such as dust can appear refractive. Therefore, we first imaged brain sections from naïve WT rats that never lived at the exposure facility to establish a baseline threshold intensity. Brain sections from TRAP and FA animals were imaged using a constant exposure setting for all animals. To analyze the number of refractive particles per image section, we used the automated particle filter setting in the CytoViva® ENVI software (version 4.8; CytoViva, Inc.). The threshold spectral maximum intensity was set at 3,500, and all particles were measured for their size and maximum spectral intensity. All imaging for particle diameter measurements was performed at 100× magnification, and all images were acquired by a reviewer blinded to experimental group.
Cued and Contextual Fear Conditioning
Cued and contextual fear conditioning assays were initiated at the tunnel facility in 9.5- and 14.5-month-old animals using an automated fear conditioning chamber (MedAssociates, Inc.), as previously described (Berg et al. 2020). Briefly, rats were trained on day one with three tone-shock pairings of 30 s of white noise at 80 dB and a 2-s foot shock of . Contextual conditioning was assessed on day 2, and cued conditioning on day 3. Average motion index was measured automatically using VideoFreeze® software (version 2.7; MedAssociates).
Statistical Analyses
All statistical analyses were performed using GraphPad Prism statistical software (version 7.03; GraphPad Software). Although our primary goal was to determine the effect(s) of TRAP exposure on AD-relevant outcomes, we also wanted to determine whether these effects were influenced by genotype or sex. Therefore, we performed three-way analysis of variance (ANOVA) to determine whether sex, genotype, exposure, or an interaction between these factors affected relevant outcomes. If we found a specific effect of sex or genotype, post hoc analyses were performed separately on males vs. females or on WT vs. TgF344-AD groups. Post hoc testing was performed using Sidak’s test with correction for multiple comparisons. For astrocyte and microglia analyses, we also performed one-way ANOVA to determine the effect of age. For end points in which we determined that there was no effect of sex, we combined data for males and females. All data were analyzed by an investigator blinded to experimental group. Data are presented as , unless otherwise noted. A was considered significant.
Results
TRAP Exposure Characterization
Total particle number and mass concentrations fluctuated throughout the week, mirroring traffic flow (Figure 1B). Total particle numbers in the TRAP chambers were 10- to 100-fold higher than in FA chambers. Measurement of particle mass concentrations in the air delivered to the exposure chambers indicated mean 24 h levels were in TRAP and in FA (Figure 1C), well below the U.S. 24-h National Ambient Air Quality Standard of . Average particle diameters in the TRAP and FA chambers were and , respectively (Figure 1D).
Refractive Particle Analyses in Brain Tissue
We used hyperspectral imaging to look for refractive particle deposition throughout the brain. Numerous refractive particles were present in the hippocampus of TRAP animals (Figure 1E). In this brain region, there were no sex differences in either genotype at any time point [, ], so we collapsed analyses across sex. This analysis revealed a significant effect of age by three-way ANOVA [, ], and a significant interaction between genotype and exposure [, ]. Subsequent independent analyses at each age indicated that TRAP-exposed animals had higher particle numbers in the hippocampus than FA rats at all ages (Figure 1E,F). Two-way ANOVA showed that TRAP had a significant main effect on particle number in the hippocampus at 3, 10, and 15 months of age [3 months: , ; 10 months: , ; 15 months , ]. There was also a significant main effect of genotype at 15 months [, ]. In addition, there was an interaction between exposure and genotype at 6 months [, ]. Post hoc analyses showed that TRAP-exposed WT and TgF344-AD animals had significantly higher particle numbers relative to genotype-matched FA controls at 3 months (Sidak’s test, and , respectively), and in TgF344-AD animals at 6, 10, and 15 months (Sidak’s test, 6 months: ; 10 months: ; 15 months: ). TRAP-exposed TgF344-AD rats also had higher particle numbers in the hippocampus than TRAP-exposed WT rats at 6 and 15 months (Sidak’s test, 6 months: ; 15 months: ). There were no significant group differences in particle diameter, and the mean diameter of refractive particles in the hippocampus was 30.09, similar to that of particles measured in TRAP (Figure 1G). However, the refractive index of particles was higher in brain tissue of TRAP-exposed rats in comparison with FA controls across genotype and age (Figure 1H).
Hyperspectral imaging of the frontal cortex, thalamus, and cerebellum of TRAP-exposed and FA animals indicated much lower concentrations of particles in these brain regions relative to the hippocampus (Figure 2A,B). No significant main effects for exposure or genotype were detected in any brain region at any age, with the exception of a significant effect of exposure at 15 months in the frontal cortex [, ] (Figure 2B). Post hoc analysis indicated that the frontal cortex of 15-month-old TgF344-AD animals exposed to TRAP had significantly more particles than FA controls (Sidak’s test, ).
Figure 2.

Refractive particle deposition in multiple brain regions. (A) Representative spectral images of refractive particle deposition in the frontal cortex (FC), thalamus (Thal), and cerebellum (Cer) of FA and TRAP TgF344-AD rats at 15 months of age. . (B) Quantification of refractive particles in specific brain regions over time. (C) Quantification of mean particle diameter in the hippocampus by age. (D) Quantification of mean particle refractive intensity in the hippocampus by age. All data presented as the ( animals per group). Data were analyzed by two-way ANOVA using genotype and exposure as factors, with post hoc Sidak’s test. *. For specific values, see Table S5. Note: ANOVA, analysis of variance; FA, filtered air; SD, standard deviation; TRAP, traffic-related air pollution.
We focused additional particle characterization on the hippocampus because particle deposition was highest in this brain region, and there were very few total particles detected in the other brain regions examined. Analysis of particle diameter by three-way ANOVA indicated no significant main effects of age, exposure, or genotype [age: , ; exposure: , ; genotype: , )] (Figure 2C). Analysis of mean refractive index also showed no differences by age or genotype [age: , ; genotype: , ]; however, there was a significant effect of exposure [, ], with TRAP-exposed animals having a higher mean maximum particle intensity than FA animals (Figure 2D).
Effects of TRAP on Cognitive Behavior, Neuronal Cell Loss, and Hyperphosphorylated Tau
Cognitive behavior was tested at the tunnel facility using cued and contextual fear conditioning assays. In 10-month-old animals, there was an effect of sex on contextual fear conditioning as determined by three-way ANOVA [, ], with males performing worse than females (Figure 3A). However, there were no effects of sex, genotype, or exposure on cued fear conditioning (Figure S2A). At 15 months, exposure, sex, and genotype interacted to impair performance in fear conditioning [, ]. In post hoc analysis, TRAP-exposed WT males showed impaired recognition of the fear conditioning context in comparison with FA WT males (Sidak’s test; ) (Figure 3B). In cued fear conditioning, there was an effect of genotype [, ], with TgF344-AD rats demonstrating impaired learning and memory in comparison with WT rats. However, there were no effects of sex or exposure (Figure S2B).
Figure 3.
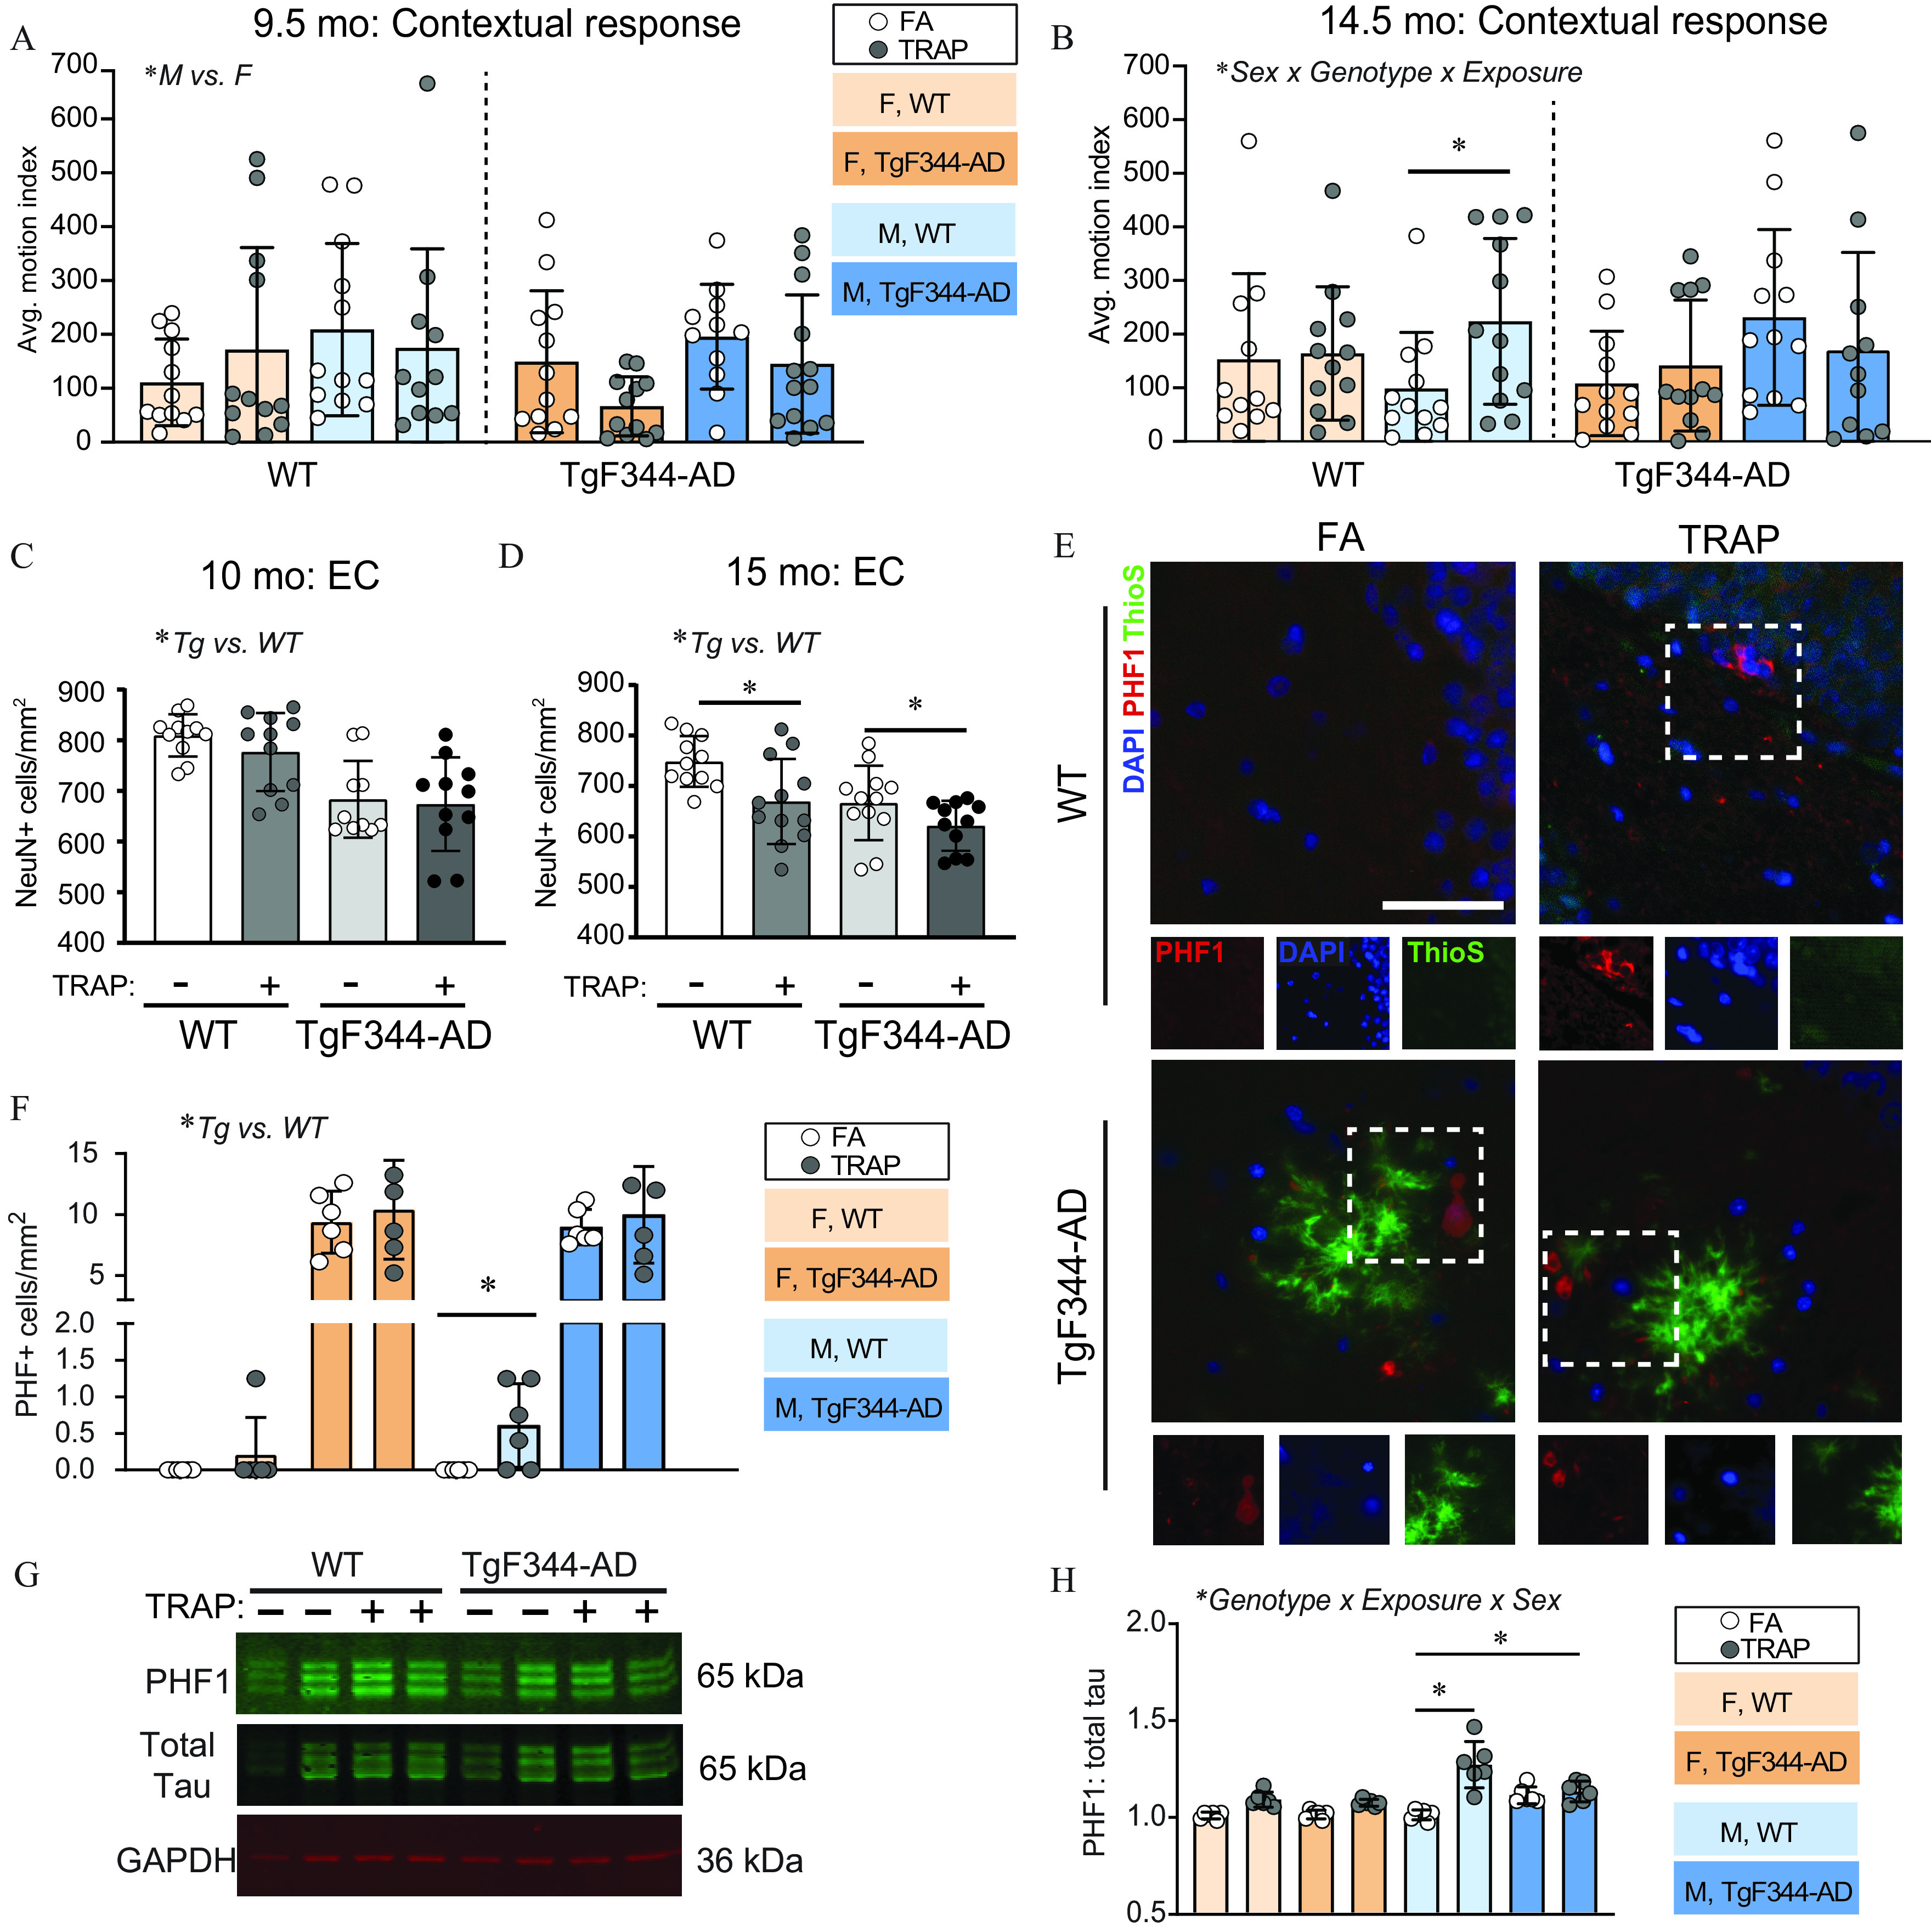
Effects of TRAP on AD phenotypes in WT and TgF344-AD rats. (A,B) Contextual fear conditioning was performed in 9.5- and 14.5-month-old rats (reported in the figure as the 10 and 15-month-old cohorts) to assess learning and memory. An increased average motion index indicates impaired behavior. (C–D) To assess neuronal cell loss, brain sections were immunostained for NeuN, a biomarker of neurons, and the number of NeuN-immunopositive cells was counted in the EC (four sections per animal). Male and female data were combined because there were no sex differences. (E) Representative images of hyperphosphorylated tau (PHF1) immunoreactivity (red) and ThioS (green) fluorescence in the hippocampus of 15-month-old male TgF344-AD animals. Sections were counterstained with DAPI (blue) to label cell nuclei. . (F) Quantification of PHF1-immunopositive cells in the hippocampus of 15-month-old TgF344-AD rats. (G) Representative western blots of the crude pellet fraction of cortical tissue from 15-month-old animals, probed for PHF1, GAPDH, and total tau. (H) Densitometric analyses of PHF1 immunopositive bands normalized to the densitometric values of GAPDH in the same sample. All data presented as the ( animals per group for A–D; animals per group for F and H). Data were analyzed by three-way ANOVA using sex, genotype, and exposure as factors (A,B,F,H) or two-way ANOVA using genotype and exposures as factors (C,D) with post hoc Sidak’s test; *. Circles represent individual animals (for C,D,F,H each circle is an average of four technical replicates). For specific values, see Table S6. Note: AD, Alzheimer’s disease; ANOVA, analysis of variance; EC, entorhinal cortex; F, female; M, male; SD, standard deviation; Tg, TgF344–AD; TRAP, traffic-related air pollution; WT, wildtype.
Neuronal cell loss, a pathological hallmark of AD, is reported to occur by 10 months in the TgF344-AD model (Cohen et al. 2013). We did not observe any sex-specific effects by three-way ANOVA [CA1: , ; EC: , ], so we collapsed analyses by sex. At 10 months, we saw greater neuronal cell loss in the entorhinal cortex (EC; Figure 3C) and hippocampal CA1 regions of TgF344-AD animals (Figure S2C) in comparison with WT [EC: , ; CA1: , ] but no TRAP-specific effects. However, at 15 months, we found that TRAP exacerbated neuronal cell loss in both WT and TgF344-AD animals in the EC region (Sidak’s test; TgF344-AD: , WT: ) (Figure 3D). The CA1 region showed no TRAP-specific effects at 15 months, but TgF344-AD animals had significantly fewer neurons than WT animals [, ] (Figure S2D). One caveat of these studies is that we analyzed neuronal cell density using an automated image analysis and quantification method rather than stereological counting. However, the original characterization of the TgF344-AD rat used stereology to demonstrate that at 16 months of age, TgF344-AD rats had 23% fewer neurons than age-matched WT rats (Cohen et al. 2013). We observed that 15-month-old TgF344-AD rats exposed to FA had 13% fewer neurons than age-matched WT rats exposed to FA. Therefore, although the actual numbers we report may not be as accurate as stereological data, we feel confident that the comparative outcomes are accurate.
Consistent with prior characterization of the TgF344-AD rat (Cohen et al. 2013), at 15 months, we observed significantly higher levels of PHF1 immunoreactivity in the hippocampus of TgF344-AD animals in comparison with WT animals (Figure 3E,F). Consequently, we analyzed TgF344-AD and WT animals separately to determine whether TRAP affected PHF1 reactivity. In WT animals, there was a significant effect of exposure [, ], and post hoc analysis showed this reflected higher PHF1 immunoreactivity in male TRAP animals (Sidak’s test; ). Although the PHF1 inclusions in WT male animals did not resemble the typical morphology of neurofibrillary tangles (Greenberg and Davies 1990), elevated PHF1 immunoreactivity was not seen in any other WT group. PHF1 inclusions in TgF344-AD animals were adjacent to plaques and/or dystrophic neurites, as previously described (Morrone et al. 2020). In TgF344-AD animals, we did not observe any effect of sex or exposure on PHF1 immunoreactivity (Figure 3F). We also did not detect any PHF1 immunoreactivity at ages earlier than 15 months (data not shown). To confirm the PHF1 immunohistochemical results, we performed western blot analyses of phosphorylated tau (Figure 3G,H). TRAP exposure resulted in higher PHF1:total tau levels in 15-month-old WT males’ levels relative to FA controls (Sidak’s test, ) (Figure 3H). Total tau levels were also significantly higher in TRAP-exposed WT males at this age relative to FA WT males (Sidak’s test, ) (Figure S2E). No TRAP effects were observed in any other group.
Effects of TRAP on Proteinopathy
As another indicator of AD progression, we measured immunoreactivity (Figure 4A–D). The amyloid precursor protein (APP) differs in key amino acids between rodents and humans; thus, the rodent form of APP does not aggregate or typically form plaques (Tambini et al. 2020; Zhu et al. 2019). Consistent with this, we did not observe plaques in WT animals under any condition (data not shown). Therefore, we confined analyses to TgF344-AD rats. Plaque measurements can differ based on aggregation state (Hatami et al. 2014; Kayed et al. 2007), so we performed immunohistochemistry (IHC) analyses using the antiamyloid fibril antibody clone OC (Kayed et al. 2007) (Figure 4A) and the fluorescent dye Thioflavin S (ThioS, Figure 4B), which recognizes beta sheet-rich structures and is widely used for plaque analyses (Rostagno and Ghiso 2009). We focused our analyses on the EC and hippocampal subregions because these brain regions are important in learning and memory and are implicated in AD pathogenesis (Morrone et al. 2020). Because accumulates in the brain over time, we analyzed each age separately. At 3 months, four out of six TRAP-exposed TgF344-AD female rats showed deposition in the hippocampus dentate gyrus (DG) (Figure 4A) and the EC (Figure 4B), whereas no plaques were detected in any other group. To reduce animal-to-animal variability in plaque deposition location, all quantitative analyses for OC and ThioS used summed analyses from the hippocampal subregions and EC.
Figure 4.
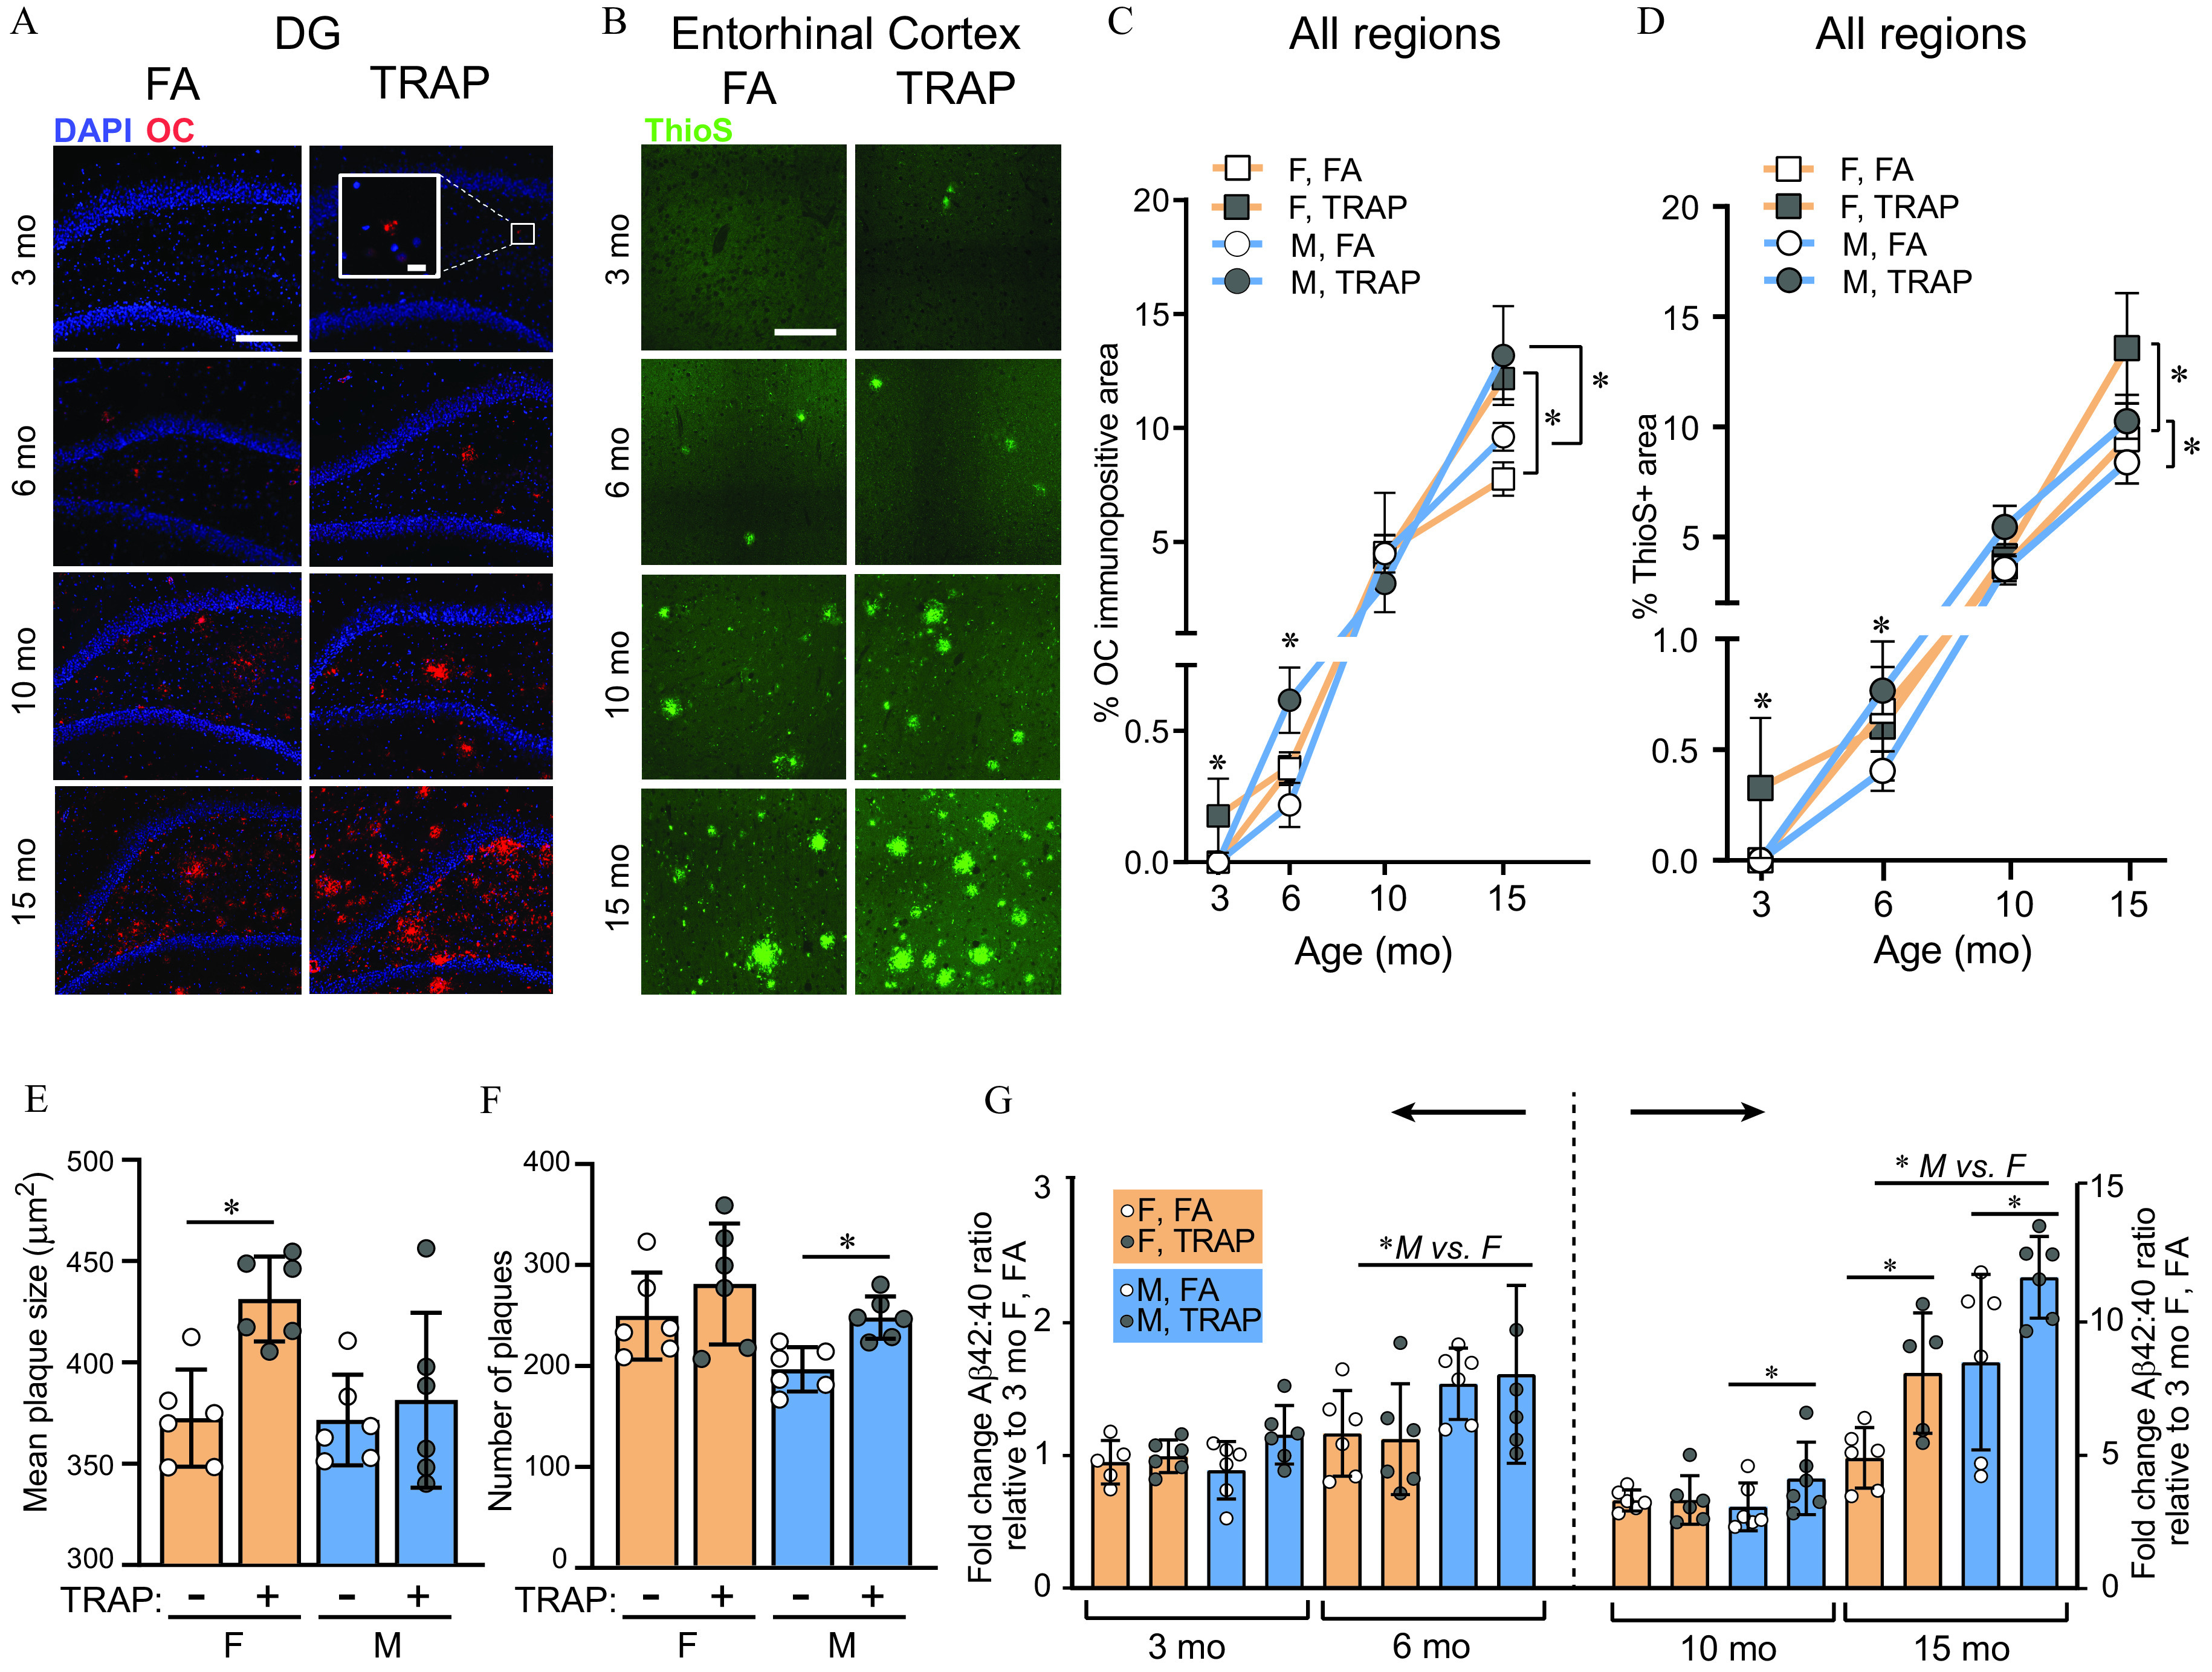
Effects of TRAP on proteinopathy in TgF344-AD rats. (A) Representative images of the hippocampus of female TgF344-AD rat immunostained with a conformation-specific antibody (OC). ; . (B) Representative images of the entorhinal cortex of female TgF344-AD rats stained with Thioflavin S (ThioS). . deposition was quantified as (C) the percent area of OC immunoreactivity or (D) as the percent area of ThioS reactivity (data from the entorhinal cortex and hippocampus were combined). (E) Mean plaque size and (F) mean plaque number were measured from images of ThioS reactivity in the brains of 15-month-old animals. (G) Triton-soluble ratios of , as measured by ELISA in cortical samples and normalized to data from 3-month-old WT female rats. (B,D,E–G) Quantitative data are shown as the ( animals per group). Group differences were identified using two-way ANOVA with post hoc Sidak’s test. *. (E–G) Each circle depicts mean of four technical replicates from one animal. For specific values, see Table S7. Note: ANOVA, analysis of variance; DG, dentate gyrus; ELISA, enzyme-linked immunosorbent assay; F, female; M, male; SD, standard deviation; Tg, TgF344-AD; TRAP, traffic-related air pollution; WT, wildtype.
For OC analyses of TgF344-AD rats (Figure 4C), we observed a significant interaction between exposure and sex at 3 months [, ], with post hoc analysis indicating that TRAP-exposed females had more plaques compared with FA controls (Sidak’s test; ). At 6 months there was also a significant interaction between exposure and sex [, ], and post hoc analysis showed that TRAP males had more plaques compared with FA controls (Sidak’s test; ). In 10-month-old animals, there was no effect of TRAP in either sex. However, by 15 months, there was a significant effect of exposure [, ], with post hoc tests indicating TRAP-exposed males and females both had elevated OC levels compared with FA controls (Sidak’s test, female: ; male: ).
For ThioS analyses in TgF344-AD rats (Figure 4D), we also observed a significant interaction between exposure and sex at 3 months [, ], with TRAP-exposed females having higher ThioS immunoreactivity (Sidak’s test, ). At 6 months, there was an interaction between sex and exposure [, ], with post hoc analysis showing TRAP-exposed males had higher ThioS (Sidak’s test, ). At 10 months, there were no effects of TRAP or sex; however, by 15 months there was an effect of both exposure [, ] and sex [, ], with both male and female TRAP-exposed animals having higher ThioS staining.
To further investigate proteinopathy in response to TRAP, we quantified ThioS plaque size and density in 15-month-old TgF344-AD rats, when both sexes showed effects of TRAP. We found TRAP females had larger plaques than FA controls [sex: , ; exposure: , , post hoc Sidak’s test, ; Figure 4E], whereas TRAP-exposed males had more plaques than FA controls [sex: , ; exposure: , ), post hoc Sidak’s test, ; Figure 4F]. To address the question of whether TRAP was increasing deposition across the brain nonspecifically, or specifically in AD-relevant regions, we performed a regional analysis of deposition in 15-month-old TgF344-AD rats. ThioS plaques were predominantly present in the DG, CA1, CA3, and EC. Very limited ThioS positivity was seen in the thalamus or cerebellum (Table S2 and Figure S3).
APP is cleaved into peptides of different lengths that have different physiological and pathological properties (Li et al. 2006), so we asked whether TRAP or sex changed the ratio of to , a metric that may better predict cognitive status than either peptide alone (Bolduc et al. 2016). We quantified in triton-soluble and Gu-HCl-soluble fractions of cortical tissue from TgF344-AD rats, and normalized results to 3-month-old females. We found that in the triton-soluble fraction, there was a significant effect of sex at 6 months [, ], with males exhibiting higher levels than females (Figure 4G). At 10 months, there was a significant effect of exposure [, ], and post hoc tests showed this was specific to TRAP males (Sidak’s test; ). At 15 months, there was a significant effect of both exposure and sex [, and , , respectively]. Post hoc analysis showed that both male and female TRAP-exposed animals had higher ratios compared with sex-matched FA controls (Sidak’s test, , , respectively). In the GuHCl fraction, there were no significant effects of TRAP or sex at any age (Figure S3).
Effects of TRAP on Neuroinflammation
To evaluate TRAP effects on neuroinflammation, we quantified astrogliosis and microglia activation in the EC and hippocampus. For astrogliosis, we quantified GFAP immunoreactivity (Figure 5A). There was a significant effect of sex by three-way ANOVA at 6, 10, and 15 months: At 6 months, , ; at 10 months, , ; and at 15 months, , ; therefore subsequent analyses were separated by sex (Figure 5B,C). Genotype, but not TRAP, altered GFAP immunoreactivity in males and females (Figure 5B). Specifically, 6- and 10-month-old TgF344-AD females expressed more GFAP than WT females (6 months: , 10 months: ), but there were no effects of TRAP. In female animals, age affected GFAP [, ], with higher levels of GFAP at 15 relative to 10 months (Sidak’s test, ) and at 6 relative to 3 months (). There was no difference in GFAP between 6 and 10 months (). In males, TgF344-AD had elevated levels of GFAP compared with WT at all ages (Sidak’s test, 3 months: , 6 months: , 10 months: , and 15 months: ), but there were no effects of TRAP (Figure 5B). Age also affected GFAP in males [, ], with higher levels at 15 months relative to 10 months, and at 6 months relative to 3 months (Sidak’s test, and , respectively). There was no difference in GFAP between 6 and 10 months ().
Figure 5.

Effects of TRAP on GFAP immunoreactivity in WT and TgF344-AD rats. (A) Representative images of GFAP (green) immunoreactivity in the hippocampus of 3- and 15-month-old male TgF344-AD and WT rats exposed to FA or TRAP. . (B) Quantification of the GFAP (green) immunopositive area summed across hippocampal subregions and the entorhinal cortex. Data were analyzed by one-way ANOVA for age with post hoc Sidak’s test, and by three-way ANOVA using sex, genotype, and exposure as factors, with post hoc Sidak’s test. *. Circles represent mean of four imaged sections for each individual animal. Data presented as the ( animals/group). For specific values, see Table S8. Note: ANOVA, analysis of variance; DG, dentate gyrus; ELISA, enzyme-linked immunosorbent assay; F, female; M, male; SD, standard deviation; Tg, TgF344-AD; TRAP, traffic-related air pollution; WT, wildtype.
We assessed microgliosis by co-labeling brain sections with IBA1, a biomarker of microglia, and CD68, a biomarker of phagocytic microglia (Figure 6A). The percentage of cells that were also were quantified in summed hippocampal subregions and the EC and normalized to levels in 3-month-old WT FA females (Figure 6B). There was a significant effect of sex by three-way ANOVA at 6 and 15 months; at 6 months: [, ]; at 15 months: [, ]; thus, additional analyses were separated for males and females. At 3 months, there was a significant effect of TRAP in females [, ], but not males. At 6 months, females showed an interaction between genotype and exposure [, ], and post hoc analysis showed TRAP exposure resulted in higher percentages in TgF344-AD relative to FA controls (Sidak’s test; ). At 6 months, male TgF344-AD rats also had higher percentages relative to WT [, ] and TRAP exposure resulted in higher percentages in TgF344-AD animals (Sidak’s test; ). By 10 months, male TgF344-AD animals had elevated levels relative to WT [, ], but there were no specific effects of TRAP. In 10-month-old females, there were no effects of genotype or exposure. Finally, at 15 months, there was an effect of TRAP in females [, ], and post hoc test showed that TRAP decreased levels in both genotypes (Sidak’s test; WT: , TgF344-AD: ). In males, there was an effect of genotype and exposure [, ; and , ; respectively]. However, TRAP effects were opposite that seen in females, increasing the percentage of cells relative to FA controls (Sidak’s test; WT: , TgF344-AD: ) (Figure 6B). Age had a strong effect on percentages in both males and females [female: , ; male: , ], with higher levels of at all ages in each sex (female: 3 vs. 6, ; 6 vs. 10, ; 10 vs. 15, ; male: 3 vs. 6, ; 6 vs. 10, ; 10 vs. 15, ).
Figure 6.

Effects of TRAP on IBA1/CD68 levels in TgF344-AD and WT rats. (A) Representative images showing microglia coexpressing IBA1 (red) and the phagocytic lysosomal marker CD68 (green). Sections were counterstained with DAPI (blue) to label cell nuclei. . (B) The percentage of cells co-labeled for CD68 were summed across hippocampal subregions and the entorhinal cortex and normalized to levels in 3-month-old WT FA females. (C) cell density in hippocampal subregions and the entorhinal cortex were measured for each age. Data were analyzed by one-way ANOVA for age with post hoc Sidak’s test, and by three-way ANOVA using sex, genotype, and exposure as factors, with post hoc Sidak’s test; *. Quantitative data are shown as the ( animals per group). For specific values, see Table S9. Note: ANOVA, analysis of variance; DG, dentate gyrus; ELISA, enzyme-linked immunosorbent assay; F, female; M, male; SD, standard deviation; Tg, TgF344-AD; TRAP, traffic-related air pollution; WT, wildtype.
To determine whether TRAP was changing microglial number in addition to CD68 status, we measured the number of cells across the hippocampus and EC. By three-way ANOVA, there were no effects of sex at any age; however, we separated analyses by sex to be consistent with other IBA1 analyses. At 3 and 6 months, three-way ANOVA revealed no effect of genotype or exposure on cell numbers in males or females (Figure 6C). However, at 10 and 15 months, there was a significant effect of genotype in females [10 months: , ; 15 months: , ] and males [10 months: , , 15 months: , ]. There were higher microglial cell numbers in both sexes from 6 to 10 and 10 to 15 months (females: 3 vs. 6, ; 6 vs. 10, ; 10 vs. 15, ; males: 3 vs. 6, ; 6 vs. 10, ; 10 vs. 15, ).
Discussion
Using an exposure paradigm designed to recapitulate the heterogeneity, concentration, and dynamic nature of TRAP experienced by humans who live near highways and/or commute in heavily trafficked areas, we demonstrated that chronic TRAP exposure accelerated and exacerbated phenotypes relevant to AD in not only genetically susceptible but also wildtype rats (significant changes are summarized in Table S3). Specifically, TRAP-exposed animals had shorter time to onset of amyloid plaque formation in TgF344-AD females and higher levels of amyloid plaques in TgF344-AD males and females. TRAP caused more neuronal cell loss in WT and TgF344-AD rats of both sexes, and TRAP-exposed WT males had higher levels of hyperphosphorylated tau and impaired learning and memory relative to FA controls. We observed that TRAP-exposed animals had more nano-sized refractive particles specifically in the hippocampus and showed higher CD68/IBA1 reactivity at early ages. Collectively, our findings corroborated epidemiologic evidence identifying TRAP as an environmental risk factor for AD and suggest that TRAP promoted the expression of AD phenotypes via neuroinflammatory mechanisms.
Our findings extend previous studies demonstrating that TRAP promotes AD phenotypes in rodent models, including deposition, neuronal cell loss, and cognitive deficits (reviewed in Costa et al. 2020; Haghani et al. 2020a; Kilian and Kitazawa 2018). However, our study differed significantly from prior research with respect to the duration of exposure (up to 14 months in our study vs. several weeks or months in prior research), as well as the composition and concentration of TRAP to which animals were exposed. With regard to the latter, with the exception of one study that examined the effects of ambient air pollution in Santiago, Chile (Calderón-Garcidueñas et al. 2020), most preclinical research has focused on neurological effects of isolated fractions of TRAP. Specifically, (Bhatt et al. 2015; Fonken et al. 2011), nano-sized or ultrafine PM (Cacciottolo et al. 2020, 2017; Haghani et al. 2020c; Jew et al. 2019; Win-Shwe and Fujimaki 2011; Win-Shwe et al. 2012; Woodward et al. 2017a; 2017b), diesel engine exhaust (Akhter et al. 2015; Coburn et al. 2018; Cole et al. 2016; Hullmann et al. 2017; Levesque et al. 2011a), or (Yan et al. 2016). The particle mass concentrations of the TRAP used in those prior studies ranged from . In contrast, the mean 24-h concentrations in the TRAP we used was , which is well below the U.S. federal 24-h limit for of (CARB n.d.).
We also addressed the less-studied question of sex differences in TRAP effects on AD phenotypes (Haghani et al. 2020a). Epidemiological data indicate women are more likely than men to experience adverse health effects associated with TRAP (Clougherty 2010; Franklin et al. 2007), including a population-based study of cognitive impairment (Kim et al. 2019). In our model, we observed sex-specific effects of TRAP on AD phenotypes that varied between genotypes. In TgF344-AD rats, TRAP caused sex-dependent effects on proteinopathy at early ages. At 3 months of age, only females exposed to TRAP exhibited deposits in their brain, whereas at 6 months, although both sexes had amyloid plaques, TRAP-exposed males had more deposition. TRAP effects on ratios in cortical tissue showed similar sex and age dependency. These observations are consistent with a recent study of mice that found high-level ultrafine PM exposure altered amyloid processing and tau-related genes in female but not male mice (Haghani et al. 2020b). An interesting finding from a recent clinical imaging study is that levels begin to increase earlier in women than in men (Rahman et al. 2020). The original characterization of the TgF344-AD model (Cohen et al. 2013) and our observations of TgF344-AD rats exposed to FA found no sex differences in proteinopathy at any age, suggesting that sex differences in deposition in humans may be due to sex differences in response to environmental factors, such as TRAP.
TRAP triggered a different profile of sex-dependent responses in WT animals: TRAP males, but not females, had higher levels of hyperphosphorylated tau and cognitive deficits. This observation is consistent with recent suggestions that tau hyperphosphorylation and cognitive deficits can occur independent of proteinopathy (Kunkle et al. 2019; Morrone et al. 2020; van der Kant et al. 2020). Although we cannot rule out the possibility that TRAP exposures longer than 14 months would elicit similar responses in WT females or in TgF344-AD rats of either sex, this observation suggests an unexpected interaction between sex and genotype in determining the initiation of these specific AD phenotypes. The observation that TRAP did not promote tau phosphorylation or cognitive impairment in TgF344-AD rats is contrary to prior studies that demonstrated that high-level exposure to TRAP-derived nano-sized PM or ultrafine PM promotes dementia in a murine AD model expressing the human APPswe gene (Cacciottolo et al. 2020) and in the 3xTgAD mouse (Jew et al. 2019), respectively. Our observation may reflect differences in species or exposure paradigms between studies. It also suggests that the AD risk genes expressed in the TgF344 rat, which are associated with familial, early-onset AD, exerted a stronger drive on AD pathology than ambient TRAP. However, the observation that ambient TRAP promoted AD phenotypes in WT animals supports the hypothesis that environmental factors contribute significantly to late-onset idiopathic AD (Dunn et al. 2019; Eid et al. 2019).
The mechanism(s) by which TRAP promoted AD phenotypes remain an outstanding question. Previous reports suggested TRAP may increase deposition by altering the activity of enzymes that cleave APP, including BACE1 (Li et al. 2006) and ADAM10 (Kunkle et al. 2019). In considering this possibility, it is important to note that the human transgenes expressed by the TgF344-AD rat are driven by the prion promoter; consequently, APP is overexpressed in all brain regions (Jankowsky et al. 2001). However, in our study, TRAP increased deposition only in the hippocampus and EC, even after 14 months of TRAP exposure. Therefore, it seems unlikely that TRAP modulation of APP processing was the main mechanism driving increased deposition in TgF344-AD rats exposed to ambient TRAP.
Alternatively, it has been proposed that microglial activation mediates TRAP effects on AD phenotypes (Calderón-Garcidueñas et al. 2019b; Jayaraj et al. 2017). Microglia are strongly implicated in AD pathogenesis, although their ascribed function(s) are complex with data to support both beneficial and harmful roles in disease progression (Lambert et al. 2013; Naj et al. 2017), and high-level TRAP exposure has been associated with microglial activation (Block and Calderón-Garcidueñas 2009; Costa et al. 2020). Our data suggested that ambient TRAP activated microglia at early ages in males and females and at late ages in males, as indicated by an increased percentage of IBA1-immunopositive cells that coexpressed CD68, a biomarker of phagocytosis (Guillot-Sestier et al. 2015), which is a characteristic of activated microglia (Tremblay et al. 2011). CD68 marks both M1 and M2a microglia; thus the goal of future studies is to employ additional markers that delineate M1 and M2 subtypes to better understand how TRAP influences microglia phenotypes. Monocytes also express IBA1, so we cannot rule out the possibility that TRAP recruited monocytes into the brain parenchyma. However, this recruitment seems unlikely because TRAP did not increase the total number of cells, which would be expected if there was significant migration of monocytes into brain tissue. It is also interesting that TRAP had no effect on GFAP immunoreactivity, suggesting that TRAP did not trigger a general neuroinflammatory response in the brain but rather selectively targeted microglia.
The temporal profile of TRAP effects on microglial activation was sex-dependent. In females, TRAP-exposed rats had higher microglial activation in both genotypes at 3 months of age and in TgF344-AD animals at 6 months. Although there were no TRAP effects at 10 months, in 15-month-old females, TRAP-exposed rats had lower microglial cell activation in both WT and transgenic animals. In males, rats exposed to TRAP had higher microglial activation in TgF344-AD at 6 months of age, had no effect on either genotype at 10 months of age, and had higher microglial cell activation in both genotypes at 15 months of age. These observations are consistent with transcriptomic studies documenting pronounced sex differences in microglia from aged (Villa 2018) and AD mice (Sala Frigerio et al. 2019).
Sex differences in TRAP effects on microglia activation may be related to sex-specific effects of TRAP on AD phenotypes. For example, activated microglia can seed and spread plaques (Venegas et al. 2017), and in our study, sex differences in the onset of microglial activation in TgF344-AD rats coincided with sex differences in the initial deposition of . Microglia also phagocytose peptides (Lai and McLaurin 2012). Although this raises the possibility that the higher percentage of phagocytic microglia in TRAP animals is a consequence of higher levels of deposition, the observation that TRAP caused higher levels of microglial activation in WT animals argues against this possibility. Conversely, lower levels of microglial activation in 15-month-old TgF344 females exposed to TRAP may have contributed to the significantly larger plaques observed in this group, as suggested by reports that decreased phagocytosis causes larger plaques in mouse AD models (Guillot-Sestier et al. 2015). Activated microglia can also phagocytose synapses (Fonseca et al. 2017; Hong et al. 2016; Stephan et al. 2013), and aberrant microglial phagocytosis of synapses has been reported in mouse models of AD (Hong et al. 2016). We observed higher levels of microglial activation coincident with cognitive deficits in 15-month-old WT males exposed to TRAP.
How TRAP activates microglia remains speculative. One possibility is via the deposition of ultrafine particles in the brain (Calderón-Garcidueñas et al. 2019a; Jayaraj et al. 2017). Consistent with prior studies that reported metal nanoparticles in the brain of animals (Klocke et al. 2018) and humans (González-Maciel et al. 2017; Maher et al. 2016) exposed to TRAP, we observed enhanced numbers of refractive particles in the brain of TRAP animals in comparison with FA controls. The diameter range of the particles in the brain was well within the primary ultrafine mode directly measured in the TRAP exposure chamber. An important finding is that the mean maximum refractive intensity of the particles in the brains of TRAP animals was significantly greater than those in the brains of FA controls, suggesting differences in elemental composition. Although chemical analysis of these tissue-embedded particles was beyond the scope of this study, our previous characterization of TRAP collected from this facility showed that elemental, organic, and total carbon levels, as well as levels of copper, titanium, zinc, iron, sulfur, and silicon were significantly elevated in air from TRAP compared with FA exposure chambers (Edwards et al. 2020; Patten et al. 2020).
The distribution of refractive particles in the brain of TRAP-exposed animals has implications regarding the route of particle entry into the brain. There is evidence that ultrafine PM may enter the olfactory cortex via the olfactory epithelium (Ajmani et al. 2016) and olfactory nerves (Oberdörster and Utell 2002; Oberdörster et al. 2004), with subsequent distribution to other brain regions. Alternatively, inhaled nanoparticles can rapidly enter the bloodstream (Miller et al. 2017), with subsequent delivery to the brain via the systemic circulation. We observed very few particles in the frontal cortex or olfactory tract, even after 14 months of chronic exposure, suggesting that TRAP particles were not entering the brain via olfactory nerves. Moreover, we detected very few particles in the cerebellum and the thalamus. Rather, particle load in TRAP-exposed animals was significantly higher than in FA controls primarily in the hippocampus, and hippocampal loads were elevated in TgF344-AD in comparison with WT animals at age 6 months and older. The difference in tissue dosimetry may have contributed to different outcomes observed between these two genotypes. The reason particle loads were higher in the hippocampus than in other regions of the brain is not known but may be related to disrupted function of the blood–brain barrier (BBB). Previous studies have shown that: a) in humans with mild cognitive impairment, the hippocampus is one of the earliest brain regions to show BBB disruption (Montagne et al. 2015); b) neurovascular dysfunction (Joo et al. 2017) and disrupted BBB integrity (Dickie et al. 2019) have been documented in the TgF344-AD rat; and c) transient BBB disruption is associated with higher uptake of nanomaterial into the brain from the blood (Smith et al. 2016).
Although our data support a role for PM in promoting TRAP effects on AD phenotypes, we cannot rule out contributions from other components in TRAP, such as gases. We also cannot dismiss potential effects of roadway noise or vibration, although the fact that we observed significant differences between TRAP and FA animals housed in the same vivarium and, thus, exposed to the same roadway noise and vibration, suggests that any effects from these factors required interactions with TRAP components. Identifying which component(s) of near-roadway exposure have the greatest impact on AD risk remains an outstanding question (Russ et al. 2019), the answer to which is critical for identifying source(s) of high-risk components that can be controlled. In lieu of curing AD, the most expedient and potentially actionable course to curb the predicted increase in AD incidence is to identify and limit major risk factors through policy changes.
Supplementary Material
Acknowledgments
The authors thank L-W. Jin and D. Harvey (UC Davis Alzheimer’s Disease Research Center) for providing advice on measuring and tau, and statistical analysis, respectively. This work was funded by the National Institutes of Health (NIH; R21 ES026515, R21 ES025570, P30 ES023513, and P30 AG010129). K.T.P. was supported by NIH-funded predoctoral training programs awarded to the UC Davis (T32 MH112507 and T32 ES007059). This project used core facilities supported by the UC Davis MIND Institute Intellectual and Developmental Disabilities Research Center (P50 HD103526) and the Cellular and Molecular Imaging Core’s CytoViva® Imaging system (S10 OD021789). The contents of this work do not necessarily represent the official views of the NIH, and the NIH does not endorse the purchase of any commercial products or services mentioned in this publication.
References
- Ajmani GS, Suh HH, Pinto JM. 2016. Effects of ambient air pollution exposure on olfaction: a review. Environ Health Perspect 124(11):1683–1693, PMID: 27285588, 10.1289/EHP136. [DOI] [PMC free article] [PubMed] [Google Scholar]
- Akhter H, Ballinger C, Liu N, van Groen T, Postlethwait EM, Liu RM. 2015. Cyclic ozone exposure induces gender-dependent neuropathology and memory decline in an animal model of Alzheimer’s disease. Toxicol Sci 147(1):222–234, PMID: 26116027, 10.1093/toxsci/kfv124. [DOI] [PMC free article] [PubMed] [Google Scholar]
- Austin CA, Hinkley GK, Mishra AR, Zhang Q, Umbreit TH, Betz MW, et al. 2016. Distribution and accumulation of 10 nm silver nanoparticles in maternal tissues and visceral yolk sac of pregnant mice, and a potential effect on embryo growth. Nanotoxicology 10(6):654–661, PMID: 26593872, 10.3109/17435390.2015.1107143. [DOI] [PubMed] [Google Scholar]
- Ban-Weiss GA, Lunden MM, Kirchstetter TW, Harley RA. 2010. Size-resolved particle number and volume emission factors for on-road gasoline and diesel motor vehicles. J Aerosol Sci 41(1):5–12, 10.1016/j.jaerosci.2009.08.001. [DOI] [Google Scholar]
- Berg E, Patten KT, Pride M, Petkova S, Pedersen L, Valenzuela A, et al. 2020. Developmental exposure to near roadway pollution produces behavioral phenotypes relevant to neurodevelopmental disorders in juvenile rats. Transl Psychiatry 10(1):289, PMID: 32807767, 10.1038/s41398-020-00978-0. [DOI] [PMC free article] [PubMed] [Google Scholar]
- Bhatt DP, Puig KL, Gorr MW, Wold LE, Combs CK. 2015. A pilot study to assess effects of long-term inhalation of airborne particulate matter on early Alzheimer-like changes in the mouse brain. PLoS One 10(5):e0127102, PMID: 25992783, 10.1371/journal.pone.0127102. [DOI] [PMC free article] [PubMed] [Google Scholar]
- Block ML, Calderón-Garcidueñas L. 2009. Air pollution: mechanisms of neuroinflammation and CNS disease. Trends in Neurosciences 32(9):506–516, PMID: 19716187, 10.1016/j.tins.2009.05.009. [DOI] [PMC free article] [PubMed] [Google Scholar]
- Bolduc DM, Montagna DR, Seghers MC, Wolfe MS, Selkoe DJ. 2016. The amyloid-beta forming tripeptide cleavage mechanism of γ-secretase. elife 5:e17578, PMID: 27580372, 10.7554/eLife.17578. [DOI] [PMC free article] [PubMed] [Google Scholar]
- Cacciottolo M, Morgan TE, Saffari AA, Shirmohammadi F, Forman HJ, Sioutas C, et al. 2020. Traffic-related air pollutants (TRAP-PM) promote neuronal amyloidogenesis through oxidative damage to lipid rafts. Free Radic Biol Med 147:242–251, PMID: 31883973, 10.1016/j.freeradbiomed.2019.12.023. [DOI] [PMC free article] [PubMed] [Google Scholar]
- Cacciottolo M, Wang X, Driscoll I, Woodward N, Saffari A, Reyes J, et al. 2017. Particulate air pollutants, APOE alleles and their contributions to cognitive impairment in older women and to amyloidogenesis in experimental models. Transl Psychiatry 7(1):e1022, PMID: 28140404, 10.1038/tp.2016.280. [DOI] [PMC free article] [PubMed] [Google Scholar]
- Calderón-Garcidueñas L, González-Maciel A, Mukherjee PS, Reynoso-Robles R, Pérez-Guillé B, Gayosso-Chávez C, et al. 2019b. Combustion- and friction-derived magnetic air pollution nanoparticles in human hearts. Environ Res 176:108567, PMID: 31344533, 10.1016/j.envres.2019.108567. [DOI] [PubMed] [Google Scholar]
- Calderón-Garcidueñas L, Herrera-Soto A, Jury N, Maher BA, Gonzalez-Maciel A, Reynoso-Robles R, et al. 2020. Reduced repressive epigenetic marks, increased DNA damage and Alzheimer’s disease hallmarks in the brain of humans and mice exposed to particulate urban air pollution. Environ Res 183:109226, PMID: 32045727, 10.1016/j.envres.2020.109226. [DOI] [PubMed] [Google Scholar]
- Calderón-Garcidueñas L, Reynoso-Robles R, González-Maciel A. 2019a. Combustion and friction-derived nanoparticles and industrial-sourced nanoparticles: the culprit of Alzheimer and Parkinson’s diseases. Environ Res 176:108574, PMID: 31299618, 10.1016/j.envres.2019.108574. [DOI] [PubMed] [Google Scholar]
- Calderón-Garcidueñas L, Villarreal-Ríos R. 2017. Living close to heavy traffic roads, air pollution, and dementia. Lancet 389(10070):675–677, PMID: 28063596, 10.1016/S0140-6736(16)32596-X. [DOI] [PubMed] [Google Scholar]
- CARB (The California Air Resources Board). N. D. Inhalable Particulate Matter and Health (PM2.5 and PM10). https://ww2.arb.ca.gov/resources/inhalable-particulate-matter-and-health [accessed 4 July 2020].
- Carosino CM, Bein KJ, Plummer LE, Castañeda AR, Zhao Y, Wexler AS, et al. 2015. Allergic airway inflammation is differentially exacerbated by daytime and nighttime ultrafine and submicron fine ambient particles: heme oxygenase-1 as an indicator of PM-mediated allergic inflammation. J Toxicol Environ Health A 78(4):254–266, PMID: 25679046, 10.1080/15287394.2014.959627. [DOI] [PubMed] [Google Scholar]
- Clougherty JE. 2010. A growing role for gender analysis in air pollution epidemiology. Environ Health Perspect 118(2):167–176, PMID: 20123621, 10.1289/ehp.0900994. [DOI] [PMC free article] [PubMed] [Google Scholar]
- Coburn JL, Cole TB, Dao KT, Costa LG. 2018. Acute exposure to diesel exhaust impairs adult neurogenesis in mice: prominence in males and protective effect of pioglitazone. Arch Toxicol 92(5):1815–1829, PMID: 29523932, 10.1007/s00204-018-2180-5. [DOI] [PMC free article] [PubMed] [Google Scholar]
- Cohen RM, Rezai-Zadeh K, Weitz TM, Rentsendorj A, Gate D, Spivak I, et al. 2013. A transgenic Alzheimer rat with plaques, tau pathology, behavioral impairment, oligomeric aβ, and frank neuronal loss. J Neurosci 33(15):6245–6256, PMID: 23575824, 10.1523/JNEUROSCI.3672-12.2013. [DOI] [PMC free article] [PubMed] [Google Scholar]
- Cole TB, Coburn J, Dao K, Roqué P, Chang YC, Kalia V, et al. 2016. Sex and genetic differences in the effects of acute diesel exhaust exposure on inflammation and oxidative stress in mouse brain. Toxicology 374:1–9, PMID: 27865893, 10.1016/j.tox.2016.11.010. [DOI] [PMC free article] [PubMed] [Google Scholar]
- Costa LG, Cole TB, Dao K, Chang YC, Coburn J, Garrick JM. 2020. Effects of air pollution on the nervous system and its possible role in neurodevelopmental and neurodegenerative disorders. Pharmacol Ther 210:107523, PMID: 32165138, 10.1016/j.pharmthera.2020.107523. [DOI] [PMC free article] [PubMed] [Google Scholar]
- Dickie BR, Vandesquille M, Ulloa J, Boutin H, Parkes LM, Parker GJM. 2019. Water-exchange MRI detects subtle blood-brain barrier breakdown in Alzheimer’s disease rats. Neuroimage 184:349–358, PMID: 30219292, 10.1016/j.neuroimage.2018.09.030. [DOI] [PubMed] [Google Scholar]
- Dunn AR, O’Connell KMS, Kaczorowski CC. 2019. Gene-by-environment interactions in Alzheimer’s disease and Parkinson’s disease. Neurosci Biobehav Rev 103:73–80, PMID: 31207254, 10.1016/j.neubiorev.2019.06.018. [DOI] [PMC free article] [PubMed] [Google Scholar]
- Edwards S, Zhao G, Tran J, Patten KT, Valenzuela A, Wallis C. 2020. Pathological cardiopulmonary evaluation of rats chronically exposed to traffic-related air pollution. Environ Health Perspect 128(12):127003, PMID: 33275451, 10.1289/EHP7045. [DOI] [PMC free article] [PubMed] [Google Scholar]
- Eid A, Mhatre I, Richardson JR. 2019. Gene-environment interactions in Alzheimer’s disease: a potential path to precision medicine. Pharmacol Ther 199:173–187, PMID: 30877021, 10.1016/j.pharmthera.2019.03.005. [DOI] [PMC free article] [PubMed] [Google Scholar]
- Fonken LK, Xu X, Weil ZM, Chen G, Sun Q, Rajagopalan S, et al. 2011. Air pollution impairs cognition, provokes depressive-like behaviors and alters hippocampal cytokine expression and morphology. Mol Psychiatry 16(10):987–995. 973, PMID: 21727897, 10.1038/mp.2011.76. [DOI] [PMC free article] [PubMed] [Google Scholar]
- Fonseca MI, Chu SH, Hernandez MX, Fang MJ, Modarresi L, Selvan P, et al. 2017. Cell-specific deletion of C1qa identifies microglia as the dominant source of C1q in mouse brain. J Neuroinflammation 14(1):48, PMID: 28264694, 10.1186/s12974-017-0814-9. [DOI] [PMC free article] [PubMed] [Google Scholar]
- Franklin M, Zeka A, Schwartz J. 2007. Association between PM2.5 and all-cause and specific-cause mortality in 27 US communities. J Expo Sci Environ Epidemiol 17(3):279–287, PMID: 17006435, 10.1038/sj.jes.7500530. [DOI] [PubMed] [Google Scholar]
- Fu P, Yung KKL. 2020. Air pollution and Alzheimer’s disease: a systematic review and Meta-Analysis. JAD 77(2):701–714, PMID: 32741830, 10.3233/JAD-200483. [DOI] [PubMed] [Google Scholar]
- Geller MD, Sardar SB, Phuleria H, Fine PM, Sioutas C. 2005. Measurements of particle number and mass concentrations and size distributions in a tunnel environment. Environ Sci Technol 39(22):8653–8663, PMID: 16323759, 10.1021/es050360s. [DOI] [PubMed] [Google Scholar]
- González-Maciel A, Reynoso-Robles R, Torres-Jardón R, Mukherjee PS, Calderón-Garcidueñas L. 2017. Combustion-derived nanoparticles in key brain target cells and organelles in young urbanites: culprit hidden in plain sight in Alzheimer’s disease development. JAD 59(1):189–208, PMID: 28598844, 10.3233/JAD-170012. [DOI] [PubMed] [Google Scholar]
- Greenberg SG, Davies P. 1990. A preparation of Alzheimer paired helical filaments that displays distinct tau proteins by polyacrylamide gel electrophoresis. Proc Natl Acad Sci USA 87(15):5827–5831, PMID: 2116006, 10.1073/pnas.87.15.5827. [DOI] [PMC free article] [PubMed] [Google Scholar]
- Greenberg SG, Davies P, Schein JD, Binder LI. 1992. Hydrofluoric acid-treated tau PHF proteins display the same biochemical properties as normal tau. J Biol Chem 267(1):564–569, PMID: 1370450, 10.1016/S0021-9258(18)48531-6. [DOI] [PubMed] [Google Scholar]
- Guillot-Sestier MV, Doty KR, Gate D, Rodriguez J, Jr., Leung BP, Rezai-Zadeh K, et al. 2015. Il10 deficiency rebalances innate immunity to mitigate Alzheimer-like pathology. Neuron 85(3):534–548, PMID: 25619654, 10.1016/j.neuron.2014.12.068. [DOI] [PMC free article] [PubMed] [Google Scholar]
- Haghani A, Cacciottolo M, Doty KR, D’Agostino C, Thorwald M, Safi N, et al. 2020b. Mouse brain transcriptome responses to inhaled nanoparticulate matter differed by sex and APOE in Nrf2-Nfkb interactions. elife 9:e54822, PMID: 32579111, 10.7554/eLife.54822. [DOI] [PMC free article] [PubMed] [Google Scholar]
- Haghani A, Johnson RG, Woodward NC, Feinberg JI, Lewis K, Ladd-Acosta C, et al. 2020c. Adult mouse hippocampal transcriptome changes associated with long-term behavioral and metabolic effects of gestational air pollution toxicity. Transl Psychiatry 10(1):218, PMID: 32636363, 10.1038/s41398-020-00907-1. [DOI] [PMC free article] [PubMed] [Google Scholar]
- Haghani A, Morgan TE, Forman HJ, Finch CE. 2020a. Air pollution neurotoxicity in the adult brain: emerging concepts from experimental findings. J Alzheimers Dis 76(3):773–797, PMID: 32538853, 10.3233/JAD-200377. [DOI] [PubMed] [Google Scholar]
- Hatami A, Albay R 3rd, Monjazeb S, Milton S, Glabe C. 2014. Monoclonal antibodies against Aβ42 fibrils distinguish multiple aggregation state polymorphisms in vitro and in Alzheimer disease brain. J Biol Chem 289(46):32131–32143, PMID: 25281743, 10.1074/jbc.M114.594846. [DOI] [PMC free article] [PubMed] [Google Scholar]
- Hong S, Beja-Glasser VF, Nfonoyim BM, Frouin A, Li S, Ramakrishnan S, et al. 2016. Complement and microglia mediate early synapse loss in Alzheimer mouse models. Science 352(6286):712–716, PMID: 27033548, 10.1126/science.aad8373. [DOI] [PMC free article] [PubMed] [Google Scholar]
- Hullmann M, Albrecht C, van Berlo D, Gerlofs-Nijland ME, Wahle T, Boots AW, et al. 2017. Diesel engine exhaust accelerates plaque formation in a mouse model of Alzheimer’s disease. Part Fibre Toxicol 14(1):35, PMID: 28854940, 10.1186/s12989-017-0213-5. [DOI] [PMC free article] [PubMed] [Google Scholar]
- Jankowsky JL, Slunt HH, Ratovitski T, Jenkins NA, Copeland NG, Borchelt DR. 2001. Co-expression of multiple transgenes in mouse CNS: a comparison of strategies. Biomol Eng 17(6):157–165, PMID: 11337275, 10.1016/s1389-0344(01)00067-3. [DOI] [PubMed] [Google Scholar]
- Jayaraj RL, Rodriguez EA, Wang Y, Block ML. 2017. Outdoor ambient air pollution and neurodegenerative diseases: the neuroinflammation hypothesis. Curr Environ Health Rep 4(2):166–179, PMID: 28444645, 10.1007/s40572-017-0142-3. [DOI] [PubMed] [Google Scholar]
- Jew K, Herr D, Wong C, Kennell A, Morris-Schaffer K, Oberdörster G, et al. 2019. Selective memory and behavioral alterations after ambient ultrafine particulate matter exposure in aged 3xTgAD Alzheimer’s disease mice. Part Fibre Toxicol 16(1):45, PMID: 31771615, 10.1186/s12989-019-0323-3. [DOI] [PMC free article] [PubMed] [Google Scholar]
- Johnson-Wood K, Lee M, Motter R, Hu K, Gordon G, Barbour R, et al. 1997. Amyloid precursor protein processing and a beta42 deposition in a transgenic mouse model of Alzheimer disease. Proc Natl Acad Sci USA 94(4):1550–1555, PMID: 9037091, 10.1073/pnas.94.4.1550. [DOI] [PMC free article] [PubMed] [Google Scholar]
- Joo IL, Lai AY, Bazzigaluppi P, Koletar MM, Dorr A, Brown ME, et al. 2017. Early neurovascular dysfunction in a transgenic rat model of Alzheimer’s disease. Sci Rep 7(1):46427, PMID: 28401931, 10.1038/srep46427. [DOI] [PMC free article] [PubMed] [Google Scholar]
- Kayed R, Head E, Sarsoza F, Saing T, Cotman CW, Necula M, et al. 2007. Fibril specific, conformation dependent antibodies recognize a generic epitope common to amyloid fibrils and fibrillar oligomers that is absent in prefibrillar oligomers. Mol Neurodegener 2(1):18, PMID: 17897471, 10.1186/1750-1326-2-18. [DOI] [PMC free article] [PubMed] [Google Scholar]
- Kilian J, Kitazawa M. 2018. The emerging risk of exposure to air pollution on cognitive decline and Alzheimer’s disease–Evidence from epidemiological and animal studies. Biomed J 41(3):141–162, PMID: 30080655, 10.1016/j.bj.2018.06.001. [DOI] [PMC free article] [PubMed] [Google Scholar]
- Kim H, Noh J, Noh Y, Oh SS, Koh SB, Kim C. 2019. Gender difference in the effects of outdoor air pollution on cognitive function among elderly in Korea. Front Public Health 7:375, PMID: 31921740, 10.3389/fpubh.2019.00375. [DOI] [PMC free article] [PubMed] [Google Scholar]
- Klocke C, Sherina V, Graham UM, Gunderson J, Allen JL, Sobolewski M, et al. 2018. Enhanced cerebellar myelination with concomitant iron elevation and ultrastructural irregularities following prenatal exposure to ambient particulate matter in the mouse. Inhal Toxicol 30(9–10):1–16, PMID: 30572762, 10.1080/08958378.2018.1533053. [DOI] [PMC free article] [PubMed] [Google Scholar]
- Kunkle BW, Grenier-Boley B, Sims R, Bis JC, Damotte V, Naj AC, et al. 2019. Genetic Meta-analysis of diagnosed Alzheimer’s disease identifies new risk loci and implicates aβ, tau, immunity and lipid processing. Nat Genet 51(3):414–430, PMID: 30820047, 10.1038/s41588-019-0358-2. [DOI] [PMC free article] [PubMed] [Google Scholar]
- Kuykendall JR, Shaw SL, Paustenbach D, Fehling K, Kacew S, Kabay V. 2009. Chemicals present in automobile traffic tunnels and the possible community health hazards: a review of the literature. Inhal Toxicol 21(9):747–792, PMID: 19555229, 10.1080/08958370802524357. [DOI] [PubMed] [Google Scholar]
- Lai AY, McLaurin J. 2012. Clearance of amyloid-beta peptides by microglia and macrophages: the issue of what, when and where. Future Neurol 7(2):165–176, PMID: 22737039, 10.2217/fnl.12.6. [DOI] [PMC free article] [PubMed] [Google Scholar]
- Lambert JC, Ibrahim-Verbaas CA, Harold D, Naj AC, Sims R, Bellenguez C, et al. 2013. Meta-analysis of 74,046 individuals identifies 11 new susceptibility loci for Alzheimer’s disease. Nat Genet 45(12):1452–1458, PMID: 24162737, 10.1038/ng.2802. [DOI] [PMC free article] [PubMed] [Google Scholar]
- Levesque S, Surace MJ, McDonald J, Block ML. 2011a. Air pollution & the brain: subchronic diesel exhaust exposure causes neuroinflammation and elevates early markers of neurodegenerative disease. J Neuroinflammation 8:105, PMID: 21864400, 10.1186/1742-2094-8-105. [DOI] [PMC free article] [PubMed] [Google Scholar]
- Levesque S, Taetzsch T, Lull ME, Kodavanti U, Stadler K, Wagner A, et al. 2011b. Diesel exhaust activates and primes microglia: air pollution, neuroinflammation, and regulation of dopaminergic neurotoxicity. Environ Health Perspect 119(8):1149–1155, PMID: 21561831, 10.1289/ehp.1002986. [DOI] [PMC free article] [PubMed] [Google Scholar]
- Li Y, Zhou W, Tong Y, He G, Song W. 2006. Control of APP processing and Abeta generation level by BACE1 enzymatic activity and transcription. FASEB J 20(2):285–292, PMID: 16449801, 10.1096/fj.05-4986com. [DOI] [PubMed] [Google Scholar]
- Maher BA, Ahmed IA, Karloukovski V, MacLaren DA, Foulds PG, Allsop D, et al. 2016. Magnetite pollution nanoparticles in the human brain. Proc Natl Acad Sci USA 113(39):10797–10801, PMID: 27601646, 10.1073/pnas.1605941113. [DOI] [PMC free article] [PubMed] [Google Scholar]
- Meyer JN, Lord CA, Yang XY, Turner EA, Badireddy AR, Marinakos SM, et al. 2010. Intracellular uptake and associated toxicity of silver nanoparticles in Caenorhabditis elegans. Aquat Toxicol 100(2):140–150, PMID: 20708279, 10.1016/j.aquatox.2010.07.016. [DOI] [PubMed] [Google Scholar]
- Miller MR, Raftis JB, Langrish JP, McLean SG, Samutrtai P, Connell SP, et al. 2017. Inhaled nanoparticles accumulate at sites of vascular disease. ACS Nano 11(5):4542–4552, PMID: 28443337, 10.1021/acsnano.6b08551. [DOI] [PMC free article] [PubMed] [Google Scholar]
- Montagne A, Barnes SR, Sweeney MD, Halliday MR, Sagare AP, Zhao Z, et al. 2015. Blood-brain barrier breakdown in the aging human hippocampus. Neuron 85(2):296–302, PMID: 25611508, 10.1016/j.neuron.2014.12.032. [DOI] [PMC free article] [PubMed] [Google Scholar]
- Morrone CD, Bazzigaluppi P, Beckett TL, Hill ME, Koletar MM, Stefanovic B, et al. 2020. Regional differences in Alzheimer’s disease pathology confound behavioural rescue after amyloid-beta attenuation. Brain 143(1):359–373, PMID: 31782760, 10.1093/brain/awz371. [DOI] [PMC free article] [PubMed] [Google Scholar]
- Naj AC, Schellenberg GD, Alzheimer’s Disease Genetics Consortium. 2017. Genomic variants, genes, and pathways of Alzheimer’s disease: an overview. Am J Med Genet B Neuropsychiatr Genet 174(1):5–26, PMID: 27943641, 10.1002/ajmg.b.32499. [DOI] [PMC free article] [PubMed] [Google Scholar]
- Ning Z, Sioutas C. 2010. Atmospheric processes influencing aerosols generated by combustion and the inference of their impact on public exposure: a review. Aerosol Air Qual Res 10(1):43–58, 10.4209/aaqr.2009.05.0036. [DOI] [Google Scholar]
- Oberdörster G, Sharp Z, Atudorei V, Elder A, Gelein R, Kreyling W, et al. 2004. Translocation of inhaled ultrafine particles to the brain. Inhal Toxicol 16(6–7):437–445, PMID: 15204759, 10.1080/08958370490439597. [DOI] [PubMed] [Google Scholar]
- Oberdörster G, Utell MJ. 2002. Ultrafine particles in the urban air: to the respiratory tract–and beyond? Environ Health Perspect 110(8):A440–A441, PMID: 12153769, 10.1289/ehp.110-1240959. [DOI] [PMC free article] [PubMed] [Google Scholar]
- Patten KT, González EA, Valenzuela A, Berg E, Wallis C, Garbow JR, et al. 2020. Effects of early life exposure to traffic-related air pollution on brain development in juvenile Sprague-Dawley rats. Transl Psychiatry 10(1):166, PMID: 32483143, 10.1038/s41398-020-0845-3. [DOI] [PMC free article] [PubMed] [Google Scholar]
- Peters R, Ee N, Peters J, Booth A, Mudway I, Anstey KJ. 2019. Air pollution and dementia: a systematic review. J Alzheimers Dis 70(s1):S145–S163, PMID: 30775976, 10.3233/JAD-180631. [DOI] [PMC free article] [PubMed] [Google Scholar]
- Plummer LE, Carosino CM, Bein KJ, Zhao Y, Willits N, Smiley-Jewell S, et al. 2015. Pulmonary inflammatory effects of source-oriented particulate matter from California’s San Joaquin Valley. Atmos Environ 119:174–181, PMID: 26568698, 10.1016/j.atmosenv.2015.08.043. [DOI] [PMC free article] [PubMed] [Google Scholar]
- Rahman A, Schelbaum E, Hoffman K, Diaz I, Hristov H, Andrews R, et al. 2020. Sex-driven modifiers of Alzheimer risk: a multimodality brain imaging study. Neurology 95(2):e166–e178, PMID: 32580974, 10.1212/WNL.0000000000009781. [DOI] [PMC free article] [PubMed] [Google Scholar]
- Rostagno A, Ghiso J. 2009. Isolation and biochemical characterization of amyloid plaques and paired helical filaments. Curr Protoc Cell Biol 44:3.33.1–3.33.33, PMID: 19731227, 10.1002/0471143030.cb0333s44. [DOI] [PMC free article] [PubMed] [Google Scholar]
- Russ TC, Reis S, van Tongeren M. 2019. Air pollution and brain health: defining the research agenda. Curr Opin Psychiatry 32(2):97–104, PMID: 30543549, 10.1097/YCO.0000000000000480. [DOI] [PubMed] [Google Scholar]
- Sala Frigerio C, Wolfs L, Fattorelli N, Thrupp N, Voytyuk I, Schmidt I, et al. 2019. The major risk factors for Alzheimer’s disease: age, sex, and genes modulate the microglia response to aβ plaques. Cell Rep 27(4):1293–1306, PMID: 31018141, 10.1016/j.celrep.2019.03.099. [DOI] [PMC free article] [PubMed] [Google Scholar]
- Smith NM, Gachulincova I, Ho D, Bailey C, Bartlett CA, Norret M, et al. 2016. An unexpected transient breakdown of the blood brain barrier triggers passage of large intravenously administered nanoparticles. Sci Rep 6:22595, PMID: 26940762, 10.1038/srep22595. [DOI] [PMC free article] [PubMed] [Google Scholar]
- SoRelle ED, Liba O, Campbell JL, Dalal R, Zavaleta CL, de la Zerda A. 2016. A hyperspectral method to assay the microphysiological fates of nanomaterials in histological samples. elife 5:e16352, PMID: 27536877, 10.7554/eLife.16352. [DOI] [PMC free article] [PubMed] [Google Scholar]
- Stephan AH, Madison DV, Mateos JM, Fraser DA, Lovelett EA, Coutellier L, et al. 2013. A dramatic increase of C1q protein in the CNS during normal aging. J Neurosci 33(33):13460–13474, PMID: 23946404, 10.1523/JNEUROSCI.1333-13.2013. [DOI] [PMC free article] [PubMed] [Google Scholar]
- Tambini MD, Norris KA, D’Adamio L. 2020. Opposite changes in APP processing and human Aβ levels in rats carrying either a protective or a pathogenic APP mutation. eLife 9:e52612, PMID: 32022689, 10.7554/eLife.52612. [DOI] [PMC free article] [PubMed] [Google Scholar]
- Tremblay ME, Stevens B, Sierra A, Wake H, Bessis A, Nimmerjahn A. 2011. The role of microglia in the healthy brain. J Neurosci 31(45):16064–16069, PMID: 22072657, 10.1523/JNEUROSCI.4158-11.2011. [DOI] [PMC free article] [PubMed] [Google Scholar]
- van der Kant R, Goldstein LSB, Ossenkoppele R. 2020. Amyloid-beta-independent regulators of tau pathology in Alzheimer disease. Nat Rev Neurosci 21(1):21–35, PMID: 31780819, 10.1038/s41583-019-0240-3. [DOI] [PubMed] [Google Scholar]
- Venegas C, Kumar S, Franklin BS, Dierkes T, Brinkschulte R, Tejera D, et al. 2017. Microglia-derived ASC specks cross-seed amyloid-beta in Alzheimer’s disease. Nature 552(7685):355–361, PMID: 29293211, 10.1038/nature25158. [DOI] [PubMed] [Google Scholar]
- Villa A. 2018. Sex-specific features of microglia from adult mice. Cell Rep 23(12):3501–3511, PMID: 29924994, 10.1016/j.celrep.2018.05.048. [DOI] [PMC free article] [PubMed] [Google Scholar]
- Win-Shwe TT, Fujimaki H. 2011. Nanoparticles and neurotoxicity. Int J Mol Sci 12(9):6267–6280, PMID: 22016657, 10.3390/ijms12096267. [DOI] [PMC free article] [PubMed] [Google Scholar]
- Win-Shwe TT, Fujimaki H, Fujitani Y, Hirano S. 2012. Novel object recognition ability in female mice following exposure to nanoparticle-rich diesel exhaust. Toxicol Appl Pharmacol 262(3):355–362, PMID: 22659509, 10.1016/j.taap.2012.05.015. [DOI] [PubMed] [Google Scholar]
- Woodward NC, Levine MC, Haghani A, Shirmohammadi F, Saffari A, Sioutas C, et al. 2017a. Toll-like receptor 4 in glial inflammatory responses to air pollution in vitro and in vivo. J Neuroinflammation 14(1):84, PMID: 28410596, 10.1186/s12974-017-0858-x. [DOI] [PMC free article] [PubMed] [Google Scholar]
- Woodward NC, Pakbin P, Saffari A, Shirmohammadi F, Haghani A, Sioutas C, et al. 2017b. Traffic-related air pollution impact on mouse brain accelerates myelin and neuritic aging changes with specificity for CA1 neurons. Neurobiol Aging 53:48–58, PMID: 28212893, 10.1016/j.neurobiolaging.2017.01.007. [DOI] [PMC free article] [PubMed] [Google Scholar]
- Yan W, Yun Y, Ku T, Li G, Sang N. 2016. NO2 inhalation promotes Alzheimer’s disease-like progression: cyclooxygenase-2-derived prostaglandin E2 modulation and monoacylglycerol lipase inhibition-targeted medication. Sci Rep 6:22429, PMID: 26928013, 10.1038/srep22429. [DOI] [PMC free article] [PubMed] [Google Scholar]
- Zhu F, Nair RR, Fisher EMC, Cunningham TJ. 2019. Humanising the mouse genome piece by piece. Nature Commun 10(1):1845, PMID: 31015419, 10.1038/s41467-019-09716-7. [DOI] [PMC free article] [PubMed] [Google Scholar]
Associated Data
This section collects any data citations, data availability statements, or supplementary materials included in this article.