

SUMMARY
Regulation of biological processes typically incorporate mechanisms that both initiate and terminate the process and, where understood, these mechanisms often involve feedback control. Regulation of transcription is a fundamental cellular process where the mechanisms involved in initiation have been studied extensively but those involved in arresting the process are poorly understood. Modeling of the potential roles of RNA in transcriptional control suggested a non-equilibrium feedback control mechanism wherein low levels of RNA promote condensates formed by electrostatic interactions whereas relatively high levels promote dissolution of these condensates. Evidence from both in vitro and in vivo experiments support the model that RNAs produced during early steps in transcription initiation stimulate condensate formation whereas the burst of RNAs produced during elongation stimulate condensate dissolution. We propose that transcriptional regulation incorporates a feedback mechanism whereby transcribed RNAs initially stimulate but then ultimately arrest the process.
Keywords: Transcription, non-equilibrium, RNA, feedback, phase separation, mediator, complex coacervates, transcriptional condensates, noncoding RNA, enhancer
eTOC/In brief:
During the early steps of transcription initiation nascent RNAs stimulate transcriptional condensate formation whereas the burst of RNAs produced during elongation stimulate condensate dissolution.
Graphical Abstract
INTRODUCTION
Diverse biological processes have evolved feedback mechanisms to enable both positive and negative regulation. Examples of biological processes that are known to incorporate feedback regulation include signal transduction (Brandman and Meyer, 2008), production of RNA splicing factors (Jangi and Sharp, 2014), circadian rhythms (Dunlap, 1999), red blood cell production (Ebert and Bunn, 1999), and response to DNA damage (Lahav et al., 2004). In transcription, some factors that regulate amino acid biosynthetic pathway genes can be allosterically regulated by intermediates produced by those pathways (Bergot et al., 1992; Bruhat et al., 2000; Sellick and Reece, 2003), but a general feedback mechanism has not been described. Evidence that feedback control is often mediated by the product of the process (Brandman and Meyer, 2008; Elowitz and Leibler, 2000; Gardner et al., 2000; Monod and Jacob, 1961; Umbarger, 1956) is one of the factors that led us to postulate that RNA may regulate transcription by a feedback mechanism.
Mammalian transcription produces diverse RNA species from regulatory elements and genes (Smith et al., 2019) and transcription of genes occurs in bursts of RNA synthesis (Chubb et al., 2006; Raj and van Oudenaarden, 2008; Raj et al., 2006). Transcription factors and coactivators recruit RNA polymerase II (Pol II) to enhancer and promoter elements, where short (20–400 bp) RNAs are bidirectionally transcribed before Pol II pauses (Adelman and Lis, 2012; Core and Adelman, 2019; Jin et al., 2017; Kim et al., 2010; Seila et al., 2008). These RNA species are short-lived and are reported to have various regulatory roles, although there isn’t yet a consensus on their functions (Andersson et al., 2014; Catarino and Stark, 2018; Core et al., 2014; Gardini and Shiekhattar, 2015; Henriques et al., 2018; Lai et al., 2013; Li et al., 2016; Mikhaylichenko et al., 2018; Nair et al., 2019; Pefanis et al., 2015; Rahnamoun et al., 2018; Schaukowitch et al., 2014; Scruggs et al., 2015; Sigova et al., 2015; Smith et al., 2019; Struhl, 2007). Pol II pause release leads to processive elongation, which occurs in periodic bursts (~1–10 minutes in duration), where multiple molecules of Pol II can be released from promoters within a short timeframe and produce multiple molecules of mRNA (~1–100 molecules per burst) (Cisse et al., 2013; Fukaya et al., 2016; Larsson et al., 2019). How and whether the diverse RNA species produced during transcription – which differ in length, half-life, and number – impact regulate transcription is currently unclear.
Recent studies have shown that transcriptional condensates can compartmentalize and concentrate large numbers of transcription factors, cofactors and Pol II at super-enhancers, which are clusters of enhancers that regulate genes with prominent roles in cell identity (Boija et al., 2018; Cho et al., 2018; Cramer, 2019; Hnisz et al., 2017; Sabari et al., 2018). The component enhancer elements of such genes promote transcriptional condensate formation by crowding transcription factors and Mediator at densities above sharply defined thresholds for condensate formation (Shrinivas et al., 2019). Transcriptional condensates are highly dynamic and can be observed in live cells to form and dissolve at timescales ranging from seconds to minutes (Cho et al., 2018). The periodic formation and dissolution of dynamic transcriptional condensates, coupled with evidence that different species and levels of RNAs are produced at different stages of transcription led us to wonder whether transcriptional condensates are regulated by a non-equilibrium feedback mechanism mediated by its RNA product.
RNA molecules are components of, and play regulatory roles in, diverse biomolecular condensates. These include the nucleolus, nuclear speckles, paraspeckles, and stress granules (Fay and Anderson, 2018; Roden and Gladfelter, 2020; Sabari et al., 2020; Strom and Brangwynne, 2019). RNA has a high negative charge density due to its phosphate backbone, and the effective charge of a given RNA molecule is directly proportional to its length (Boeynaems et al., 2019). Condensates are thought to be formed by an ensemble of low-affinity molecular interactions, including electrostatic interactions, and RNA can be a powerful regulator of condensates that are formed and maintained by electrostatic forces (Banani et al., 2017; Maharana et al., 2018; Peran and Mittag, 2020; Shin and Brangwynne, 2017). Indeed, RNA has been shown to enter and modify the properties of simple condensates formed by polyelectrolyte-rich molecules (Drobot et al., 2018; Frankel et al., 2016; Mountain and Keating, 2020). In a phenomenon called complex coacervation, a type of liquid-liquid phase separation mediated by electrostatic interactions between oppositely charged polyelectrolytes, low levels of RNA can enhance condensate formation whereas high levels can cause their dissolution (Lin et al., 2019; Overbeek and Voorn, 1957; Sing, 2017; Srivastava and Tirrell, 2016). Condensate formation and subsequent dissolution with increasing RNA concentration is an example of reentrant phase behavior, which is driven by favorable opposite-charge interactions at low RNA concentrations (formation) and repulsive like-charge interactions at high RNA concentrations (dissolution) (Banerjee et al., 2017; Milin and Deniz, 2018). We wondered whether such a reentrant equilibrium phase behavior coupled to the non-equilibrium processes that occur during transcription could regulate transcriptional output.
By combining physics-based modeling and experimental analysis, we propose and test a model whereby the products of transcription initiation stimulate condensate formation and those of a burst of elongation stimulate condensate dissolution. We provide experimental evidence that physiological RNA levels can enhance or dissolve transcriptional condensates. These results provide a mechanism by which the products of transcription regulate condensate behaviors and thus transcription, and suggest that this non-equilibrium process provides negative feedback to dissolve the transcriptional condensates that support initiation and thereby arrest transcription.
RESULTS
Low levels of RNA enhance and high levels dissolve Mediator condensates
To explore the potential role of RNA in regulating transcriptional condensates, we sought to estimate the number and effective charge of RNA and protein molecules in a typical transcriptional condensate at different stages of transcription. In early stages of transcription, low levels of small noncoding RNAs are produced by Pol II at enhancers and promoter-proximal regions (Figure S1A) (Adelman and Lis, 2012; Core and Adelman, 2019; Kim et al., 2010; Seila et al., 2008). During pause release, Pol II produces longer genic RNAs during bursts of transcription elongation (Figure S1A) (Adelman and Lis, 2012; Core and Adelman, 2019). These protein- and RNA-rich states can be thought of as mixtures of poly-electrolytes that may undergo complex coacervation (Figure 1A) (Lin et al., 2019; Overbeek and Voorn, 1957; Sing, 2017; Srivastava and Tirrell, 2016). We reasoned that this phenomenon is likely to be relevant to transcriptional condensates because electrostatic interactions contribute to the formation of these condensates, even in the absence of RNA (Boija et al., 2018; Sabari et al., 2020). Complex coacervate formation through phase separation is promoted when polyelectrolytes are present at concentrations where their net charges are approximately balanced. When the concentration of a poly-electrolyte, such as RNA, becomes sufficiently high, the domination of repulsive like-charge interactions can suppress phase separation (Banerjee et al., 2017; Lin et al., 2019; Milin and Deniz, 2018; Muthukumar, 2016; Overbeek and Voorn, 1957; Zhang et al., 2018). Thus, at constant protein concentration, titrating RNA levels results in reentrant phase behavior, by which low RNA levels promote and high RNA levels suppress condensate formation (Figure 1A) (Banerjee et al., 2017; Milin and Deniz, 2018; Zhang et al., 2018). We wondered whether the reentrant phase behavior might apply to the regulation of transcriptional condensates during transcription. Because the quantities of the diverse RNA species and proteins present in transcriptional condensates in populations of cells can be estimated (Figure S1, STAR Methods), it is possible to conduct experimental tests to determine whether reentrant phase behavior occurs under physiologically-relevant conditions of these molecules.
Figure 1. Low levels of RNA enhance and high levels dissolve Mediator condensates.

A. Diagram of reentrant phase transition in response to increasing concentration of RNA over constant protein concentration. The condensed fraction of protein peaks at the RNA concentration at which the charges between protein and RNA are balanced, while alteration of this charge balance in either direction decreases the condensed fraction.
B. Experimental design for in vitro droplet formation assay. Whole Mediator complex is mixed with increasing concentrations of RNA under physiologically-relevant buffer conditions and droplets are imaged under confocal microscopy.
C. Representative images of droplets formed by the unlabeled whole Mediator complex (200 nM) and Cy5-labeled Pou5f1 enhancer RNA at increasing concentrations (0–400 nM). Brightfield images of the Mediator complex were divided by a median-filtered image (px=15) here and the subsequent panels.
D. Droplet sizes in (C).
E. Partition ratios of Cy5-labeled RNA within the droplets in (C).
F. Representative images of droplets formed by the unlabeled whole Mediator complex (200 nM) and Cy5-labeled Trim28 enhancer RNA at increasing concentrations (0–400 nM).
G. Droplet sizes in (F).
H. Partition ratios of Cy5-labeled RNA within the droplets in (F). See also Figure S1
As an initial test of whether low levels of RNA stimulate transcriptional condensate formation while high levels of RNA favor condensate dissolution, we used an in vitro droplet assay (Figure 1B). Using components at physiologically-relevant conditions, we investigated whether an enhancer RNA transcribed from the Trim28 super-enhancer, which has previously been shown to form a transcriptional condensate in living cells (Boija et al., 2018; Guo et al., 2019), influences condensate formation by purified Mediator complex. Measurement of enhancer RNA levels in cells indicated that ~0.2 molecules of this enhancer RNA exist at steady-state in murine embryonic stem cells (mESCs) (Figure S1F). Given that multiple loci in a super-enhancer are transcribed into enhancer RNAs, this roughly corresponds to ~100–1000 nM of RNA in a typical Mediator condensate in cells (STAR Methods). These condensates typically contain Mediator at a concentration of around 1–20 μM (STAR Methods). The results showed dose-dependent effect on the size of Mediator/RNA droplets that addition of 6–400 nM Trim28 enhancer RNA to 200 nM purified Mediator complex had a (Figures 1C-1E). Droplet sizes peaked at 100 nM RNA (Figure 1D) and the measured by the ratio of average intensity inside versus outside the droplet (partition ratio), followed a similar trend (Figure 1E). Similar results were obtained using an enhancer RNA relative enrichment of RNA in the droplets, as transcribed from the Pou5f1 super-enhancer (Figures 1F-1H). Thus, within the range of physiological levels observed in cells, low levels of RNA can enhance condensate formation and high levels of RNA can reduce condensate formation by Mediator in vitro.
Charge balance mediates the regulation of MED1-IDR condensates by RNA
We next sought t to do determine whether the reentrant phase behavior of mixtures of RNA and transcriptional proteins is predominantly regulated by charge balance considerations, with other types of RNA-protein interactions playing a less significant role. We performed in vitro droplet assays (Figure 2A) using the MED1 C-terminal intrinsically disordered region (MED1IDR), which has proven to be a useful surrogate for the multisubunit Mediator complex, as it is not possible to purify sufficient amounts of this complex to test all the parameters of interest (Boija et al., 2018; Guo et al., 2019; Klein et al., 2020; Li et al., 2020; Sabari et al., 2018; Shrinivas et al., 2019; Zamudio et al., 2019). The fusion of GFP to MED1-IDR allows quantification by fluorescence of a single species whose effective charge can be calculated to determine the charge ratio between protein and RNA. Addition of increasing levels of RNA to a constant protein concentration should have predictable effects on the partitioning of either component according to their charge ratio (Figure 2B). Noncoding and coding RNAs produced from three different super-enhancer loci and their associated genes (Trim28, Pou5f1, Nanog; Figure S1) were selected for this analysis based on prior studies of nascent RNA sequencing data in mESCs (Boija et al., 2018; Guo et al., 2019; Sabari et al., 2018; Sigova et al., 2015; Whyte et al., 2013). Addition of 6–400 nM of each of these RNAs to 1000 nM MED1-IDR (protein:RNA ratios = 167 to 2.5) stimulated formation of MED1-IDR condensates at low RNA concentrations and dissolved MED1-IDR condensates at higher RNA concentrations (Figures 2C, 2D, S2A, and S2B). BRD4 is another key component of transcriptional condensates and BRD4-IDR protein exhibits condensate behaviors very similar to those of MED1-IDR (Sabari et al., 2018); the effects of increasing RNA levels on formation and dissolution of BRD4-IDR condensates were very similar to those observed for MED1-IDR (Figures S2C and S2D). RNA did not stimulate formation of droplets with GFP alone or OCT4-GFP, both of which have a net negative charge (Figure S2E). Condensates exhibited internal dynamical reorganization (Figure S2F) with apparent diffusion coefficients 3–5 ± 0.8 × 10⁻² μm2/s (STAR Methods), consistent with liquid-like behavior (Nott et al., 2015; Sabari et al., 2018; Taylor et al., 2019). The incomplete recovery after photobleaching seen here has been observed previously with other condensates (Nott et al., 2015; Sabari et al., 2018; Taylor et al., 2019) and could result from a small portion of the droplet material being relatively immobile, rate-limiting material in the dilute phase or droplet aging (Taylor et al., Biophysical Journal 2019). These results show that diverse RNAs are capable of stimulating MED1-IDR condensate formation when present at relatively low levels and dissolving MED1-IDR condensates at high levels.
Figure 2. Charge balance mediates the regulation of MED1-IDR condensates by RNA.

A. Experimental design for in vitro droplet formation assay. Soluble MED1-IDR-GFP is mixed with increasing concentrations of RNA under physiologically relevant buffer conditions and droplets are imaged with confocal microscopy.
B. Scheme of charge balance ratio between constant protein concentration and increasing RNA concentration.
C. Representative images of droplets formed by increasing concentrations (0–400 nM) of the indicated RNAs mixed with 1 μM of MED1-IDR-GFP.
D. Partition ratios of MED1-IDR-GFP within the droplets in (C) (left y-axis). Charge balance ratios between MED1-IDR-GFP and increasing concentrations of the indicated RNAs are shown in blue lines (right y-axis). Correlation between partition ratio and charge balance is determined by Pearson correlation (r).
See also Figures S2, S3 and S4
We sought to further test whether charge balance is the predominant phenomenon underlying the RNA-mediated effects on MED1-IDR condensates (STAR Methods). If so, MED1-IDR/RNA condensate formation should be enhanced when the protein and RNA polymers are balanced in charge, and they should be sensitive to disruption of this balance. We quantified the relative charge of RNA and MED1-IDR and computed the correlation with the partition ratio of MED1-IDR (STAR Methods). RNA-mediated effects on MED1-IDR condensates correlated with their charge balance, as observed by the concordance of higher partition ratios near charge balance and lower partition ratios away from this balance (Figure 2D). We would expect an RNA length-dependent shift in the RNA level required for peak MED1-IDR partitioning when RNAs of different length are introduced into the droplet assay in equal numbers. This expectation that a higher concentration of shorter RNAs is needed to disrupt condensate formation was observed (Figures S3A and S3B). Another prediction from charge balance considerations is that these interactions should be largely independent of RNA sequence, so antisense versions of any one of the RNA species should exhibit the same quantitative effects as the sense strand, and this was also observed (Figures S3B and S3C). Consistent with charge balance considerations, MED1-IDR condensates formed with RNA were sensitive to increasing monovalent salt, which screens charged interactions (Figure S3D). The expectations from charge balance considerations also held when MED1-IDR and RNA concentrations were varied (Figures S4A-S4D), and when alternative polyanions (heparin and ssDNA) were employed (Figures S4E and S4F). RNA did not stimulate condensate formation by a MED1-IDR mutant lacking positively-charged residues (MED1-IDR RHK>A) (Figures S4G and S4H). While the experiments described above show a strong correlation between charge balance and partition ratios, the lack of complete correlation suggests that other features of RNA and MED1-IDR, such as RNA secondary structure (Roden & Gladfelter, 2020) or non-electrostatic interactions (Sabari et al. 2018), may influence the observed phase behavior. Nonetheless, these results further support the concept that RNA-mediated effects on equilibrium behavior of MED1-IDR condensates are predominantly regulated by electrostatic effects.
RNA-mediated effects on condensates in reconstituted in vitro transcription assays
We sought to investigate the functional consequence of the RNA-mediated reentrant phase behavior on transcription. Pol II-dependent transcription can be reconstituted in vitro with purified components (Roeder, 2019), so we investigated whether droplets containing transcriptional components are formed in these assays and if conditions that alter droplet levels similarly alter transcriptional output. We used a classical reconstituted mammalian transcription system with purified components, including Pol II, general transcription factors, Mediator and a transcriptional activator (Gal4), where addition of nucleotides permits transcription of a linear DNA template (Figure 3A). We observed that component mixtures and buffer conditions that are optimal for transcriptional output (Carey et al., 2009; Flores et al., 1992; LeRoy et al., 2008; Orphanides et al., 1998) produced droplets containing the DNA template (Figure 3B). Quantification of the newly synthesized RNA in this system showed that 3.5 (± 0.5) pM RNA was produced in the transcription reaction (STAR Methods). We were unable to demonstrate that RNA synthesis actually occurs within the droplets because we cannot eliminate the possibility that synthesis occurs in the bulk phase and the product subsequently partitions into the droplet, but the observation that protein and template DNA concentrate in droplets under conditions optimal for transcription (Figure 3B), and evidence that diverse condensate-altering treatments have similar effects on transcription, described below, is consistent with the notion that transcription occurs within condensates in this reconstituted system.
Figure 3. RNA-mediated effects on condensates in reconstituted in vitro transcription assays.

A. Cartoon representation of the reconstituted in vitro mammalian transcription assay with purified components (left) and the design of the assay (right) (STAR Methods).
B. Brightfield images of droplets formed within the in vitro transcription reaction. Droplets are stained with DNA dye (Hoechst). Brightfield images were white tophat filtered and smoothed here and in the subsequent panels (STAR Methods).
C. Brightfield images of droplets formed within the in vitro transcription reaction performed in the presence of indicated spermine concentrations. Template DNA is labeled with Cy3.
D. Droplet sizes in (C) (p=0.0011, Student’s t-test).
E. Partition ratio of Cy3-labeled template DNA into the droplets in (C) (p<0.0001, Student’s t-test).
F. qRT-PCR of transcriptional output upon addition of spermine. The values are normalized to the no spermine condition. The mean of 2 replicates are shown and error bars depict S.D. (p=0.0477, Student’s t-test).
G. Representative images of droplets in the in vitro transcription reaction in the presence of indicated amounts of exogenous RNA.
H. Droplet sizes in (G) (p=0.9309 0 vs. 10; p<0.001 for 0 vs. 50, 250, and 500, one-way ANOVA).
I. qRT-PCR of transcriptional output upon addition of increasing concentration of exogenous RNA. The values are normalized to no RNA condition. The mean of 2 replicates are shown and error bars depict S.D. (p=0.0001 GTP only vs. 0; p=0.0111 0 vs. 10; p=0.0013 0 vs. 50; p=0.0008 0 vs. 250; p=0.008 0 vs. 500, one-way ANOVA).
See also Figure S5
We reasoned that if transcription and droplet formation are mutually dependent in the reconstituted system, then treatments that alter transcription should similarly impact condensate formation and vice versa. The addition to the reaction of various chemicals that are known to inhibit transcription (elevated concentrations of NTPs, NaCl, or heparin) (Carey et al., 2009; Reinberg and Roeder, 1987), caused reductions in droplet area, DNA partitioning and transcription (Figure S5). Spermine, a positively-charged polyamine, will enhance droplet formation when it contributes to charge balance in coacervate models (Aumiller et al., 2016). Addition of spermine at concentrations predicted to b balance charge in the in vitro reactions simultaneously increased droplet area, partitioning of template DNA, and levels of RNA synthesis (Figures 3C-3F, Table S2) (Blair, 1985; Moruzzi et al., 1975). These correlations suggest that optimal droplet formation and transcription are co-dependent.
An expectation of the RNA-feedback model is that droplets in the reconstituted system might ultimately produce enough RNA to cause a reduction in droplet size and transcriptional output. However, the low concentrations of RNA produced in these systems (3.5 ± 0.5 pM, STAR Methods) are insufficient to dissolve the droplets. For this reason, we tested whether purified RNA, added to the reaction, would similarly impact droplets and transcription. Indeed, addition of exogenous RN A reduced the number and size of the droplets (Figures 3G and 3H) and reduced template-derived RNA synthesis as measured by qRT-PCR (Figure 3I). While these results do not rule out additional ways in which RNA may affect transcription (Pai et al., 2014), they are consistent with the expected behavior of transcriptional condensates if RNA contributes to negative feedback control.
A model for RNA-mediated non-equilibrium feedback control of transcriptional condensates
The in vitro experiments, which provide evidence that key transcriptional proteins and RNA exhibit an electrostatics-driven, RNA-protein ratio dependent, reentrant phase transition, were performed under equilibrium conditions (Figures 1 and 2). However, in vivo, RNA is synthesized and degraded at specific genomic loci by dynamic, ATP-dependent, non-equilibrium processes (Azofeifa et al., 2018; Li et al., 2016; Pefanis et al., 2015). To investigate how non-equilibrium processes underlying transcription may regulate transcriptional condensates, we built a physics-based model. The model consists of two inter-linked parts: (1) A free-energy function (Figure 4A), which depends on the concentrations of transcriptional proteins and RNA, that recapitulates the equilibrium reentrant phase behavior of RNA-protein mixtures (Figures 1 and 2). (2) A mathematical framework to study spatiotemporal evolution of condensates subject to non-equilibrium dynamical processes of RNA synthesis, degradation, and diffusion (Figure 4B).
Figure 4. A model for RNA-mediated non-equilibrium feedback control of transcriptional condensates.

A. Schematic of coarse-grained free-energy (f, green-surface) which depends on the transcriptional protein and RNA concentrations. This free-energy recapitulates in vitro observations of an equilibrium reentrant transition.
B. Schematic of the non-equilibrium model coupling transcriptional activity with transcriptional condensate dynamics. In the model framework, we focus on a local micro-environment near a single transcriptional condensate (blue). RNA (magenta) is synthesized, degraded, and can diffuse.
C. Equations underlying construction of the free-energy function (Equation 1) and dynamics of protein and RNA (Equation 2) (STAR Methods).
D. Simulation predictions of transcriptional condensate lifetime with varying total protein concentrations (2D simulation grid). The dashed-line represents the lifetime of condensates (in units of simulation time) that don’t dissolve at steady state.
E. F. Simulation predictions of transcriptional condensate radius (E) and lifetime (F) at varying effective rates of RNA synthesis (2D simulation grid). The radius values are normalized to r=6.0 mesh units. The dashed line in F represents lifetime of stable condensates in units of simulation time (STAR Methods).
G. Variation of normalized condensate radius (ordinate, normalized to r=6.0 mesh units) with changing relative time-scales of reaction and diffusion (abcissa, td/tr) (2D simulation grid). In these simulations, the total effective concentration of RNA produced is held constant (see text). The inset graphs the distribution of RNA concentrations at early simulation times (tstep = 100) for two different values of td/tr (highlighted in the main panel with corresponding colors).
H. Visualization of protein (blue) and RNA (magenta) concentration fields over simulation time for 3D simulations. The condensate is initialized (first panel) and then grows under low transcriptional activity (second panel). After a finite-time (tstep = 1000), the effective rate of RNA synthesis (kp) is increased by 2.5-fold, which in turn, drives condensate shrinkage (third panel) and ultimately, dissolution (fourth panel) (STAR Methods).
See also Figures S6 and S7
The goal of the model described below is to explore non-equilibrium regulation of transcription by RNA output and obtain insights into the pertinent mechanistic principles. Quantitative descriptions of RNA-protein phase behavior even in vitro (Adhikari et al., 2018; Delaney & Fredrickson, 2017) and direct measurements of the dynamical parameters underlying transcription are largely unavailable (Rodriguez & Larson, 2020). Therefore, we sought to develop a phenomenological model of non-equilibrium regulation of transcription by RNA output, and use it to predict the qualitative effects of perturbing model parameters. Our experimental approaches allow such perturbations to be realized, and can test whether the predicted effects are ac curate. By coupling the predictions of effects of perturbing model parameters with experimental tests, we aimed to obtain mechanistic insights into how RNA transcription may dynamically regulate transcription itself.
We first developed a free-energy function to recapitulate the experimentally observed reentrant phase behavior of RNA-protein mixtures (Figure 4A). The free energy function depends on the concentrations of transcriptional proteins and RNA and , which vary in space and time. For simplicity, all transcriptional proteins are combined into one pseudo-species. As noted above, our goal is not quantitative recapitulation of known experimental data, but rather to obtain mechanistic insights into RNA-mediated non-equilibrium regulation of transcription that could be experimentally tested. Therefore, we first sought to develop a free-energy function that qualitatively recapitulates the observed reentrant phase behavior of RNA/protein mixtures. Following a long tradition in the physics of phase transitions, we employed a general Landau approach (Kardar, 2007; Landau, 1937) and expanded the free energy as a function of RNA and protein concentrations. We include terms to describe repulsive RNA-RNA interactions, favorable interactions among the transcriptional proteins that drive condensate formation of transcriptional proteins in the absence of RNA (Figure 4C, Eq. 1, in green), as well as a surface tension term important for describing condensate formation (Figure 4C, Eq. 1 in blue, STAR Methods). The free energy function also includes protein-RNA interactions that are described by a concentration-dependent interaction term, which is expanded in the standard Landau fashion (Figure 4C, Eq. 1, in red) (Kardar, 2007). Magnitudes of the coefficients of the various terms in the expansion account for the effective strength of RNA-protein interactions (STAR Methods), which implicitly include solvent effects. While symmetry arguments do not preclude any specific terms in this expansion, analysis of the pertinent Jacobian matrix shows that the choice of ensures a reentrant phase transition (schematic in Figures 4B, S6A, STAR Methods) with a minimal number of higher order terms. Results using the Landau model (Figure 4C, Eq. 1) are recapitulated using a different method for obtaining the free-energy (Flory-Huggins) to highlight the generality of our Landau approach (Figure S6A and S6B, STAR Methods). Given the universality of its application, easily characterizable phase behavior, and numerical ease of investigation (e.g. ~ 50 times faster than the Flory-Huggins to study coupled dynamics), we employ the Landau free-energy for the rest of this manuscript to study how the dynamics of transcriptional condensates is regulated by transcription.
We next developed a mathematical framework to study the temporal evolution of transcriptional condensates as transcription ensues. Most transcriptional proteins turn-over with a half-life of several hours (Cambridge et al., 2011; Chen et al., 2016), which is longer than time-scales of transcription-associated events, which range from seconds to minutes (Chen and Larson, 2016; Fukaya et al., 2016; Rodriguez and Larson, 2020). Hence, the overall amount of protein is conserved in the timescales of interest. Thus, the dynamics of the protein concentration are represented by standard Model B dynamics (Figure 4C, Eq. 2) (Hohenberg and Halperin, 1977). Under Model B dynamics, gradients in the protein chemical potential, which depend on both the spatial distribution of protein and RNA concentrations, drives diffusive protein fluxes, which in turn drives the spatio-temporal evolution of . Since RNA concentrations vary over transcription-associated time-scales, the dynamics of is explicitly governed by a reaction-diffusion equation. The key features (schematic in Figure 4B) are that RNA diffuses with mobility Mrna and is synthesized and degraded with specific reaction rates, kp and kd, respectively. Because the RNA dynamics are far from equilibrium and the free energy function noted above depends upon both protein and RNA concentrations, the coupled temporal evolution of transcriptional proteins and RNA (Figure 4C, Eqs. 1 and 2) cannot be obtained from near-equilibrium considerations of simply going downhill in free energy with time. We employ this mathematical framework to study non-equilibrium regulation of transcriptional condensates.
We first sought to determine whether this model is consistent with previous studies (Cho et al., 2016, 2018). These studies have shown that transcriptional condensates at different genomic loci recruit a varying number of transcriptional proteins, which in turn, correlates with condensate lifetimes. To explore this phenomenon, we numerically simulated Eq. 2 (Figure 4C) on 2- and 3-dimensional grids (STAR methods). Locus-dependent recruitment of the transcriptional machinery can be mimicked in our model by varying the total transcriptional protein amount with all other parameters fmeters fixeixed, as our simulation volume represents a d, a local micro-environment (Figure 4A). Our simulations predict that loci that can recruit more transcriptional proteins (higher ) form relatively stable condensates, while condensates that recruit fewer proteins dissolve after a characteristic lifetime (Figure 4D). The model predictions for transcriptional condensate dynamics are qualitatively consistent with published data (Cho et al., 2016), and suggest that features encoded at genomic loci contribute to transcriptional condensate dynamics.
We next investigated how the sizes and lifetimes of transcriptional condensates change as a function of the effective rate of RNA synthesis (kp) while keeping all other parameters fixed. In these simulations, the size of condensates initially increases and subsequently decreases with increasing effective rates of RNA synthesis (Figure 4E). Above a threshold rate of RNA synthesis, condensates dissolve (Figure 4E). The underlying reason for this result is the reentrant phase behavior of mixtures of transcriptional molecules and RNA (Figures 1 and 2). We also find that condensates with higher transcriptional activity dissolve faster, as measured by condensate lifetimes (Figure 4F). Condensate lifetimes do not vary over a range of RNA transcription rates that reflect RNA-transcriptional protein ratios that roughly correspond to the charge balance conditions (Figure 4F). The same qualitative results are recapitulated in 3D simulations (Figure S6C) as well as simulations employing the Flory-Huggins free-energy (Figure S6D), and further reinforced by partition ratios computed from simulations (Figure S6E). Further, we carried out simulations that accounted for phase-dependent changes in diffusion of RNA; i.e., RNA diffusion was hindered in the dense phase due to crowding (Figure S6F). Predictions of the condensate size and lifetimes exhibited similar qualitative trends to simulations without this phase-dependent diffusion (Figure S6F, Figure 4E-F). Overall, our results suggest a model wherein low effective rates of RNA synthesis (or low transcription activity) stabilize transcriptional condensates while higher rates promote condensate dissolution.
We then investigated the extent to which non-equilibrium effects underlying transcription regulate transcriptional condensate dynamics. RNA synthesis, degradation, and diffusion influence the spatial distribution of RNA, which in turn, may feedback on transcriptional condensates. To explore this, we varied the diffusivity of RNA and the effective rates of RNA synthesis and degradation, while holding the ratio of synthesis and degradation rates constant. The latter constraint ensures that the overall RNA concentration is constant in the condensate as other parameters are varied, thus any effect on condensate dynamics arises from purely non-equilibrium effects. Varying the parameters that control RNA synthesis/degradation rates and diffusion changes the relative time-scales of these processes (tr and td, respectively) (STAR Methods), which in turn, influences the spatial distribution of RNA in the condensate. If diffusion is slower than synthesis/degradation (tr > td), then RNA will accumulate near transcription sites, leading to a higher local RNA concentration in the condensate. Conversely, if diffusion is faster than synthesis/degradation (an tr < td), then RNA will diffuse away from transcription sites, leading to a lower uniform RNA concentration in the condensate. The spatial distribution of RNA will impact condensates according to local charge balance. To study how varying spatial distributions of RNA affect transcriptional condensates, we simulated conditions where the overall RNA concentration was fixed close to the charge-balance condition, thus promoting condensate formation at equilibrium. In these simulations, condensates that are stable when synthesis/degradation is slower than diffusion (tr > td) dissolve when RNA synthesis/degradation is faster than diffusion (tr < td) (Figure 4G). When (tr > td) RNA concentration is relatively uniform and low throughout the condensate and equilibrium effects dominate. Conversely, when (tr < td) RNA is distributed non-uniformly with high local concentrations in the condensate and non-equilibrium effects dominate to result in condensate dissolution (Figure 4G). In the latter case, the localized high RNA concentrations exceed the charge balance condition due to non-equilibrium effects. Approximate estimates for the rates of RNA synthesis, degradation, and diffusion under physiological conditions STAR Methods) suggest that transcriptional condensate dynamics are likely driven off equilibrium.
We sought to synthesize our results so far to explore the effect of non-equilibrium dynamics on regulating transcriptional condensates across transcription initiation and productive elongation. Simulations were started at a relatively low effective rate of RNA synthesis, mimicking initiation, followed by an increase to a relatively high effective rate of RNA synthesis, mimicking productive elongation. The simulations predict that low effective rates of RNA synthesis enhance condensate formation, and these condensates subsequently dissolve upon ensuing higher effective rates of RNA synthesis (Figure 4H). Consistent with these simulations, Mediator condensates tend to be depleted in areas of high, Pol II-driven nascent transcription (Figure S7A-S7C). These results suggest that non-equilibrium processes underlying RNA synthesis can potentially regulate the formation and dissolution of transcriptional condensates.
Inhibition of RNA elongation leads to enhanced condensate size and lifetime in cells
Transcriptional condensates in cells are highly dynamic, forming and dissolving at timescales ranging from seconds to minutes (Cho et al., 2018). We previously showed that condensate formation is associated with transcription activation and initiation (Cho et al., 2018). Once transcriptional condensates are formed, the RNA-mediated condensate dissolution model predicts that inhibition of elongation should increase the size and lifetime of transcriptional condensates (Figure 5A). We used the physics-based model (Figure 4) to simulate the effects of elongation inhibition on transcriptional condensates and performed experiments to test the predictions from these simulations in cells (Figures 5B-5I). In order to account for the locus-dependent ability to recruit the transcriptional machinery and Pol II, we performed these simulations at a range of total protein concentrations (as in Figures 4D and 4E), but for conditions where the effective rate of RNA synthesis (kp) was high (corresponding to elongation) and low (corresponding to inhibited elongation). The results of the simulations predict that a reduced effective rate of RNA synthesis should increase the size and lifetime of transcriptional condensates across a range of total protein concentrations (Figure 5B and 5F).
Figure 5. Inhibition of RNA elongation leads to enhanced condensate size and lifetime in cells.

A. Scheme for preventing condensate dissolution upon transcriptional burst by treatment with small molecules that inhibit transcriptional elongation.
B. Simulation predictions show variation of normalized condensate radius with total protein amount (abscissa) in absence (black, kp =0.1) and presence (red, kp = 0.05) of RNA synthesis inhibition (2D simulation grid). The radius is normalized by the radius at kp = 0.05 < P0 > = 0.115.
C. Experimental design to test the effect of transcriptional inhibition on the size of Mediator condensates. MED1-GFP mESCs are imaged by 3D super-resolution microscopy after treatment with small molecules.
D. Max intensity projection images of single nuclei tagged with endogenous Med1-GFP in the presence of indicated transcriptional inhibitors or DMSO control.
E. Volumes of Med1-GFP condensates in (D). (p-value for DMSO vs. ActD < 0.0001 and p-value for DMSO vs. DRB < 0.0001, one-way ANOVA).
F. Simulation predictions show variation of condensate lifetime with total protein amount (abscissa) in absence (black, kp =0.1) and presence (red, kp = 0.05) of RNA synthesis inhibition (2D simulation grid). The lifetime is presented in units of simulation time.
G. Experimental design to test the effect of DRB on the lifetime of Mediator clusters in Med19-tagged mESCs. Lifetimes are quantified by time-correlated PALM.
H. Representative heatmap of Med19-Halo localizations in single nucleus upon addition of transcriptional inhibitor DRB, DRB wash or DMSO control.
I. Cumulative distribution frequency plot of condensate lifetime in response to indicated treatments are shown (p < 0.0001, one-way ANOVA).
See also Figure S7
To experimentally test these predictions from the simulations, mESCs engineered with an endogenous, GFP-tagged subunit of Mediator (Med1-GFP) (Sabari et al., 2018) were treated for 30 minutes with Actinomycin-D or DRB (Figure 5C), which disrupt transcription elongation through DNA intercalation and inhibition of CDK9-mediated Pol II pause release, respectively (Singh and Padgett, 2009; Sobell, 1985; Steurer et al., 2018). Consistent with the model predictions, after inhibition of elongation, Med1-GFP condensates increased in volume by ~2-fold as measured by 3D super-resolution microscopy (Figures 5D and 5E). Condensate lifetime could not be assessed in these cells due to the long duration of image acquisition and consequent photobleaching, so we turned to time-correlated PALM super-resolution microscopy (tcPALM) in mESCs with an endogenous Med19-Halo tag (Cho et al., 2018; Cisse et al., 2013) to investigate the effects of elongation inhibition on condensate lifetime (Figure 5G). Cells were treated for 30 minutes with DRB to disrupt transcription elongation, and the lifetime of Med19 condensates was quantified. When transcription elongation was inhibited by DRB treatment, Med19 condensates exhibited significantly longer lifetimes than mock-treated cells (Figures 5H and 5I), and when DRB-treated cells were washed with fresh media, the lifetimes of the Med19 condensates recovered to those of the mock-treated condition (Figures 5H and 5I). Taken together, the in silico and experimental results show that suppression of elongation in cells leads to increased condensate size and lifetime, consistent with the model that a burst of RNA synthesis can promote dissolution of transcriptional condensates in cells.
Increasing the levels of local RNA synthesis reduces condensate formation and transcription in cells
The RNA-mediated feedback model suggests that modifying the concentration or size of RNA molecules should have a predictable effect on transcriptional output. We developed complementary experimental and simulation approaches (Figure 6) whereby the levels of putative “feedback RNAs” could artificially be increased. We first used the physics-based model (Figure 4) to simulate the effect of increasing effective rates of RNA synthesis as well as varying lengths for the synthesized RNA on condensates (STAR Methods). The simulations predicted that increases in the production rate of shorter RNAs initially enhance and subsequently suppress transcriptional condensate size, while increases in the production rate of longer RNAs lead to reduced condensate size with increasing synthesis rates (Figure 6E).
Figure 6. Increasing the levels of local RNA synthesis reduces condensate formation and transcription in cells.

A. Scheme depicting the reporter system (left) where local RNA expression near a luciferase reporter gene can be induced by doxycycline.
B. Experimental design to test the effect of increasing local RNA levels on condensate formation and on reporter gene expression.
C. Live-cell imaging showing localization of Mediator condensates and MS2-tagged RNA expressed near the reporter gene at indicated dox stimulations. Med1-GFP mESCs have an integrated reporter system and 2xMCP-mCherry to visualize MS2-tagged RNA (2456 nt). Representative images are maximum projections that have been subtracted by a median filter and smoothed (STAR Methods).
D. Average density of MED1 signal centered at RNA signal at indicated dox stimulations (p=0.066 10 ng/mL vs 100 ng/mL Dox;p=0.013 10 ng/mL vs 1000 ng/mL Dox, p=0.315 100 ng/mL vs 1000 ng/mL, 2-way Kolmongorov-Smirnoff test).
E. Simulations predict the variation of condensate size with increasing effective rates of RNA synthesis (abscissa) (2D simulation grid). The condensate radius is normalized by value at rate=1 and RNA synthesis rates are normalized to kp = 0.02 (STAR Methods)
F. qRT-PCR of various “feedback RNAs” with increasing dox concentrations. Markers show the mean of at least 3 replicates and error bars depict the S.D.
G. Luciferase luminescence with increasing dox concentrations. Markers show the mean of at least 3 replicates and error bars depict the S.D.
See also Figure S7
To test this prediction, we investigated the effect of artificially increasing the levels of feedback RNAs on the transcription of an adjacent luciferase reporter gene in cells (Figures 6A and 6B) (Kirk et al., 2018). DNA molecules specifying RNAs of a range of sizes were cloned into this system to allow dox-inducible expression of these RNAs, and mESC lines were generated with clones of integrated constructs. Feedback RNAs were observed at loci of Mediator puncta under low dox stimulation, suggesting that these actively transcribed genes are associated with transcriptional condensates (Figures 6C, 6D). Elevated expression of feedback RNAs under higher dox stimulation reduced their colocalization with Mediator puncta, consistent with the model of RNA-mediated feedback on condensates (Figures 6C, 6D, and S7D). To study the effect of local RNA levels on transcription, additional cell lines harboring diverse feedback RNAs were then treated with increasing doses of doxycycline to induce feedback RNA expression (Figure 6F) and reporter expression was measured by luminescence (Figure 6G).
The results were consistent with model predictions (Figure 6E): increases in the levels of short feedback RNAs initially enhanced reporter expression and then suppressed this, while progressive increases in the levels of the longer feedback RNAs more strongly reduced reporter expression (Figure 6G). We confirmed that changes in reporter expression arise from cis RNA-mediated effects by modifying the constructs, controlling for the global effects of Dox, and perturbing local RNA concentration (Figures S7E-S7K). Together, these results support a role for RNA-mediated feedback control of transcriptional condensates.
DISCUSSION
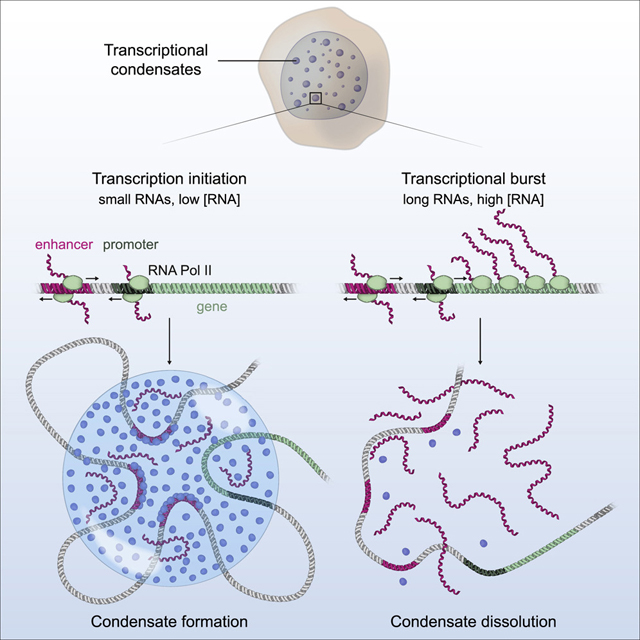
The results described here indicate that transcription is a non-equilibrium process that provides dynamic feedback through its RNA product. The results support a model whereby RNA provides both positive and negative feedback on transcription via the regulation of electrostatic interactions in transcriptional condensates. Transcriptional condensates, whose production involves crowding of transcription factors by enhancer DNA (Shrinivas et al., 2019) and electrostatic and other interactions between the IDRs of transcription factors and coactivators (Boija et al., 2018; Sabari et al., 2018), engage RNA to both promote and dissolve the condensates. In this RNA feedback model, low levels of short RNAs produced during transcription initiation promote formation of transcriptional condensates, while high levels of the longer RNAs produced during elongation can cause condensate dissolution (Figure 7).
Figure 7. A model for RNA-mediated feedback control of transcriptional condensates.

Cartoon depicting a model whereby low levels of RNA present at transcription initiation promote condensate formation while high levels of RNA present during a transcriptional burst promote condensate dissolution.
An RNA-mediated feedback model for transcriptional regulation provides a potential explanation for the roles of enhancer and promoter-associated RNAs, which are evolutionarily conserved features of eukaryotes. These low-abundance short RNAs, transcribed bidirectionally from enhancers and promoters, have been reported to affect transcription from their associated genes through diverse postulated mechanisms. The diversity of sequences present in these short RNA species has made it difficult to postulate a common molecular mechanism for their effects on transcription. In this context, a model for RNA-mediated feedback regulation of condensates is attractive for several reasons. RNA molecules are known components of other biomolecular condensates, including the nucleolus, nuclear speckles, paraspeckles and stress granules, where they are known to play regulatory roles (Fay and Anderson, 2018; Roden and Gladfelter, 2020). RNA is a powerful regulator of condensates that are formed by electrostatic forces because it has a high negative charge density due to its phosphate backbone (Drobot et al., 2018; Frankel et al., 2016), thus explaining why the effects of diverse RNAs on transcriptional condensates are sequence-independent.
Recent studies indicate that transcription occurs in periodic bursts (~1–10 minutes in duration), where multiple molecules of Pol II can be released from promoters within a short timeframe and produce multiple molecules of mRNA (~1–100 molecules per burst). Multiple models explain such periodic bursbu ts through stochastic gene activation events (Chen and Larson, 2016; Larsson et al., 2019; Raj et al., 2006; Rodriguez and Larson, 2020; Suter et al., 2011; Tunnacliffe and Chubb, 2020) but are often agnostic to the underlying mechanism or attribute these to rate-limiting transcription factor binding events. We suggest that a rapid and spatially-localized change in charge balance, due to increased RNA synthesis at pause release of active Pol II, may contribute to dissolution of transcriptional condensates and thus dynamic loss of the pool of transcriptional apparatus in those condensates. This would provide a means to provide negative feedback to arrest transcription and a mechanism that may contribute to the dynamic bursty behavior observed for transcription.
STAR METHODS
RESOURCE AVAILABILITY
Lead Contact
Further information and requests for resources and reagents should be directed to and will be fulfilled by the Lead Contact, Richard A. Young (young@wi.mit.edu)
Materials Availability
All unique/stable reagents generated in this study are available from the Lead Contact upon reasonable request with a completed Materials Transfer Agreement.
Data and Code Availability
The code generated during this study is available at: https://github.com/krishna-shrinivas/2020_Henninger_Oksuz_Shrinivas_RNA_feedback.
EXPERIMENTAL MODEL AND SUBJECT DETAILS
Cell lines
The Jaenisch laboratory of the Whitehead Institute gifted the V6.5 murine embryonic stem cells. These cells are male cells derived from a cross of C57Bl/6(F) x 129/sv(M).
Cell culture conditions
ES cells were maintained at 37°C with 5% CO2 in a humidified incubator on 0.2% gelatinized (Sigma, G1890) tissue-culture plates in 2i medium with LIF, which was made according to the following recipe: 960 mL DMEM/F12 (Life Technologies, 11320082), 5 mL N2 supplement (Life Technologies, 17502048; stock 100X), 10 mL B27 supplement (Life Technologies, 17504044; stock 50X), 5 mL additional L-glutamine (Gibco 25030–081; stock 200 mM), 10 mL MEM nonessential amino acids (Gibco 11140076; stock 100X), 10 mL penicillin-streptomycin (Life Technologies, 15140163; stock 10^4 U/mL), 333 μL BSA fraction V (Gibco 15260037; stock 7.50%), 7 μL β-mercaptoethanol (Sigma M6250; stock 14.3 M), 100 μL LIF (Chemico, ESG1107; stock 10^7 U/mL), 100 μL PD0325901 (Stemgent, 04–0006-10; stock 10 mM), and 300 μL CHIR99021 (Stemgent, 04–0004-10; stock 10 mM). For confocal and PALM imaging, cells were grown on glass coverslipslips ips(Carolina Biological Supply, 633029) that had been coated with the following: 5 μg/mL of poly-L-ornithine (Sigma P4957) at 37°C for at least 30 minutes followed by 5 μg/mL of laminin (Corning, 354232) at 37°C for at least 2 hours. Cells were passaged by washing once with 1X PBS (Life Technologies, AM9625) and incubating with TrypLE (Life Technologies, 12604021) for 3–5 minutes, then quenched with serumcontaining media made by the following recipe: 500 mL DMEM KO (Gibco 10829–018), MEM nonessential amino acids (Gibco 11140076; stock 100X), penicillin-streptomycin (Life Technologies, 15140163; stock 10^4 U/mL), 5 mL L-glutamine (Gibco 25030–081; stock 100X), 4 μL β-mercaptoethanol (Sigma M6250; stock 14.3 M), 50 μL LIF (Chemico, ESG1107; stock 10^7 U/mL), and 75 mL of fetal bovine serum (Sigma, F4135). Cells were passaged every 2 days.
METHOD DETAILS
ChIP-seq analysis
As described in Sabari et al., 2018, ChIP-seq browser tracks for MED1, Pol II, BRD4, and OCT4 were generated by aligning reads to NCBI37/mm9 using Bowtie with the following settings: “-p 4 --best -k 1 -m 1 --sam -l 40”. WIG files represent counts (in reads per million, floored at 0.1) of aligned reads within 50 bp bins. Each read was extended by 200nt in the direction of the alignment.
(Source: https://www.ncbi.nlm.nih.gov/geo/query/acc.cgi?acc=GSE112808)
GRO-seq analysis
For generation of the GRO-seq browser tracks, GRO-seq reads were processed as described in (Sigova et al., 2015). The GRO-seq .sra file corresponding to GEO accession number GSM1665566 (Sigova et al., 2015) was converted to .fastq using the SRA toolkit (Leinonen et al., 2011). Reads were aligned to the mouse genome (NCBI37/mm9) using Bowtie v1.2.2 (Langmead et al., 2009) with the following settings “-e 70 -k 1 -m 10 -n 2 --best”. The reads corresponding to each one of the features (super-enhancers, typical enhancers, proximal promoter regions, genes) were counted using featureCounts v1.6.2 (Liao et al., 2014) with default settings. The coordinates for typical en enhhancancpromoter regions, genes) were counted using featureCounts v1ncers a.6.2 (Liao et al., 2014) with and and super-enhancers in mouse embryonic stem cells (mESCs) were acquired from (Whyte et al., 2013). The coordinates for genes (transcription start and end sites) were acquired using the UCSC Table Browser (Karolchik et al., 2004). The upstream antisense promoter regions were defined as genomic areas containing 1 kb upstream of each TSS. Their coordinates were retrieved by using BEDTools v.2.26.0 (Quinlan and Hall, 2010) and the TSS coordinates as input (to the slop function). Reads were normalized with the size of the corresponding feature they aligned to.
RNA-seq analysis
The RNA-seq .sra file corresponding to GEO accession number GSM2686137b (Chiu et al., 2018) was converted to astq using the SRA Toolkit RNA-seq analysis was performed using .f the nf-core RNA-seq pipeline (v1.4.2) (Ewels et al., 2020) with default settings and NCBI37/mm9 as reference genome. Nextflow v20.01.0 was used as a workflow tool on an LSF High-Performance Computing environment (Di Tommaso et al., 2017). STAR v2.6.1d (Dobin et al., 2013) was used for the alignment of reads. Aligned reads were assigned to the aforementioned intervals (typical enhancers, super-enhancers, proximal promoter regions and genes) by using featureCounts v1.6.4, with the default settings.
Calculation number of RNA molecules in cells
Known concentrations of in vitro transcribed enhancer RNAs and pre-mRNAs from Trim28 and Pou5f1 loci are used as standards to approximate the number of molecules in cells. These RNAs are converted to cDNAs by reverse-transcription and mixed at equal concentrations. For each RNA species, a standard curve of qRT-PCR Ct value to RNA amount was generated using serial dilutions, with two different primer sets in technical duplicates. Next, qRT-PCR reactions using the same primer sets were performed for biological duplicates of mESCs. Actbnormalized Ct values were then used to determine the amount of RNA species in the reaction based on the standard curves above. To calculate the number of RNA molecules per cell, the amount of RNA (g) was divided by the molar weight of each species (~350 (g mol−1 nt−1) × length of in vitro transcribed RNA (nt)), multiplied by Avogadro’s number (6.022 × 10²³ mol−1), and divided by the approximate number of cells used in each reaction (10,000 cells). Melting curves were analyzed to confirm primers specificity. Non-reverse-transcribed (–RT) controls were included to rule out the amplification of genomic DNA. Primer sequences are indicated in Table S1.
In vitro droplet assay
Recombinant GFP fusion proteins were concentrated to a desired protein concentration using Amicon Ultra centrifugal filters (30K MWCO, Millipore). Droplet reactions with the recombinant proteins were performed in 10 ul volumes in PCR tubes under the following buffer condition: 30 mM Tris HCl pH 7.4, 100 mM NaCl, 2% Glycerol and 1 mM DTT. The same buffer containing 55 mM NaCl was used for BRD4-IDR-GFP. Droplet reactions with the Mediator complex were performed under the following buffer condition: 30 mM HEPES pH 7.4, 65 mM NaCl, 2% Glycerol and 1 mM DTT. For all droplet reactions, protein and buffer were mixed first and RNA or ssDNA or heparin (Sigma, H3393) was added later. The reactions were incubated at room temperature for 1 hr without any shaking or rotating. The reactions were then individually transferred into 384 well-plate (Cellvis P384–1.5H-N) by using a micropipette (2–20 μL) 5 minutes prior to imaging by confocal microscopy at 150X magnification or prior to turbidity measurements on a plate reader (Tecan) at 350 nm absorbance at room temperature (Banerjee et al., 2017). The concentration of proteins and RNAs in the droplet reactions are indicated in the figure legends. For brightfield Mediator experiments (Figure 1), representative images were subtracted by a median filtered image (px=15) using ImageJ to remove camera artifacts discovered by taking images of blank wells.
Fluorescence recovery after photobleaching (FRAP)
FRAP was performed on an Andor Revolution Spinning Disk Confocal microscope with 488-nm laser. Droplets were bleached using 30% laser power with 20 μs dwell time for 5 pulses, and images were collected every second for 60 seconds. Fluorescence intensity at the bleached spot and a control unbleached spot was measured using ImageJ. Values are normalized to the unbleached spot to control for photobleaching during image acquisition and then normalized to the first time point intensity.
MATLAB™ scripts were written to process the intensity data, and post bleach FRAP recovery data was normalized to pre-bleach intensity (FRAP(t)) and fit to:
Where, M (mobile fraction) and IJ (half-life of recovery) are inferred in-built MATLAB functions. These values are inferred for each replicate and averaged to provide a range for the apparent diffusion coefficients, which is computed as:
In vitro droplet analysis
To analyse in vitro droplet experiments, we used a previously reported pipeline (Guo et al., 2019) The code for this analysis is available at the Github link in the Data/Code Abailability section. All droplets were segmented from average images of captured channels on various criteria: (1) an intensity threshold that was three s.d. above the mean of the image; (2) size thresholds (20 pixel minimum droplet size); and (3) a minimum circularity (circularity=4π·(area)/(perimeter2) of 0.8 (1 being a perfect circle). After segmentation, mean intensity for each droplet was calculated while excluding pixels near the phase interface. Hundreds of droplets identified in (typically) ten independent fields of view were quantified. The mean intensity within the droplets (C-in) and in the bulk (C-out) were calculated for each channel. The partition ratio was computed as (C-in)/(C-out).
Droplet size, partition ratio, and condensed fraction measure distinct properties of droplet formation, and these three metrics show similar trends upon RNA-mediated reentrant phase transitions. When a protein or RNA is fluorescently-labeled in our experiments, we favor measuring the partition ratio. This is because the partition ratio can be measured on a per-droplet basis, and unlike condensed fraction, which varies depending on the number of droplets per field, the partition ratio is more independent of the field that is imaged.
For the size analysis of droplets formed in the reconstituted transcription assays (Figure 3), brightfield images were subtracted by a median-filtered image (px=21), and droplets were manually segmented and their areas measured using ImageJ.
Synthesis of RNA by in vitro transcription
Enhancer and promoter sequences for RNAs were obtained from super-enhancer-regulated genes Pou5f1, Nanog, and Trim28. For promoter sequences, the first 475–490bp from the first exon were selected from mm10. For enhancer sequences, GROseq reads (Sigova et al., 2015) from both + and - strands aligned to mm9 were overlapped with called super-enhancers (Whyte et al., 2013). Contiguous regions of read density above background were manually selected (Figure S1). Primers were designed to amplify the selected promoter and enhancer sequences from genomic DNA isolated from V6.5 mESCs (Table S1). The following sequences were added to the forward and reverse primers to add the bacterial polymerase promoters:
T7 (add to 5′ of sense or forward primer): 5′-TAATACGACTCACTATAGGG-3′
SP6 (add to 5’ of antisense or reverse primer): 5′-ATTTAGGTGACACTATAGAA-3′
Phusion polymerase (NEB) is used to amplify the products with the bacterial promoters, and products are run on a 1% agarose gel, gel-purified using the Qiaquick Gel Extraction Kit (Qiagen), and eluted in 40 μL H2O. Templates were sequenced to verify their identity. A volume of 8 μL of each template (10–40 ng/μL) was transcribed using the MEGAscript T7 (Invitrogen; sense) or MEGAscript SP6 (Invitrogen; antisense) kits according to the manufacturer’s instructions. For visualization of the RNA by microscopy, reactions included a Cy5-labeled UTP (Enzo LifeSciences ENZ-42506) at a ratio of 1:10 labeled UTP:unlabeled UTP. The in vitro transcription was incubated overnight at 37°C, then 1 μL TURBO DNAse (supplied in kit) was added, and the reaction was incubated for 15 minutes at 37°C. The MEGAclear Transcription Clean-Up Kit (Invitrogen) was used to purify the RNA following the manufacturer’s instructions and eluting in 40 μL H2O. RNA was diluted to 2 μM and aliquoted to limit freeze/thaw cycles, and RNA was run on 1% agarose gels in TBE buffer to verify a single band of correct size.
Recombinant protein purification
Recombinant protein purifications were performed as previously reported (Boija et al., 2018; Guo et al., 2019; Sabari et al., 2018; Shrinivas et al., 2019; Zamudio et al., 2019). pET expression plasmids containing 6xHIS tag and genes of interest or their IDRs tagged with either mEGFP or mCherry were transformed into LOBSTR cells (gift of I. Cheeseman Lab). Expression of proteins was induced by addition of 1mM IPTG either at 16°C for 18 hours or at 37°C for 5 hours. Extracts were prepared as previously described (Boija et al., 2018). Cell pellets were resuspended in 15 ml of denaturing buffer (50 mM Tris 7.5, 300 mM NaCl, 10 mM imidazole, 8M Urea) with protease inhibitors (Roche,11873580001). After complete resuspension, the lysates were sonicated for ten cycles (15 s on and 60 s off) and subjected to centrifugation at 12,000 g for 30 minutes. The supernatant was transferred into fresh tube and the lysates were incubated with 1 ml of pre-equilibrated Ni-NTA agarose beads (Invitrogen, R901–15) with denaturing buffer at 4°C for 1.5 hours. After washing the beads with 15 volumes of the denaturing buffer, proteins were eluted with 50mM Tris pH 7.4, 500mM NaCl, 250mM imidazole buffer containing complete protease inhibitors (Roche,11873580001). Proteins were dialyzed against 50mM Tris pH 7.4, 125 mM NaCl, 10% glycerol and 1mM DTT at 4°C for BRD4-IDR-GFP, OCT4-GFP and GFP alone and the same buffer containing 500 mM NaCl for MED1-IDR-GFP.
Purification of human Mediator complex from HeLa nuclear extract.
HeLa nuclear protein extract (4g) was prepared as described in (Dignam et al., 1983). Nuclear extract was dialyzed against BC100: BC buffer, pH 7.5 + 100mM KCl (20 mM Tris-HCl, 20 mM β-Mercaptoethanol, 0.2 mM PMSF, 0.2 mM EDTA, 10% glycerol (v/v) and 100 mM KCl). The extract was fractionated on a phosphocellulose column (P11) with BC buffer containing 0.1, 0.3, 0.5 and 1M KCl. The Mediator complex eluted in the 0.5M KCL (BC500) fraction. This fraction was dialyzed against BC100 and loaded on a DEAE Cellulose column and sequentially fractionated with BC buffer containing 0.1, 0.3 and .5M KCl. The Mediator did not bind the DEAE Cellulose resin and was collected in the flow through fraction 0.1M KCl (BC100). This fraction was then directly loaded onto a DEAE-5PW column (TSK) and eluted with a linear KCl gradient from 0.1 to 1M KCl in BC buffer. The Mediator complex eluted between 0.4 and 0.6M KCl. The fractions containing Mediator were pooled and dialyzed against BD700: BD buffer, (20 mM Hepes pH 7.5, 20 mM β-Mercaptoethanol, 0.2 mM PMSF, 0.2 mM EDTA, 10% glycerol, and 700 mM (NH4)2SO4). This fraction was then loaded onto a Phenyl-Sepharose Hydrophobic Interaction Chromatography (HIC) column and eluted with a linear reverse gradient from 0.7 to 0.025M (NH4)2SO4 in BD buffer. The Mediator complex eluted between 0.3 and 0.1M (NH4)2SO4. The Mediator-containing fractions were again pooled and dialyzed against BA100: BA buffer, pH 7.5 + 100 mM NaCl (20 mM Hepes, 20 mM β-Mercaptoethanol, 0.2 mM PMSF, 0.2 mM EDTA, 10% glycerol and 100 mM NaCl) and loaded onto a Heparin Agarose column. The column was washed wit h BA100 and step-eluted with BA buffer containing 0.25, 0.5, 1M and 1M NaCl. The Mediator complex eluted in the 0.5M NaCl (BA500) fraction. A portion of this fraction was then loaded on a Superose-6 (gel filtration column) that was equilibrated and run in BC100. The Mediator complex eluted from the gel filtration column with a mass range between 1–2MDa.
Reconstituted in vitro transcription assay
The reconstituted in vitro transcription by RNA polymerase II was performed as previously described (Flores et al., 1992; LeRoy et al., 2008, 2019; Orphanides et al., 1998) with some modifications. A 1000 bp template DNA (unlabeled or Cy-3 labeled at 3’ end) containing adenovirus major l ate promotr, five Gal4 binding sites, TATA-box sequence and 561 bp from e eGFP sequence was used. First, pre-initiation complex was assembled at RT for 15 min by mixing the following components: 50 nM RNA polymerase II enriched for hypophosphorylated CTD, 50 nM general transcription factors (TFIIA-B-D-E-F-H), and 5.75 nM template DNA, in a buffer containing 10 mM HEPES pH 7.5, 65 mM NaCl, 6.25 mM MgCl2, and 6.25 mM Sodium butyrate. Next, 10 nM Mediator complex and 10 nM GAL4 (Gal4 DNA binding domain fused to activation domain of VP16) were added to the reaction. Last, nucleotide mix containing 0.375 mM ATP, CTP, UTP, GTP (Invitrogen), 0.01 U RNase Inhibitor (Invitrogen), 1.25 % PEG-8000 were added together with one of the following: a) various amounts of purified exogenous Pou5f1 RNA (0–500 nM) b) spermine (Sigma, S4264) c) extra NTPs (Invitrogen) d) extra NaCl e) heparin (Sigma, H3393). The reaction was incubated at 30°C for 2 hr. RNA isolation was performed using RNeasy kit (Qiagen) by including a spike-in RNA control and an RNA carrier. Purified RNAs were treated with ezDNase (Invitrogen) for 30 min at 37°C to eliminate the template DNA. Reverse transcription was performed using Superscript IV (Invitrogen) and qPCR was performed with SYBR Green Real Time PCR master mix (Invitrogen) to quantify the template derived transcriptional output. The Ct values of the reactions were normalized to the spike-in RNA control. The concentration of template derived transcriptional output was calculated by using a standard curve of qRT-PCR Ct values generated by known amounts of serially diluted GFP RNA. The sequence of primers used for qRT-PCR are indicated in Table S1.
To visualize the droplets formed in the reconstituted transcription assay, using a micropipette (2–20 μL), 5 μL of the reactions were loaded onto a homemade chamber, which was prepared by attaching coverslips to a glass slide by parallel strips of double-sided tape (Sabari et al., 2018). After the droplets were settled on the glass coverslip, the images were collected by using RPI Spinning Disk confocal microscope with a 100x objective. To account for camera artifacts in the images, brightfield Images of droplets from reconstituted assays were subjected to a white tophat filter with a disk element radius of 21 using the MorphoLib plugin in ImageJ, then a Gaussian filter (sigma=1) was applied.
Constructing a free-energy for RNA-protein phase behavior
Our goal in this section is to develop a simplified and coarse-grained model that captures the qualitative physics of RNA-protein mixtures. Based on phenomenological observations of transcriptional proteins and RNA (Figure 2), such a model must recapitulate the following key features:
Transcriptional proteins phase separate in the absence of RNA through other types of interactions, albeit at higher concentrations.
At fixed protein concentrations, addition of RNA initially promotes de-mixing and at higher levels drive a re-entry into the mixed phase.
Motivated by the evidence that transcriptional condensates recruit diverse coactivators, transcription factors, and other proteins of the transcriptional apparatus (Boija et al., 2018; Guo et al., 2019; Sabari et al., 2018; Shrinivas et al., 2019), we define an effective protein component P that lumps together different transcriptional molecules. Similarly, while different species of RNA are likely present within these condensates, we define an effective RNA species (R).
Landau model
First, we approach this problem by constructing a phenomenological free-energy with 2 orderparameters that represent scaled concentrations of protein and RNA . We define the free-energy (normalized to as:
Here, is a standard double-well potential that ensures protein components phase separate without RNA with co-existence concentrations specified by α, β. Choice of k > 0 ensures that there is finite surface tension for the protein condensate. The second-order term for RNA states that within this model-framework, RNA cannot phase-separate in the absence of protein. Given that electrostatic interactions at physiological salt conditions are fairly short-ranged (Debye length ~ 1nm), we capture the non-linear nature of RNA-protein interactions in an effective interaction term χeff. We define this interaction term in the spirit of the Landau-Ginzburg approach as an expansion in powers of the order parameters:
While symmetry arguments often dictate or exclude certain types of terms (odd powers in Ising models for example) in such an expansion, there are no obvious symmetry constraints for this system. Hence, our modeling approach is to minimize the number of higher-order terms that need to be included to recapitulate the experimentally observed reentrant phase transition. Our experimental results suggest that low concentrations of RNA promote phase separation, and thus the lowest order term () lowers the free-energy. However, higher-order terms must counter this and below we outline how we determine which terms to include. In general, the stability of a mixture described by such a free-energy can be ascertained from the Jacobian matrix J. For our model, the elements of this 2 × 2 matrix are:
The mixed phase is no longer stable to perturbations when at least one eigen value of J becomes negative (spinodal instability). In the absence of RNA, the spinodal satisfies If only the pair-wise interaction terms were considered , the spinodal region broadens i.e. phase separation is promoted at lower protein concentrations when RNA is present. We next characterized the effect of an additional higher-order term (only one of a b or c is non-zero) on the Jacobian matrix. We ascertained that:
a > 0: While the free-energy is dominated by repulsive interactions at higher RNA concentrations, the Jacobian matrix predicts a continuous underlying instability. Instead of suppressing phase separation at higher RNA concentrations and promoting re-entry to dilute phase, this term would instead change the composition of the demixed phases.
b > 0: While this term promotes a reentrant behavior, the resulting regions of instability demix RNA away from protein for most values of b.
c > 0: For values of ܿ that are not too large , the resulting phase diagram mirrors a reentrant shape with RNA enrichment in the protein condensate. If c is moderately large, then a second de-mixing transition (similar to case 2 i.e. b>0) is observed at high values of . Since we are interested in the limit of relatively low protein/RNA concentrations, and the values of represent qualitative proxies of protein/RNA concentrations, we choose to explore our model in this parameter regime.
While cubic and higher-order terms are required to recapitulate complete phase-behavior, we explored our model with c > 0 assuming the coefficients a b are small. In the simulations reported in Figures 4–6, the free-energy parameters are . All free-energy calculations were performed with Python and code is available at: https://github.com/krishna-shrinivas/2020_Henninger_Oksuz_Shrinivas_RNA_feedback.
Flory-Huggins model
In this approach, rather than employ a phenomenological model, we parametrize a microscopic model motivated by Flory-Huggins polymer-solution theory (Flory, 1942). The simplified F-H model contains 3 components - protein, RNA, and the solvent (s), whose volume fractions are defined as respectively. The free-energy (normalized as before) is defined as:
Here, ri are the solvent-equivalent polymerization lengths of the RNA & protein (assumed to be equal for simplicity) and χij are the various pairwise interaction terms. As before, we assume these interactions to be short-ranged at physiological salt levels. Choice of and recapitulate the attractive contributions of protein-protein/protein-RNA interactions and repulsive RNA-RNA interactions. With these choices of constraints, the resulting free-energy looks similar to the phase diagram from the Landau approach with c > 0 (Figure S6A-B) where the key F-H parameters are , and .
Numerical phase-field simulations
Numerical investigations of the coupled-equations outlined in Figure 4C were performed with the FiPy package (Guyer et al., 2009). Simulations were performed on a 2-D/3-D square lattice () and with adaptive time-stepping () until steady state is reached (which typically requires ~ 10000 simulation steps).
The chemical potential for the protein components is calculated as:
The radius of condensates was inferred from the volume of mesh regions where . The mobility of RNA and protein were chosen to be 1.0 unless mentioned elsewhere. The raw data for all figures from simulation data are provided along with the manuscript.
Design of Simulations to vary RNA features and rates of RNA synthesis
We designed simulations (Figure 6E) to study the effect of RNA features and rates of effective synthesis on condensate size. The rates of synthesis were changed by increasing kp by multiplicative factors (see x-axis in Figure 6E). Since RNA length is not explicitly incorporated in the model framework, we defined the effective local synthesis rates of longer RNA as a product of kp and an additional multiplicative factor (1,2, and 4x for short, medium, and long RNA respectively) to mimic increased local concentrations of RNA.
Calculation of number of charged molecules in condensates
In estimating the number and charge of transcriptional proteins (Figure S1), we use previous estimates (Cho et al., 2018) that suggest key transcriptional proteins such as Mediator are present at 10–100 molecules in transcriptional condensates. Further, molecules such as MED1 or BRD4 contain large disordered domains with net positive charge of +5 to to+40. This provides a highly approximate estimate of 25–500 as the effective positive charge. Since there are many more transcriptional proteins and most proteins tend to contain net positive charges, it is likely that this estimate represents lower bounds on the range. Steady-state levels of nascent eRNA (Figure S1) suggest a range of 0.2–10 molecules, and since super-enhancers typically contain clusters of such active enhancers, we approximate the typical range of eRNA molecules at a transcriptional condensate between 1-10. Since RNA carries a charge of around −1 per nt (Banerjee et al., 2017) and eRNAs are short (<1 kb), we estimate the effective negative charge during initiation to be in the range 10–1000. During productive elongation, mRNAs are produced in bursts ranging from few to tens (1–50) and are typically longer (>1kb), suggesting a conservative estimate of the effective charge to range from (1000–100,000). It is important to stress that our approximations are performed with the aim of obtaining order-of-magnitude estimates and do not account for factors such as local composition of different proteins or extent to which nascent mRNAs may be coated by RNA-binding proteins. With the above numbers, we estimate concentrations based on a typical transcriptional condensate of size r=0.25 μm (Cho et al., 2018) that suggests that eRNA concentrations range about 10–200 nM and transcriptional proteins range 1–20 μM within the condensate.
Reactive/diffusive time-scales and estimates in cells
As defined in the model (Figure 4B), the key rates of synthesis/degradation reactions are kp/kd, which have units of s−1, and thus the relevant time-scales are . Timescales of RNA transport depend on both the diffusivity as well as the size of the condensate (L) and is defined as . We approximated the range of diffusivity of the nascent transcript at the lower end by the diffusivity of of chromatin, which ranges from (Gu et al., 2018) and on the higher end by those of freely diffusing mRNPs, which can be upto (Niewidok et al., 2018). By assuming a typical eRNA of size 100nt and Pol II transcription rates as (Maiuri et al., 2011) we inferred typical synthesis rates of . In our previous work (Cho et al., 2018), we have seen that clusters that contain multiple polymerases (>5), are typically around . Since super-enhancers typically contain clusters of enhancers with multiple sites of eRNA synthesis (~5), this gives an effective synthesis rate of . This allows us to approximately obtain the ratio of diffusive and reactive time-scales as 2 − 1000 over the range of parameters including diffusivity and radii of cluster.
Calculation of charge balance
Charge-balance calculations were performed (Figures 2 S2, S3 and S4) employing the following method. Net protein charge per molecule was calculated as , for the relevant sequence including the GFP tag. RNA Charge per molecule was calculated as , assuming an approximate charge of −1 per nucleotide (Lin et al., 2019). Next, the charge balance ratio was computed at a particular RNA and protein concentration as:
The effective concentration of MED1-IDR in our assays was 1000nM. Our results were not quantitatively affected by inclusion/exclusion of the partial charge on Histidine residues, partly due to their low frequency on the protein sequences. For Heparin, a charge of roughly −3 per monomer was employed (Lin et al., 2020) and for single-stranded DNA, a charge of −1 per nt was employed. A comprehensive listing of charges of various species employed in this study are provided in Table S2. The Pearson correlation coefficient (r) was calculated between the median droplet partition value at different concentrations and the relevant charge-balance ratios and reported in Figures 2, S2, S3, and S4. A higher correlation implies that experimental data follow a similar qualitative trend as the estimated charge-balance curves. The code for performing these calculations are available at: https://github.com/krishna-shrinivas/2020_Henninger_Oksuz_Shrinivas_RNA_feedback.
Transcription inhibition by small molecules
For small molecule inhibition experiments, cells were treated with 100 μM DRB (Sigma), or 1 μM Actinomycin-D (Sigma) in 2i media (detailed above) for 30 minutes, then imaged. For wash-out experiments, media was replaced with fresh 2i media and cells were allowed to recover for 1 hour, then the cells were imaged.
Condensate size
Cells with endogenously-tagged Med1-GFP (Sabari et al., 2018) were plated on glass-bottom dishes (Mattek) coated with poly-L-ornithine (Sigma) and laminin (ThermoFisher). Mock (DMSO) and treated cells were imaged on a LSM 880 Confocal Microscope with Airyscan to obtain super-resolution z-stacks for at least 8 different fields containing multiple cells. For quantification, a manual threshold was applied equally across all conditions to remove background, and the size of Med1-GFP puncta was quantified in 3D using the 3D object counter plugin (Fiji/ImageJ).
Condensate lifetime
HaloTag was endogenously knocked into 5′ -end of Med19 via homology-directed repair (HDR) in mouse embryonic stem cells (R1 mESCs). Three single-guide RNAs (sgRNAs) targeting +/− 100 bps from the start codons of Med19 gene were designed using the web-based CRISPR Design tool (http://crispr.mit.edu) and integrated into a Streptococcus pyogenes Cas9 vector (Addgene #62988) for standard CRISPR/Cas9 editing. Single positive colonies were sorted by fluorescence-activated cell sorting (FACS) and validated under the microscope.
Cells were cultured in serum-free 2i medium on poly-L-ornithine (PLO) and Laminin-coated flasks for more than two days and then were transferred onto coated imaging dishes for another day. Before imaging, cells were stained with (PA)-JF549-HaloTAG dye (a gift from Luke Lavis Lab, Janelia Research Campus) of 100nM concentration for 2 hours followed by a 60-minute wash in fresh 2i medium. Lastly, dishes were filled in with 2ml Leibovitz’s L-15 Medium (no phenol red, Thermo Fisher) and brought to the microscope for imaging.
Photo-activation localization microscopy (PALM) imaging was performed using a Nikon Eclipse Ti microscope with a 100x oil immersion objective (NA 1.40) (Nikon, Tokyo, Japan). A 405nm beam of 100mW power (attenuated with 25% AOTF) and a 561nm beam of 500mW power were columnated and superposed to perform simultaneous activation and excitation. The combined beam was expanded and re-collimated with an achromatic beam expander (AC254–040-A and AC508–300-A, THORLABS) to improve the uniformity of illumination across the whole region of interest (ROI 256^2 pixels). Images were acquired with an Andor iXon Ultra 897 EMCCD camera (gain 1000, exposure time 50ms) interfaced through Micro Manager 1.4. 2400 frames were acquired for each imaging cycle. The cells were maintained at 37°C in a temperature-controlled platform (InVivo Scientific, St. Louis, MO) on the microscope stage during image acquisition. Med19-Halo cluster lifetimes were calculated as previously described using the qSR software (dark time tolerance = 20 frames, min cluster size=50) (Andrews et al., 2018), and a cumulative distribution was generated using Prism software (GraphPad).
Nascent RNA imaging
For the nascent RNA experiments in Figure S7A-7C, 1.25×10⁵ wildtype mESCs were plated on coverslips coated with poly-L-ornithine (Sigma) and Laminin (ThermoFisher). After overnight plating, nascent RNA labeling with 2.5 mM EU was done with the Click-iT™ RNA Alexa Fluor™ 594 Imaging Kit (Thermofisher) according to manufacturer instructions for 10 minutes. After incubation, cells were immediately fixed with 4% paraformaldehyde for 10 minutes, washed 3X with PBS, then permeabilized with 0.5% TritonX-100 in PBS for 15 minutes. After the Click-iT reaction, coverslips were blocked with 4% RNase-free BSA in PBS for 10 minutes at room temperature. Coverslips were incubated with primary antibodies (1:500; rabbit Abcam ab64965 for MED1 and rat Millipore Sigma 04–1571 for Pol II-S2) in 4%BSA/PBS at room temperature overnight. The next day, coverslips were washed 3X with PBS, then incubated in secondary antibody (1:500;goat anti-rabbit AlexaFluor-488 Thermofisher A11008, goat anti-rat AlexaFluor-647 Invivittrorosecondary antibody (1:5ro00; goat angen A2ti-rabbit AlexaFluor-488 Thermofisher A11008, goat anti-rat gen A2124gen A21247) for 1 hour at room temperature. After washing 3X with PBS, coverslips were stained with 1:1000 Hoechst 33342 in PBS, incubated for 15 minutes at room temperature, washed 3X with PBS, and mounted on imaging slides with Vectashield Mounting Media. Images were collected on the RPI Spinning Disk confocal. Representative images in Figure S7A are single z-planes of median-subtracted (px=10) and Gaussian smoothed (sigma=1) channels to correct for uneven illumination and background.
For analysis of these images, nuclei were segmented using the Cellpose algorithm (Stringer et al., 2020) on the 405 Hoechst channel images. For average image analysis in Figure S7B, all channel images were maximally projected, subtracted by median filter (px=10), and Gaussian smoothed (sigma=1). The center of MED1 and Pol II-S2 puncta were segmented as follows. The Laplace of Gaussian transformation (sigma=3) was applied to the images using the scikit-image package in python, and puncta were identified above a threshold intensity 3 standard deviations above the mean of the image. All spots were confirmed to be in nuclei. A 1μm by 1μm box was centered on the spots, and the box subimage was collected for that region in both the processed MED1 and Pol II-S2 channel images. These subimages from >10 imaged fields were stacked and averaged, which was the input for the contour plots in Figure S7B. Radial intensity plots in Figure S7C show the distribution of these averaged signals as a function of the distance from the center of the spot, along with their correlation to EU RNA signal..
Reporter assay to determine the effect of local RNA synthesis on transcription
Vectors used in the reporter assay are modified from pTETRIS-cargo vector, gift from J. M. Calabrese (Kirk et al., 2018). 6X STOP codon sequence was cloned into NotI digested pTETRIS-cargo vector using Gibson cloning strategy by following the manufacturer’s instructions (NEB). This vector is called pTETRIS-cargo-STOP. The feedback gene and the reporter gene have their own polyA termination signal (200–300 bp) to terminate transcription. There is 51 bp between these two polyA signals that are facing each other. The reporter gene is regulated by a phosphoglycerate kinase (PGK) promoter. Various versions of the pTETRIS-cargo-STOP using Gibson cloning strategy (NEB): i) the relative orientations of the feedback RNA and luciferase reporter were altered (tandem or divergent orientations) ii) feedback RNAs and luciferase reporter were cloned into separate vectors. Using Gibson cloning strategy (NEB), various RNA sequences were cloned downstream of the 6X STOP sequence to prevent translation of these RNAs. Stable cell lines for individual RNAs were generated by transfecting Med1-GFP mESCs with the following vectors: 1.0 μg pTETRIS-cargo-STOP containing individual RNAs, 1.0 μg rTTA-cargo, gift from J. M. Calabrese (Kirk et al., 2018), and 1 μg piggyBAC transposase (Systems Biosciences). Cells were selected on puromycin (2 μg/ml) and G418 (200 μg/ml) for 1 week for successful integrations. For luciferase assays, 1×10⁵ cells of each genotype were plated in triplicate on 0.2%-gelatin-coated 24-well plates and allowed to settle overnight. Cells were treated with doxycycline (Sigma) and harvested after 24 h to measure either luciferase activity or to purify RNA. Luciferase activity was measured using the Luciferase Assay System (Promega) according to manufacturer instructions. Luciferase signal was normalized to total protein content, measured by BCA protein assay kit (Invitrogen, #23227), and then normalized to a control not treated with doxycycline. To measure RNA expression, RNA was purified using the Qiagen RNeasy Mini kit (Qiagen) according to manufacturer instructions, cDNA was generated by Superscript III (Invitrogen) according to manufacturer instructions, and 10 ng of cDNA was used in a qRT-PCR SYBR-green reaction (Life Technologies) with primers specific to a common sequence shared across the vectors (qPCR_Tetris, Table S1). Ct values were normalized to a housekeeping gene (qPCR_mActb, Table S1) and a control condition with no doxycycline treatment.
For the washout experiments in Figure S7J, reporter cells were plated as described above. After 24 hours of dox treatment, media was replaced with fresh media, whereas control cell media was replaced with dox-containing media. After an additional 24 hours, luciferase levels were measured as described above. For the antisense oligo experiments of Figure S7J, antisense oligos (LNA gapmers, Qiagen) were designed using the Qiagen GeneGlobe tool against the feedback RNA. A negative scrambled control was also included. Reporter cells were plated as described above in triplicate, and cells were transfected with 25 nM ASO with Lipofectamine-3000 (and no P3000 enhancer agent). After overnight transfection, cell media was replaced with dox-containing or fresh 2i media as a control. After 24 hour dox treatment, RNA and luciferase levels were quantified by qRT-PCR and luminescence, respectively, as described above. For the analysis of luciferase rescue, luminescence values of the dox conditions were first normalized to the no dox condition for that ASO, and then normalized to the dox condition of the negative scrambled control.
For imaging experiments in Figures 6C-6D, the reporter construct was modified using Gibson cloning to include a 24X-MS2 hairpin (Cho et al., 2018) at the 5′ end of the RNA sequence (2,456 nt total). Cell lines with this construct and double MS2 capsid protein fused to an mCherry tag (2xMCP-mCherry) were generated as detailed above in a mESC background with endogenously-tagged Med1-GFP (Sabari et al., 2018). 1×10⁶ reporter cells were plated on glass-bottom dishes (Mattek) coated with poly-L-ornithine (Sigma) and Laminin (ThermoFisher) After overnight plating, cells were treated with 10, 100, or 1000 ng/mL doxycycline for 24 hours. Cells were imaged on an RPI Spinning Disk Confocal with the following laser powers and exposure times: 488 70% 500 ms, 561 40% 300 ms. Images were maximum projected, median subtracted (px=10), and Gaussian filtered (sigma=1) to correct for uneven illumination and background subtraction. For analysis of these images in Figure 6D, nuclei were segmented using the Cellpose algorithm (Stringer et al., 2020) on images from the 561 channel that had been subjected to a maximum and median filter (px=10). For average image analysis, both the RNA and MED1-GFP channel images were maximally projected, subtracted by median filter (px=10), and Gaussian smoothed (sigma=1). The centers of RNA spots in a maximum projection of the 561 channel were manually marked using ImageJ. All spots were confirmed to be in nuclei. A 1μm by 1μm box was centered on the RNA spot, and the box subimage was collected for that region in both the processed RNA and MED1-GFP channel images. These subimages from >10 imaged fields were stacked and averaged, which was the input for the contour plots in Figure 6D. Radial intensity plots in Figure S7D show the distribution of these averaged signals as a function of the distance from the center of the spot. To control for global Dox effects, we quantified the size, number, and partition ratio of MED1-GFP condensates in all conditions by using a threshold of 3 standard deviations above the mean intensity of the image to segment condensates. Partition ratio for each condensate was calculated as the average intensity inside the condensate divided by the average intensity of the nucleoplasm.
QUANTIFICATION AND STATISTICAL ANALYSIS
Statistical analysis of in vitro condensate assays:
The Pearson correlation coefficient (r) was calculated between the median droplet partition value at different concentrations and the relevant charge-balance ratios (see Calculation of charge balance under Method Details. The computed values are reported in Figures 2, S2, S3, and S4. In Figure S2A, the correlation coefficient was computed between the median droplet turbidity at different conditions and the relevant charge-balance ratios. A higher correlation implies that experimental follow a similar qualitative trend as the estimated charge-l da balance curves. The code for performing these calculations are available at: https://github.com/krishna-shrinivas/2020_Henninger_Oksuz_Shrinivas_RNA_feedback.
Statistical analysis of in vitro transcription assays:
The Student’s t-test was used to determined whether the addition of spermine to the in vitro transcription assays led to statistically different outcomes in the mean of droplet size, partition ratio, and normalized transcription and the corresponding p-values are reported in the figure legends (Figure 3D-F). In the normalized transcription assay (Figure 3F), The values are normalized to the mean of the no spermine condition. The one-way ANOVA test is used to determine whether addition of exogenous RNA or absence of all NTPs leads to statistically different outcomes in droplet area or normalized transcription and the corresponding pairwise p-values (compared to control conditions i.e. no addition of exogeneous RNA) are reported in the figure legends (Figure 3H-I). These tests were performed using PRISM.
Statistical analysis of transcription inhibition experiments:
PRISM was used to compute a one-way ANOVA comparison to test whether the mean of the condensate volumes (see Method Details) was statistically different upon inhibition by DRB or ACT-D versus control (DMSO) and the corresponding p-value is reported in the Figure legend (Figure 5E). Similarly, a one-way ANOVA comparison was used to test whether the mean of the condensate lifetimes (see Method Details) were statistically different from control conditions (DMSO) and the corresponding p-values are reported in the Figure Legend (Figure 5I).
Statistical analysis of luciferase reporter experiments:
A 2-way Kolmongorov-Smirnoff test was used to determine whether the cumulative distribution functions of the average MED1 intensity centered at RNA (see Method Details) arising from replicates (values of n are represented in Figure 6D) at different Dox concentrations. The p-values are reported in the Figure legend (Figure 6D). Markers show the mean of at least 3 replicates and error bars depict the S.D. in Figures 6F-G and supplementary S7. The Pearson correlation coefficient be tween the radial intensity distributions, computed from the averaged signal analyses (see S7B, Method Details) was computed and this value is reported in S7C.
No methods were used to determine whether the data met assumptions of the statistical approach.
Supplementary Material
Figure S1 - Transcription machinery and RNA at active genes in murine embryonic stem cells (Related to Figure 1)
A. A scheme of transcription states and the number of molecules and their corresponding effective charge in a typical transcriptional condensate during initiation and bursts of transcription (STAR Methods)
B. C.D. Enrichment of transcription machinery and RNA at Trim28 (A), Pou5f1 (B) and Nanog (C) super-enhancers in mESCs. Gene tracks of ChIP-seq and nascent RNA-seq data at the indicated super-enhancers are shown. The enhancer- and promoter-derived (sense) RNAs that are used in this study are annotated in the gene tracks.
E. Nascent (left) or steady-state (right) levels of indicated RNAs at super and typical enhancers (eRNA = enhancer RNAs, uaRNA = upstream antisense promoter-associated RNAs, mRNA = messenger RNA).
F. Quantification of the number of enhancer RNA and pre-mRNA molecules in cells. Calculations are based on two biological replicates (STAR Methods).
Figure S2 - Characterization of the effect of RNA on droplet formation and dissolution (Related to Figure 2)
A. Turbidity measurements of droplets formed with MED1-IDR-GFP and indicated RNAs. Correlation between partition ratio and charge balance is determined by Pearson correlation (r).
B. Experimental design to test the effect of RNA on pre-formed MED1-IDR droplets (top). Representative images of MED1-IDR droplets and quantification of partition ratio of protein and RNA (bottom). Indicated concentrations of RNA were added after formation of droplets with 1 μM of MED1-IDR.
C. Representative images of BRD4-IDR droplets at various RNA concentrations.
D. Quantification of BRD4-IDR partition ratio from (C) and correlation with charge balance (blue lines). Correlation between partition ratio and charge balance is determined by Pearson correlation (r).
E. Purified GFP (top) or OCT4-GFP (bottom) was incubated with an enhancer RNA from the Pou5f1 locus. Whereas this RNA could stimulate MED1-IDR-GFP condensate formation, it was unable to form droplets with GFP alone or OCT4-GFP. Images were adjusted to show signal and lack of droplet formation.
F. FRAP analysis of droplets formed with MED1-IDR and RNA (top) or BRD4-IDR and RNA (bottom).
Figure S3. Modulation of charge balance between MED1-IDR and RNA contributes to stimulation and dissolution of condensates (Related to Figure 2)
A. Experimental design for testing diverse sense and antisense RNAs of different lengths on formation of MED1-IDR-GFP droplets.
B. Quantification of the partition ratios of MED1-IDR-GFP within the droplets when incubated with RNAs of different lengths and sequences. Correlation between partition ratio and charge balance is determined by Pearson correlation (r).
C. Quantification of the partition ratios of MED1-IDR-GFP within the droplets when incubated with antisense versions of the RNAs in (B). Correlation between partition ratio and charge balance is determined by Pearson correlation (r).
D. Representative images of MED1-IDR droplets (left), which are formed with or without RNA and are subjected to increasing concentration of monovalent salt (NaCl). Quantification of partition ratios of MED1-IDR-GFP within the droplets are indicated (right).
Figure S4 - Formation and dissolution of MED1-IDR-GFP droplets through electrostatic interactions (Related to Figure 2)
A. Representative images for MED1-IDR-GFP in a two-component phase diagram for MED1-IDR and Pou5f1 eRNA.
B. Quantification of MED1-IDR partition ratio for (A).
C. Representative images for RNA-Cy5 in a two-component phase diagram for MED1-IDR and Pou5f1 eRNA in (A).
D. Quantification of RNA-Cy5 partition ratio and charge balance ratio for (C). Correlation between partition ratio and charge balance is determined by Pearson correlation (r).
E. Representative images of droplets formed with single-stranded DNA (top) or heparin (bottom).
F. Quantification of MED1-IDR partition ratio for images in (E). Correlation between partition ratio and charge balance is determined by Pearson correlation (r).
G. Representative images of droplets formed with MED1-IDR RHK>A and Pou5f1 enhancer RNA
H. Quantification of MED1-IDR partition ratio for images in (G).
Figure S5 - Charged interactions in reconstituted mammalian transcription and droplets (Related to Figure 3)
A. Representative images of transcription reactions with addition of 2mM NTPs, 200 mM NaCl, and 500 nM Heparin.
B. Quantification of droplet area of droplets in (A).
C. Quantification of DNA-Cy3 partitioning from droplets in (A).
D. qRT-PCR measurement of template-derived RNA synthesis in the reconstituted transcription reactions from (A).
Figure S6 - Computational model for non-equilibrium RNA feedback on transcriptional condensates (Related to Figure 4)
A. Regions where mixtures of protein and RNA phase separate spontaneously (red, left panel) are calculated from the Landau free-energy (Figure 4C) by analyzing the Jacobian (spinodal analyses, STAR Methods). As expected from the re-entry transition, increasing RNA concentration (abscissa) at fixed protein levels can start from a region promoting phase separation, and beyond a threshold, drive re-entry into dilute phase. The right panel shows the initial direction of the instability (STAR Methods), which indicates the RNA is enriched in protein condensates (value>0, green shade), while at higher concentrations, RNA de-densifies the condensed phase (value<0).
B. Similar analyses as in (A) are performed on a free-energy derived from Flory-Huggins model (STAR Methods).
C. Variation of condensate radius (left panel, normalized to value of R at kp =0.02) and condensate lifetime (right panel) with effective rates of RNA synthesis (kp, abscissa) for simulations performed in 3D employing the Landau free-energy (Figure 4C, STAR Methods). Low values of kp promote condensate stability whereas higher rates drive dissolution. The dashed line in the right-panel represents the conditions under which condensates are stable in the simulations and condensate lifetime is presented in units of simulation time (STAR Methods).
D. Similar analyses as in (C) are performed on a free-energy derived from Flory-Huggins model on a 2D grid (STAR Methods). Values of the condensate radius are normalized to value of R at kp = 0.08..
E. Partition ratio, computed as maximum RNA concentration in condensate divided by dilute phase concentrations, are presented for simulations employing the Landau free-energy in 2 & 3-D as well as those employing the Flory-Huggins model in 2-D (left to right). When condensates are dissolved, the expected value of this ratio is 1 (as depicted by dashed gray lines). These calculations correspond to simulation data from Figures 4D-E, S6C, and S6D, respectively (left to right).
F. RNA diffusivity/mobility decreases with increasing protein concentration (abscissa) with an inverse correlation (left panel, ), consistent with ideal models of crowding. Variation of condensate radius (middle, normalized to r=6.0 units) and lifetime (right) with effective rates of RNA synthesis under conditions of phase-dependent RNA mobility. The simulations recapitulate key trends predicted by models with constant diffusion/mobility that are shown in Figures 4E-F.
Figure S7 - The effect of local RNA synthesis on transcriptional condensates and transcription in cells (Related to Figure 4,5, 6)
A. Immunofluorescence of MED1 and POL2-S2 with EU-labeled RNA (10-minute incubation) in WT mESCs. Representative images are a single z-plane that has been subtracted by a median-filtered image and smoothed (STAR Methods)
B. Average signal analysis of EU-RNA, MED1 and POL2-S2. Average EU-RNA signal is centered at MED1 puncta (top) or at POL2-S2 puncta (bottom).
C. Radial distribution function with correlation between EU and MED1 (top) or POLII-S2 (bottom) channels for average IF signal in (B).
D. Radial distribution function of MED1-GFP signal for multiple dox concentrations from experiments in Figure 6C.
E. Global quantification of the volume (left), number per cell (middle), and partition ratio (right) of MED1-GFP condensates in reporter cells at multiple Dox concentrations.
F. Quantification of luciferase luminescence with increasing dox concentrations to stimulate expression of short (185 nt) and long (1313 nt) feedback RNAs with indicated orientations of feedback RNA and luciferase gene. The convergent data was collected as part of Figure 6G. Markers show the mean of at least 3 replicates and error bars depict the S.D.
G. Quantification of luciferase luminescence with increasing dox concentration to stimulate expression of short (185 nt) and long (1313 nt) feedback RNAs with cis or trans integration of feedback RNA and luciferase reporter gene. The cis data was collected as part of Figure 6G. Markers show the mean of at least 3 replicates and error bars depict the S.D.
H. RT-qPCR of neighboring puromycin resistance marker gene with and without stimulation of long (1313 nt) feedback RNA expression with dox.
I. RT-qPCR of luciferase mRNA gene with primers detecting truncated and full-length RNA with and without stimulation of long (1313 nt) feedback RNA expression with dox.
J. Quantification of luciferase luminescence with increasing dox concentration to stimulate expression of short (185 nt) and long (1313 nt) feedback RNAs, before and after dox washout.
K. The effect of antisense-oligo mediated degradation of feedback RNAs on luciferase luminescence. The expression of the feedback RNAs are measured by RT-qPCR (left bar graphs) and luciferase expression is measured by luminescence (right bar graphs). The luminescence values were first normalized to the no dox condition for that ASO, and then normalized to the dox condition of the negative control ASO.
Table S1 – Oligonucleotides used in this study, Related to STAR Methods
Table S2 - Lengths and charges of nucleic acids and proteins used in this study, Related to Figures 1, 2, 3
Highlights.
Regulation of transcription by a non-equilibrium RNA feedback mechanism
Low levels of RNA at regulatory elements promote condensate formation
High levels of RNA from gene transcription can dissolve condensates
Charge-balance of electrostatic interactions can account for RNA feedback regulation
ACKNOWLEDGMENTS
We are grateful to Dora Tang and Ankur Jain for discussions on complex coacervates and their regulation by RNA. We also thank Mehdan Kardar and Young lab members for discussions; D. Reinberg, J.M. Calabrese, R. Jaenisch, and I. Cheeseman for reagents; W. Salmon of the W. M. Keck Microscopy Facility; E. Diel of the Harvard Center for Biomedical Imaging. This work was supported by NIH grants GM123511 (R.A.Y.), CA155258 (R.A.Y.), 1F32CA254216-01 (J.E.H.), GM134734 (I.I.C.), NSF grant PHY-1743900 (A.K.C., R.A.Y., and P.A.S.), and by the Gruss-Lipper Postdoctoral Fellowship and the Rothschild Postdoctoral Fellowship (I.S.).
R.A.Y. is a founder and shareholder of Syros Pharmaceuticals, Camp4 Therapeutics, Omega Therapeutics, and Dewpoint Therapeutics. T.I.L. is a shareholder of Syros Pharmaceuticals and a consultant to Camp4 Therapeutics. A.K.C. and P.A.S. are shareholders and consultants to Dewpoint Therapeutics. A.K.C. is a SAB member of Omega Therapeutics. Whitehead Institute has filed a patent application based on this study.
Footnotes
DECLARATION OF INTERESTS
All other authors declare no competing interests.
Publisher's Disclaimer: This is a PDF file of an unedited manuscript that has been accepted for publication. As a service to our customers we are providing this early version of the manuscript. The manuscript will undergo copyediting, typesetting, and review of the resulting proof before it is published in its final form. Please note that during the production process errors may be discovered which could affect the content, and all legal disclaimers that apply to the journal pertain.
REFERENCES
- Adelman K, and Lis JT (2012). Promoter-proximal pausing of RNA polymerase II: emerging roles in metazoans. Nat Rev Genet 13, 720–731. [DOI] [PMC free article] [PubMed] [Google Scholar]
- Adhikari S, Leaf MA, and Muthukumar M. (2018). Polyelectrolyte complex coacervation by electrostatic dipolar interactions. J Chem Phys 149, 163308. [DOI] [PubMed] [Google Scholar]
- Andersson R, Gebhard C, Miguel-Escalada I, Hoof I, Bornholdt J, Boyd M, Chen Y, Zhao X, Schmidl C, Suzuki T, et al. (2014). An atlas of active enhancers across human cell types and tissues. Nature 507, 455–461. [DOI] [PMC free article] [PubMed] [Google Scholar]
- Andrews JO, Conway W, Cho W-K, Narayanan A, Spille J-H, Jayanth N, Inoue T, Mullen S, Thaler J, and Cissé II (2018). qSR: a quantitative super-resolution analysis tool reveals the cell-cycle dependent organization of RNA Polymerase I in live human cells. Scientific Reports 8, 1–10. [DOI] [PMC free article] [PubMed] [Google Scholar]
- Aumiller WM, Pir Cakmak F, Davis BW, and Keating CD (2016). RNA-Based Coacervates as a Model for Membraneless Organelles: Formation, Properties, and Interfacial Liposome Assembly. Langmuir 32, 10042–10053. [DOI] [PubMed] [Google Scholar]
- Azofeifa JG, Allen MA, Hendrix JR, Read T, Rubin JD, and Dowell RD (2018). Enhancer RNA profiling predicts transcription factor activity. Genome Res 28, 334–344. [DOI] [PMC free article] [PubMed] [Google Scholar]
- Banani SF, Lee HO, Hyman AA, and Rosen MK (2017). Biomolecular condensates: Organizers of cellular biochemistry. Nature Reviews Molecular Cell Biology 18, 285–298. [DOI] [PMC free article] [PubMed] [Google Scholar]
- Banerjee PR, Milin AN, Moosa MM, Onuchic PL, and Deniz AA (2017). Reentrant Phase Transition Drives Dynamic Substructure Formation in Ribonucleoprotein Droplets. Angewandte Chemie International Edition 56, 11354–11359. [DOI] [PMC free article] [PubMed] [Google Scholar]
- Bergot MO, Diaz-Guerra MJ, Puzenat N, Raymondjean M, and Kahn A. (1992). Cis-regulation of the L-type pyruvate kinase gene promoter by glucose, insulin and cyclic AMP. Nucleic Acids Res 20, 1871–1877. [DOI] [PMC free article] [PubMed] [Google Scholar]
- Blair DGR (1985). Activation of mammalian RNA polymerases by polyamines. International Journal of Biochemistry 17, 23–30. [DOI] [PubMed] [Google Scholar]
- Boeynaems S, Holehouse AS, Weinhardt V, Kovacs D, Lindt JV, Larabell C, Bosch LVD, Das R, Tompa PS, Pappu RV, et al. (2019). Spontaneous driving forces give rise to protein–RNA condensates with coexisting phases and complex material properties. PNAS 116, 7889–7898. [DOI] [PMC free article] [PubMed] [Google Scholar]
- Boija A, Klein IA, Sabari BR, Dall’Agnese A, Coffey EL, Zamudio AV, Li CH, Shrinivas K, Manteiga JC, Hannett NM, et al. (2018). Transcription Factors Activate Genes through the PhaseSeparation Capacity of Their Activation Domains. Cell 175, 1842–1855 e16. [DOI] [PMC free article] [PubMed] [Google Scholar]
- Brandman O, and Meyer T. (2008). Feedback Loops Shape Cellular Signals in Space and Time. Science 322, 390–395. [DOI] [PMC free article] [PubMed] [Google Scholar]
- Bruhat A, Jousse C, Carraro V, Reimold AM, Ferrara M, and Fafournoux P. (2000). Amino Acids Control Mammalian Gene Transcription: Activating Transcription Factor 2 Is Essential for the Amino Acid Responsiveness of the CHOP Promoter. Mol Cell Biol 20, 7192–7204. [DOI] [PMC free article] [PubMed] [Google Scholar]
- Cambridge SB, Gnad F, Nguyen C, Bermejo JL, Krüger M, and Mann M. (2011). Systems-wide Proteomic Analysis in Mammalian Cells Reveals Conserved, Functional Protein Turnover. J. Proteome Res 10, 5275–5284. [DOI] [PubMed] [Google Scholar]
- Carey MF, Peterson CL, and Smale ST (2009). Transcriptional Regulation in Eukaryotes: Concepts, Strategies, and Techniques, Second Edition. [Google Scholar]
- Catarino RR, and Stark A. (2018). Assessing sufficiency and necessity of enhancer activities for gene expression and the mechanisms of transcription activation. Genes Dev. 32, 202–223. [DOI] [PMC free article] [PubMed] [Google Scholar]
- Chen H, and Larson DR (2016). What have single-molecule studies taught us about gene expression? Genes Dev. 30, 1796–1810. [DOI] [PMC free article] [PubMed] [Google Scholar]
- Chen W, Smeekens JM, and Wu R. (2016). Systematic study of the dynamics and half-lives of newly synthesized proteins in human cells. Chem. Sci 7, 1393–1400. [DOI] [PMC free article] [PubMed] [Google Scholar]
- Chiu AC, Suzuki HI, Wu X, Mahat DB, Kriz AJ, and Sharp PA (2018). Transcriptional Pause Sites Delineate Stable Nucleosome-Associated Premature Polyadenylation Suppressed by U1 snRNP. Molecular Cell 69, 648–663.e7. [DOI] [PMC free article] [PubMed] [Google Scholar]
- Cho W-K, Jayanth N, English BP, Inoue T, Andrews JO, Conway W, Grimm JB, Spille JH, Lavis LD, Lionnet T, et al. (2016). RNA Polymerase II cluster dynamics predict mRNA output in living cells. ELife 5, e13617. [DOI] [PMC free article] [PubMed] [Google Scholar]
- Cho W-KK, Spille J-HH, Hecht M, Lee C, Li C, Grube V, Cisse II, Lee C, Hecht M, Cho W-KK, et al. (2018). Mediator and RNA polymerase II clusters associate in transcription-dependent condensates. Science 361, 412–415. [DOI] [PMC free article] [PubMed] [Google Scholar]
- Chubb JR, Trcek T, Shenoy SM, and Singer RH (2006). Transcriptional Pulsing of a Developmental Gene. Current Biology 16, 1018–1025. [DOI] [PMC free article] [PubMed] [Google Scholar]
- Cisse II, Izeddin I, Causse SZ, Boudarene L, Senecal A, Muresan L, Dugast-Darzacq C, Hajj B, Dahan M, and Darzacq X. (2013). Real-Time Dynamics of RNA Polymerase II Clustering in Live Human Cells. Science 341, 664–667. [DOI] [PubMed] [Google Scholar]
- Core L, and Adelman K. (2019). Promoter-proximal pausing of RNA polymerase II: a nexus of gene regulation. Genes Dev. 33, 960–982. [DOI] [PMC free article] [PubMed] [Google Scholar]
- Core LJ, Martins AL, Danko CG, Waters CT, Siepel A, and Lis JT (2014). Analysis of nascent RNA identifies a unified architecture of initiation regions at mammalian promoters and enhancers. Nat Genet 46, 1311–1320. [DOI] [PMC free article] [PubMed] [Google Scholar]
- Cramer P. (2019). Organization and regulation of gene transcription. Nature 573, 45–54. [DOI] [PubMed] [Google Scholar]
- Delaney KT, and Fredrickson GH (2017). Theory of polyelectrolyte complexation-Complex coacervates are self-coacervates. J Chem Phys 146, 224902. [DOI] [PubMed] [Google Scholar]
- Di Tommaso P, Chatzou M, Floden EW, Barja PP, Palumbo E, and Notredame C. (2017). Nextflow enables reproducible computational workflows. Nature Biotechnology 35, 316–319. [DOI] [PubMed] [Google Scholar]
- Dignam JD, Lebovitz RM, and Roeder RG (1983). Accurate transcription initiation by RNA polymerase II in a soluble extract from isolated mammalian nuclei. Nucleic Acids Res 11, 1475–1489. [DOI] [PMC free article] [PubMed] [Google Scholar]
- Dobin A, Davis CA, Schlesinger F, Drenkow J, Zaleski C, Jha S, Batut P, Chaisson M, and Gingeras TR (2013). STAR: ultrafast universal RNA-seq aligner. Bioinformatics 29, 15–21. [DOI] [PMC free article] [PubMed] [Google Scholar]
- Drobot B, Iglesias-Artola JM, Le Vay K, Mayr V, Kar M, Kreysing M, Mutschler H, and Tang T-YD (2018). Compartmentalised RNA catalysis in membrane-free coacervate protocells. Nat Commun 9, 3643. [DOI] [PMC free article] [PubMed] [Google Scholar]
- Dunlap JC (1999). Molecular Bases for Circadian Clocks. Cell 96, 271–290. [DOI] [PubMed] [Google Scholar]
- Ebert BL, and Bunn HF (1999). Regulation of the erythropoietin gene. Blood 94, 1864–1877. [PubMed] [Google Scholar]
- Elowitz MB, and Leibler S. (2000). A synthetic oscillatory network of transcriptional regulators. Nature 403, 335–338. [DOI] [PubMed] [Google Scholar]
- Ewels PA, Peltzer A, Fillinger S, Patel H, Alneberg J, Wilm A, Garcia MU, Di Tommaso P, and Nahnsen S. (2020). The nf-core framework for community-curated bioinformatics pipelines. Nature Biotechnology 38, 276–278. [DOI] [PubMed] [Google Scholar]
- Fay MM, and Anderson PJ (2018). The role of RNA in biological phase separations. J Mol Biol 430, 4685–4701. [DOI] [PMC free article] [PubMed] [Google Scholar]
- Flores O, Lu H, and Reinberg D. (1992). Factors involved in specific transcription by mammalian RNA polymerase II. Identification and characterization of factor IIH. J. Biol. Chem 267, 2786–2793. [PubMed] [Google Scholar]
- Flory PJ (1942). Thermodynamics of High Polymer Solutions. J. Chem. Phys 10, 51–61. [Google Scholar]
- Frankel EA, Bevilacqua PC, and Keating CD (2016). Polyamine/Nucleotide Coacervates Provide Strong Compartmentalization of Mg2+, Nucleotides, and RNA. Langmuir 32, 2041–2049. [DOI] [PubMed] [Google Scholar]
- Fukaya T, Lim B, and Levine M. (2016). Enhancer Control of Transcriptional Bursting. Cell 166, 358–368. [DOI] [PMC free article] [PubMed] [Google Scholar]
- Gardini A, and Shiekhattar R. (2015). The many faces of long noncoding RNAs. The FEBS Journal 282, 1647–1657. [DOI] [PMC free article] [PubMed] [Google Scholar]
- Gardner TS, Cantor CR, and Collins JJ (2000). Construction of a genetic toggle switch in Escherichia coli. Nature 403, 339–342. [DOI] [PubMed] [Google Scholar]
- Gu B, Swigut T, Spencley A, Bauer MR, Chung M, Meyer T, and Wysocka J. (2018). Transcription-coupled changes in nuclear mobility of mammalian cis-regulatory elements. Science 359, 1050–1055. [DOI] [PMC free article] [PubMed] [Google Scholar]
- Guo YE, Manteiga JC, Henninger JE, Sabari BR, Dall’Agnese A, Hannett NM, Spille J-H, Afeyan LK, Zamudio AV, Shrinivas K, et al. (2019). Pol II phosphorylation regulates a switch between transcriptional and splicing condensates. Nature 572, 543–548. [DOI] [PMC free article] [PubMed] [Google Scholar]
- Guyer JE, Wheeler D, and Warren JA (2009). FiPy: Partial Differential Equations with Python. Comput. Sci. Eng 11, 6–15. [Google Scholar]
- Henriques T, Scruggs BS, Inouye MO, Muse GW, Williams LH, Burkholder AB, Lavender CA, Fargo DC, and Adelman K. (2018). Widespread transcriptional pausing and elongation control at enhancers. Genes Dev. 32, 26–41. [DOI] [PMC free article] [PubMed] [Google Scholar]
- Hnisz D, Shrinivas K, Young RA, Chakraborty AK, and Sharp PA (2017). A Phase Separation Model for Transcriptional Control. Cell 169, 13–23. [DOI] [PMC free article] [PubMed] [Google Scholar]
- Hohenberg PC, and Halperin BI (1977). Theory of dynamic critical phenomena. Rev. Mod. Phys 49, 435–479. http://crispr.mit.edu Guide Design Resources. [Google Scholar]
- Jangi M, and Sharp PA (2014). Building Robust Transcriptomes with Master Splicing Factors. Cell 159, 487–498. [DOI] [PMC free article] [PubMed] [Google Scholar]
- Jin Y, Eser U, Struhl K, and Churchman LS (2017). The Ground State and Evolution of Promoter Region Directionality. Cell 170, 889–898.e10. [DOI] [PMC free article] [PubMed] [Google Scholar]
- Kardar M. (2007). Statistical physics of fields (Cambridge: Cambridge Univ. Press; ). [Google Scholar]
- Karolchik D, Hinrichs AS, Furey TS, Roskin KM, Sugnet CW, Haussler D, and Kent WJ (2004). The UCSC Table Browser data retrieval tool. Nucleic Acids Res. 32, D493–496. [DOI] [PMC free article] [PubMed] [Google Scholar]
- Kim T-K, Hemberg M, Gray JM, Costa AM, Bear DM, Wu J, Harmin DA, Laptewicz M, Barbara-Haley K, Kuersten S, et al. (2010). Widespread transcription at neuronal activity-regulated enhancers. Nature 465, 182–187. [DOI] [PMC free article] [PubMed] [Google Scholar]
- Kirk JM, Kim SO, Inoue K, Smola MJ, Lee DM, Schertzer MD, Wooten JS, Baker AR, Sprague D, Collins DW, et al. (2018). Functional classtificon of long non-coding RNAs by k-mer a content. Nature Genetics 50, 1474–1482. [DOI] [PMC free article] [PubMed] [Google Scholar]
- Klein IA, Boija A, Afeyan LK, Hawken SW, Fan M, Dall’Agnese A, Oksuz O, Henninger JE, Shrinivas K, Sabari BR, et al. (2020). Partitioning of cancer therapeutics in nuclear condensates. Science 368, 1386–1392. [DOI] [PMC free article] [PubMed] [Google Scholar]
- Lahav G, Rosenfeld N, Sigal A, Geva-Zatorsky N, Levine AJ, Elowitz MB, and Alon U. (2004). Dynamics of the p53-Mdm2 feedback loop in individual cells. Nat Genet 36, 147–150. [DOI] [PubMed] [Google Scholar]
- Lai F, Orom UA, Cesaroni M, Beringer M, Taatjes DJ, Blobel GA, and Shiekhattar R. (2013). Activating RNAs associate with Mediator to enhance chromatin architecture and transcription. Nature 494, 497–501. [DOI] [PMC free article] [PubMed] [Google Scholar]
- Landau LD (1937). ON THE THEORY OF PHASE TRANSITIONS. Zh. Eksp. Teor. Fiz 11, 19. [Google Scholar]
- Langmead B, and Salzberg SL (2012). Fast gapped-read alignment with Bowtie 2. Nature Methods 9, 357–359. [DOI] [PMC free article] [PubMed] [Google Scholar]
- Langmead B, Trapnell C, Pop M, and Salzberg SL (2009). Ultrafast and memory-efficient alignment of short DNA sequences to the human genome. Genome Biology 10, R25. [DOI] [PMC free article] [PubMed] [Google Scholar]
- Larsson AJM, Johnsson P, Hagemann-Jensen M, Hartmanis L, Faridani OR, Reinius B, Segerstolpe Å, Rivera CM, Ren B, and Sandberg R. (2019). Genomic encoding of transcriptional burst kinetics. Nature 565, 251–254. [DOI] [PMC free article] [PubMed] [Google Scholar]
- Leinonen R, Sugawara H, and Shumway M. (2011). The Sequence Read Archive. Nucleic Acids Res 39, D19–D21. [DOI] [PMC free article] [PubMed] [Google Scholar]
- LeRoy G, Rickards B, and Flint SJ (2008). The Double Bromodomain Proteins Brd2 and Brd3 Couple Histone Acetylation to Transcription. Molecular Cell. [DOI] [PMC free article] [PubMed] [Google Scholar]
- LeRoy G, Oksuz O, Descostes N, Aoi Y, Ganai RA, Kara HO, Yu J-R, Lee C-H, Stafford J, Shilatifard A, et al. (2019). LEDGF and HDGF2 relieve the nucleosome-induced barrier to transcription in differentiated cells. Sci Adv 5, eaay3068. [DOI] [PMC free article] [PubMed] [Google Scholar]
- Li CH, Coffey EL, Dall’Agnese A, Hannett NM, Tang X, Henninger JE, Platt JM, Oksuz O, Zamudio AV, Afeyan LK, et al. (2020). MeCP2 links heterochromatin condensates and neurodevelopmental disease. Nature. [DOI] [PMC free article] [PubMed] [Google Scholar]
- Li H, Handsaker B, Wysoker A, Fennell T, Ruan J, Homer N, Marth G, Abecasis G, Durbin R, and 1000 Genome Project Data Processing Subgroup (2009). The Sequence Alignment/Map format and SAMtools. Bioinformatics 25, 2078–2079. [DOI] [PMC free article] [PubMed] [Google Scholar]
- Li W, Notani D, and Rosenfeld MG (2016). Enhancers as non-coding RNA transcription units: recent insights and future perspectives. Nat Rev Genet 17, 207–223. [DOI] [PubMed] [Google Scholar]
- Liao Y, Smyth GK, and Shi W. (2014). featureCounts: an efficient general purpose program for assigning sequence reads to genomic features. Bioinformatics 30, 923–930. [DOI] [PubMed] [Google Scholar]
- Lin Y, McCarty J, Rauch JN, Delaney KT, Kosik KS, Fredrickson GH, Shea J-E, and Han S. (2019). Narrow equilibrium window for complex coacervation of tau and RNA under cellular conditions. ELife 8, e42571. [DOI] [PMC free article] [PubMed] [Google Scholar]
- Lin Y, Fichou Y, Zeng Z, Hu NY, and Han S. (2020). Electrostatically Driven Complex Coacervation and Amyloid Aggregation of Tau Are Independent Processes with Overlapping Conditions. ACS Chem Neurosci 11, 615–627. [DOI] [PubMed] [Google Scholar]
- Maharana S, Wang J, Papadopoulos DK, Richter D, Pozniakovsky A, Poser I, Bickle M, Rizk S, Guillén-Boixet J, Franzmann TM, et al. (2018). RNA buffers the phase separation behavior of prion-like RNA binding proteins. Science 360, 918–921. [DOI] [PMC free article] [PubMed] [Google Scholar]
- Maiuri P, Knezevich A, De Marco A, Mazza D, Kula A, McNally JG, and Marcello A. (2011). Fast transcription rates of RNA polymerase II in human cells. EMBO Rep 12, 1280–1285. [DOI] [PMC free article] [PubMed] [Google Scholar]
- Mikhaylichenko O, Bondarenko V, Harnett D, Schor IE, Males M, Viales RR, and Furlong EEM (2018). The degree of enhancer or promoter activity is reflected by the levels and directionality of eRNA transcription. Genes Dev 32, 42–57. [DOI] [PMC free article] [PubMed] [Google Scholar]
- Milin AN, and Deniz AA (2018). Reentrant Phase Transitions and Non-Equilibrium Dynamics in Membraneless Organelles. Biochemistry 57, 2470–2477. [DOI] [PMC free article] [PubMed] [Google Scholar]
- Monod J, and Jacob F. (1961). General Conclusions: Teleonomic Mechanisms in Cellular Metabolism, Growth, and Differentiation. Cold Spring Harb Symp Quant Biol 26, 389–401. [DOI] [PubMed] [Google Scholar]
- Moruzzi G, Barbiroli B, Moruzzi MS, and Tadolini B. (1975). The effect of spermine on transcription of mammalian chromatin by mammalian deoxyribonucleic acid-dependent ribonucleic acid polymerase. Biochem J 146, 697–703. [DOI] [PMC free article] [PubMed] [Google Scholar]
- Mountain GA, and Keating CD (2020). Formation of Multiphase Complex Coacervates and Partitioning of Biomolecules within them. Biomacromolecules 21, 630–640. [DOI] [PubMed] [Google Scholar]
- Muthukumar M. (2016). Electrostatic correlations in polyelectrolyte solutions. Polym. Sci. Ser. A 58, 852–863. [DOI] [PMC free article] [PubMed] [Google Scholar]
- Nair SJ, Yang L, Meluzzi D, Oh S, Yang F, Friedman MJ, Wang S, Suter T, Alshareedah I, Gamliel A, et al. (2019). Phase separation of ligand-activated enhancers licenses cooperative chromosomal enhancer assembly. Nature Structural & Molecular Biology 26, 193–203. [DOI] [PMC free article] [PubMed] [Google Scholar]
- Niewidok B, Igaev M, Pereira da Graca A, Strassner A, Lenzen C, Richter CP, Piehler J, Kurre R, and Brandt R. (2018). Single-molecule imaging reveals dynamic biphasic partition of RNA-binding proteins in stress granules. J. Cell Biol 217, 1303–1318. [DOI] [PMC free article] [PubMed] [Google Scholar]
- Nott TJ, Petsalaki E, Farber P, Jervis D, Fussner E, Plochowietz A, Craggs TD, Bazett-Jones DP, Pawson T, Forman-Kay JD, et al. (2015). Phase Transition of a Disordered Nuage Protein Generates Environmentally Responsive Membraneless Organelles Molecular Cell 57, 936–947. [DOI] [PMC free article] [PubMed] [Google Scholar]
- Orphanides G, LeRoy G, Chang C-H, Luse DS, and Reinberg D. (1998). FACT, a Factor that Facilitates Transcript Elongation through Nucleosomes. Cell 92, 105–116. [DOI] [PubMed] [Google Scholar]
- Overbeek JTG, and Voorn MJ (1957). Phase separation in polyelectrolyte solutions. Theory of complex coacervation. Journal of Cellular and Comparative Physiology 49, 7–26. [PubMed] [Google Scholar]
- Pai DA, Kaplan CD, Kweon HK, Murakami K, Andrews PC, and Engelke DR (2014). RNAs nonspecifically inhibit RNA polymerase II by preventing binding to the DNA template. RNA 20, 644–655. [DOI] [PMC free article] [PubMed] [Google Scholar]
- Pefanis E, Wang J, Rothschild G, Lim J, Kazadi D, Sun J, Federation A, Chao J, Elliott O, Liu Z-P, et al. (2015). RNA Exosome-Regulated Long Non-Coding RNA Transcription Controls Super-Enhancer Activity. Cell 161, 774–789. [DOI] [PMC free article] [PubMed] [Google Scholar]
- Peran I, and Mittag T. (2020). Molecular structure in biomolecular condensates. Current Opinion in Structural Biology 60, 17–26. [DOI] [PMC free article] [PubMed] [Google Scholar]
- Quinlan AR, and Hall IM (2010). BEDTools: a flexible suite of utilities for comparing genomic features. Bioinformatics 26, 841–842. [DOI] [PMC free article] [PubMed] [Google Scholar]
- Rahnamoun H, Lee J, Sun Z, Lu H, Ramsey KM, Komives EA, and Lauberth SM (2018). RNAs interact with BRD4 to promote enhanced chromatin engagement and transcription activation. Nature Structural & Molecular Biology 25, 687–697. [DOI] [PMC free article] [PubMed] [Google Scholar]
- Raj A, and van Oudenaarden A. (2008). Nature, Nurture, or Chance: Stochastic Gene Expression and Its Consequences. Cell 135, 216–226. [DOI] [PMC free article] [PubMed] [Google Scholar]
- Raj A, Peskin CS, Tranchina D, Vargas DY, and Tyagi S. (2006). Stochastic mRNA Synthesis in Mammalian Cells. PLoS Biol 4. [DOI] [PMC free article] [PubMed] [Google Scholar]
- Reinberg D, and Roeder RG (1987). Factors involved in specific transcription by mammalian RNA polymerase II. Transcription factor IIS stimulates elongation of RNA chains. J. Biol. Chem 262, 3331–3337. [PubMed] [Google Scholar]
- Roden C, and Gladfelter AS (2020). RNA contributions to the form and function of biomolecular condensates. Nature Reviews Molecular Cell Biology 1–13. [DOI] [PMC free article] [PubMed] [Google Scholar]
- Rodriguez J, and Larson DR (2020). Transcription in Living Cells: Molecular Mechanisms of Bursting. Annual Review of Biochemistry 89, null. [DOI] [PubMed] [Google Scholar]
- Roeder RG (2019). 50+ years of eukaryotic transcription: an expanding universe of factors and mechanisms. Nature Structural & Molecular Biology 26, 783–791. [DOI] [PMC free article] [PubMed] [Google Scholar]
- Sabari BR, Dall’Agnese A, Boija A, Klein IA, Coffey EL, Shrinivas K, Abraham BJ, Hannett NM, Zamudio AV, Manteiga JC, et al. (2018). Coactivator condensation at super-enhancers links phase separation and gene control. Science 361, eaar3958. [DOI] [PMC free article] [PubMed] [Google Scholar]
- Sabari BR, Dall’Agnese A, and Young RA (2020). Biomolecular Condensates in the Nucleus. Trends in Biochemical Sciences 0. [DOI] [PMC free article] [PubMed] [Google Scholar]
- Schaukowitch K, Joo J-Y, Liu X, Watts JK, Martinez C, and Kim T-K (2014). Enhancer RNA Facilitates NELF Release from Immediate Early Genes. Molecular Cell 56, 29–42. [DOI] [PMC free article] [PubMed] [Google Scholar]
- Schindelin J, Arganda-Carreras I, Frise E, Kaynig V, Longair M, Pietzsch T, Preibisch S, Rueden C, Saalfeld S, Schmid B, et al. (2012). Fiji: an op peen-n-source platform for biological-image analysis. Nature Methods 9, 676–682. [DOI] [PMC free article] [PubMed] [Google Scholar]
- Scruggs BS, Gilchrist DA, Nechaev S, Muse GW, Burkholder A, Fargo DC, and Adelman K. (2015). Bidirectional Transcription Arises from Two Distinct Hubs of Transcription Factor Binding and Active Chromatin. Molecular Cell 58, 1101–1112. [DOI] [PMC free article] [PubMed] [Google Scholar]
- Seila AC, Calabrese JM, Levine SS, Yeo GW, Rahl PB, Flynn RA, Young RA, and Sharp PA (2008). Divergent Transcription from Active Promoters. Science 322, 1849–1851. [DOI] [PMC free article] [PubMed] [Google Scholar]
- Sellick CA, and Reece RJ (2003). Modulation of transcription factor function by an amino acid: activation of Put3p by proline. EMBO J 22, 5147–5153. [DOI] [PMC free article] [PubMed] [Google Scholar]
- Shin Y, and Brangwynne CP (2017). Liquid phase condensation in cell physiology and disease. Science 357, eaaf4382–eaaf4382. [DOI] [PubMed] [Google Scholar]
- Shrinivas K, Sabari BR, Coffey EL, Klein IA, Boija A, Zamudio AV, Schuijers J, Hannett NM, Sharp PA, Young RA, et al. (2019). Enhancer Features that Drive Formation of Transcriptional Condensates. Molecular Cell 75, 549–561.e7. [DOI] [PMC free article] [PubMed] [Google Scholar]
- Sigova AA, Abraham BJ, Ji X, Molinie B, Hannett NM, Guo YE, Jangi M, Giallourakis CC, Sharp PA, and Young RA (2015). Transcription factor trapping by RNA in gene regulatory elements. Science 350, 978–981. [DOI] [PMC free article] [PubMed] [Google Scholar]
- Sing CE (2017). Development of the modern theory of polymeric complex coacervation. Advances in Colloid and Interface Science 239, 2–16. [DOI] [PubMed] [Google Scholar]
- Singh J, and Padgett RA (2009). Rates of in situ transcription and splicing in large human genes. Nat Struct Mol Biol 16, 1128–1133. [DOI] [PMC free article] [PubMed] [Google Scholar]
- Smith KN, Miller SC, Varani G, Calabrese JM, and Magnuson T. (2019). Multimodal Long Noncoding RNA Interaction Networks: Control Panels for Cell Fate Specification. Genetics 213, 1093–1110. [DOI] [PMC free article] [PubMed] [Google Scholar]
- Sobell HM (1985). Actinomycin and DNA transcription. Proc Natl Acad Sci U S A 82, 5328–5331. [DOI] [PMC free article] [PubMed] [Google Scholar]
- Srivastava S, and Tirrell MV (2016). Polyelectrolyte complexation. Advances in Chemical Physics 499–544. [Google Scholar]
- Steurer B, Janssens RC, Geverts B, Geijer ME, Wienholz F, Theil AF, Chang J, Dealy S, Pothof J, van Cappellen WA, et al. (2018). Live-cell analysis of endogenous GFP-RPB1 uncovers rapid turnover of initiating and promoter-paused RNA Polymerase II. Proc Natl Acad Sci USA 115, E4368–E4376. [DOI] [PMC free article] [PubMed] [Google Scholar]
- Stringer C, Wang T, Michaelos M, and Pachitariu M. (2020). Cellpose: a generalist algorithm for cellular segmentation. BioRxiv 2020.02.02.931238. [DOI] [PubMed] [Google Scholar]
- Strom AR, and Brangwynne CP (2019). The liquid nucleome – phase transitions in the nucleus at a glance. J Cell Sci 132. [DOI] [PMC free article] [PubMed] [Google Scholar]
- Struhl K. (2007). Transcriptional noise and the fidelity of initiation by RNA polymerase II. Nat. Struct. Mol. Biol 14, 103–105. [DOI] [PubMed] [Google Scholar]
- Suter DM, Molina N, Gatfield D, Schneider K, Schibler U, and Naef F. (2011). Mammalian Genes Are Transcribed with Widely Different Bursting Kinetics. Science 332, 472–474. [DOI] [PubMed] [Google Scholar]
- Taylor NO, Wei M-T, Stone HA, and Brangwynne CP (2019). Quantifying Dynamics in Phase-Separated Condensates Using Fluorescence Recovery after Photobleaching. Biophysical Journal 117, 1285–1300. [DOI] [PMC free article] [PubMed] [Google Scholar]
- Tunnacliffe E, and Chubb JR (2020). What Is a Transcriptional Burst? Trends in Genetics 36, 288–297. [DOI] [PubMed] [Google Scholar]
- Umbarger HE (1956). Evidence for a Negative-Feedback Mechanism in the Biosynthesis of Isoleucine. Science 123, 848–848. [DOI] [PubMed] [Google Scholar]
- Whyte WA, Orlando DA, Hnisz D, Abraham BJ, Lin CY, Kagey MH, Rahl PB, Lee TI, and Young RA (2013). Master Transcription Factors and Mediator Establish Super-Enhancers at Key Cell Identity Genes. Cell 153, 307–319. [DOI] [PMC free article] [PubMed] [Google Scholar]
- Zamudio AV, Dall’Agnnneseeseese AA.,., Henninger JE, Manteiga JC, Afeyan LK, Hannett NM, Coffey EL, Li CH, Oksuz O, Sabari BR, et al. (2019). Mediator Condensates Localize Signaling Factors to Key Cell Identity Genes. Molecular Cell. [DOI] [PMC free article] [PubMed] [Google Scholar]
- Zhang P, Shen K, Alsaifi NM, and Wang Z-G (2018). Salt Partitioning in Complex Coacervation of Symmetric Polyelectrolytes. Macromolecules 51, 5586–5593. [Google Scholar]
- Zhang Y, Liu T, Meyer CA, Eeckhoute J, Johnson DS, Bernstein BE, Nusbaum C, Myers RM, Brown M, Li W, et al. (2008). Model-based Analysis of ChIP-Seq (MACS). Genome Biology 9, R137. [DOI] [PMC free article] [PubMed] [Google Scholar]
Associated Data
This section collects any data citations, data availability statements, or supplementary materials included in this article.
Supplementary Materials
Figure S1 - Transcription machinery and RNA at active genes in murine embryonic stem cells (Related to Figure 1)
A. A scheme of transcription states and the number of molecules and their corresponding effective charge in a typical transcriptional condensate during initiation and bursts of transcription (STAR Methods)
B. C.D. Enrichment of transcription machinery and RNA at Trim28 (A), Pou5f1 (B) and Nanog (C) super-enhancers in mESCs. Gene tracks of ChIP-seq and nascent RNA-seq data at the indicated super-enhancers are shown. The enhancer- and promoter-derived (sense) RNAs that are used in this study are annotated in the gene tracks.
E. Nascent (left) or steady-state (right) levels of indicated RNAs at super and typical enhancers (eRNA = enhancer RNAs, uaRNA = upstream antisense promoter-associated RNAs, mRNA = messenger RNA).
F. Quantification of the number of enhancer RNA and pre-mRNA molecules in cells. Calculations are based on two biological replicates (STAR Methods).
Figure S2 - Characterization of the effect of RNA on droplet formation and dissolution (Related to Figure 2)
A. Turbidity measurements of droplets formed with MED1-IDR-GFP and indicated RNAs. Correlation between partition ratio and charge balance is determined by Pearson correlation (r).
B. Experimental design to test the effect of RNA on pre-formed MED1-IDR droplets (top). Representative images of MED1-IDR droplets and quantification of partition ratio of protein and RNA (bottom). Indicated concentrations of RNA were added after formation of droplets with 1 μM of MED1-IDR.
C. Representative images of BRD4-IDR droplets at various RNA concentrations.
D. Quantification of BRD4-IDR partition ratio from (C) and correlation with charge balance (blue lines). Correlation between partition ratio and charge balance is determined by Pearson correlation (r).
E. Purified GFP (top) or OCT4-GFP (bottom) was incubated with an enhancer RNA from the Pou5f1 locus. Whereas this RNA could stimulate MED1-IDR-GFP condensate formation, it was unable to form droplets with GFP alone or OCT4-GFP. Images were adjusted to show signal and lack of droplet formation.
F. FRAP analysis of droplets formed with MED1-IDR and RNA (top) or BRD4-IDR and RNA (bottom).
Figure S3. Modulation of charge balance between MED1-IDR and RNA contributes to stimulation and dissolution of condensates (Related to Figure 2)
A. Experimental design for testing diverse sense and antisense RNAs of different lengths on formation of MED1-IDR-GFP droplets.
B. Quantification of the partition ratios of MED1-IDR-GFP within the droplets when incubated with RNAs of different lengths and sequences. Correlation between partition ratio and charge balance is determined by Pearson correlation (r).
C. Quantification of the partition ratios of MED1-IDR-GFP within the droplets when incubated with antisense versions of the RNAs in (B). Correlation between partition ratio and charge balance is determined by Pearson correlation (r).
D. Representative images of MED1-IDR droplets (left), which are formed with or without RNA and are subjected to increasing concentration of monovalent salt (NaCl). Quantification of partition ratios of MED1-IDR-GFP within the droplets are indicated (right).
Figure S4 - Formation and dissolution of MED1-IDR-GFP droplets through electrostatic interactions (Related to Figure 2)
A. Representative images for MED1-IDR-GFP in a two-component phase diagram for MED1-IDR and Pou5f1 eRNA.
B. Quantification of MED1-IDR partition ratio for (A).
C. Representative images for RNA-Cy5 in a two-component phase diagram for MED1-IDR and Pou5f1 eRNA in (A).
D. Quantification of RNA-Cy5 partition ratio and charge balance ratio for (C). Correlation between partition ratio and charge balance is determined by Pearson correlation (r).
E. Representative images of droplets formed with single-stranded DNA (top) or heparin (bottom).
F. Quantification of MED1-IDR partition ratio for images in (E). Correlation between partition ratio and charge balance is determined by Pearson correlation (r).
G. Representative images of droplets formed with MED1-IDR RHK>A and Pou5f1 enhancer RNA
H. Quantification of MED1-IDR partition ratio for images in (G).
Figure S5 - Charged interactions in reconstituted mammalian transcription and droplets (Related to Figure 3)
A. Representative images of transcription reactions with addition of 2mM NTPs, 200 mM NaCl, and 500 nM Heparin.
B. Quantification of droplet area of droplets in (A).
C. Quantification of DNA-Cy3 partitioning from droplets in (A).
D. qRT-PCR measurement of template-derived RNA synthesis in the reconstituted transcription reactions from (A).
Figure S6 - Computational model for non-equilibrium RNA feedback on transcriptional condensates (Related to Figure 4)
A. Regions where mixtures of protein and RNA phase separate spontaneously (red, left panel) are calculated from the Landau free-energy (Figure 4C) by analyzing the Jacobian (spinodal analyses, STAR Methods). As expected from the re-entry transition, increasing RNA concentration (abscissa) at fixed protein levels can start from a region promoting phase separation, and beyond a threshold, drive re-entry into dilute phase. The right panel shows the initial direction of the instability (STAR Methods), which indicates the RNA is enriched in protein condensates (value>0, green shade), while at higher concentrations, RNA de-densifies the condensed phase (value<0).
B. Similar analyses as in (A) are performed on a free-energy derived from Flory-Huggins model (STAR Methods).
C. Variation of condensate radius (left panel, normalized to value of R at kp =0.02) and condensate lifetime (right panel) with effective rates of RNA synthesis (kp, abscissa) for simulations performed in 3D employing the Landau free-energy (Figure 4C, STAR Methods). Low values of kp promote condensate stability whereas higher rates drive dissolution. The dashed line in the right-panel represents the conditions under which condensates are stable in the simulations and condensate lifetime is presented in units of simulation time (STAR Methods).
D. Similar analyses as in (C) are performed on a free-energy derived from Flory-Huggins model on a 2D grid (STAR Methods). Values of the condensate radius are normalized to value of R at kp = 0.08..
E. Partition ratio, computed as maximum RNA concentration in condensate divided by dilute phase concentrations, are presented for simulations employing the Landau free-energy in 2 & 3-D as well as those employing the Flory-Huggins model in 2-D (left to right). When condensates are dissolved, the expected value of this ratio is 1 (as depicted by dashed gray lines). These calculations correspond to simulation data from Figures 4D-E, S6C, and S6D, respectively (left to right).
F. RNA diffusivity/mobility decreases with increasing protein concentration (abscissa) with an inverse correlation (left panel, ), consistent with ideal models of crowding. Variation of condensate radius (middle, normalized to r=6.0 units) and lifetime (right) with effective rates of RNA synthesis under conditions of phase-dependent RNA mobility. The simulations recapitulate key trends predicted by models with constant diffusion/mobility that are shown in Figures 4E-F.
Figure S7 - The effect of local RNA synthesis on transcriptional condensates and transcription in cells (Related to Figure 4,5, 6)
A. Immunofluorescence of MED1 and POL2-S2 with EU-labeled RNA (10-minute incubation) in WT mESCs. Representative images are a single z-plane that has been subtracted by a median-filtered image and smoothed (STAR Methods)
B. Average signal analysis of EU-RNA, MED1 and POL2-S2. Average EU-RNA signal is centered at MED1 puncta (top) or at POL2-S2 puncta (bottom).
C. Radial distribution function with correlation between EU and MED1 (top) or POLII-S2 (bottom) channels for average IF signal in (B).
D. Radial distribution function of MED1-GFP signal for multiple dox concentrations from experiments in Figure 6C.
E. Global quantification of the volume (left), number per cell (middle), and partition ratio (right) of MED1-GFP condensates in reporter cells at multiple Dox concentrations.
F. Quantification of luciferase luminescence with increasing dox concentrations to stimulate expression of short (185 nt) and long (1313 nt) feedback RNAs with indicated orientations of feedback RNA and luciferase gene. The convergent data was collected as part of Figure 6G. Markers show the mean of at least 3 replicates and error bars depict the S.D.
G. Quantification of luciferase luminescence with increasing dox concentration to stimulate expression of short (185 nt) and long (1313 nt) feedback RNAs with cis or trans integration of feedback RNA and luciferase reporter gene. The cis data was collected as part of Figure 6G. Markers show the mean of at least 3 replicates and error bars depict the S.D.
H. RT-qPCR of neighboring puromycin resistance marker gene with and without stimulation of long (1313 nt) feedback RNA expression with dox.
I. RT-qPCR of luciferase mRNA gene with primers detecting truncated and full-length RNA with and without stimulation of long (1313 nt) feedback RNA expression with dox.
J. Quantification of luciferase luminescence with increasing dox concentration to stimulate expression of short (185 nt) and long (1313 nt) feedback RNAs, before and after dox washout.
K. The effect of antisense-oligo mediated degradation of feedback RNAs on luciferase luminescence. The expression of the feedback RNAs are measured by RT-qPCR (left bar graphs) and luciferase expression is measured by luminescence (right bar graphs). The luminescence values were first normalized to the no dox condition for that ASO, and then normalized to the dox condition of the negative control ASO.
Table S1 – Oligonucleotides used in this study, Related to STAR Methods
Table S2 - Lengths and charges of nucleic acids and proteins used in this study, Related to Figures 1, 2, 3
Data Availability Statement
The code generated during this study is available at: https://github.com/krishna-shrinivas/2020_Henninger_Oksuz_Shrinivas_RNA_feedback.