

Abstract
Purpose:
To determine whether racial differences in gene and miRNA expression translates to differences in lung tumor biology with clinical relevance in African Americans (AAs) and European Americans (EAs).
Experimental Design:
The NCI-Maryland Case Control Study includes seven Baltimore City hospitals and is overrepresented with AA patients (~40%). Patients that underwent curative NSCLC surgery between 1998 and 2014 were enrolled. Comparative molecular profiling used mRNA (n = 22 AAs and 19 EAs) and miRNA (n = 42 AAs and 55 EAs) expression arrays to track differences in paired fresh frozen normal tissues and lung tumor specimens from AAs and EAs. Pathway enrichment, predicted drug response, tumor microenvironment infiltration, cancer immunotherapy antigen profiling, and miRNA target enrichment were assessed.
Results:
AA-enriched differential gene expression was characterized by stem cell and invasion pathways. Differential gene expression in lung tumors from EAs was primarily characterized by cell proliferation pathways. Population-specific gene expression was partly driven by population-specific miRNA expression profiles. Drug susceptibility predictions revealed a strong inverse correlation between AA resistance and EA sensitivity to the same panel of drugs. Statistically significant differences in M1 and M2 macrophage infiltration were observed in AAs (P < 0.05); however, PD-L1, PD-L2 expression was similar between both.
Conclusions:
Comparative transcriptomic profiling revealed clear differences in lung tumor biology between AAs and EAs. Increased participation by AAs in lung cancer clinical trials are needed to integrate, and leverage, transcriptomic differences with other clinical information to maximize therapeutic benefit in both AAs and EAs.
Introduction
Lung cancer is the second most common cancer in the United States and the leading cause of cancer-related death. Annually, there are approximately 225,000 new cases of lung cancer diagnosed, and 158,000 deaths (1). Among all populations in the United States, African Americans (AAs) have the highest lung cancer incidence and mortality rates when compared with any other group (1). Studies have shown that when controlling for access to care, the disparity in survival is no longer evident (2). However, the disparity in cancer incidence remains and is primarily driven by differences between AA and European American (EA) men (1).
Smoking is the strongest risk factor for lung cancer development. The term “Smoker’s Paradox” is used to describe counterintuitive observations related to cigarette smoking patterns, behaviors, and lung cancer status across racial and ethnic groups (3). For example, AAs have a lower smoking prevalence than European Americans (EAs) but higher rates of lung cancer (3). In addition, AAs are far less likely to be heavy smokers, compared with EAs (3). It has been proposed that mentholation can affect smoking behavior (through inhalation, dependency, quit rates, and exposure to carcinogenic compounds) and it is known that approximately 70% to 80% of AA smokers choose menthol cigarettes compared with approximately 20% of EA smokers. However, several studies have shown that there is no increased risk of lung cancer among menthol cigarette smokers compared with nonmenthol cigarette smokers (4). Finally, a large study of never smokers demonstrated that AAs still had a higher incidence of lung cancer when compared with individuals of European descent (5). While smoking may contribute to cancer health disparities, the exact mechanisms by which it does so are not clear.
In prostate cancer, where disparities are also present, recent studies have suggested that up to 50% of the disparity is linked to genetics and a locus residing on 8q24 (6). Thus, it is possible that genetics could also contribute to disparities in lung cancer. The main susceptibility locus for lung cancer, 15q25, is associated with risk in Asian (7), European (8), and as shown recently, AA smokers (9). Racial differences in smoking and nicotine metabolism may also affect lung cancer risk by influencing carcinogen activation and detoxification; however, no key genes that could clearly mediate these disparities have yet been found (10, 11).
Although the exact cause of lung cancer disparities has not been defined, it is possible that etiologic differences could result in differences in tumor biology. Comparative transcriptome analyses have provided interesting molecular clues about differences in tumor biology between AAs and EAs in breast, endometrial, prostate, and colon cancer. For example, the identification of differentially expressed genes in breast tumors from AAs compared with breast tumors from EAs revealed molecular differences in expression of genes involved in differentiation, invasion, and metastasis (12). Furthermore, MYC pathway activation and a stem cell–like transcriptional signature was more prevalent in breast tumors from AAs compared with breast tumors from EAs (13). Prostate cancer appears to be more aggressive in AA men (14, 15) and is characterized by a distinct immune phenotype (16, 17). Similar results were observed in endometrial cancer and colon cancer (18–21).
Transcriptome profiling studies in cancer health disparities are not restricted to coding gene expression. Numerous studies have reported variations in miRNA expression between AAs and EAs. When comparing the miRNA profiles of endometrial tumors from AAs and EAs, an AA-enriched signature has been identified (22). In addition, AA prostate cancer patients have significantly lower expression of miR-152, a miRNA with tumor suppressor activity, than EAs with prostate cancer (23). Colorectal cancers from AAs have an eightfold enrichment of miR-1207–5p compared with a 1.2-fold increase in EAs (24). Overexpression of miR-1207–5p was shown to drive a stem cell–like phenotype, suggesting this miRNA can regulate stemness in AAs (24).
Collectively, coding and noncoding transcriptome studies have identified biological subtypes in tumors from AAs and EAs with various cancer types. Such differences can be leveraged for the development of more precise methods of diagnosis, predicting prognosis, and treating cancer. Non-small cell lung cancer (NSCLC) is the most common form, affecting approximately 80% to 85% of lung cancer patients. To our knowledge, no studies to date have attempted to unravel the NSCLC transcriptome in AAs compared with EAs. In this study, our goal was to perform comparative transcriptomic profiling of AA and EA with NSCLC, and to determine whether racial differences in gene and miRNA expression translates to differences in tumor biology with clinical relevance, through cellular pathway enrichment, predicted drug response, infiltrating cells from the tumor microenvironment, tumor immune-antigen profiling, and miRNA regulatory network analyses.
Materials and Methods
mRNA and miRNA cohort descriptions and tissue preparation
Patients with histologically confirmed NSCLC and living in the Baltimore Metropolitan area were prospectively recruited from seven Baltimore City hospitals to the ongoing NCI-MD Case Control Study, as described previously (25). This study was conducted in accordance with the Declaration of Helsinki. Institutional review boards at all participating institutions approved the study and written informed consent was obtained from all patients. For this study, eligibility was based on patients that had histologically confirmed NSCLC diagnosed within the past 2 years, had been born in the United States, resident of the state of Maryland, spoke English well enough to be interviewed, were physically and mentally capable of performing the interview (i.e., must be able to hear the interviewer, mentally comprehend the interviewers questions, and verbally respond), had never been interviewed as a control for this study, did not currently reside in an institution such as a prison, nursing home, or shelter, had no history of cancer other than nonmelanoma skin cancer or carcinoma in situ of the cervix (population-based control), and had a residential working phone within the home (population-based control). Each patient was approached for informed consent by a trained interviewer and assessed for eligibility. Once eligibility was confirmed, specimen and data collection ensued. Eligible participants that self-described as non-Hispanic AA or non-Hispanic EA received a structured in-person interview. Clinical and questionnaire data for each patient were obtained from medical records and pathology reports.
Fresh sections of human lung tumor tissues and adjacent normal lung tissues were obtained from patients directly after surgery. After surgical removal, each tumor was macroscopically dissected by a pathologist to remove normal tissue. FFPE H&E sections were used to confirm the tumors contained mostly tumor cells and to inspect nonadjacent normal tissues. Each tissue was transferred to a sample collection tube, flash frozen, and stored at −80°C. Specimens were transported to the NCI on dry ice within 24 hours and stored at −80°C until molecular analyses were performed. Patient characteristics for both the mRNA (n = 22 AAs and n = 19 EAs) and miRNA cohorts (n = 42 AAs and n = 55 EAs) are outlined in Table 1.
Table 1.
Clinical and demographic characteristics of the NCI-MD case-control study subjects
| mRNA |
miRNA |
|||||
|---|---|---|---|---|---|---|
| EA | AA | P | EA | AA | P | |
| Age (years) | 0.388a | 0.012a | ||||
| Mean (SD) | 61.6 (12.4) | 59.4 (10.5) | 64.9 (10.6) | 59.6 (9.5) | ||
| Range | 32–76 | 40–74 | 32–84 | 40–81 | ||
| Sex (%) | 0.455b | 0.167b | ||||
| Female | 10 (63%) | 9 (56%) | 25 (47%) | 14 (33%) | ||
| Male | 6 (38%) | 7 (44%) | 29 (53%) | 28 (67%) | ||
| Smoking history (%) | 0.999c | 0.213c | ||||
| Never | 1 (6%) | 1 (6%) | 1 (2%) | 3 (7%) | ||
| Ever | 15 (94%) | 15 (94%) | 53 (98%) | 38 (93%) | ||
| Smoking pack years | 0.428a | 0.007a | ||||
| Mean (SD) | 48 (35.7) | 36 (33.6) | 59.4 (35.6) | 39.6 (31.4) | ||
| Range | 0–138 | 0–124 | 0–152.3 | 0–124 | ||
| Histology | 0.600c | 0.732c | ||||
| Adenocarcinoma | 13 (81%) | 14 (88%) | 48 (87%) | 39(93%) | ||
| Squamous cell carcinoma | 0 (0%) | 1 (6%) | 1 (2%) | 1 (2%) | ||
| Other | 3 (19%) | 1 (6%) | 6 (11%) | 2 (5%) | ||
| Stage | 0.074c | 0.033c | ||||
| I | 11 (69%) | 5 (21%) | 41 (75%) | 24 (57%) | ||
| II | 4 (25%) | 5 (31%) | 11 (20%) | 8 (19%) | ||
| III | 1 (6%) | 6 (38%) | 3 (5%) | 10 (24%) | ||
Student t test.
χ2 test.
Fisher exact test.
When available, the mRNA and miRNA cohorts included matched tumor and normal pairs. The mRNA cohort included 11 matched pairs and five unmatched pairs from AAs and 14 matched pairs and two unmatched pairs from EAs. The miRNA cohort included 38 matched pairs and two unmatched pairs from AAs. All the EA samples were matched. Lung cancer-specific survival analysis was performed on samples collected from 1998 to 2014 in both the mRNA and miRNA cohorts.
Sample selection
All patients that went for surgery and had confirmed NSCLC were eligible for tissue collection, excluding other patients enrolled in this study. Tissue was first collected for pathology and FFPE preparation. All remaining tissues were flash frozen and available for use. Only RNA samples with a RIN of 5 or higher were chosen, excluding any other samples that did not satisfy this criterion. Only samples that met the 1 μg total RNA assay requirement were included in the mRNA analysis. The miRNA analysis required 100 ng of total RNA, allowing for the analysis of more individuals.
mRNA isolation
Total RNA was extracted using TRIzol following the manufacturer’s protocol (Thermo Fisher Scientific). Isolated total RNA was quantified using a NanoDrop 1000 (NanoDrop Products). RNA integrity was determined using an Agilent 2100 Bioanalyzer (Agilent Technologies).
mRNA expression array data preprocessing and analysis
Microarray analysis was performed using 66 GeneChip Human Genome U133 Plus 2.0 Arrays (Affymetrix). CEL data files were imported into Partek Genomics Suite 6.6 (Partek) for Robust Multi-Array Average preprocessing (background correction, normalization, and summarization) and the Batch Remover Tool was used to account for batch correction. Extensive quality control assessments were performed. Hybridization control metrics were assessed for expected order from high to low (AFFX-r2-P1-cre-avg, AFFX-r2-Ec-bioD-avg, AFFX-r2-Ec-bioC-avg, and AFFX-r2-Ec-bioB-avg). Labeling control metrics (derived from B. subtilis) were assessed for expected descending order (Dap, Thr, Phe, Lys). The 3′/5′ ratio of GAPDH, β-actin, ISGF-3, and all other labeling controls were plotted. All quality control studies showed normal values. Visual inspection of original and summarized probe set signal values and “frequency versus intensity” histograms reported there were no outliers in the data.
Each array comprised of approximately 47,400 transcripts from more than 38,500 genes over 54,675 probe sets. The Partek Genomics Suite 6.6 Gene Expression Workflow was used to ascribe categorical variables [race (AA or EA), gender (male/female), smoking status (never/former/current), lung tissue type (tumor or adjacent normal), survival status (deceased or alive)]. Continuous variables were also assigned, including age and pack-years of smoking. Principle component analysis and hierarchical clustering were employed to explore patterns in the data. One-way ANOVAs were used to calculate statistical significance of differentially expressed probes between tissues. Significant probes were filtered by comparing gene expression in lung tumors with adjacent normal tissues from AAs with a fold change of >2 or <−2 and an adjusted P value with FDR < 0.01. The same criteria were used to filter gene expression differences between lung tumors and adjacent normal tissues from EAs. To compare gene expression in adjacent normal tissues from AAs and EAs, and lung tumors from AAs and EAs, respectively, significant probes were filtered according to a fold change of >1.5 or <−1.5 and an unadjusted P < 0.05. Probes were aligned with their corresponding gene symbols and gene symbols were collapsed to create gene expression signature lists comprised of statistically significant genes. Primary array data are available from the NCBI Gene Expression Omnibus (GEO; GSE102287). TCGA lung adenocarcinoma and lung squamous cell carcinoma mRNA-sequencing data from AAs and EAs were used as a validation cohort for population stratification.
Gene set enrichment analysis
Gene expression signature lists from AAs and EAs, which compared lung tumors with adjacent normal tissues, were subjected to Gene Set Enrichment Analysis (GSEA) version 2.2.0 and the Molecular Signature Database version 5.1. (MSigDB; Broad Institute; ref. 26). The GSEA Preranked Tool was used to analyze gene expression signature lists containing columns with gene symbols and descending fold changes. All files were converted to ranked files to be compatible with the GSEA Preranked Tool.
Connectivity map analysis
AA and EA gene expression signature lists were imported into the Connectivity Map (cmap) build 02 (Broad Institute). The software predicted drug response profiles after comparing gene expression signature lists with the cmap database, which contains over 7,000 gene expression profiles representing 1,309 compounds. Probes not present on the Human Genome U133 Plus 2.0 Arrays were removed prior to querying the database. Details of the dataset and analytics have been previously described (27).
CIBERSORT analysis
CIBERSORT was used to quantify relative abundances of distinct immune cell types. Log2 expression of AA and EA gene expression signatures were determined in both lung tumors and adjacent normal tissues, followed by evaluation against the LM22 gene signature reference. Relative fractions of 22 immune cell types were identified with a global P value estimate. Analyses were done with 1,000 permutations and default statistical parameters (28).
miRNA expression array data preprocessing and analysis
One hundred nanograms of total RNA from lung tumors and adjacent normal lung tissues were used as input for nCounter Human miRNA Assay Kit version 1.6. The protocol was followed as recommended by the manufacturer (NanoString). All samples were labeled, amplified, hybridized, and randomized over several batches before being run on the nCounter instrument (NanoString). Resultant RCC files were imported into the nSolver analysis software v2 (NanoString). Samples with good overall signals after background subtraction were normalized to the geometric mean of the top 75 miRNAs, and imported into Partek Genomics Suite 6.6 (Partek). Principal component analysis (PCA) of lung tumors and adjacent normal lung tissues in both AA and EA was used to inspect for the existence of batch effects, outliers, and errors. Batch effects were identified and removed using the batch correction feature within Partek Genomics Suite 6.6. miRNAs that were expressed in less than 10 copies in more than 20% of the samples were excluded (n = 666). To determine differential expression among the remaining miRNAs (n =136), one-way ANOVAs were used. A fold change of >2 or <−2 and an adjusted P value with FDR < 0.01 filter was applied to significant expression between lung tumors with adjacent normal tissues from AAs. The same criteria were used to filter miRNA expression differences between lung tumors and adjacent normal tissues from EAs. To compare miRNA expression in adjacent normal tissues from AAs and EAs, significant miRNAs were filtered according to a fold change of >1.5 or <−1.5 and an unadjusted P value < 0.05. The same criteria were used to filter significant differences in miRNA expression between lung tumors from AAs and EAs. TCGA lung adenocarcinoma and lung squamous cell carcinoma miRNA-sequencing data from AAs and EAs were used as a validation cohort.
Statistical analysis
All ANOVA tests were calculated using Partek Genomics Suite 6.6 (Partek). Unpaired two-sided t tests with Welch corrections were calculated using GraphPad Prism 6 (GraphPad Software). Hypergeometric distributions were calculated by using the HYP-GEOM.DIST function in Microsoft Excel.
Results
Comparison of mRNA and miRNA patient cohorts
There were no statistically significant differences in clinical and demographic variables by race in the patient cohort used for our mRNA analysis. In the cohort used for miRNA analysis, we report that the AA patients were slightly younger that the EA patients (Table 1). This is consistent with the literature (29). In addition, we find that the AA patients have fewer pack-years of smoking and more tumors at stage III compared with EAs (Table 1). Both factors are consistent with the presentation of NSCLC in AAs. Notably, for both the mRNA and miRNA cohorts, the histologic type was predominantly adenocarcinoma, suggesting histologic differences are unlikely to have confounded findings. During a 16-year period, from 1998 to 2014, there were no significant differences in lung cancer-specific survival between AAs and EAs. However, AAs had a better 5-year survival (1825 days) in both the mRNA and miRNA cohorts (Supplementary Fig. S1).
Characterization of the coding transcriptome in AAs and EAs with NSCLC
We profiled 66 matched lung tumor and normal tissues from AAs (n = 22 individuals) and EAs (n = 19 individuals) with NSCLC to compare mRNA expression and identify race-enriched transcriptional programs (Table 1). Unsupervised PCA of total gene expression showed lung tumors and normal lung tissues separated into two groups by sample type but AA and EA tissues did not cluster independently by race (Supplementary Fig. S2). This observation is consistent with previous studies that have shown differences in tumor biology are driven primarily by small subsets of dysregulated genes in AAs and EAs (12, 16, 20, 30). However, unsupervised PCA of differentially expressed genes revealed lung tumors and adjacent normal tissues strongly clustered independently in both AA and EA populations (Fig. 1A). Comparing gene expression profiles between lung tumors and adjacent normal tissues from AAs revealed 3,500 probes (corresponding to 2,210 genes) were differentially expressed (fold change of >2 or <−2 and an adjusted P value with FDR < 0.01). A total of 4,707 probes (corresponding to 2,921 genes) were differentially expressed in lung tumors from EAs compared with adjacent normal tissues (fold change of >2 or <−2 and an adjusted P value with FDR < 0.01). Although there were a significant number of overlapping probes, a total of 637 and 1,844 probes were shown to be distinctly expressed in either AAs only or EAs only, respectively (Fig. 1B).
Figure 1.
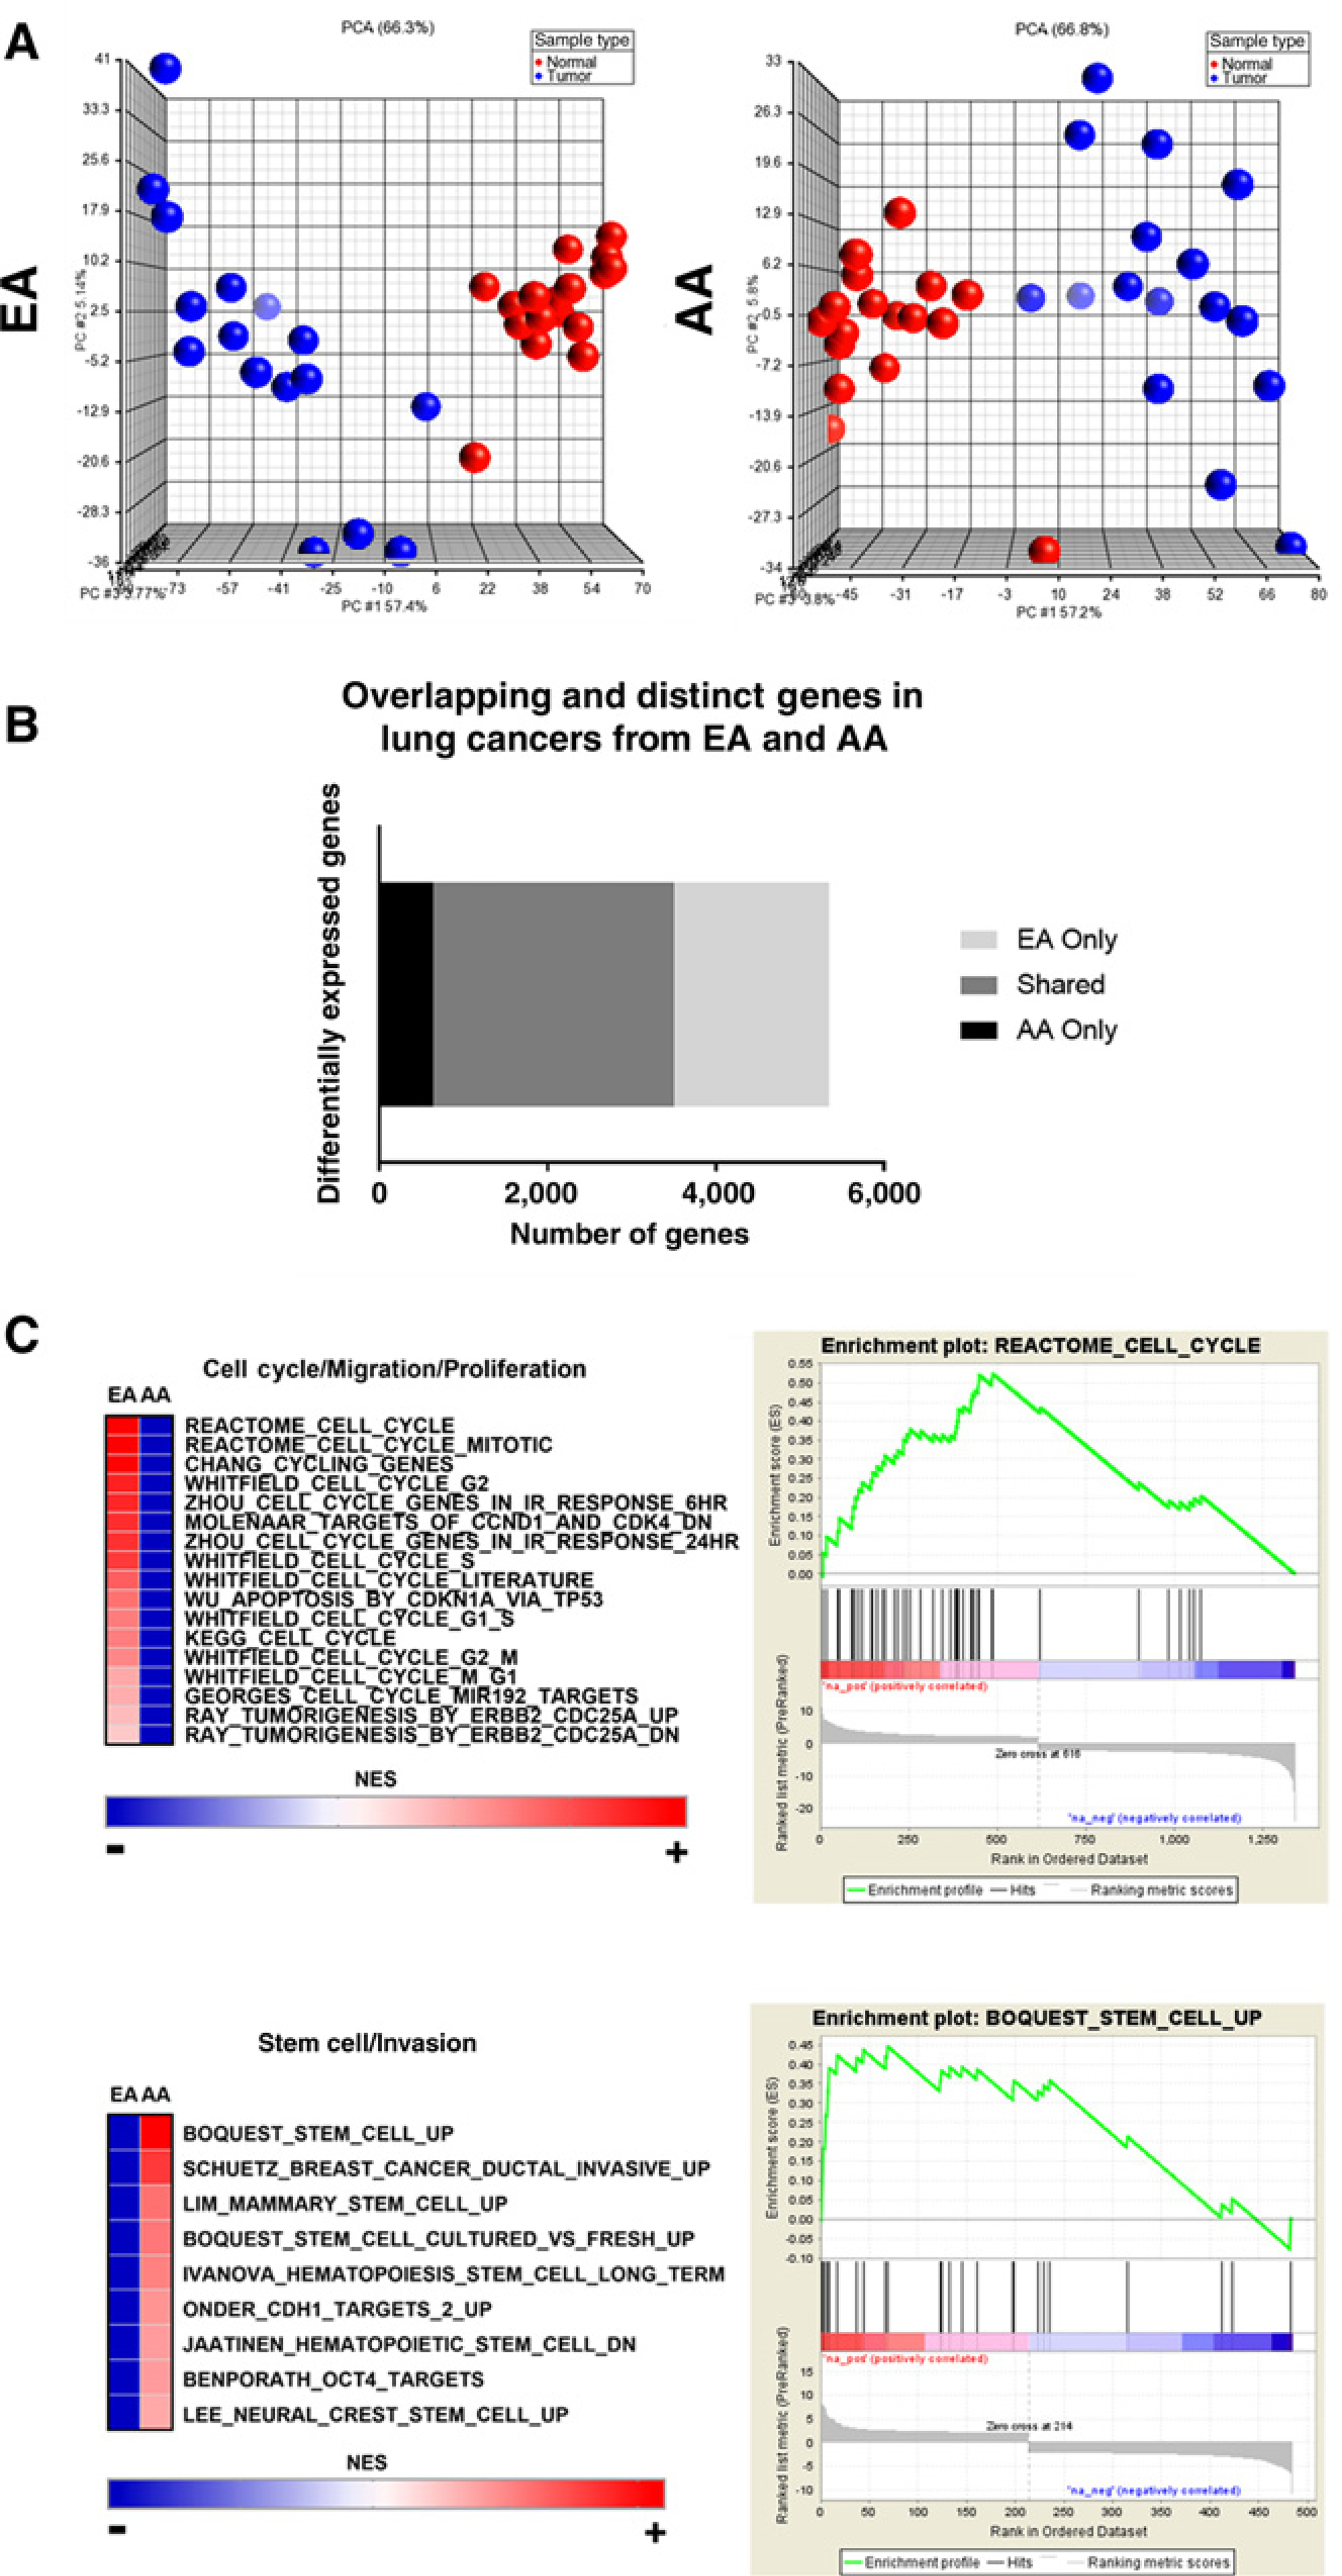
Comparative analysis of differential gene expression in lung cancers from AAs and EAs. A, Unsupervised PCA of significant gene expression signatures between lung tumors (blue) and adjacent normal lung tissues (red) from AAs and EAs. B, Bar graph of overlapping and distinct gene expression signatures from lung tumors compared with adjacent normal lung tissues in AAs and EAs. C, Gene Set Enrichment Analysis of pathways enriched in lung tumors from AAs and EAs.
To test whether these two gene subsets are truly enriched in one race compared with another, we performed PCA for the AA-and EA-enriched gene subsets in both populations, respectively. We analyzed AA differential gene expression in samples from AAs and EAs. The AA-enriched differential gene expression separated lung tumors and adjacent normal tissues in both populations; however, the clustering pattern was stronger in AAs compared with EAs (Supplementary Fig. S3A). Next, we analyzed EA-enriched differential gene expression in samples from AAs and EAs. The EA-enriched differential gene expression clearly separated lung tumors and normal tissues from EAs but did not strongly separate tissues from AAs (Supplementary Fig. S3B). These data support our conclusion that, although many differentially expressed genes are shared among both populations, lung cancers from AAs and EAs have population-specific changes in differential gene expression.
We explored whether these AA-enriched and EA-enriched gene lists represented specific and distinct cellular pathways. GSEA comparisons revealed that many overlapping pathways characterized NSCLCs from AAs and EAs; however, these cancers are also defined by distinct cellular pathways in both populations (Supplementary Fig. S4; Supplementary Tables S1–S3). Specifically, we found that lung tumors from AAs were particularly enriched in stem cell and invasion pathways (9.9% tumors from AAs vs. 4.5% tumors from EAs), whereas lung tumors from EAs were enriched in cell cycle, mitosis, and proliferation pathways (4.5% tumors from EAs vs. 0.1% tumors from AAs; Fig. 1C).
Predicted differences in therapeutic response based on race-enriched gene expression profiles in AAs and EAs with NSCLC
The Connectivity Map (cmap), a drug response prediction tool, contains an extensive repertoire of drug-response profiles based on gene expression signature changes in cultured cancer cells. Using the cmap database, we explored the potential of tailoring treatment options for AA and EA NSCLC patients based on their gene expression profiles. The relationship between AA-enriched gene expression signatures in lung tumors and predicted drug responses was compared with the predicted drug response profiles from EA-enriched lung tumor gene signatures. Some drug resistance and sensitivity response profiles were shared among both populations (Fig. 2A; Supplementary Tables S4 and S5). However, a significant proportion of drug response profiles were population-specific and unique to either AAs or EAs (Fig. 2A; Supplementary Tables S4 and S5). AAs were predicted to be resistant to 53 drugs to which EA were sensitive, including irinotecan (Fig. 2B; Supplementary Table S6).
Figure 2.
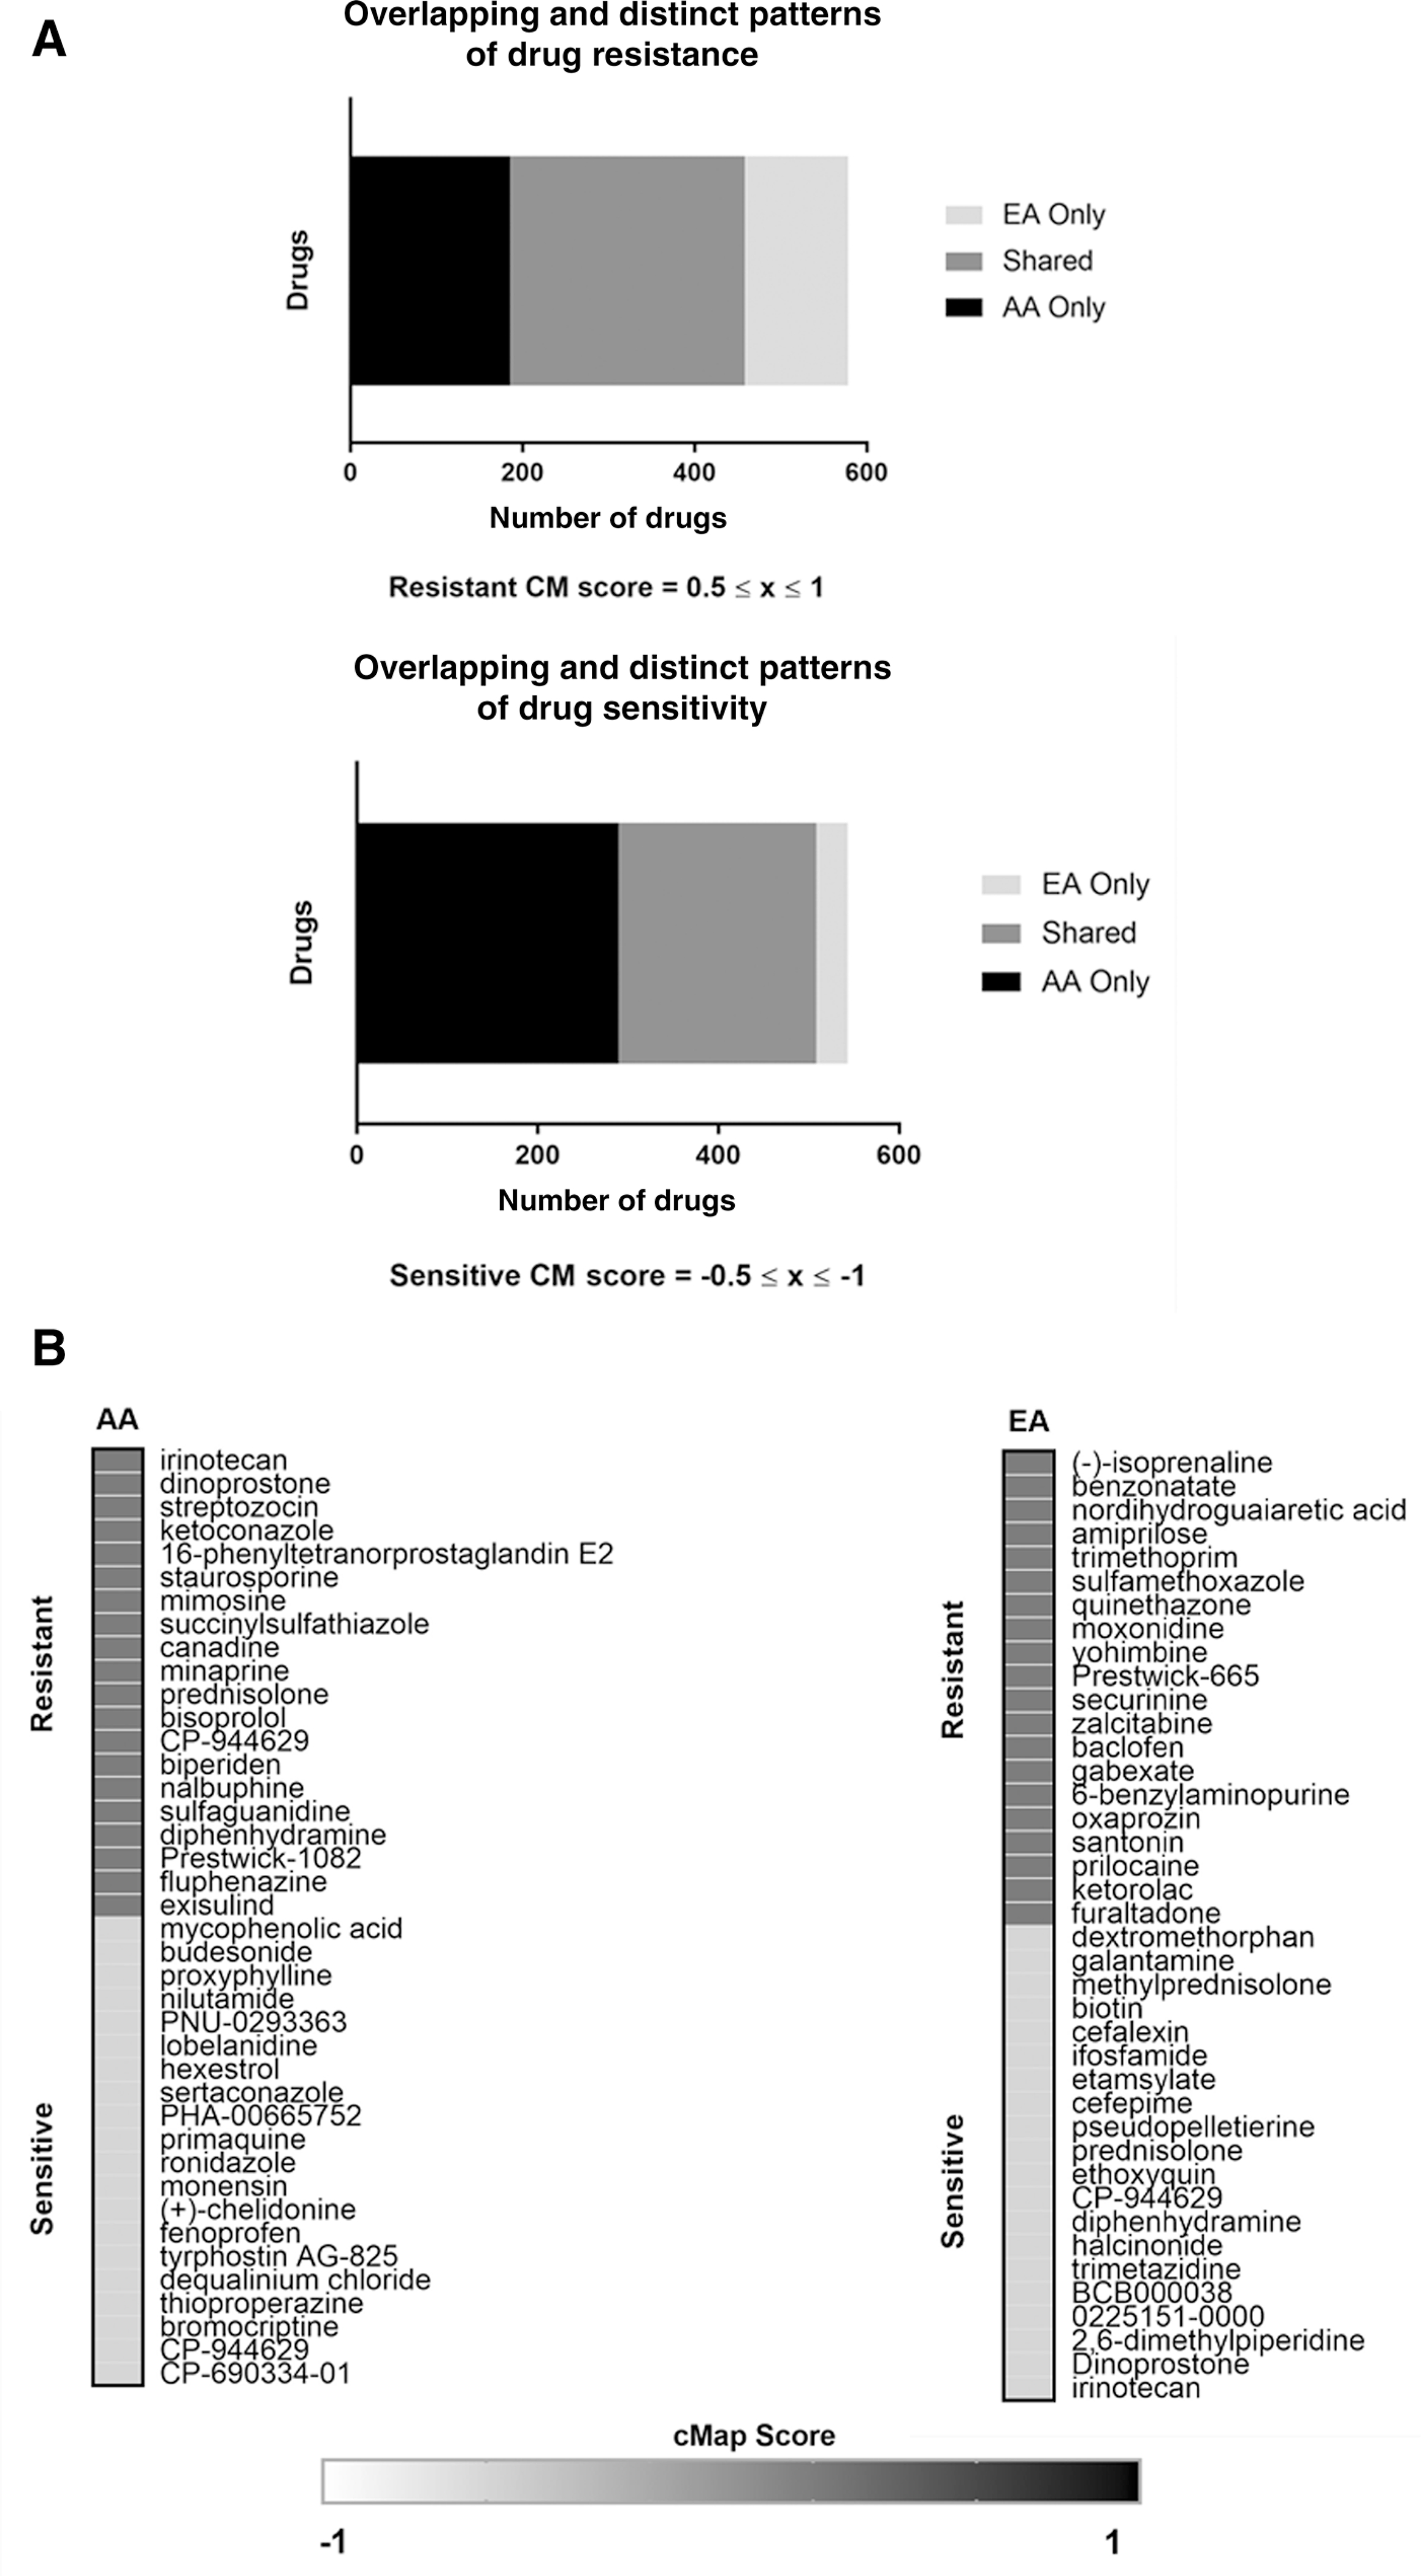
Predicted drug response profiles in lung cancers from AAs and EAs based on gene expression signatures. A, Bar graphs comparing drug response profiles in lung tumors from AAs and EAs. B, Representative list of predicted drug resistance and sensitivities in lung tumors from AAs and EAs.
Leukocyte composition of the tumor microenvironment in AAs and EAs with NSCLC
Previous studies of racial differences in prostate, breast, and colorectal tumor biology have observed differences in immune profiles (16, 17, 20, 21). Using CIBERSORT, a bioinformatic approach to characterize immune cell composition in bulk tumors based on gene expression profiles, the abundance of 22 different human leukocytes in lung tissues from AAs and EAs were compared. Leukocyte gene expression signatures varied by lung tissue type (Fig. 3A; Supplementary Fig. S5A). Plasma cells were significantly elevated in lung tumors relative to normal tissues in both EAs and AAs (Fig. 3B).
Figure 3.
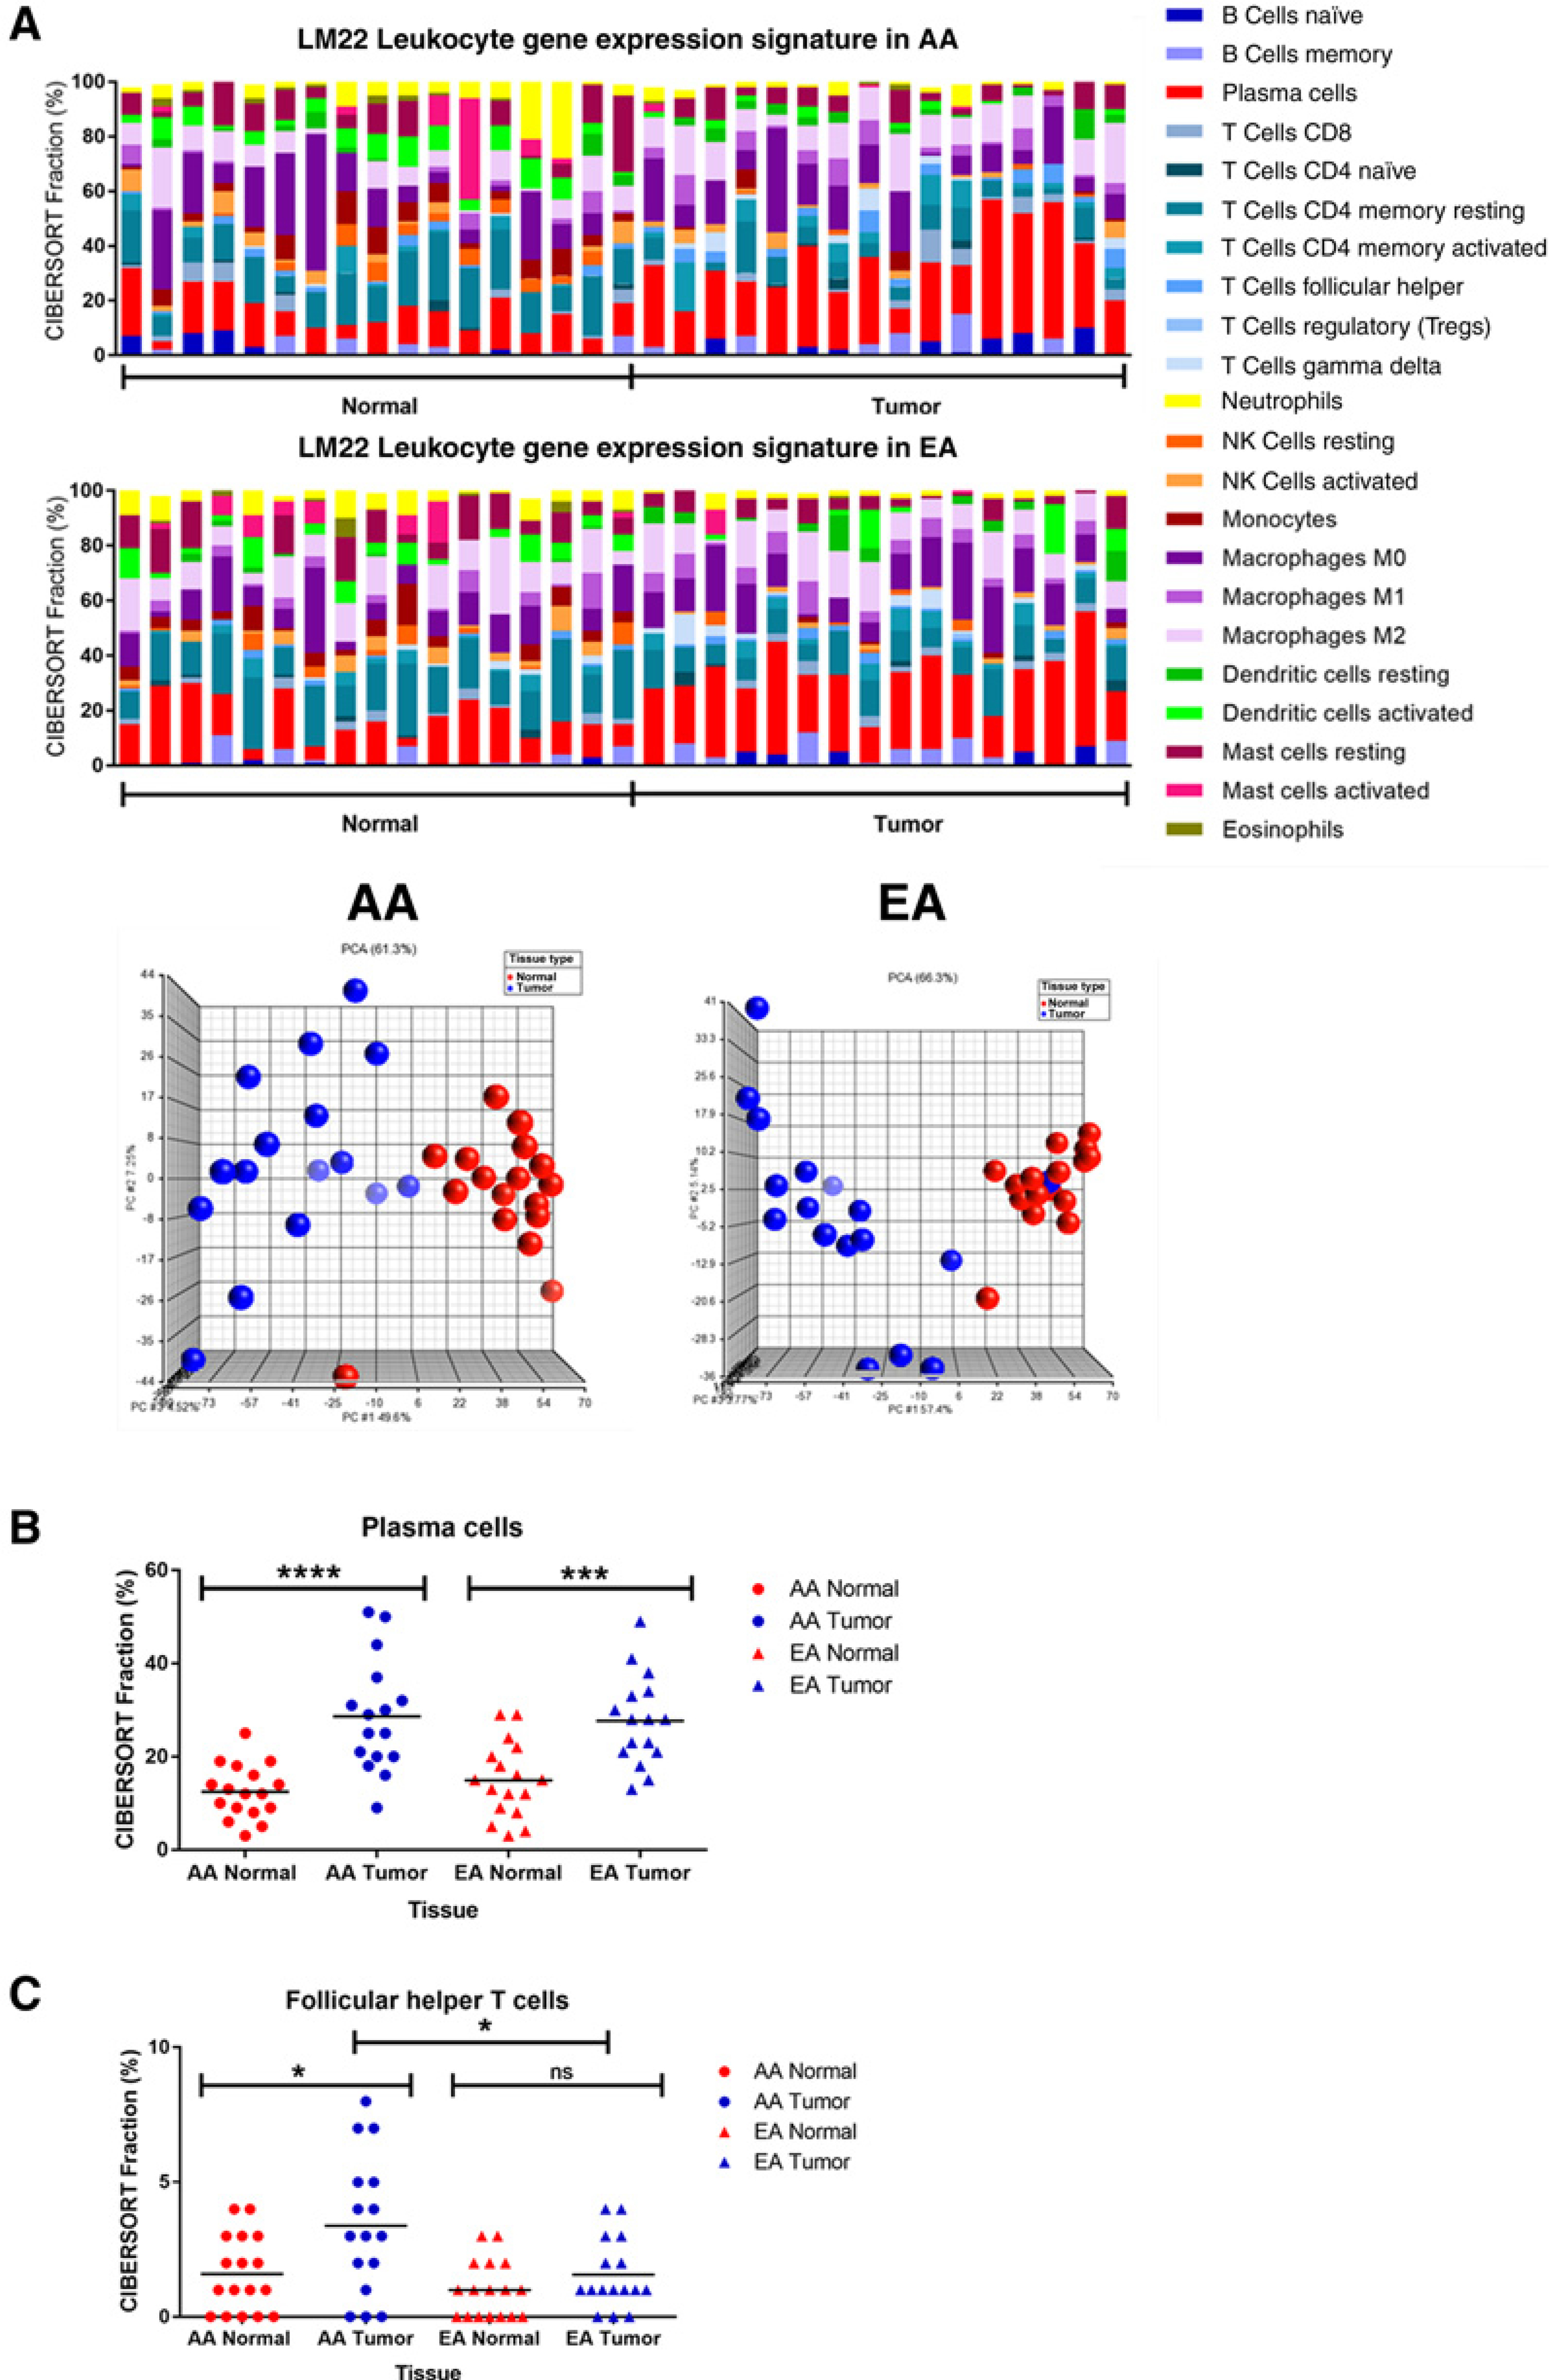
Human leukocyte composition of lung cancer evaluated by CIBERSORT based on gene expression. A, Leukocyte composition in normal and lung tumor tissues from AAs and EAs. PCA of leukocyte composition according to tissue type (blue spheres = tumor; red spheres = normal). B, Differences in plasma cell representation between normal and lung tumor tissues. C, Population-specific differences in follicular helper T cells in AAs and EAs.
When comparing differences in leukocyte composition by race, lung tumors from AAs had significantly greater fractions of follicular helper T cells, gamma delta T cells, M1 macrophages, and M2 macrophages (Fig. 3C; Supplementary Fig. S5B). This significant elevation was not seen in lung tumors from EAs. In contrast, statistically significant differences in resting mast and dendritic cell compositions were observed in EA lung tissues only (Supplementary Fig. S5C). These results suggest that, similar to other cancer types, the type and abundance of infiltrating immune cells vary in tumors of EA and AA origin (31, 32).
Cancer immunotherapies targeting immune checkpoint proteins have emerged in recent years as an effective cancer therapeutic (33). PD-L1 and PD-L2 are frequently overexpressed on tumor cells, and by binding to PD-1 receptor on activated T cells, they mediate an inhibitory response. To our knowledge, no studies to date have compared PD-L1 and PD-L2 expression among AAs and EAs with NSCLC. In addition, targeted therapies against inhibitory receptors expressed on T cells, such as CTLA-4, have shown great promise in clinical trials for multiple cancers, including lung cancer (34). Although no difference in PD-L1 and PD-L2 expression was detected in tumors from both EAs and AAs, CTLA-4 expression was higher in tumors from AAs compared with EAs. However, it is not clear whether this is attributed to a greater infiltration of T cells from the tumor microenvironment or the lung tumors themselves (Supplementary Fig. S5D).
Transcriptomic evidence of population stratification in AAs
We were also interested in the identification of population-specific genes, as previous studies have reported higher expression of PSPHL, CRYBB2, AMFR, and SOS1 in tissues (both tumor and adjacent normal) from AAs (16, 18, 35). We therefore compared AA-enriched and EA-enriched gene expression between lung tumors (fold change of >1.5 or <−1.5 and an unadjusted P value < 0.05), and AA-enriched and EA-enriched gene expression between adjacent normal lung tissues (fold change of >1.5 or <−1.5 and an unadjusted P value < 0.05). PCA revealed gene expression in both lung tumors and adjacent normal tissues separated independently by race (Fig. 4A). A total of 501 differentially expressed probes varied significantly between lung tumors from AAs compared with lung tumors from EAs (Fig. 4B).
Figure 4.
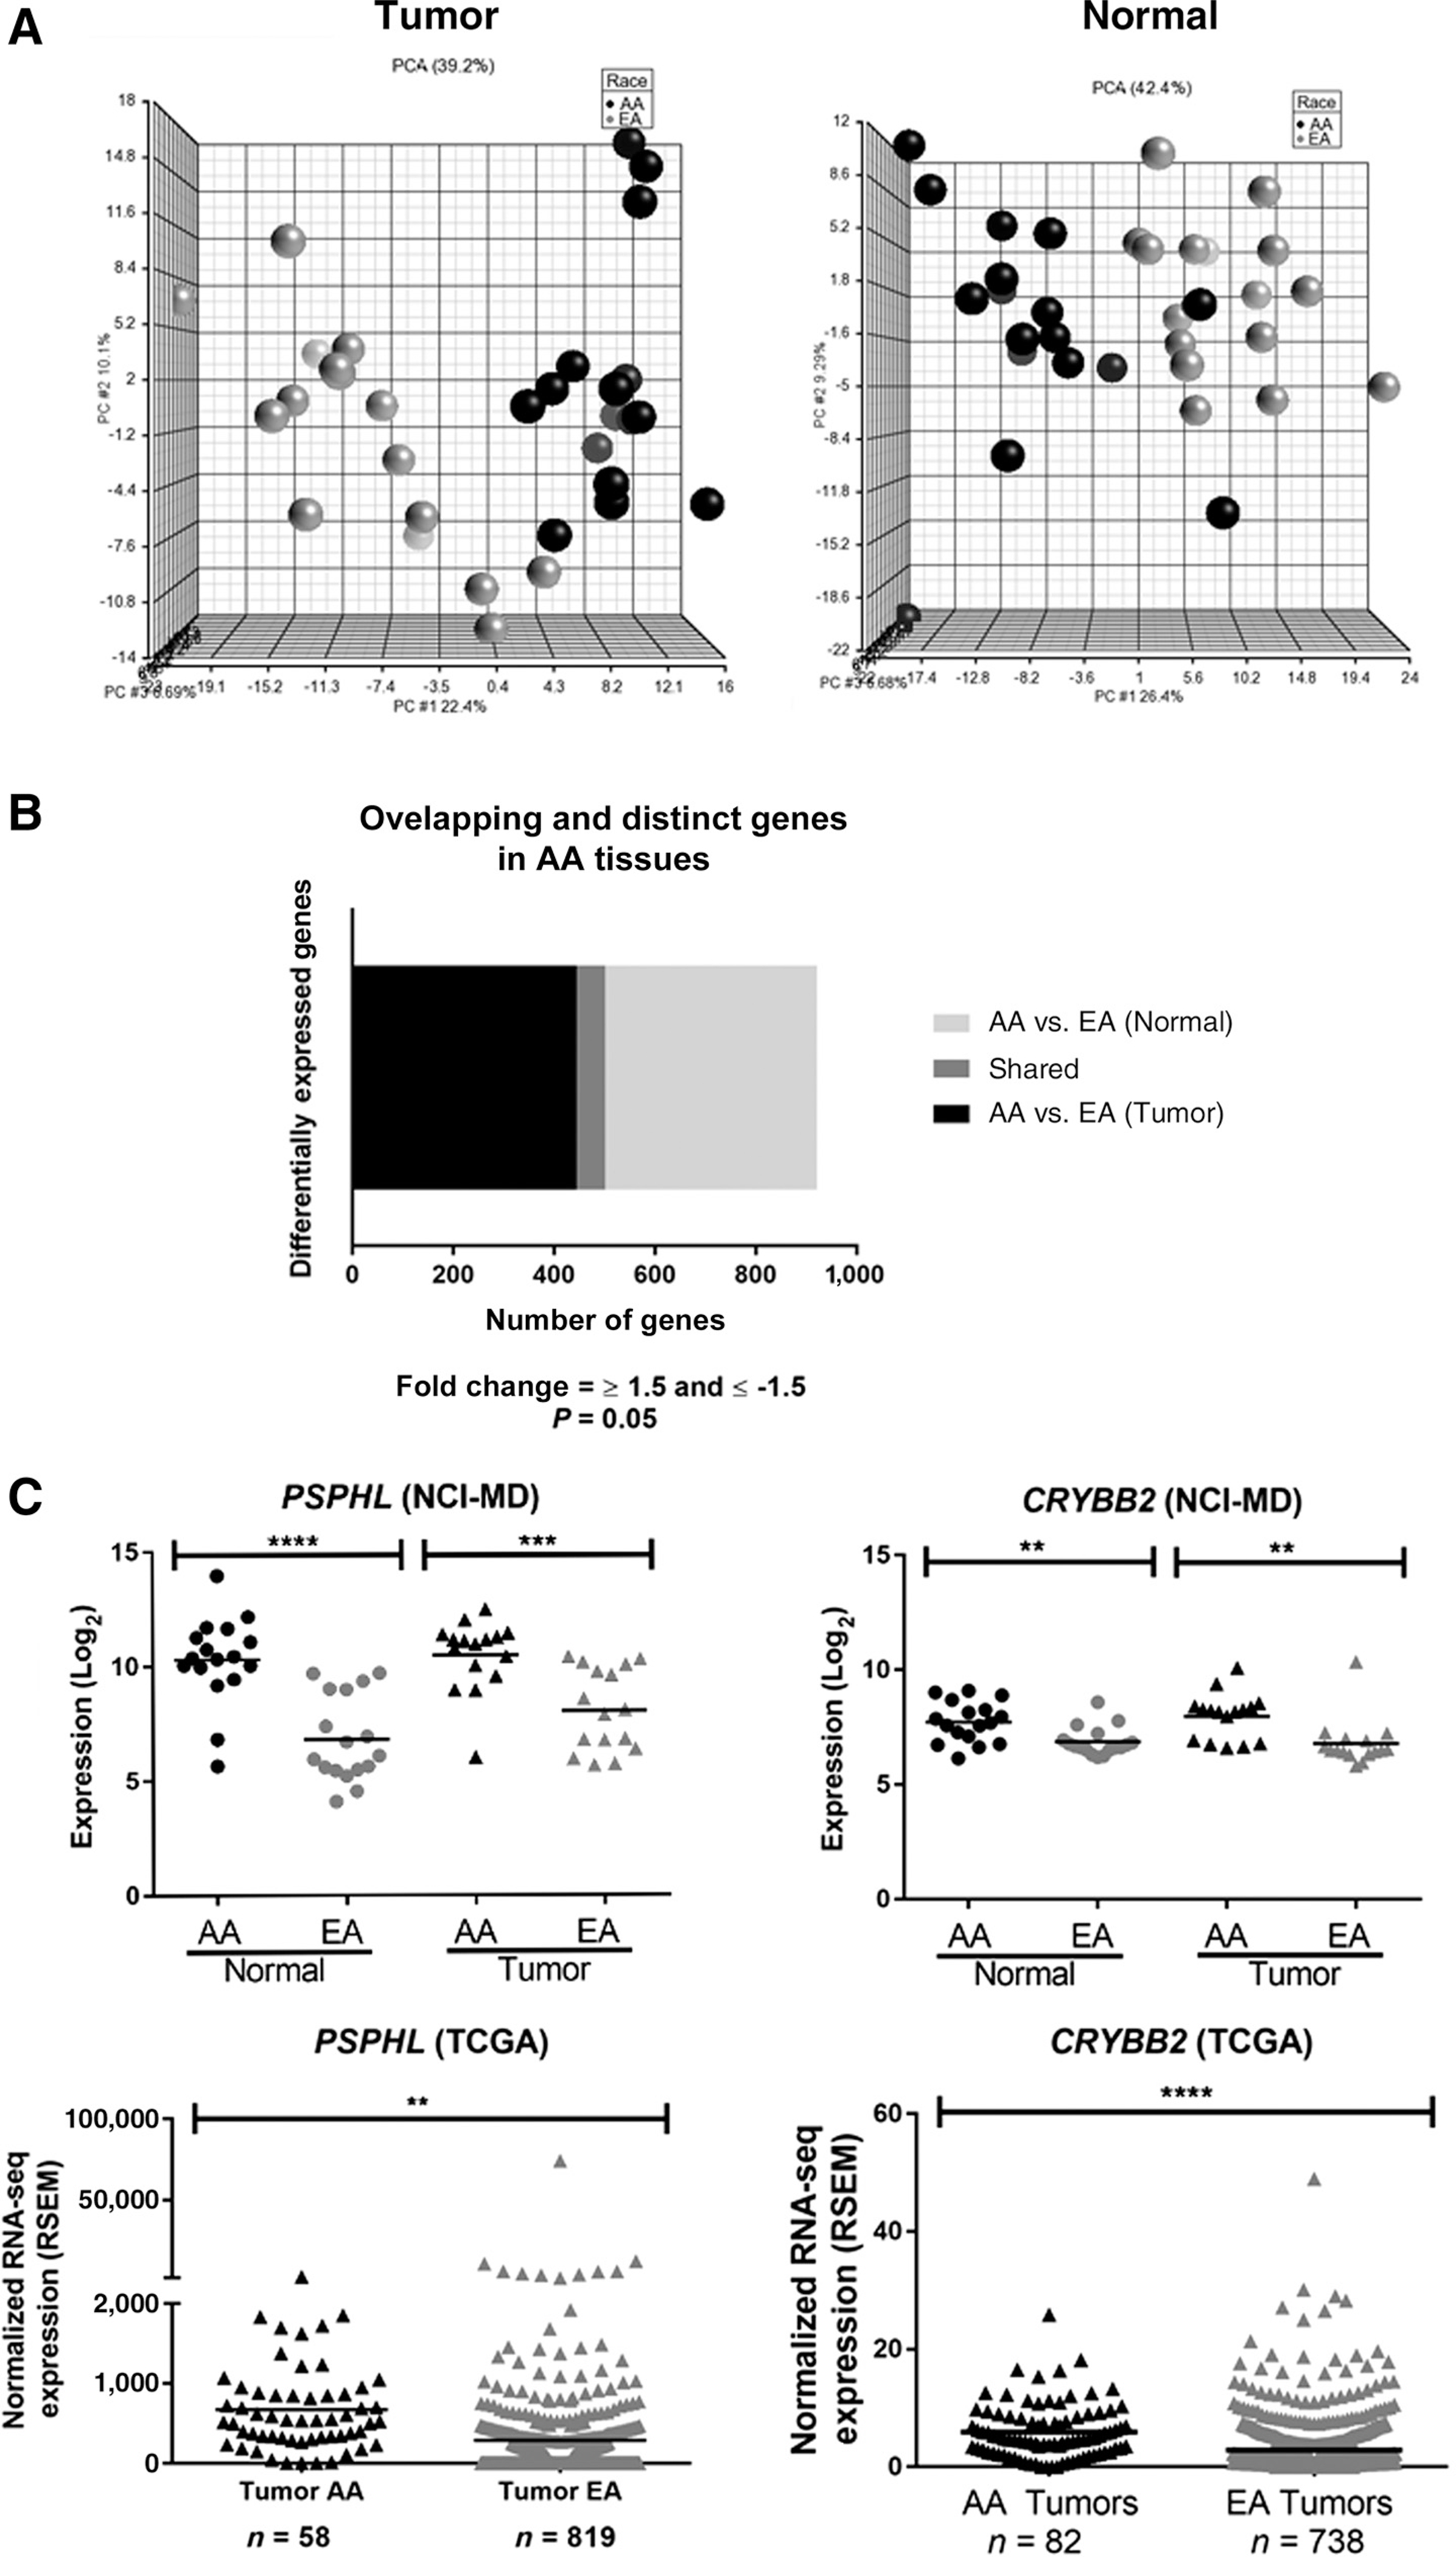

Transcriptomic evidence of population stratification in AAs. A, PCA for significant differential gene expression in tumor and normal tissues (black spheres = AAs; gray spheres = EAs). B, Distinct and overlapping differential gene expression from lung tumors compared with adjacent normal lung tissues in AAs and EAs. C, Expression of PSPHL and CRYBB2 in lung tissues from AAs and EAs. D, Expression of ARL17A and LRCC37A3 in lung tissues from AAs and EAs.
When comparing differential gene expression between adjacent normal lung tissues from both AAs and EAs, 478 probes were found to be significant (Fig. 4B). A total of 57 probes, corresponding to 40 different “population-specific” genes, were significant in both lung tumors and adjacent normal tissues from AAs compared with EAs (Fig. 4B; Supplementary Table S7). This included genes previously found to be upregulated in breast, prostate, and endometrial tumors from AAs more than EAs (e.g., PSPHL, CRYBB2, AMFR, SOS1; Fig. 4C; Supplementary Fig. S6A; refs. 12, 18, 32). We also identified three novel population-specific genes located in the same cytogenetic band, chromosome 17q21.31 (ARL17A, LRRC37A3, and KANSL1) with decreased expression of these genes observed in AAs (Fig. 4D; Supplementary Fig. S6B). Using a large validation cohort of lung tumor data from AAs and EAs in TCGA, we were able to validate these population stratification results for PSPHL, CRYBB2, ARL17A, and LRRC37A3 (Fig. 4C and D).
Comparative analysis of the noncoding transcriptome in NSCLCs from AAs and EAs
Although many studies have examined the role of miRNAs in NSCLC, no studies to date have questioned the importance of miRNAs in NSCLC health disparities. We profiled 191 paired lung tumors and adjacent normal tissues from AAs (n = 42 individuals) and EAs (n = 55 individuals) to compare their miRNA expression profiles (Table 1). PCA analysis revealed distinct clustering between lung tumors and adjacent normal tissues in both AAs and EAs (Fig. 5A). Many differentially expressed miRNAs were shared in both populations (n = 18) and included miRNAs known to be associated with NSCLC, such as miR-21 (Fig. 5B; Supplementary Table S8). In addition, we found seven differentially expressed miRNAs in AAs only, compared with 10 found to be differentially expressed in lung tumors from EAs (Fig. 5B; Supplementary Table S8).
Figure 5.
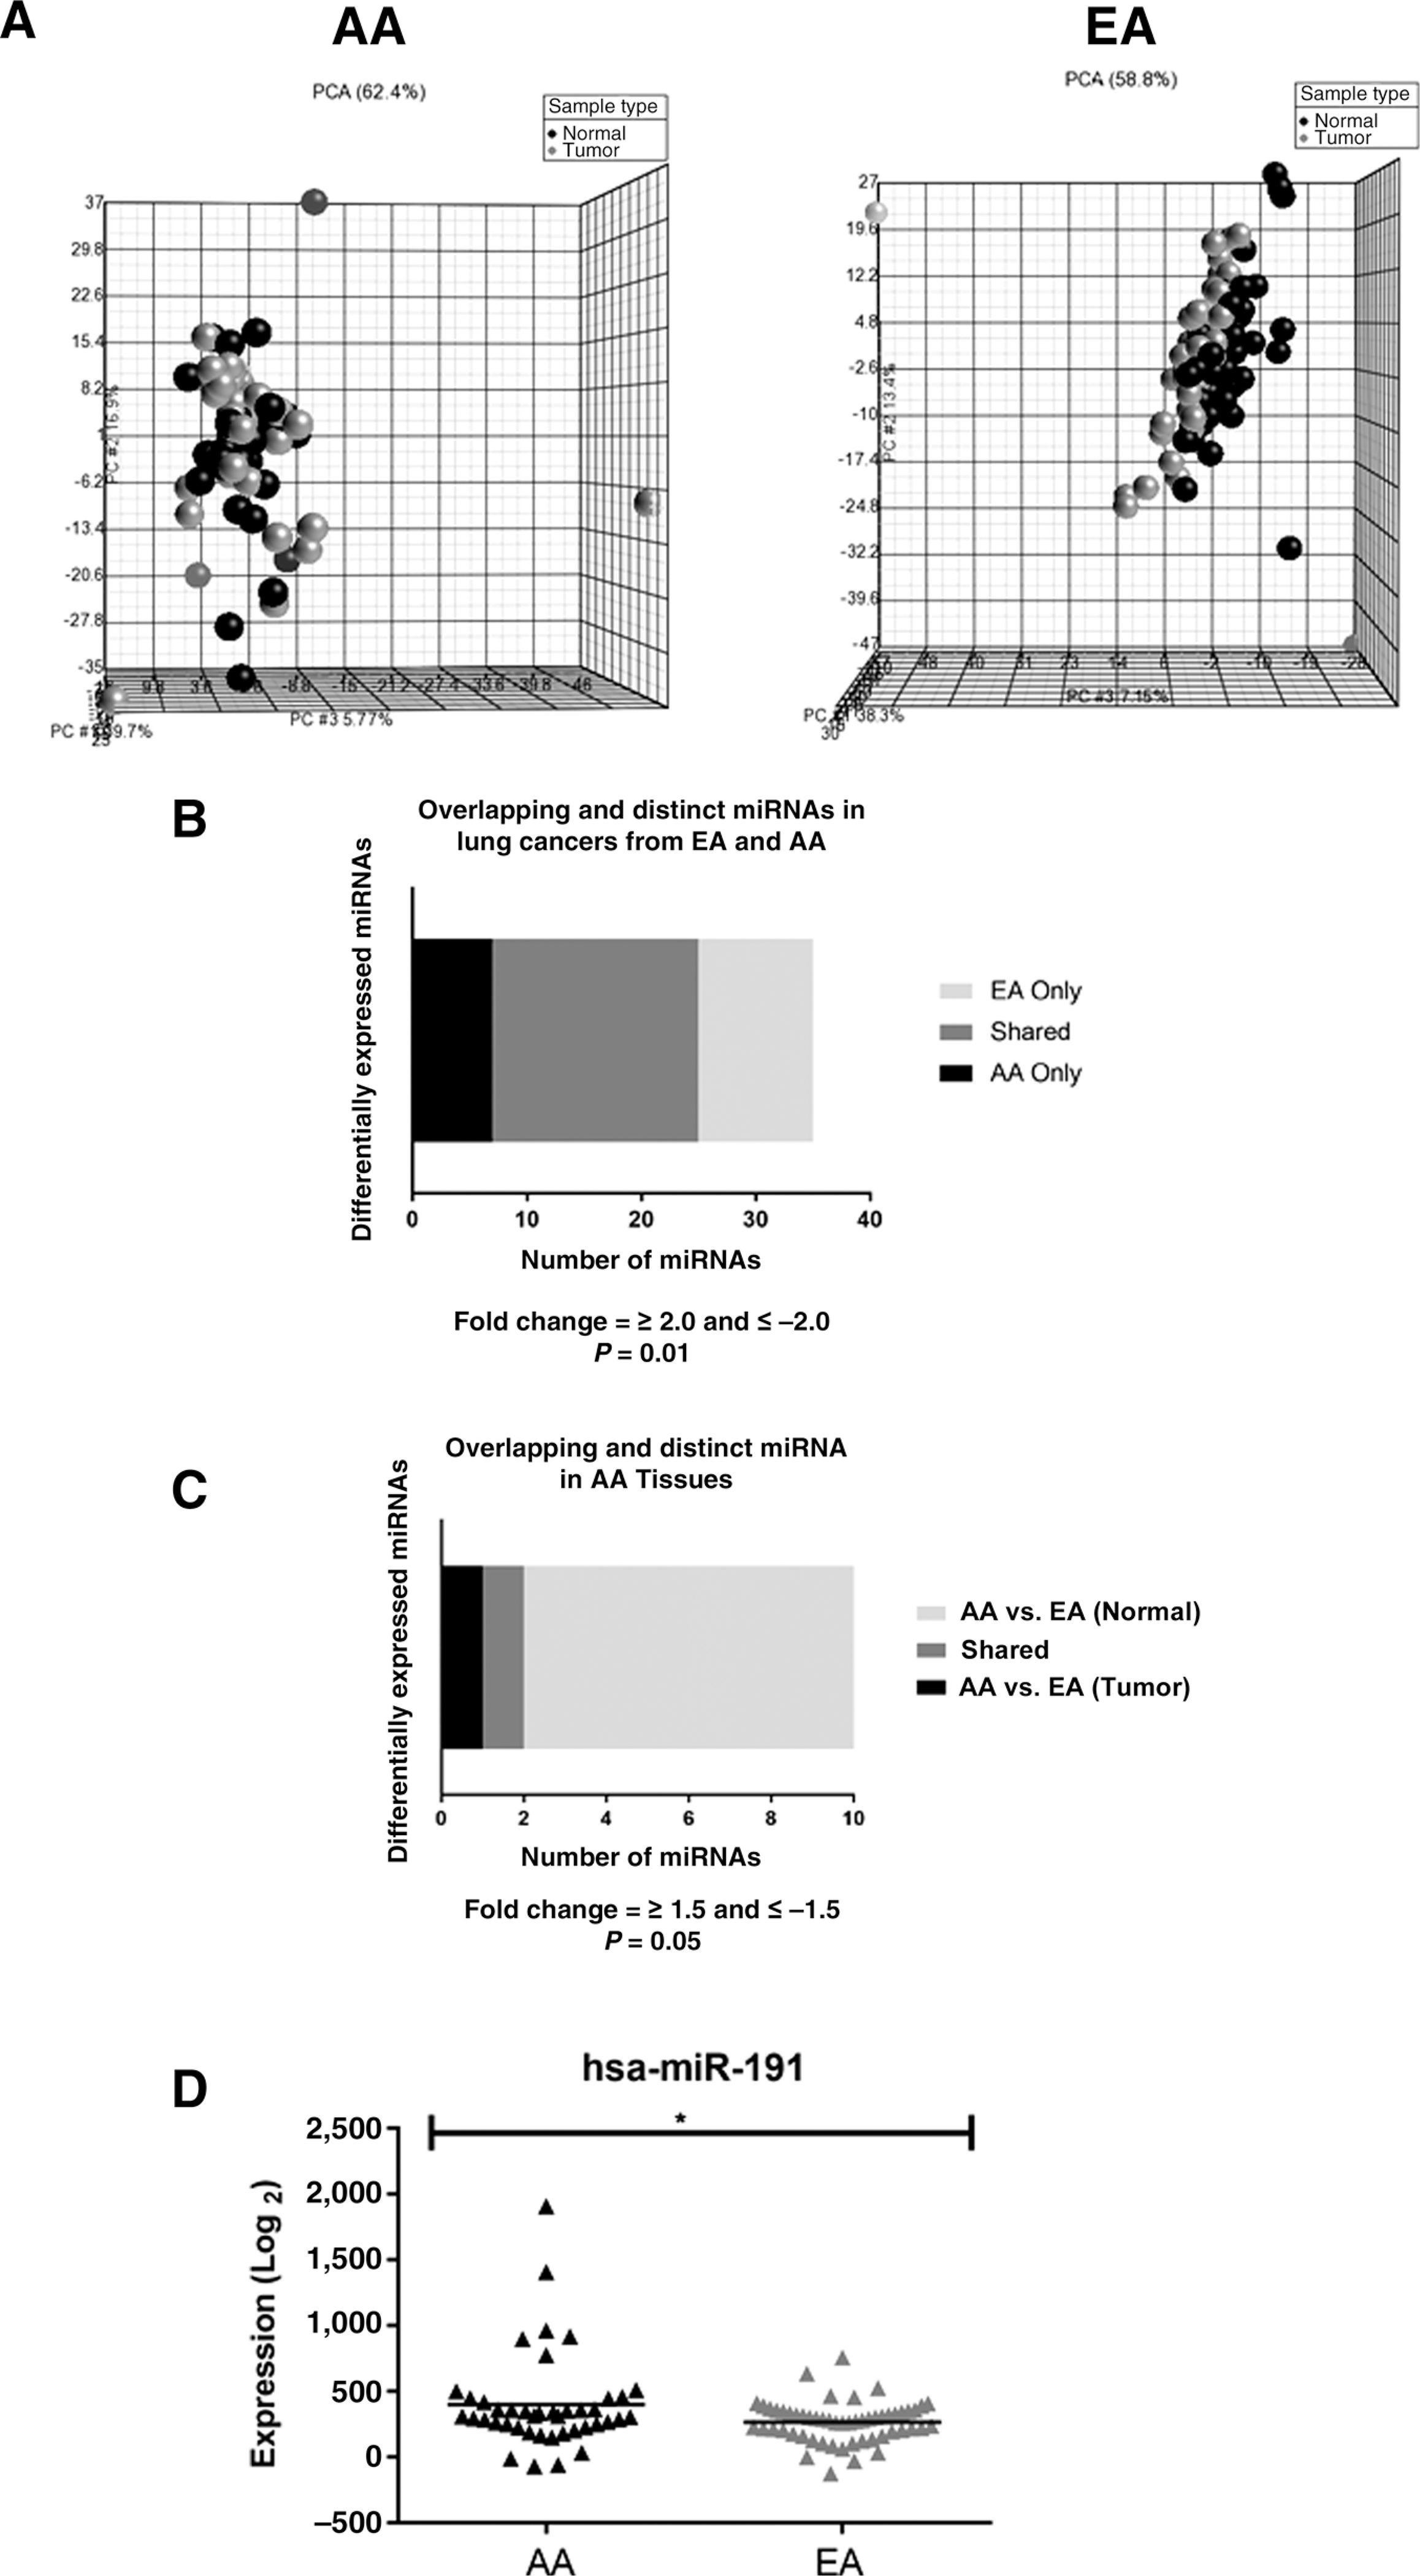
miRNA target gene enrichment in differentially expressed genes from AAs and EAs. A, PCA for differential miRNA expression in adjacent normal and lung tumor tissues from AA and EA (black spheres = normal; gray spheres = tumor). B, Bar graphs displaying distinct and overlapping differential miRNA expression from lung tumors compared with adjacent normal lung tissues from AAs and EAs. C, Distinct and overlapping miRNA expression comparing AA and EA lung tumor tissues. D, Differential miR191 expression by race in lung tumors.
Hypergeometric testing can be used to find functional relationships between interesting gene lists and to better elucidate biological mechanisms. To test for overlap between differentially expressed genes, and differentially expressed miRNA gene targets, hypergeometric tests were performed. The hypergeometric distribution was calculated to determine the probability of the AA-enriched differential gene expression signature sharing a subset of AA-enriched miRNA target genes by chance alone. The test was repeated to assess EA target enrichment. The hypergeometric P values determined that AA-enriched differentially expressed genes have significant overlap with AA-enriched miRNA gene targets (hypergeometric P < 0.001; Supplementary Fig. S7A). Similarly, the hypergeometric P values for EA-enriched differentially expressed genes are highly significant in the gene expression signatures enriched in EA (Hypergeometric P < 0.001; Supplementary Fig. S7B). This suggests that population-specific miRNA expression signatures may drive the differential gene expression patterns observed in lung tumors. We also observed that differentially expressed miRNAs were shared and distinct in lung tissues from AAs compared with tissues from EAs (Fig. 5C). Lung tumors from AAs have significantly increased expression of miR-191 when compared with lung tumors from EAs (Fig. 5D; Supplementary Table S9). Interestingly, one miR-191 target gene (DUSP7) was also a mRNA target gene differentially expressed only in AAs. The DUSP7 gene was downregulated in lung tumors from AAs compared with normal lung tissues from AAs (data not shown). This gene was homozygously deleted in malignant mesothelioma cells and had a proposed tumor suppressor function (36). There are no reports to date studying the role of DUSP7 in lung cancer.
Discussion
Cancer genomics has the potential to identify biologic determinants associated with lung cancer health disparities (37). Recent work has shown mutational frequencies in key lung cancer target genes among AAs and EAs were not significantly different, suggesting mutational profiles cannot explain the racial disparities observed (38).
However, to date no study has explored this hypothesis at the transcriptomic level in NSCLC. Most of what is known about NSCLC subtypes has emphasized tumor biology in EAs. We addressed this knowledge gap through comparative transcriptomics in AAs and EAs with lung cancer. Our study finds that although there are similarities in gene signatures between AAs and EAs, there are distinct elements of both the coding and noncoding NSCLC transcriptome that vary between the populations with clinical implications. We found that lung tumors from AAs were enriched in stem cell and invasion pathways, whereas lung tumors from EAs were enriched in cell cycle, mitosis, and proliferation pathways. This enrichment of stem cell gene signatures is concordant with studies of other cancer types in AAs. For example, recent work in colorectal cancer reported that the number of cancer stem cells was higher in AAs compared with EAs (24, 39), whereas studies have also linked distinct stem-like biology to prostate cancer in AAs (40). Furthermore, comparing normal breast tissues from AAs and EAs, it was revealed that AA women had higher levels of gene expression associated with stemness and EMT than EA women (41). The TP53 Arg72Pro SNP has been connected with stem cell biology. Interestingly, the Pro allele of the rs1042522 SNP is more common in AAs (42), is associated with a larger number of stem cells (19, 43) and increased cancer risk (19, 42). Interestingly, this SNP was only associated with NSCLC risk in AAs (42) and not EAs (44). Collectively, these data suggest that a stem-like signature is enriched in cancers from AAs and that it may in part be driven by the Arg72Pro allele.
We also assessed the noncoding transcriptome and examined both tumor biology differences and population stratification in miRNA expression between AAs and EAs. Eight miRNAs were differentially expressed in AAs only. Notably one of these, miR-30b, was downregulated in lung tumors compared with adjacent normal tissues in AAs. It has been reported that miR-30b inhibits invasion and migration in NSCLC (45). Another miRNA differentially expressed in AA only, miR-106b, was upregulated in lung tumors compared with adjacent normal tissues. This miR has been associated with increased invasion in NSCLC cells (46). The observation that lung tumors in AAs selectively downregulate miR-30b and upregulate miR-106b is consistent with our observations that lung tumor biology in AAs is characterized by invasion and distinct from lung tumor biology in EAs. Our analysis also identified miR-191 as a population stratified miRNA in AAs. We found that miR-191 expression was significantly elevated in both adjacent normal and lung tumor tissues from AAs compared with EAs. The role of increased miR-191 in normal lung tissue is unknown, however, transformed human bronchial epithelial cells had increased miR-191 and more cancer stem cell–like properties (47). This study is consistent with our observation that lung tumors from AAs are enriched in stem cell pathways.
A variety of approaches have been used to describe drug- induced transcriptional changes. AA- and EA-enriched differential gene expression signatures were compared to evaluate whether transcriptional differences in NSCLC translated to population differences in predicted drug response. Further supporting our pathway analysis, drug resistance profiles in AA included drugs linked to stem cell and invasion pathways, including betulinic acid, rosiglitazone, and adiphenine. For example, betulinic acid and its derivative have been shown to target cancer stem cells and also have anticancer potential in NSCLC (48–50). Rosiglitazone, a thiazolidinedione used to treat diabetes, has demonstrated both antitumor and chemopreventive effects (51, 52) and is also linked with stem cell signaling (53, 54). Interestingly, NSCLC incidence was lower in AA patients with diabetes treated with thiazolidinediones when compared with EA patients with diabetes (55). Also of interest, adiphenine is an inhibitor of nicotinic receptors, and some nicotinic receptors in the lung drive invasion and metastasis (56).
On the basis of their gene expression profiles, AAs were predicted to be resistant to irinotecan, whereas EAs were predicted to be sensitive. Irinotecan, a topoisomerase I inhibitor, has been used to treat small cell lung cancer. There are seven clinical trials in the United States currently recruiting participants to study the efficacy of combination chemotherapy with irinotecan in NSCLC. If successful, this is an even greater impetus to recruit more AAs to enroll in NSCLC clinical trials and provides us with another point of intervention to reduce cancer health disparities. Because of a high percentage of matched samples, we believe our results are not products of individual tumor expression diversities in AAs and EAs. The Connectivity Map is a collection of genome-wide transcriptional expression data from cultured human cell lines treated with bioactive small molecules. Pattern-matching algorithms enable the discovery of functional connections between drugs, genes, and cancers. However, it is possible primary human tissues may vary from that of cultured human cells. Further clinical and mechanistic studies are warranted.
The various types of adaptive and immune cells that infiltrate the tumor microenvironment are currently under active investigation. To our knowledge, leukocyte fractions have never been investigated in a lung cancer racial disparities context. Recent work has shown that lung adenocarcinoma patients have elevated tumor-infiltrating plasma cells which cluster into a “plasma cell immunosubtype” that is associated with poor prognosis (57). Leveraging the transcriptomic profiles of our samples, we used the CIBERSORT prediction tool to estimate and compare the immune cell infiltrate in NSCLCs from AAs and EAs. Consistent with previous results, we also observe an abundance of plasma cells in lung tumor tissues from both populations. Interestingly, we observed that lung tumors from AAs had significantly more follicular helper T cells, gamma delta T cells, and M1 and M2 macrophages when compared with adjacent normal tissues. Notably, M2 macrophage polarization leads to the production and recruitment of follicular helper T cells, and tumor promotion (58). We did not observe these findings in lung tumors from EA patients, raising the possibility that inflammatory marker profiles also differ by race. Although we did not observe a difference in the expression of PD-L1 and PD-L2 between AA and EA tumors, the increase in M2 macrophages in lung tumors from AAs could have implications for the efficacy of immunotherapy. We did observe significant increases in CTLA-4 expression in AA tumors, compared with EAs. It is not clear whether this is attributed to a greater infiltration of T cells from the tumor microenvironment or the lung tumors themselves and should be followed up in future studies. Moreover, these mRNA-based results should be validated at the protein level.
The initial focus of our study aimed to investigate differences in tumor biology between AAs and EAs with NSCLC at the transcriptomic level. Previous studies in breast, colorectal, prostate, and endometrial tissues have identified genes associated with population stratification, such as PSPHL, CRYBB2, AMFR, and SOS1 (16–18, 20, 32, 40). In our study, we also identified distinct expression of these transcripts in AA lung tissues (both adjacent normal and tumors) for the first time. In addition, we identified a novel region on chromosome 17q21.31 that includes the genes ARL17A, LRCC37A3, and KANSL1. Expression of these three genes was significantly lower in AA lung tissues compared with EAs. Structural diversity at the 17q21 region was previously identified and encompasses an inversion polymorphism with segmental duplication (59). Having either the direct (H1) or inverted haplotype (H2) has been reported to confer differential susceptibility to nonallelic homologous recombination (NAHR) and diseases, including genomic disorders and cancer. European populations have a high frequency of duplication events, whereas these structural duplications are essentially absent from most West African populations (59). Our findings therefore are consistent with these observations and provide transcriptomic support for genetic diversity at 17q21 in AAs and EAs.
High forced expiratory volume in 1 second (FEV1) has been used as a clinical measure of lung health. The 17q21 segmental duplication has been associated with low FEV1 and higher rates of COPD (a known risk factor for NSCLC development) in never and current smokers of European ancestry (60). Specifically, the KANSL1 duplication event was associated with extreme lows of FEV1 and led to the production of a novel KANSL1 transcript resulting in deficient histone acetyltransferase activity. Given that low FEV1 is a feature of COPD, and that low FEV1 is associated with duplication within 17q21, this structural genomic diversity could, at least in part, explain the higher incidence of COPD in EAs.
Recent work further elaborates on the link between COPD and chromosomal region 17q. Some 43 new signals associated with lung function and 97 signals were associated with COPD (61). Two other genes, EFCAB5 (17q11.2) and CISD3 (17q12), were labeled as high-priority genes according to expression data and functional annotation. In our cohort, differential expression of EFCAB5 and CISD3 between tumor and normal samples from both AAs and EAs were not significant. This is not surprising as these 17q regions have not been associated with genetic ancestry in Africans or Europeans in the literature. Seven genes have FDA-approved targeted drug therapies. This knowledge, along with our Connectivity Mapping results predicting distinct drug response profiles in AAs and EAs, opens new avenues for studying the interaction of genetic susceptibility to COPD and COPD treatment by race. These findings are based on epidemiologic data and further molecular studies are needed to elucidate the biological mechanisms that underlie these associations, and their relative risk to lung cancer. This population stratification analysis has, for the first time, provided novel insights into the divergent racial prevalence of COPD. Future work will need to determine whether there is a link between this area of population stratification with COPD and NSCLC in individuals with African ancestry.
For the first time, our comparative profiling of the coding and noncoding NSCLC transcriptome provides evidence that AA-enriched and EA-enriched differential gene expression and miRNA expression exists in NSCLC. Taken together, our data have shown AAs and EAs with NSCLC are likely to diverge in potentially clinically meaningful ways. Pathway enrichment based on population-enriched gene expression signatures varied considerably, with overrepresentation of pathways associated with a more stem-cell like phenotype being present in AAs and driven, at least in part, by miRNAs. Predicted drug sensitivity and resistance analysis suggested that AAs and EAs may not equally benefit from the same range of clinical (current) and preclinical (future) drugs. We also identified racial differences in the abundance and composition of infiltrating immune cells from the lung tumor microenvironment, which must be considered as cancer immunotherapy is rapidly moving towards that being a standard of care. Leveraging transcriptomic differences, along with integrative genomics, in NSCLCs from AAs and EAs has important implications for combinatorial therapeutic interventions based on population differences in tumor biology. Understanding the racial differences in lung tumor biology between AAs and EAs, and accounting for its contribution to therapeutic response, could ultimately help to reduce morbidity and mortality in both populations.
Supplementary Material
Translational Relevance.
Historically, AAs have been underrepresented in clinical cancer research. Diversity helps to ensure equal access to new cancer therapies and better treatment for everyone. Cancer research is increasingly focused on classifying patients according to molecular profiles for particular groups. We provide a detailed molecular analysis from paired non-small cell lung cancer (NSCLC) tissues that identified differential coding and noncoding RNA expression in NSCLC from AAs and EAs. Similar to other tumor types, we determined that race- enriched gene and miRNA expression signatures suggest a more aggressive disease in AAs. On the basis of predicted drug resistance to adjuvant chemotherapies, AAs may not equally benefit from the same range of clinical drugs as EAs. Our findings provide a rationale for integrating coding and noncoding transcriptome profiles, along with clinical, demographic, and genomic data, when determining treatment options.
Grant Support
K.A. Mitchell, A. Zingone, L. Toulabi, J. Boeckelman, and B.M. Ryan are financially supported by the NIH Intramural Research Program.
The costs of publication of this article were defrayed in part by the payment of page charges. This article must therefore be hereby marked advertisement in accordance with 18 U.S.C. Section 1734 solely to indicate this fact.
Footnotes
Disclosure of Potential Conflicts of Interest
No potential conflicts of interest were disclosed.
Note: Supplementary data for this article are available at Clinical Cancer Research Online (http://clincancerres.aacrjournals.org/).
References
- 1.DeSantis CE, Siegel RL, Sauer AG, Miller KD, Fedewa SA, Alcaraz KI, et al. Cancer statistics for African Americans, 2016: progress and opportunities in reducing racial disparities. CA Cancer J Clin 2016; 66:290–308. [DOI] [PubMed] [Google Scholar]
- 2.Zheng L, Enewold L, Zahm SH, Shriver CD, Zhou J, Marrogi A, et al. Lung cancer survival among black and white patients in an equal access health system. Cancer Epidemiol Biomarkers Prev 2012;21:1841–7. [DOI] [PMC free article] [PubMed] [Google Scholar]
- 3.Haiman CA, Stram DO, Wilkens LR, Pike MC, Kolonel LN, Henderson BE, et al. Ethnic and racial differences in the smoking-related risk of lung cancer. N Engl J Med 2006;354:333–42. [DOI] [PubMed] [Google Scholar]
- 4.Blot WJ, Cohen SS, Aldrich M, McLaughlin JK, Hargreaves MK, Signorello LB. Lung cancer risk among smokers of menthol cigarettes. J Natl Cancer Inst 2011;103:810–6. [DOI] [PMC free article] [PubMed] [Google Scholar]
- 5.Thun MJ, Hannan LM, Adams-Campbell LL, Boffetta P, Buring JE, Feskanich D, et al. Lung cancer occurrence in never-smokers: an analysis of 13 cohorts and 22 cancer registry studies. PLoS Med 2008;5:e185. [DOI] [PMC free article] [PubMed] [Google Scholar]
- 6.Han Y, Rand KA, Hazelett DJ, Ingles SA, Kittles RA, Strom SS, et al. Prostate cancer susceptibility in men of African Ancestry at 8q24. J Natl Cancer Inst 2016;108. [DOI] [PMC free article] [PubMed] [Google Scholar]
- 7.Chen LS, Saccone NL, Culverhouse RC, Bracci PM, Chen CH, Dueker N, et al. Smoking and genetic risk variation across populations of European, Asian, and African American ancestry-a meta-analysis of chromosome 15q25. Genet Epidemiol 2012;36:340–51. [DOI] [PMC free article] [PubMed] [Google Scholar]
- 8.Hung RJ, McKay JD, Gaborieau V, Boffetta P, Hashibe M, Zaridze D, et al. A susceptibility locus for lung cancer maps to nicotinic acetylcholine receptor subunit genes on 15q25. Nature 2008;452:633–7. [DOI] [PubMed] [Google Scholar]
- 9.Zanetti KA, Wang Z, Aldrich M, Amos CI, Blot WJ, Bowman ED, et al. Genome-wide association study confirms lung cancer susceptibility loci on chromosomes 5p15 and 15q25 in an African-American population. Lung Cancer 2016;98:33–42. [DOI] [PMC free article] [PubMed] [Google Scholar]
- 10.Patel YM, Stram DO, Wilkens LR, Park SS, Henderson BE, Le Marchand L, et al. The contribution of common genetic variation to nicotine and cotinine glucuronidation in multiple ethnic/racial populations. Cancer Epidemiol Biomarkers Prev 2015;24:119–27. [DOI] [PMC free article] [PubMed] [Google Scholar]
- 11.Murphy SE, Park SS, Thompson EF, Wilkens LR, Patel Y, Stram DO, et al. Nicotine N-glucuronidation relative to N-oxidation and C-oxidation and UGT2B10 genotype in five ethnic/racial groups. Carcinogenesis 2014; 35:2526–33. [DOI] [PMC free article] [PubMed] [Google Scholar]
- 12.Field LA, Love B, Deyarmin B, Hooke JA, Shriver CD, Ellsworth RE. Identification of differentially expressed genes in breast tumors from African American compared with Caucasian women. Cancer 2012;118: 1334–44. [DOI] [PubMed] [Google Scholar]
- 13.Terunuma A, Putluri N, Mishra P, Mathe EA, Dorsey TH, Yi M, et al. MYC-driven accumulation of 2-hydroxyglutarate is associated with breast cancer prognosis. J Clin Invest 2014;124:398–412. [DOI] [PMC free article] [PubMed] [Google Scholar]
- 14.Wang H, Liu W, Black S, Turner O, Daniel JM, Dean-Colomb W, et al. Kaiso, a transcriptional repressor, promotes cell migration and invasion of prostate cancer cells through regulation of miR-31 expression. Oncotarget 2016;7:5677–89. [DOI] [PMC free article] [PubMed] [Google Scholar]
- 15.Reams RR, Jones-Triche J, Chan OT, Hernandez BY, Soliman KF, Yates C. Immunohistological analysis of ABCD3 expression in Caucasian and African American prostate tumors. BioMed Res Int 2015;2015:132981. [DOI] [PMC free article] [PubMed] [Google Scholar]
- 16.Wallace TA, Prueitt RL, Yi M, Howe TM, Gillespie JW, Yfantis HG, et al. Tumor immunobiological differences in prostate cancer between African-American and European-American men. Cancer Res 2008;68:927–36. [DOI] [PubMed] [Google Scholar]
- 17.Timofeeva OA, Zhang X, Ressom HW, Varghese RS, Kallakury BV, Wang K, et al. Enhanced expression of SOS1 is detected in prostate cancer epithelial cells from African–American men. Int J Oncol 2009;35:751–60. [PMC free article] [PubMed] [Google Scholar]
- 18.Allard JE, Chandramouli GV, Stagliano K, Hood BL, Litzi T, Shoji Y, et al. Analysis of PSPHL as a candidate gene influencing the racial disparity in endometrial cancer. Front Oncol 2012;2:65. [DOI] [PMC free article] [PubMed] [Google Scholar]
- 19.Weige CC, Birtwistle MR, Mallick H, Yi N, Berrong Z, Cloessner E, et al. Transcriptomes and shRNA suppressors in a TP53 allele-specific model of early-onset colon cancer in African Americans. Mol Cancer Res 2014;12: 1029–41. [DOI] [PMC free article] [PubMed] [Google Scholar]
- 20.Jovov B, Araujo-Perez F, Sigel CS, Stratford JK, McCoy AN, Yeh JJ, et al. Differential gene expression between African American and European American colorectal cancer patients. PLoS One 2012;7:e30168. [DOI] [PMC free article] [PubMed] [Google Scholar]
- 21.Carethers JM, Murali B, Yang B, Doctolero RT, Tajima A, Basa R, et al. Influence of race on microsatellite instability and CD8+ T cell infiltration in colon cancer. PLoS One 2014;9:e100461. [DOI] [PMC free article] [PubMed] [Google Scholar]
- 22.Maxwell GL, Shoji Y, Darcy K, Litzi T, Berchuck A, Hamilton CA, et al. MicroRNAs in endometrial cancers from black and white patients. Am J Obstet Gynecol 2015;212:191. [DOI] [PubMed] [Google Scholar]
- 23.Theodore SC, Davis M, Zhao F, Wang H, Chen D, Rhim J, et al. MicroRNA profiling of novel African American and Caucasian Prostate Cancer cell lines reveals a reciprocal regulatory relationship of miR-152 and DNA methyltranferase 1. Oncotarget 2014;5: 3512–25. [DOI] [PMC free article] [PubMed] [Google Scholar]
- 24.Farhana L, Antaki F, Anees MR, Nangia-Makker P, Judd S, Hadden T, et al. Role of cancer stem cells in racial disparity in colorectal cancer. Cancer Med 2016;5:1268–78. [DOI] [PMC free article] [PubMed] [Google Scholar]
- 25.Zheng YL, Loffredo CA, Yu ZP, Jones RT, Krasna MJ, Alberg AJ, et al. Bleomycin-induced chromosome breaks as a risk marker for lung cancer: a case-control study with population and hospital controls (vol 24, pg 269, 2003). Carcinogenesis 2003;24:1425. [DOI] [PubMed] [Google Scholar]
- 26.Subramanian A, Tamayo P, Mootha VK, Mukherjee S, Ebert BL, Gillette MA, et al. Gene set enrichment analysis: a knowledge-based approach for interpreting genome-wide expression profiles. Proc Natl Acad Sci U S A 2005;102:15545–50. [DOI] [PMC free article] [PubMed] [Google Scholar]
- 27.Lamb J, Crawford ED, Peck D, Modell JW, Blat IC, Wrobel MJ, et al. The Connectivity Map: using gene-expression signatures to connect small molecules, genes, and disease. Science 2006;313:1929–35. [DOI] [PubMed] [Google Scholar]
- 28.Newman AM, Liu CL, Green MR, Gentles AJ, Feng W, Xu Y, et al. Robust enumeration of cell subsets from tissue expression profiles. Nat Methods 2015;12:453–7. [DOI] [PMC free article] [PubMed] [Google Scholar]
- 29.Robbins HA, Engels EA, Pfeiffer RM, Shiels MS. Age at cancer diagnosis for blacks compared with whites in the United States. J Natl Cancer Inst 2015;107. pii:dju489. [DOI] [PMC free article] [PubMed] [Google Scholar]
- 30.Hardiman G, Savage SJ, Hazard ES, Wilson RC, Courtney SM, Smith MT, et al. Systems analysis of the prostate transcriptome in African-American men compared with European-American men. Pharmacogenomics 2016;17:1129–43. [DOI] [PMC free article] [PubMed] [Google Scholar]
- 31.Basa RCB, Davies V, Li XX, Murali B, Shah J, Yang B, et al. Decreased anti-tumor cytotoxic immunity among microsatellite-stable colon cancers from African Americans. PLoS One 2016;11: e0156660. [DOI] [PMC free article] [PubMed] [Google Scholar]
- 32.Martin DN, Boersma BJ, Yi M, Reimers M, Howe TM, Yfantis HG, et al. Differences in the tumor microenvironment between African-American and European-American breast cancer patients. PLoS One 2009;4: e4531. [DOI] [PMC free article] [PubMed] [Google Scholar]
- 33.Chen DS, Mellman I. Elements of cancer immunity and the cancer-immune set point. Nature 2017;541:321–30. [DOI] [PubMed] [Google Scholar]
- 34.Tanvetyanon T, Gray JE, Antonia SJ. PD-1 checkpoint blockade alone or combined PD-1 and CTLA-4 blockade as immunotherapy for lung cancer? Expert Opin Biol Ther 2017;17:305–12. [DOI] [PubMed] [Google Scholar]
- 35.Rummel S, Penatzer CE, Shriver CD, Ellsworth RE. PSPHL and breast cancer in African American women: causative gene or population stratification? BMC Genet 2014;15:38. [DOI] [PMC free article] [PubMed] [Google Scholar]
- 36.Klorin G, Rozenblum E, Glebov O, Walker RL, Park Y, Meltzer PS, et al. Integrated high-resolution array CGH and SKY analysis of homozygous deletions and other genomic alterations present in malignant mesothelioma cell lines. Cancer Genet 2013;206:191–205. [DOI] [PMC free article] [PubMed] [Google Scholar]
- 37.Tan DS, Mok TS, Rebbeck TR. Cancer genomics: diversity and disparity across ethnicity and geography. J Clin Oncol 2016;34:91–101. [DOI] [PubMed] [Google Scholar]
- 38.Campbell JD, Lathan C, Sholl L, Ducar M, Vega M, Sunkavalli A, et al. Comparison of prevalence and types of mutations in lung cancers among black and white populations. JAMA Oncol 2017;3:801–9. [DOI] [PMC free article] [PubMed] [Google Scholar]
- 39.Leavell BJ, Van Buren E, Antaki F, Axelrod BN, Rambus MA, Majumdar AP. Associations between markers of colorectal cancer stem cells and adenomas among ethnic groups. Dig Dis Sci 2012;57: 2334–9. [DOI] [PMC free article] [PubMed] [Google Scholar]
- 40.Kinseth MA, Jia Z, Rahmatpanah F, Sawyers A, Sutton M, Wang-Rodriguez J, et al. Expression differences between African American and Caucasian prostate cancer tissue reveals that stroma is the site of aggressive changes. Int J Cancer 2014;134:81–91. [DOI] [PMC free article] [PubMed] [Google Scholar]
- 41.Nakshatri H, Anjanappa M, Bhat-Nakshatri P. Ethnicity-dependent and-independent heterogeneity in healthy normal breast hierarchy impacts tumor characterization. Sci Rep 2015;5:13526. [DOI] [PMC free article] [PubMed] [Google Scholar]
- 42.Mechanic LE, Bowman ED, Welsh JA, Khan MA, Hagiwara N, Enewold L, et al. Common genetic variation in TP53 is associated with lung cancer risk and prognosis in African Americans and somatic mutations in lung tumors. Cancer Epidemiol Biomarkers Prev 2007; 16:214–22. [DOI] [PubMed] [Google Scholar]
- 43.Ceccaldi R, Parmar K, Mouly E, Delord M, Kim JM, Regairaz M, et al. Bone marrow failure in Fanconi anemia is triggered by an exacerbated p53/p21 DNA damage response that impairs hematopoietic stem and progenitor cells. Cell Stem Cell 2012;11:36–49. [DOI] [PMC free article] [PubMed] [Google Scholar]
- 44.Qiao Q, Hu W. The association between TP53 Arg72Pro polymorphism and lung cancer susceptibility: evidence from 30,038 subjects. Lung 2013;191:369–77. [DOI] [PubMed] [Google Scholar]
- 45.Chen S, Li P, Yang R, Cheng R, Zhang F, Wang Y, et al. microRNA-30b inhibits cell invasion and migration through targeting collagen triple helix repeat containing 1 in non-small cell lung cancer. Cancer Cell Int 2015;15:85. [DOI] [PMC free article] [PubMed] [Google Scholar]
- 46.Savita U, Karunagaran D. MicroRNA-106b-25 cluster targets beta-TRCP2, increases the expression of Snail and enhances cell migration and invasion in H1299 (non small cell lung cancer) cells. Biochem Biophys Res Commun 2013;434:841–7. [DOI] [PubMed] [Google Scholar]
- 47.Xu W, Ji J, Xu Y, Liu Y, Shi L, Liu Y, et al. MicroRNA-191, by promoting the EMT and increasing CSC-like properties, is involved in neoplastic and metastatic properties of transformed human bronchial epithelial cells. Mol Carcinog 2015;54:E148–161. [DOI] [PubMed] [Google Scholar]
- 48.Das J, Samadder A, Das S, Paul A, Khuda-Bukhsh AR. Nanopharmaceutical approach for enhanced anti-cancer activity of betulinic acid in lung-cancer treatment via activation of PARP: interaction with DNA as a target: -anticancer potential of nano-betulinic acid in lung cancer. J Pharmacopuncture 2016;19:37–44. [DOI] [PMC free article] [PubMed] [Google Scholar]
- 49.Hsu TI, Chen YJ, Hung CY, Wang YC, Lin SJ, Su WC, et al. A novel derivative of betulinic acid, SYK023, suppresses lung cancer growth and malignancy. Oncotarget 2015;6:13671–87. [DOI] [PMC free article] [PubMed] [Google Scholar]
- 50.Potze L, di Franco S, Kessler JH, Stassi G, Medema JP. Betulinic acid kills colon cancer stem cells. Curr Stem Cell Res Ther 2016;11:427–33. [DOI] [PubMed] [Google Scholar]
- 51.Frohlich E, Wahl R. Chemotherapy and chemoprevention by thiazolidinediones. BioMed Res Int 2015;2015:845340. [DOI] [PMC free article] [PubMed] [Google Scholar]
- 52.Girnun GD, Chen L, Silvaggi J, Drapkin R, Chirieac LR, Padera RF, et al. Regression of drug-resistant lung cancer by the combination of rosiglitazone and carboplatin. Clin Cancer Res 2008;14:6478–86. [DOI] [PMC free article] [PubMed] [Google Scholar]
- 53.Contador D, Ezquer F, Espinosa M, Arango-Rodriguez M, Puebla C, Sobrevia L, et al. et al. Dexamethasone and rosiglitazone are sufficient and necessary for producing functional adipocytes from mesenchymal stem cells. Exp Biol Med 2015;240:1235–46. [DOI] [PMC free article] [PubMed] [Google Scholar]
- 54.Figeac F, Dagouassat M, Mahrouf-Yorgov M, Le Gouvello S, Trebeau C, Sayed A, et al. Lung fibroblasts share mesenchymal stem cell features which are altered in chronic obstructive pulmonary disease via the overactivation of the Hedgehog signaling pathway. PLoS One 2015;10: e0121579. [DOI] [PMC free article] [PubMed] [Google Scholar]
- 55.Govindarajan R, Ratnasinghe L, Simmons DL, Siegel ER, Midathada MV, Kim L, et al. Thiazolidinediones and the risk of lung, prostate, and colon cancer in patients with diabetes. J Clin Oncol 2007;25:1476–81. [DOI] [PubMed] [Google Scholar]
- 56.Dang N, Meng X, Song H. Nicotinic acetylcholine receptors and cancer. Biomed Rep 2016;4:515–8. [DOI] [PMC free article] [PubMed] [Google Scholar]
- 57.Kurebayashi Y, Emoto K, Hayashi Y, Kamiyama I, Ohtsuka T, Asamura H, et al. Comprehensive immune profiling of lung adenocarcinomas reveals four immunosubtypes with plasma cell subtype a negative indicator. Cancer Immunol Res 2016;4:234–47. [DOI] [PubMed] [Google Scholar]
- 58.Mantovani A, Sica A, Sozzani S, Allavena P, Vecchi A, Locati M. The chemokine system in diverse forms of macrophage activation and polarization. Trends Immunol 2004;25:677–86. [DOI] [PubMed] [Google Scholar]
- 59.Steinberg KM, Antonacci F, Sudmant PH, Kidd JM, Campbell CD, Vives L, et al. Structural diversity and African origin of the 17q21.31 inversion polymorphism. Nat Genet 2012;44:872–80. [DOI] [PMC free article] [PubMed] [Google Scholar]
- 60.Wain LV, Shrine N, Miller S, Jackson VE, Ntalla I, Soler Artigas M, et al. Novel insights into the genetics of smoking behaviour, lung function, and chronic obstructive pulmonary disease (UK BiLEVE): a genetic association study in UK Biobank. Lancet Respir Med 2015;3:769–81. [DOI] [PMC free article] [PubMed] [Google Scholar]
- 61.Wain LV, Shrine N, Artigas MS, Erzurumluoglu AM, Noyvert B, Bossini-Castillo L, et al. Genome-wide association analyses for lung function and chronic obstructive pulmonary disease identify new loci and potential druggable targets. Nat Genet 2017;49:416–25. [DOI] [PMC free article] [PubMed] [Google Scholar]
Associated Data
This section collects any data citations, data availability statements, or supplementary materials included in this article.