Introductory Paragraph:
Seeds are a key lifecycle stage for many plants. Seeds are also the basis of agriculture and the primary source of calories consumed by humans (1). Here, we employ single-nucleus RNA-sequencing to generate a transcriptional atlas of developing Arabidopsis thaliana seeds, with a focus on endosperm. Endosperm, the primary site of gene imprinting in flowering plants, mediates the relationship between the maternal parent and embryo (2). We identify transcriptionally-uncharacterized nuclei types in the chalazal endosperm, which interfaces with maternal tissue for nutrient unloading (3,4). We demonstrate that the extent of parental bias of maternally expressed imprinted genes varies with cell cycle phase, and that imprinting of paternally expressed imprinted genes is strongest in chalazal endosperm. Thus, imprinting is spatially and temporally heterogeneous. Increased paternal expression in the chalazal region suggests that parental conflict, which is proposed to drive imprinting evolution, is fiercest at the boundary between filial and maternal tissues.
Flowering plant seeds are complex structures, comprising a diploid maternally-derived seed coat that surrounds two products of distinct fertilization events – the embryo and endosperm. The diploid embryo represents the next generation of the plant. The endosperm is an often triploid tissue (due to the presence of an additional maternal genome complement), and is an altruistic mediator of the relationship between its sibling embryo and their resource-supplying mother. Endosperm is a key evolutionary innovation of flowering plants and has been identified as the site of genomic imprinting, an epigenetic gene regulatory process that results in differential expression of maternally and paternally inherited alleles (1,2). Although an ephemeral tissue, endosperm undergoes a unique developmental program that includes differentiation into three morphologically and spatially-defined domains: the micropylar domain surrounds the embryo, the chalazal domain occupies the opposite end of the seed, and the peripheral domain lies in between (3–8). Gene expression patterns in the three endosperm domains have been assessed by microarray analysis (9), but it is unknown whether cell-type heterogeneity exists within domains. Despite its evolutionary and agronomic importance, endosperm biology remains relatively little understood. A complete record of all transcriptionally unique cell or nuclei types within the endosperm has been unobtainable due to the compact, interconnected, and complex nature of seeds.
To build a comprehensive map of transcriptional complexity and to examine imprinting dynamics during early endosperm development in Arabidopsis, we performed single-nucleus RNA-seq (snRNA-seq). We isolated nuclei instead of cells because the endosperm is syncytial during its early development and organized into nucleocytoplasmic domains (5–8). Later, endosperm undergoes progressive cellularization in a wave from the micropylar to chalazal pole (5–8). We obtained high-quality transcriptomes for 1,437 nuclei using fluorescence-activated sorting of DAPI-stained seed nuclei (FANS) to enrich for 3C or 6C endosperm nuclei, using a modified smart-seq2 protocol (10) for library preparation (Fig. 1a, Extended Data Fig. 1, Figs. S1,S2, Supplementary Data 1). On average, we detected expression from 3,200 genes per 3C endosperm nucleus and 4,200 genes per 6C endosperm nucleus (Fig. S1). We clustered all snRNA-seq data using the SC3 program (11), obtaining 27 clusters ranging in size from 8 to 172 nuclei (Extended Data Fig. 2). Based on initial clustering and the fraction of maternal allele expression per nucleus, we identified 966 endosperm nuclei, 464 seed coat nuclei, and 7 embryo nuclei (Extended Data Fig. 1, Extended Data Fig. 2, Supplementary Data 1, Supplementary Material). Although we assayed multiple time points and genotypes, most profiled nuclei (74%) were from F1 seed from reciprocal crosses between the wild-type strains Col and Cvi obtained at 4 days after pollination (DAP) (Fig. 1a, Supplementary Data 1), and were the focus of subsequent analyses.
Fig. 1. Distinct nuclei types in Arabidopsis endosperm.
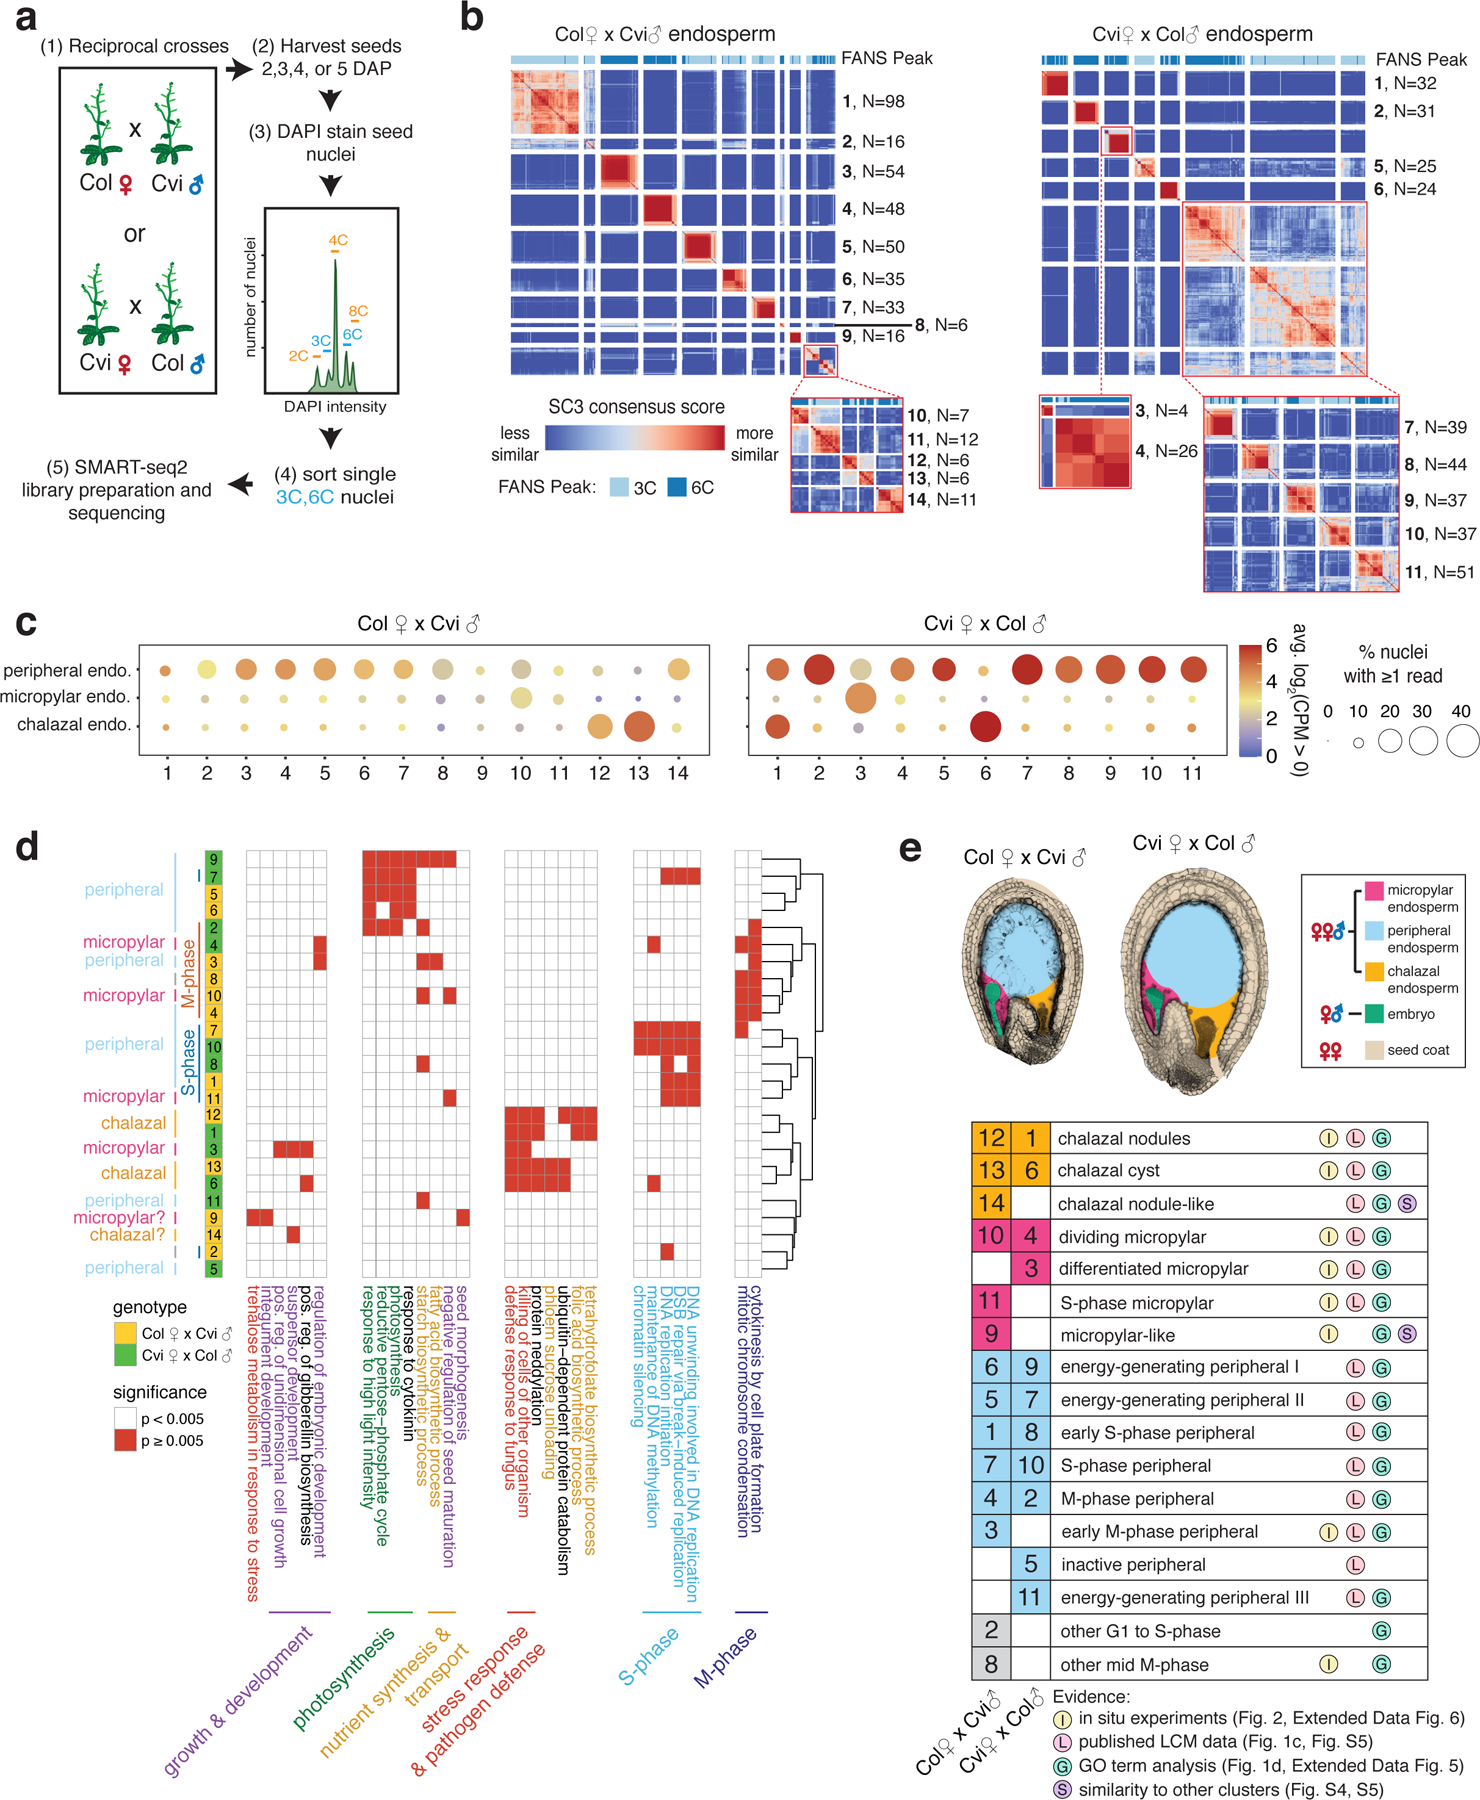
(a) Overview of experimental approach. (b) SC3 clustering of Col × Cvi and Cvi × Col 4 DAP endosperm nuclei. Insets: re-clustering to further resolve distinct groups. (c) Average expression of marker genes for peripheral, micropylar, and chalazal endosperm regions, based on (9,31). (d) Heatmap of a subset of significantly enriched gene ontology terms among genes upregulated in each cluster. (e) Seed images at 4 DAP, with seed regions false-colored, and identification of the nuclei states corresponding to each cluster.
To test whether our clustering strategy reliably identified distinct cell or nuclei types, we took advantage of the 356 seed coat nuclei collected at 4 DAP (Extended Data Fig. 1, Supplementary Data 1). The seed coat has at least five distinct cell layers and two major domains (general and chalazal) (9,12). Our nuclei clustering yielded 6 clusters for Col-derived seed coat (from Col × Cvi crosses) and 8 clusters for Cvi-derived seed coat (from Cvi × Col crosses) (Extended Data Fig. 3). To assign putative identities to the computationally-defined clusters, we evaluated the expression of genes known to be expressed in specific seed coat cell layers and also performed GO term enrichment analysis on differentially expressed genes (Extended Data Fig. 3, Extended Data Fig. 4, Figs. S3–S5, Supplementary Data 2). Our clustering and characterization corresponded well with known seed coat cell types and provides the first whole-genome expression dataset for distinct layers and regions of the seed coat (Extended Data Fig. 3, Supplementary Material).
We next applied our analysis method to the 802 endosperm nuclei isolated from Col-Cvi endosperm at 4 DAP. A single Arabidopsis seed has ~350 endosperm nuclei at the stage assayed (13), so this dataset should represent a near complete sampling. We identified 14 distinct nuclei clusters in Col × Cvi F1 endosperm (CxV E1-E14) and 11 clusters in Cvi × Col (VxC E1-E11) (Fig. 1b), suggesting there is previously undescribed transcriptional heterogeneity within the three known endosperm domains. We determined the identity of endosperm clusters by: evaluating the expression of known marker genes for micropylar, peripheral, and chalazal endosperm; differential gene expression and GO term enrichment analysis; in situ hybridization for cluster-specific transcripts; and cell cycle trajectory analysis. We identified several endosperm clusters corresponding to micropylar and peripheral endosperm nuclei, some related to cell cycle phase differences and others to putative functional differences (Fig. 1c,d,e, Fig. 2, Extended Data Figs. 5–7, Figs. S4–S7, Supplementary Material, Supplementary Data 2,3).
Fig. 2. Identification of clusters by in situ hybridization analysis.
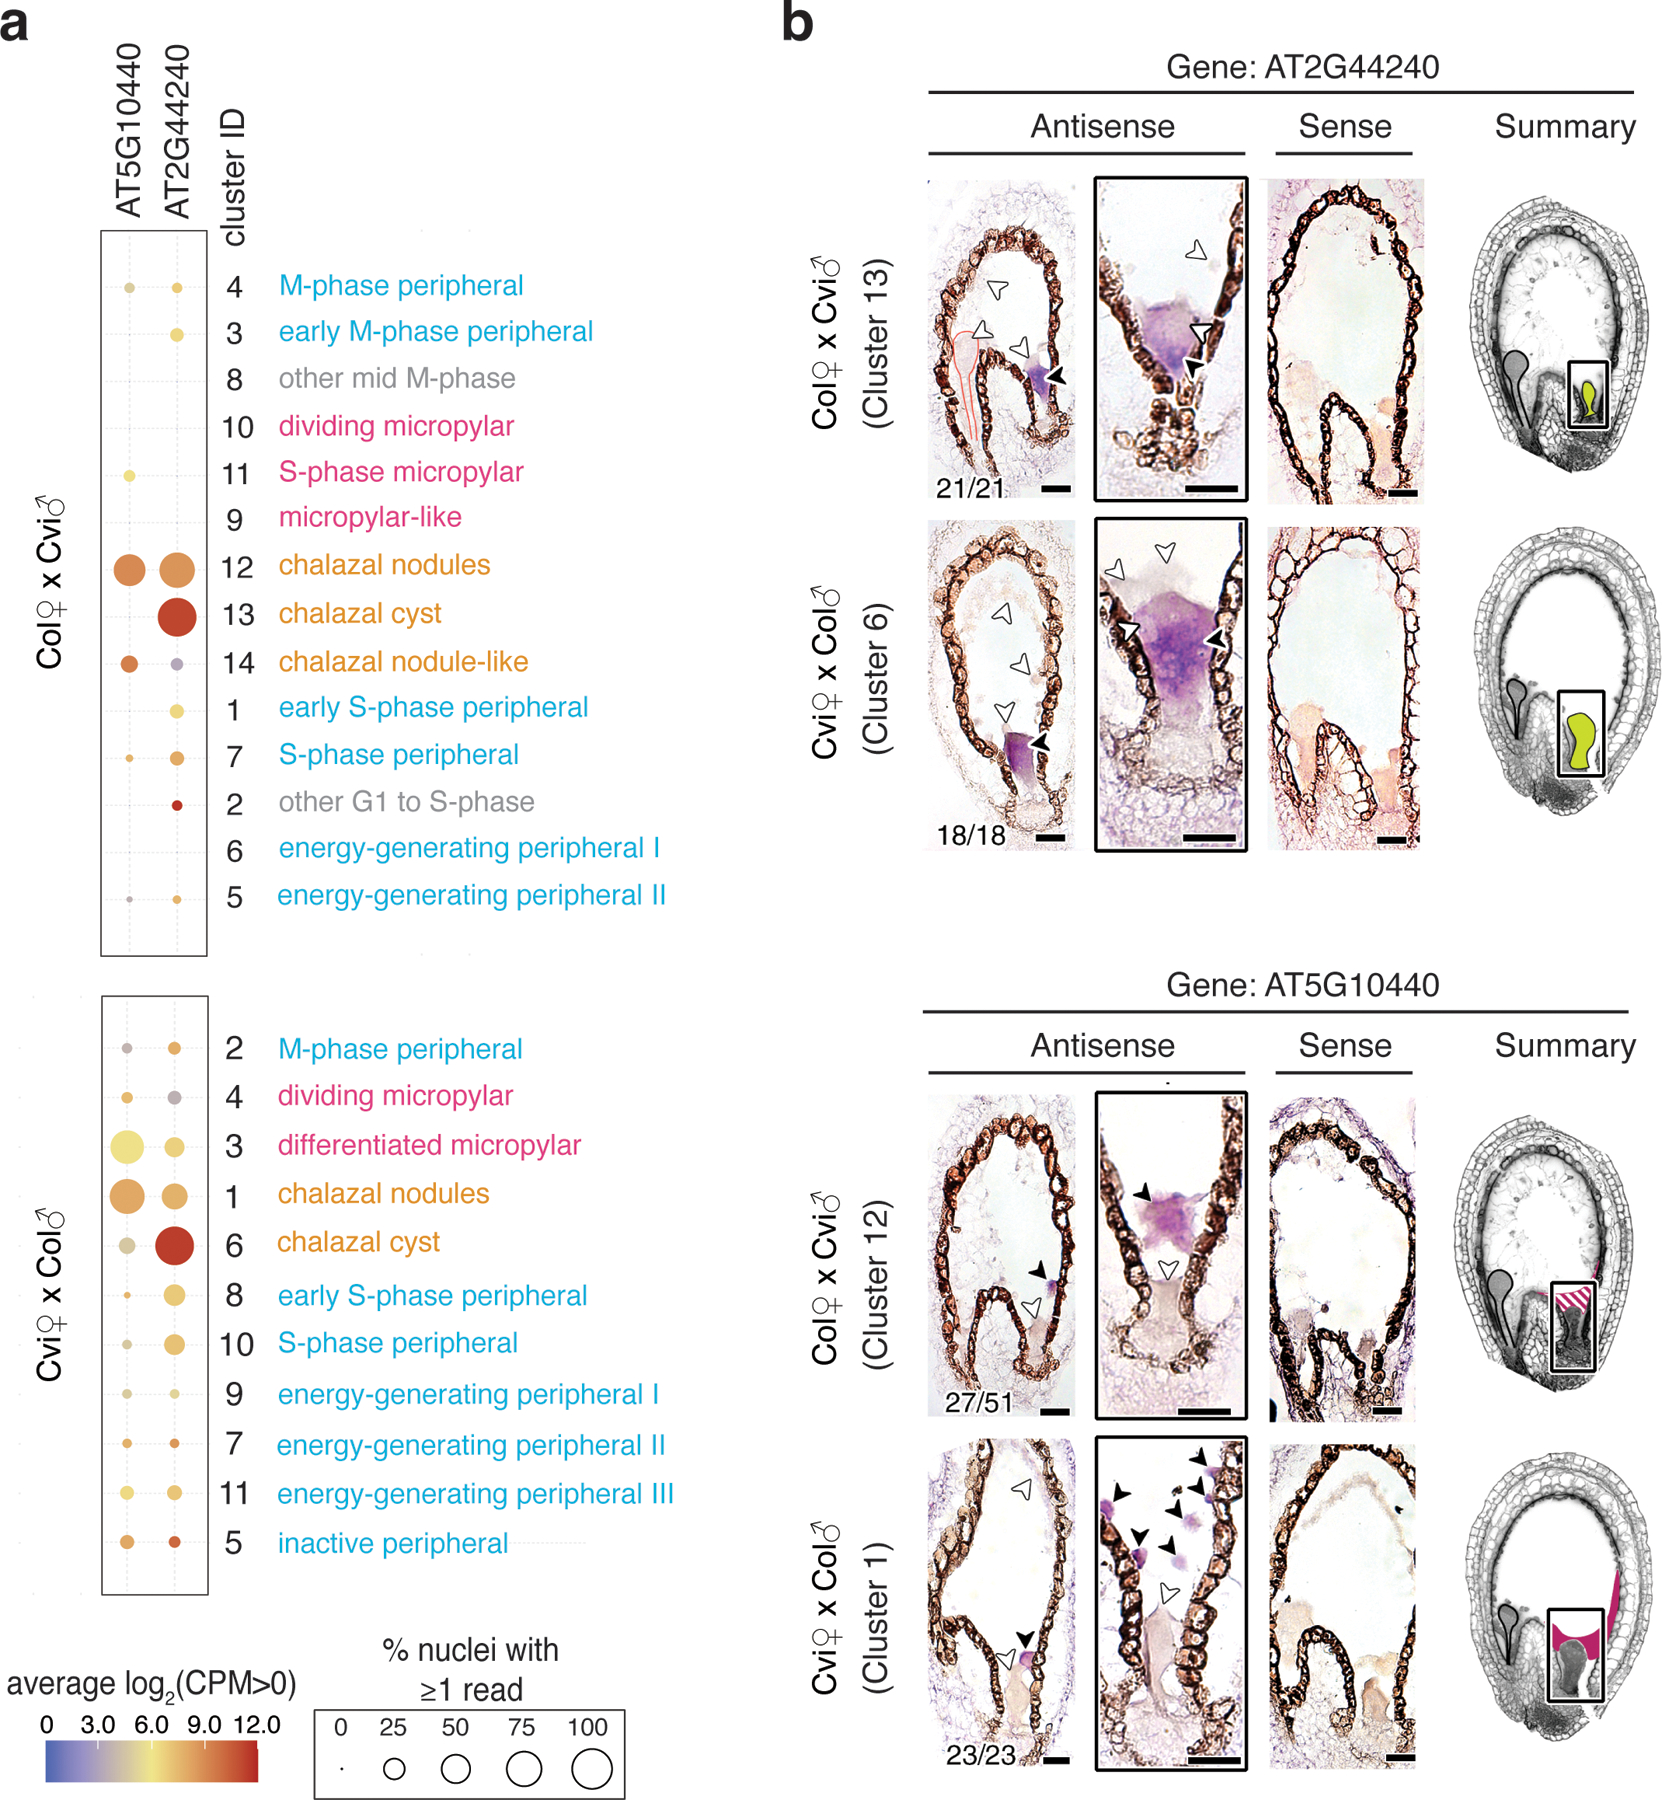
(a) Average expression of two chalazal endosperm cluster-specific genes selected for in situ hybridization. (b) RNA in situ hybridization (purple signal) in 4 DAP seeds. Black arrowheads, transcript detected; white arrowheads, no transcript detected. Embryos outlined in red. Number of seeds with the pictured expression pattern, as well as total number of seeds observed, indicated in bottom left of each image. Images without numbers represent higher magnification images or images of sense probes. False-colored images summarize gene expression patterns for each locus and cross direction. Solid colors, consistent detection; striped pattern, variably detected. Scale bars, 25 μm. Seeds were from three independent controlled pollination events, collected together. For all antisense probes, in situ experiment was performed at least twice.
Gene expression analysis and the overlap of known endosperm domain markers suggested that at least two distinct clusters in each genotype corresponded to chalazal endosperm, which is thought to be a primary site of nutrient transfer between the mother and offspring (4) (Fig. 1c,d, Fig. S4, Fig. S5). Anatomically, the chalazal endosperm consists of two regions, nodules and the cyst. The chalazal nodules are large, possibly multinucleate bodies lining the chalazal region (4,14), whereas the chalazal cyst is a cytoplasmically-dense, multinucleate region that forms at the interface between the endosperm and adjacent maternal tissue (4,15). Whether nodules or cysts have distinct functions or transcriptional profiles is largely unknown (6), though a handful of gene expression differences have been described (16,17). We performed RNA in situ hybridization on marker genes expressed specifically in the putative chalazal endosperm clusters (Fig. 2, Extended Data Fig. 6). These experiments showed that two transcripts most highly expressed in CxV E12 and VxC E1, AT1G44090 and AT5G10440, were localized specifically to the chalazal nodules (Fig. 2, Extended Data Fig. 6). In contrast, AT2G44240 and AT4G13380, which are primarily expressed in CxV E13 and VxC E6, were only detected in the chalazal cyst (Fig. 2, Extended Data Fig. 6). We concluded that the clusters CxV E12 and VxC E1 correspond to the chalazal nodules, while CxV E13 and VxC E6 correspond to the cyst (Fig. 1e, Fig. 2b). Remarkably, despite the lack of cell membranes and walls in chalazal endosperm, physically adjacent nodule and cyst nucleocytoplasmic domains did not share expression of cluster-specific genes (Fig. 2b). These data are the first transcriptomic description of these cell/nuclei types, providing a basis for further understanding of their developmental and functional differences.
Cell cycle phase further distinguished the chalazal cyst and nodules. Chalazal endosperm nuclei as a whole were predominantly in G1, G1/S, S and G2, but rarely in M phase, suggesting they undergo endoreduplication (Extended Data Fig. 7, Fig. S6, Supplementary Data 3). This is consistent with observations that chalazal endosperm nuclei are larger than other endosperm nuclei and likely polyploid (8,15), and with our finding that chalazal nuclei were preferentially sorted from the 6C FANS peak (Fig. 1b). More than half of nodule nuclei were in G1/S or S-phase, while most cyst nuclei were in G1 or G2 (Extended Data Fig. 7). No M phase nuclei were detected in the chalazal cyst. Thus, the cyst consists primarily of nuclei that are non-dividing or that spend little time in S-phase.
All chalazal clusters showed high expression of genes related to pathogen defense and cell killing, as well as protein neddylation (Fig. 1d, Extended Data Fig. 5). Additionally, genes highly expressed in chalazal nodules were involved in tetrahydrofolate and folic acid biosynthesis, a key step in one-carbon metabolism and a major target process for crop biofortification (18). By contrast, the cyst was enriched for ubiquitin-dependent protein catabolism and phloem sucrose unloading (Fig. 1d, Extended Data Fig. 5). The chalazal cyst is adjacent to the termination of maternal phloem tissue in the chalazal seed coat region, and the enrichment of genes related to phloem sucrose unloading is consistent with a nutrient transfer function for the cyst. Taken together, these experiments provide the strongest evidence to date that chalazal endosperm likely consists of two spatially, developmentally, and transcriptionally distinct nuclei types. These results also suggest that our clustering and characterization approach is both robust and sensitive enough to identify real, biologically distinct groups comprising as few as 6 nuclei (Fig. 1b).
We next took advantage of the allele-specific nature of our data to examine imprinted expression across the endosperm nuclei clusters we defined. Investigation of parental bias in endosperm allele-specific bulk mRNA-seq datasets (19–24) demonstrates that whereas imprinted genes are, by definition, significantly biased toward expression from either the maternal or paternal allele, few are expressed exclusively from one allele. Partial imprinting could result from incomplete silencing of the non-expressed allele throughout the endosperm, or from heterogeneous imprinting among individual cells or cell/nuclei types. Understanding whether endosperm imprinting is heterogeneous is important for understanding both the cellular and physiological function of imprinting and its underlying epigenetic basis.
We developed a novel analysis framework for evaluating imprinting from snRNA-seq data and one that is suitable for situations where maternal (m) and paternal (p) allelic dosage is not 1:1 (endosperm is 2m:1p) (Figs. S8,S9, Extended Data Fig. 8, Supplementary Material). Of 35,366 annotated loci, we were able to assess imprinting for approximately 15,800 genes. We detected significant maternal bias for 357 genes and paternal bias for 110 genes, many of which were previously identified as imprinted genes (Figs. S10–12, Supplementary Data 4). MEGs and PEGs were defined as strong, medium, or weak based on the extent of parental bias (Figs. S10,11, Supplementary Data 4). Imprinted genes were enriched for similar GO categories as was previously described (20), including genes involved in chromatin silencing and regulation of transcription for PEGs (Fig. S11).
To determine whether imprinted genes were preferentially expressed in specific nuclei types within endosperm, we examined total and allelic expression patterns across endosperm clusters. MEG expression was not enriched in any specific endosperm nuclei type, with a few exceptions for individual genes (Fig. S13). By contrast, nearly half of the PEGs had strongly enriched expression in the chalazal endosperm clusters (Fig. 3a,b, Fig. S13, Supplementary Data 4,5). A subset of these was specifically enriched in the chalazal nodules, while another subset was enriched in the cyst (Fig. 3a, Fig. S14, Supplementary Data 5). We found that the increased expression of PEGs in chalazal endosperm reflected increased expression from the paternal allele only, while maternal allele expression remained low and largely unchanging across all endosperm clusters (Fig. 3b,c; Fig. S14). This effect was not observed for non-imprinted genes with chalazal endosperm-enriched expression (Fig. S15). Thus, the paternal allele of many PEGs becomes specifically upregulated in the chalazal endosperm region. Taken together, these results demonstrate that imprinting is heterogeneous among endosperm cell/nuclei types.
Fig. 3. Imprinting heterogeneity in endosperm.
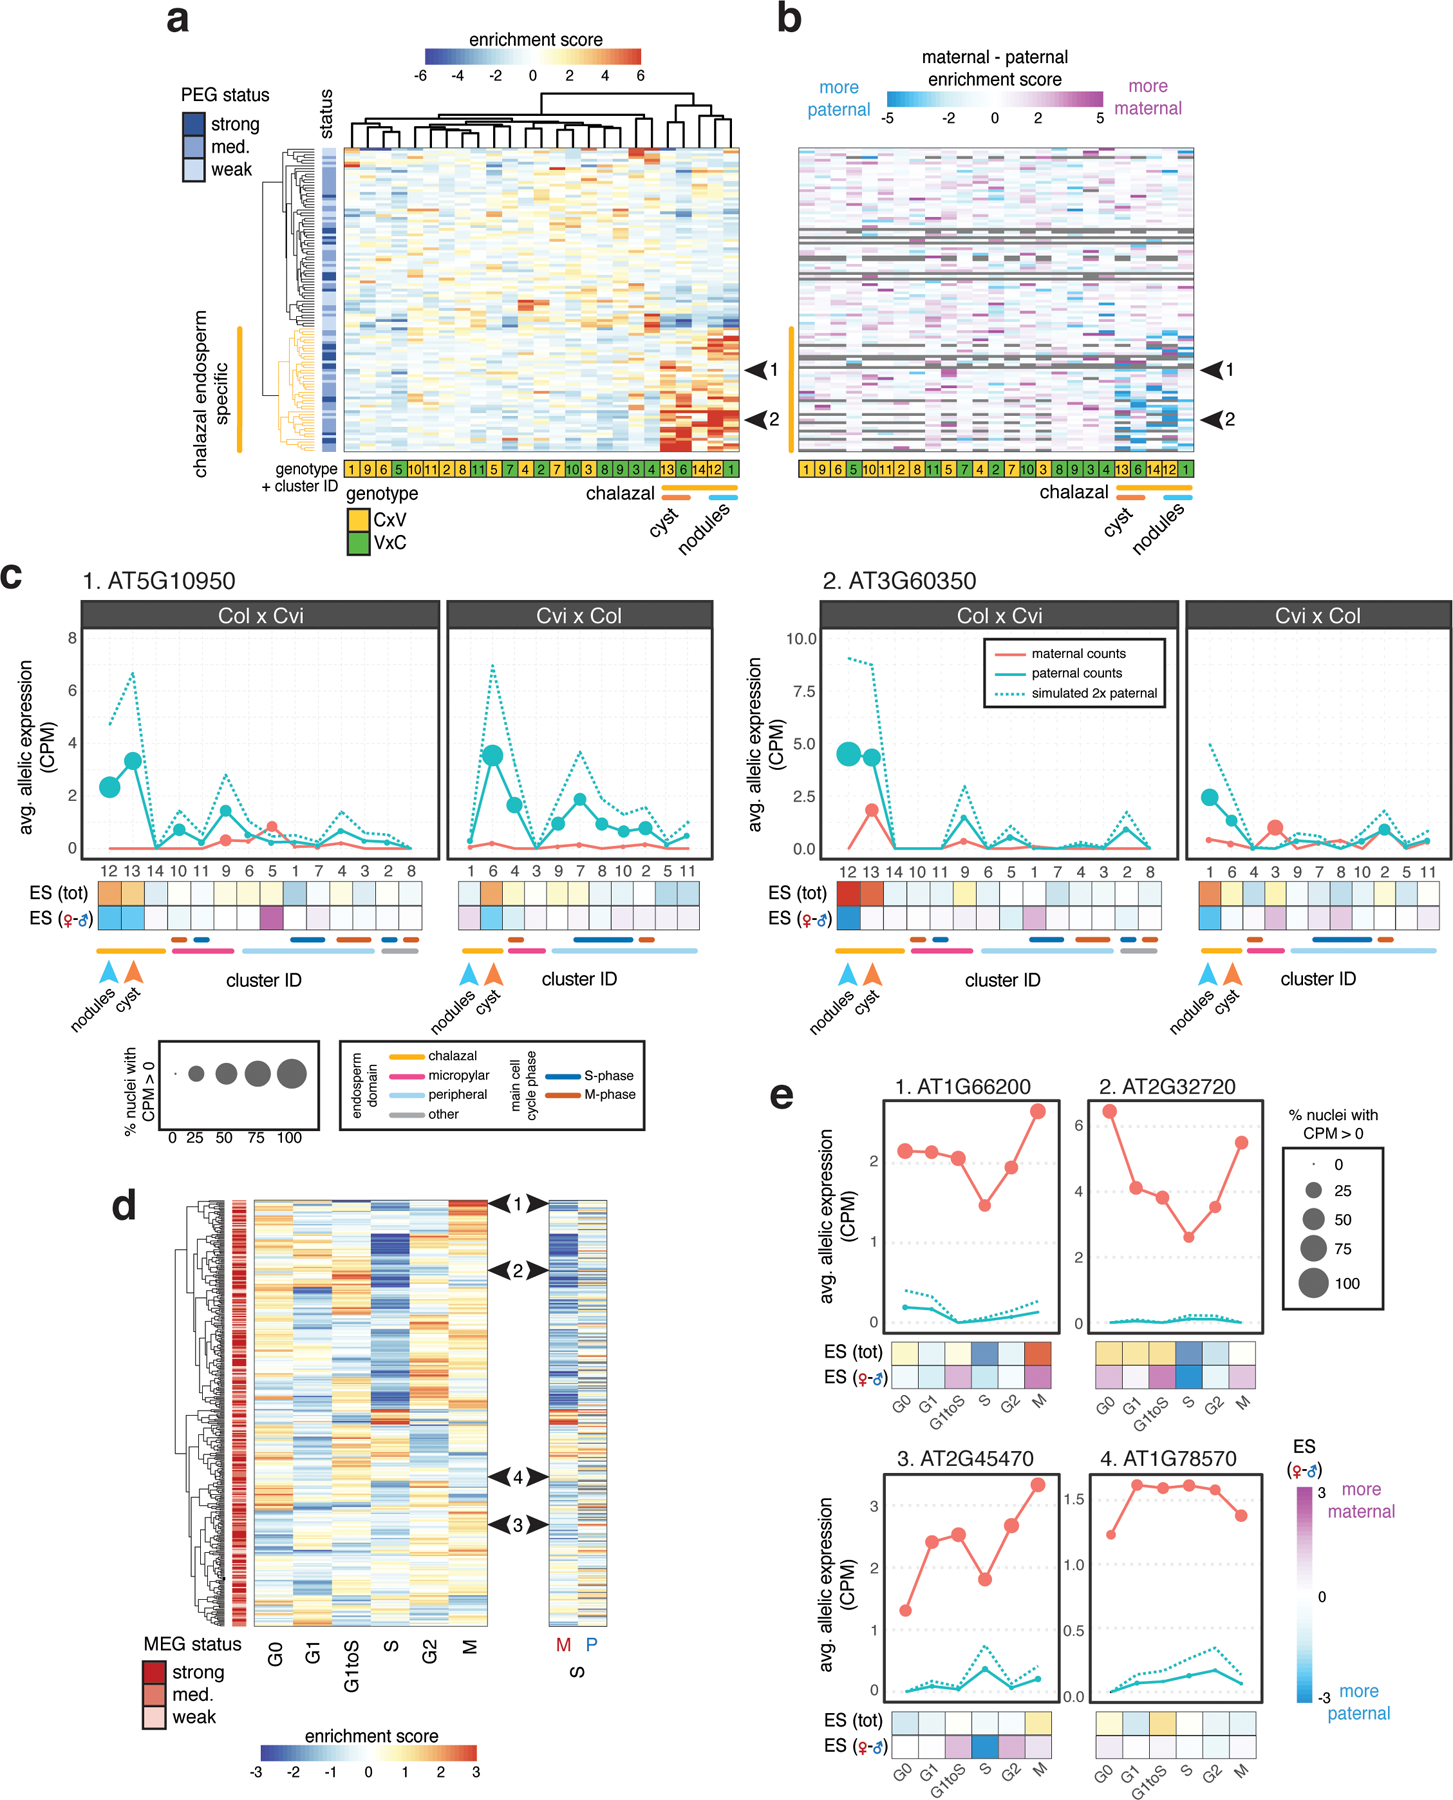
(a) A large fraction of PEGs are specifically expressed in chalazal endosperm. Heatmap of total expression enrichment scores (ES) for all PEGs. (b) Heatmap of ES (maternal) - ES (paternal), the difference between the allele-specific maternal and paternal expression ES. (c) Average allelic expression of nuclei in Col × Cvi and Cvi × Col endosperm clusters for two example PEGs, indicated by black arrows in (a) and (b). Dotted blue line represents simulated expression from two paternal genomes. (d) Heatmap of total expression ES (left) and maternal (M) and paternal (P) allele-specific ES for S-phase (right). Row order same for all heatmaps. (e) Average allelic expression for three MEGs that show reduced maternal allele expression in S-phase (1–3) along with one MEG (4) that does not, indicated by black arrows in (d). CPM, counts per million.
Imprinted gene expression is regulated epigenetically, with DNA methylation and the PRC2 histone mark H3K27me3 playing important roles in regulating differential allelic expression (25–27). We examined the chromatin profile of PEGs in sperm using recently published data (28). Like unbiased genes, PEGs were enriched for H3K4me3 near the TSS, suggesting they are transcriptionally active in sperm (Extended Data Fig. 9). We did not identify any striking differences in sperm chromatin profiles between PEGs that were and were not chalazal-enriched that might explain their differing behavior after fertilization (Extended Data Fig. 9). Chalazal endosperm nuclei did, however, show differential expression of known epigenetic regulators (Extended Data Fig. 9). Genes with decreased expression in the chalazal nodule clusters were enriched for the GO term ‘regulation of genomic imprinting’ due in part to reduced expression of the PRC2 gene FIE, the DNA maintenance methyltransferase MET1, and the 5-methylcytosine DNA glycosylase gene DME (Extended Data Fig. 5, Extended Data Fig. 9, Supplementary Data 2). Other epigenetic regulators were upregulated, including those that were MEGs and PEGs (Extended Data Fig. 9), some of which were specific to the chalazal cyst, and others that were highly expressed in both nodule and cysts but not in other nuclei types (Extended Data Fig. 9). Some of these epigenetic regulators, such as MEA, are known to regulate other imprinted genes in endosperm (25, 26). Although the significance of these findings remain to be established experimentally, we speculate that these factors may be mediating an active parental conflict within the chalazal endosperm, perhaps by opposing or promoting elevated expression of PEGs. Alternatively, a chalazal endosperm-specific transcription factor could interact with differential maternal and paternal allele epigenetic states to specifically promote expression of the paternal allele of PEGs. Further research will be required to determine the molecular mechanism of chalazal endosperm-specific imprinting.
Our dataset also allowed us to examine MEG and PEG expression patterns as a function of the cell cycle, which has not been systematically assayed in either mammals or flowering plants. Expression of nearly half of the MEGs identified in our analysis decreased during S-phase (Fig. 3d, Fig. S16). This pattern was not observed for PEGs or for a set of 500 randomly selected, non-imprinted genes (Fig. S16). The lower S-phase expression of MEGs was associated with decreased maternal bias of MEGs, caused by reduced expression of the maternal allele (Fig. 3d,e; Fig. S16). During S-phase, chromatin states are disrupted and reassembled as DNA is replicated. These data suggest that MEG expression may be particularly sensitive to disruptions in epigenetic state that occur transiently during DNA replication.
We have shown that the endosperm of A. thaliana contains a previously undescribed diversity of transcriptionally distinct cell/nuclei types. One important conclusion from this work is that imprinting is dynamic across the cell cycle and/or heterogeneous between cell/nuclei types for a subset of imprinted genes. In particular, many PEGs are most strongly paternally biased in the chalazal endosperm region. This is especially noteworthy in light of the theory that imprinting evolved in flowering plants and mammals as an outcome of conflicts between parental genomes in asymmetrically related offspring over maternal resource transfer (29,30). The high expression of paternal alleles of PEGs in chalazal endosperm suggests that this conflict is strongest at the interface between maternal and filial tissues in developing seeds. Our study further suggests that fully understanding the regulatory mechanisms underlying imprinting will require cell/nuclei-type specific approaches. These efforts will aid understanding of epigenetic effects on seed development in other species, including crops.
Methods
Plant material and crossing
All Col-0, Ler, and Cvi-0 plants were grown in a growth chamber (16h light at 22°C and 120μm light, 8h at 20°C and 0μm light, 50% relative humidity). Plants were emasculated in the afternoon or evening, and pollinated in the morning two days later. FANS was performed in the morning to maximize consistency in seed stage across experiments. However, different crosses developed at different rates: the endosperm of the average Col × Cvi (CxV) F1 seed (female parent in cross is indicated first) had already begun to cellularize at 4 DAP, while Cvi × Col (VxC) F1 seeds were generally still in the proliferative phase at 4 DAP (Fig. 1e). Embryo developmental stage at 4 DAP was also more variable in CxV crosses, whereas most 4 DAP VxC seeds were at the heart stage (Extended Data Fig. 1). VxC seeds are larger than CxV seeds (Fig. 1e).
RNA in situ hybridizations
Controlled floral pollinations were performed for each cross; more than 10 cross pollinations were performed per cross type. Siliques were harvested 4 DAP and fixed in FAA overnight at 4°C. Following dehydration and clearing (HistoClear, National Diagnostics), samples were embedded in Paraplast Plus (McCormick Scientific) with vacuum infiltration, and sectioned at 8 μM (Leica RM 2065 rotary microtome). Ribbons were mounted with DEPC water on ProbeOn Plus slides (Fisher) at 42°C and dried overnight at 37°C. The previously published 602 bp PDF1 probe was used as a positive control (32). Experimental probes are listed in Supplementary Material. Probes were amplified from endosperm cDNA and cloned into TOPO pCR II or TOPO pCR 4 vectors (ThermoFisher). Plasmids containing sense and antisense oriented fragments were identified and linear templates were amplified using M13 forward and reverse primers for probe synthesis. Antisense and sense RNA probes were synthesized in vitro with digoxigenin-UTPs using T7 or SP6 polymerase (DIG RNA labeling kit, Roche/Sigma-Aldrich). Probes were then hydrolyzed to approximately 300 bp and dot blots were performed to estimate probe concentration. Pre-hybridization steps were preformed according to (33), except Pronase digestion occurred for 15 minutes at 37°C. Hybridization and post-hybridizations were performed according to (34), with minor modifications. For higher confidence in directly comparing expression patterns, slides corresponding to the cross and its reciprocal were processed face to face in the same pairs for hybridization, antibody, and detection steps. Negative controls consisted of hybridizing sense probes. Hybridization was performed overnight at 55°C, slides were then washed twice in 0.2X SSC for 60 mins each at 55°C, then twice in NTE for 5 min at 37°C and RNaseA treated for 20 min at 37°C, followed by two more 5 min NTE washes. Slides were incubated at room temperature for 1 hour with Anti-DIG antibody (Roche/Sigma Aldrich) diluted 1:1250 in buffer A and then washed four times for 20 min each at room temperature with buffer A and once for 5 min with detection buffer (34). Colorimetric detections were performed using NBT/BCIP Ready-To-Use Tablets (Roche/Sigma-Aldrich) dissolved in water or BM-Purple (Sigma-Alrdich) with Levamisole (Vector Laboratories). Slides were allowed to develop 16–46 hours before stopping color precipitation by washing briefly with 50% and then 100% ethanol (NBT/BCIP) or 50% and then 100% methanol (BM Purple). Slides were mounted in Permount (Electron Microscopy Sciences) and imaged using a Zeiss Axio Imager M2. Color and brightness/contrast adjustments and smart sharpen were applied to whole images, with particular attention to having even white-balance across different images (Adobe Photoshop).
Seed nuclei FANS
Because the endosperm is a syncytium or only partially cellularized at most of the timepoints used in this study, and because nuclei transcriptomes are well-correlated with whole-cell transcriptomes (35), we isolated nuclei instead of cells. For FANS, seeds were manually removed from siliques (~2 siliques per sample) into 50 μL Partec nuclei extraction buffer (Sysmex) + 6 μL SUPERase RNase inhibitor (20 U/μL). Samples were disrupted using a blue pestle in a microfuge tube before adding 400 μL Partec CyStain UV Precise P nuclei staining buffer and mixing by pipetting. Samples were filtered twice through a 30 μm nylon mesh (Partec CellTrics #04-004-2326, Sysmex). For samples sorted on 9/12/2018, 9/13/2018, 9/20/2018 and 9/26/2018, two additional wash steps were performed to potentially remove cell lysate from the sample (see Supplementary Data 1). For each wash, nuclei were spun down 5 min at 1000 g in a centrifuge pre-cooled to 4°C. Supernatant was then removed and nuclei were gently resuspended in 1 mL of a 1:8 mix of Partec nuclei extraction buffer and Partec nuclei staining buffer. Individual nuclei were sorted into wells of a 96-well PCR plate using a BD FACSAria II flow cytometer. A total of 22 full or partial plates (batches) of samples were prepared. Each plate included at least one negative control (no nucleus sorted into well) and one positive control (50 nuclei sorted into a single well) (Supplementary Data 1). Some plates also included wells with 2 nuclei sorted into each as controls for the precision of single-nuclei sorting. For most sorting experiments, a small number of seeds were separately cleared with a chloral hydrate buffer and imaged in order to determine developmental stage (Extended Data Fig. 1). Nuclei were sorted from both the putative 3C and 6C peaks based on DAPI fluorescence to enrich for endosperm nuclei (see Extended Data Fig. 1, Supplementary Data 1).
snRNA-seq library preparation and sequencing
FANS samples were prepared either 2, 3, 4 or 5 days after pollination (DAP). Libraries were prepared according the Smart-seq v2 protocol (10) with a few minor variations and at reduced volume. Briefly, nuclei were sorted into 1 μL lysis buffer (0.19% vol/vol Triton-X 100, 2U SUPERase RNase inhibitor, ERCC RNA spike-ins (ThermoFisher, see Supplementary Data 1). 1 μL poly-A hybridization mix (final conc. 2.5mM/ea. dNTPs + 2.5 μM oligo-dT primer) was added to each well and the plate was incubated at 72°C 3 min before returning to ice. 2.85 μL RT reaction mix (final concentration 1μM TSO, 1x Maxima RT buffer (Life Technologies), 1M betaine, 5 mM DTT, 6 mM MgCl2, 0.5 U SUPERase RNase-inhibitor, 2 U Maxima RT) was added and the plate was incubated in a Thermomixer C with ThermoTop (Eppendorf) (42°C, 2’ at 2,000 rpm; 42°C, 60’ at 1,500 rpm; 50°C, 30’ at 1,500 rpm; 60°C, 10’ at 1,500 rpm) or in a thermocycler (42°C 90’, 10 × [50°C 2’, 42°C 2’], 70°C 15’). After the RT reaction, 7.5 μL pre-amp PCR mix (final conc. 1x KAPA HiFi HotStart Readymix (Kapa Biosystems), 0.1 μM IS PCR primer) was added to each well, and plate was incubated in thermocycler: 3’ 98°C, [cycle #] × [98°C 20’’, 67°C 15’’, 72°C 6’], 72°C 5’. The number of pre-amplification cycles varied between 18–21, but had little effect on final library quality or complexity. Full-length cDNA was cleaned up using a 0.8x Ampure XP protocol (Beckman Coulter). Final libraries were built from successful cDNA preps using the Nextera XT kit (Illumina) with reduced volume (1/4 or 1/5 standard volumes). Positive control samples from the first part of the protocol were replaced with water (no DNA controls) before performing Nextera prep. Up to 384 libraries were multiplexed together and sequenced on an Illumina HiSeq 2000 using a 40 bp single-end protocol, or on an Illumina NextSeq using a 40×40 bp paired-end protocol. All libraries are listed in Supplementary Data 1.
Primer sequences were as follows:
oligo-dT: /5BiosG/AAGCAGTGGTATCAACGCAGAGTACTTTTTTTTTTTTTTTTTTTTTTTTTTTTTTVN
Template-switching oligo (TSO): /5Biosg/AAGCAGTGGTATCAACGCAGAGTACATrGrG+G
IS PCR primer: /5BiosG/AAGCAGTGGTATCAACGCAGAGT
snRNA-seq data processing
Reads were trimmed and quality-filtered using Trim Galore v.0.4.1 (36) and aligned using STAR v.2.7.1a (37). To minimize mapping bias in favor of the reference strain (Col), reads from Col-Cvi crosses were mapped to a Col-Cvi ‘metagenome’, consisting of the TAIR10 sequence appended to a Cvi ‘pseudogenome’ generated by substituting the Cvi allele at 576,697 Col-Cvi SNPs (20). Similarly, reads from Col-Ler crosses were mapped to a Col-Ler ‘metagenome’ created using 382,686 Ler SNPs. Sequences from ERCC RNA spike-ins (ThermoFisher) were appended to the metagenome. Reads mapping uniquely to the ERCC sequences were omitted from the rest of the analysis. Reads with a single best alignment to the Col-Cvi or Col-Ler metagenomes or with exactly two equal best alignments, each to equivalent positions on the Col and Cvi/Ler chromosomes, were considered uniquely mapping. Procedures and scripts for mapping with the metagenome are available in (38). Reads overlapping a SNP were identified explicitly using a custom script (assign_to_allele.py, 38) and assigned to parent-of-origin. All SNPs within a read had to agree on parent-of-origin for the read to be considered allele-specific. PCR duplicates were removed using MarkDuplicates from the Picard Toolkit (39). Total and allele-specific counts over genes were obtained using htseq-count v.0.9.1 (40) and the Araport11 gene annotations (excluding new Araport11 annotations antisense to existing TAIR10 genes) (41). Single-nuclei samples with a total of at least 1,500 genes detected (≥ 1 overlapping read) and 1,000 genes well-detected (≥ 5 overlapping reads) were considered high quality and kept for subsequent analyses. All negative controls (no nucleus sorted) lacked reads mapping to Arabidopsis (Fig. S1). Despite arising from nuclear RNA, few intronic reads were recovered, though somewhat more than for whole-cell bulk mRNA-seq (Fig. S2).
SC3 clustering and tissue assignment
Initial clustering of the full count matrix was performed using SC3 (11); a custom wrapper script used for these analyses (single_cell_cluster_SC3.R) is in the Github repository. Genes expressed in fewer than 5 nuclei or with fewer than 10 total reads across all nuclei were omitted from this analysis, with a final set of 22,950 genes used for clustering. Counts were converted to CPM using the calculateCPM() function in the R package scater (42) before clustering. Optimal number of clusters was estimated using SC3’s built-in algorithm. Benchmarking studies have found that SC3 tends to under-cluster (43); we therefore sometimes performed additional sub-clustering on clusters that clearly contained additional subgroups (Fig. 1, Extended Data Fig. 2, Extended Data Fig. 3, Fig. S7).
Initial tissue assignments were made based on both the overall % maternal reads detected for each nucleus (%mat), and a preliminary clustering using tSNE that strongly separated seed coat and endosperm nuclei. tSNE of all nuclei was performed on CPM values using the runTSNE() function in the scater package (42), and projected nuclei were clustered using k-means clustering with k = 3. One of these clusters clearly corresponded to seed coat nuclei based on %mat. Nuclei either in that cluster or with %mat > 85% were preliminarily assigned to seed coat, while those with %mat < 60% were preliminarily assigned to embryo, and all others were assigned to endosperm. Initial tissue assignments were refined based on the SC3 clusters, such that all nuclei in the same cluster were assigned to the tissue assignment of the majority of nuclei. Only 31 nuclei out of 1,437 (2.16%) had their tissue assignments adjusted based on the SC3 clustering results.
At earlier stages of seed development, seeds contain few endosperm-derived 3C and 6C nuclei relative to diploid-derived nuclei (predominantly seed coat), and 3C/6C nuclei become difficult to sort accurately, particularly for very young (2–3 DAP) seeds (Extended Data Fig. 1). The 3C population is also generally smaller than the 6C population at early timepoints (2–4 DAP), but becomes larger at later timepoints (5 DAP). Due to these factors, seed coat nuclei were obtained at varying rates, ranging from 0% to > 80% per batch/plate, with higher seed coat recovery at earlier timepoints and when sorting from the 3C peak compared to the 6C peak (Extended Data Fig. 1).
After nuclei were assigned to specific tissues, SC3 was used to cluster nuclei from 4 DAP CxV and VxC F1 endosperm and seed coat separately (Fig. 1b, Extended Data Fig. 3). For CxV endosperm, the 42 nuclei in the last cluster (cluster 10) were re-clustered using SC3 to further resolve cell types. After comparing the results to the whole-dataset SC3 clustering (Extended Data Fig. 2), we further separated one of these clusters into clusters 12 and 13 manually, based on the fact that these were in two separate clusters in the full SC3 clustering and likely failed to be separated here due to the smaller number of nuclei. For VxC endosperm, initial clustering produced 8 clusters, A-H. Cluster C (n = 30) was re-clustered into clusters 3 and 4, while clusters F-H (n = 208) were not well-resolved and were also re-clustered into clusters 7–11. For CxV seed coat, SC3 produced 6 clusters and no additional sub-clustering was performed. For VxC seed coat, the last cluster in the initial clustering was further subclustered into two clusters.
Identifying differentially expressed genes
Genes differentially expressed between clusters were identified using DESingle, which performs well with small numbers of cells (44,45). See Supplementary Material.
Calculating expression enrichment scores and p-values for gene expression enrichment/depletion in particular clusters or across other factors
Gene expression enrichment scores (ES), which reflect the degree to which a gene’s expression is enriched/depleted in a specific cluster relative to other clusters, were calculated using a custom script (cluster_gene_expression.R) available in the Github repository. This script uses permutation tests to estimate the degree to which a gene is specifically up/downregulated in a cluster, and to calculate a p-value for the significance of this enrichment in each cluster. Briefly, log2(CPM) values for each gene in each nucleus were averaged across all nuclei in each cluster. Cluster labels were then randomly permuted 1000 times (controlling for various factors, see below), and average log2(CPM) values were calculated using the shuffled cluster labels for each permutation, yielding a background distribution of 1000 values for each gene+cluster combination. Where applicable, we controlled for tissue type (endosperm vs. seed coat), genotype (CxV vs. VxC), and wash (yes/no indicating if nucleus was washed during prep) by only permuting cluster labels among nuclei with the same tissue/genotype/wash. The mean and standard deviation of the n = 1000 permuted values was used to calculate a pseudo-Z-score, called the ‘enrichment score’, reflecting the degree to which the true observed value x for any given gene,cluster combination is extreme relative to the random distribution estimated by permuting the cluster labels:
where μB and σB are the mean and standard deviation of the n = 1000 shuffled values, respectively. ‘Enrichment score’ matrices were clustered using either k-means clustering (Fig. S4) or hierarchical clustering (Fig. 3a,d). The analysis proceeded similarly for calculating enrichment scores over cell cycle phases, with cell cycle phase taking the place of clusters. Similarly, enrichment scores and p-values over tissue/genotype/wash, where applicable, were also calculated by permuting the labels for tissue/genotype/wash across the different samples, and estimating pseudo-Z-scores and p-values as above. For example, to calculate ESs for genotype, which only has two values (CxV or VxC), CxV and VxC labels for all nuclei are shuffled 1000x, and average values calculated for both categories each time. The degree to which average expression across the ‘true’ CxV labels deviates from the 1000 randomly obtained values (represented as a z-score) is the ES. Because some of these variables have only two categories (e.g. CxV or VxC) and the number of nuclei in each category is often similar, the resulting ES scores tend to be symmetric around zero.
This analysis was performed using either total expression (e.g. Fig. 3a, Fig. S4) or allelic expression (e.g. Fig. 3b). For allelic expression, the analysis described above was carried out over the maternal and paternal expression data separately (cluster_gene_expression.R --method separate), and the difference between the maternal and paternal enrichment scores was plotted as a heatmap (Fig. 3b).
To estimate the probability that a gene’s expression was enriched or depleted in a particular cluster, a p-value equal to the fraction of times (out of 1000 permutations) that the observed value x was greater than the shuffled mean was also calculated. If this value was less than 0.025, a gene was considered significantly depleted in that cluster; if greater than 0.975, the gene was considered significantly enriched in that cluster.
GO term analysis
The R package ‘topGO’ was used to identify GO terms significantly enriched among certain groups of DE genes (46). Briefly, GO annotations were obtained from plants_mart at plants.ensembl.org using the ‘biomaRt’ package (47). Gene lists of interest were analyzed using the topGO runTest function, with algorithm = ‘elim’ and statistic = ‘fisher’. The background set of genes (gene universe) was the set of 29428 genes with detectable expression in the full dataset. For each gene list, all significant GO terms (< 0.005) were obtained (Supplementary Data 2). The list of all genes associated with each GO-term was obtained using the topGO genesInTerm() function. For plots showing average expression enrichment scores for GO term-associated genes (Extended Data Fig. 4, Extended Data Fig. 5), enrichment scores for all gene associated with each GO-term were averaged together. A script for performing this analysis, run_topGO.R, is in the Github repository.
Cell cycle analysis
To evaluate the positioning of our single-nuclei samples relative to the cell cycle, we performed a modified ‘trajectory analysis’ using a custom R script (single_cell_trajectory_analysis.R), available in the Github repository. See Supplementary Material.
Identifying imprinted genes from snRNA-seq data
Assessing imprinting using snRNA-seq data is complicated by several factors, including dropouts (genes not detected in a cell due to low input & technical factors) and transcriptional bursting kinetics, which can cause transcription at a locus to appear monoallelic at the moment of cell/nucleus capture even if a gene is biallelically expressed (48–50). As a result, imprinting must be assessed by aggregating information from multiple single nuclei across the dataset. Additionally, in most angiosperms including Arabidopsis, endosperm has a maternal:paternal (m:p) genome dosage of 2m:1p rather than 1m:1p. mRNAs from the two maternal alleles are indistinguishable, and thus cannot be modeled independently or directly compared to paternal expression, as in existing methods for assessing biased allelic expression from scRNA-seq (51,52). We therefore developed a method for assessing imprinting that accounts for maternal and paternal dosage in endosperm (single_cell_ASE_analysis.R, in github repository). See Supplementary Material.
Data availability:
All sequencing data generated in this study have been deposited to the NCBI Gene Expression Omnibus with accession number GSE157145.
Code availability:
Scripts used in analysis have been deposited to Github at https://github.com/clp90/endosperm_snRNAseq_2021.
Extended Data
Extended Data Fig. 1.
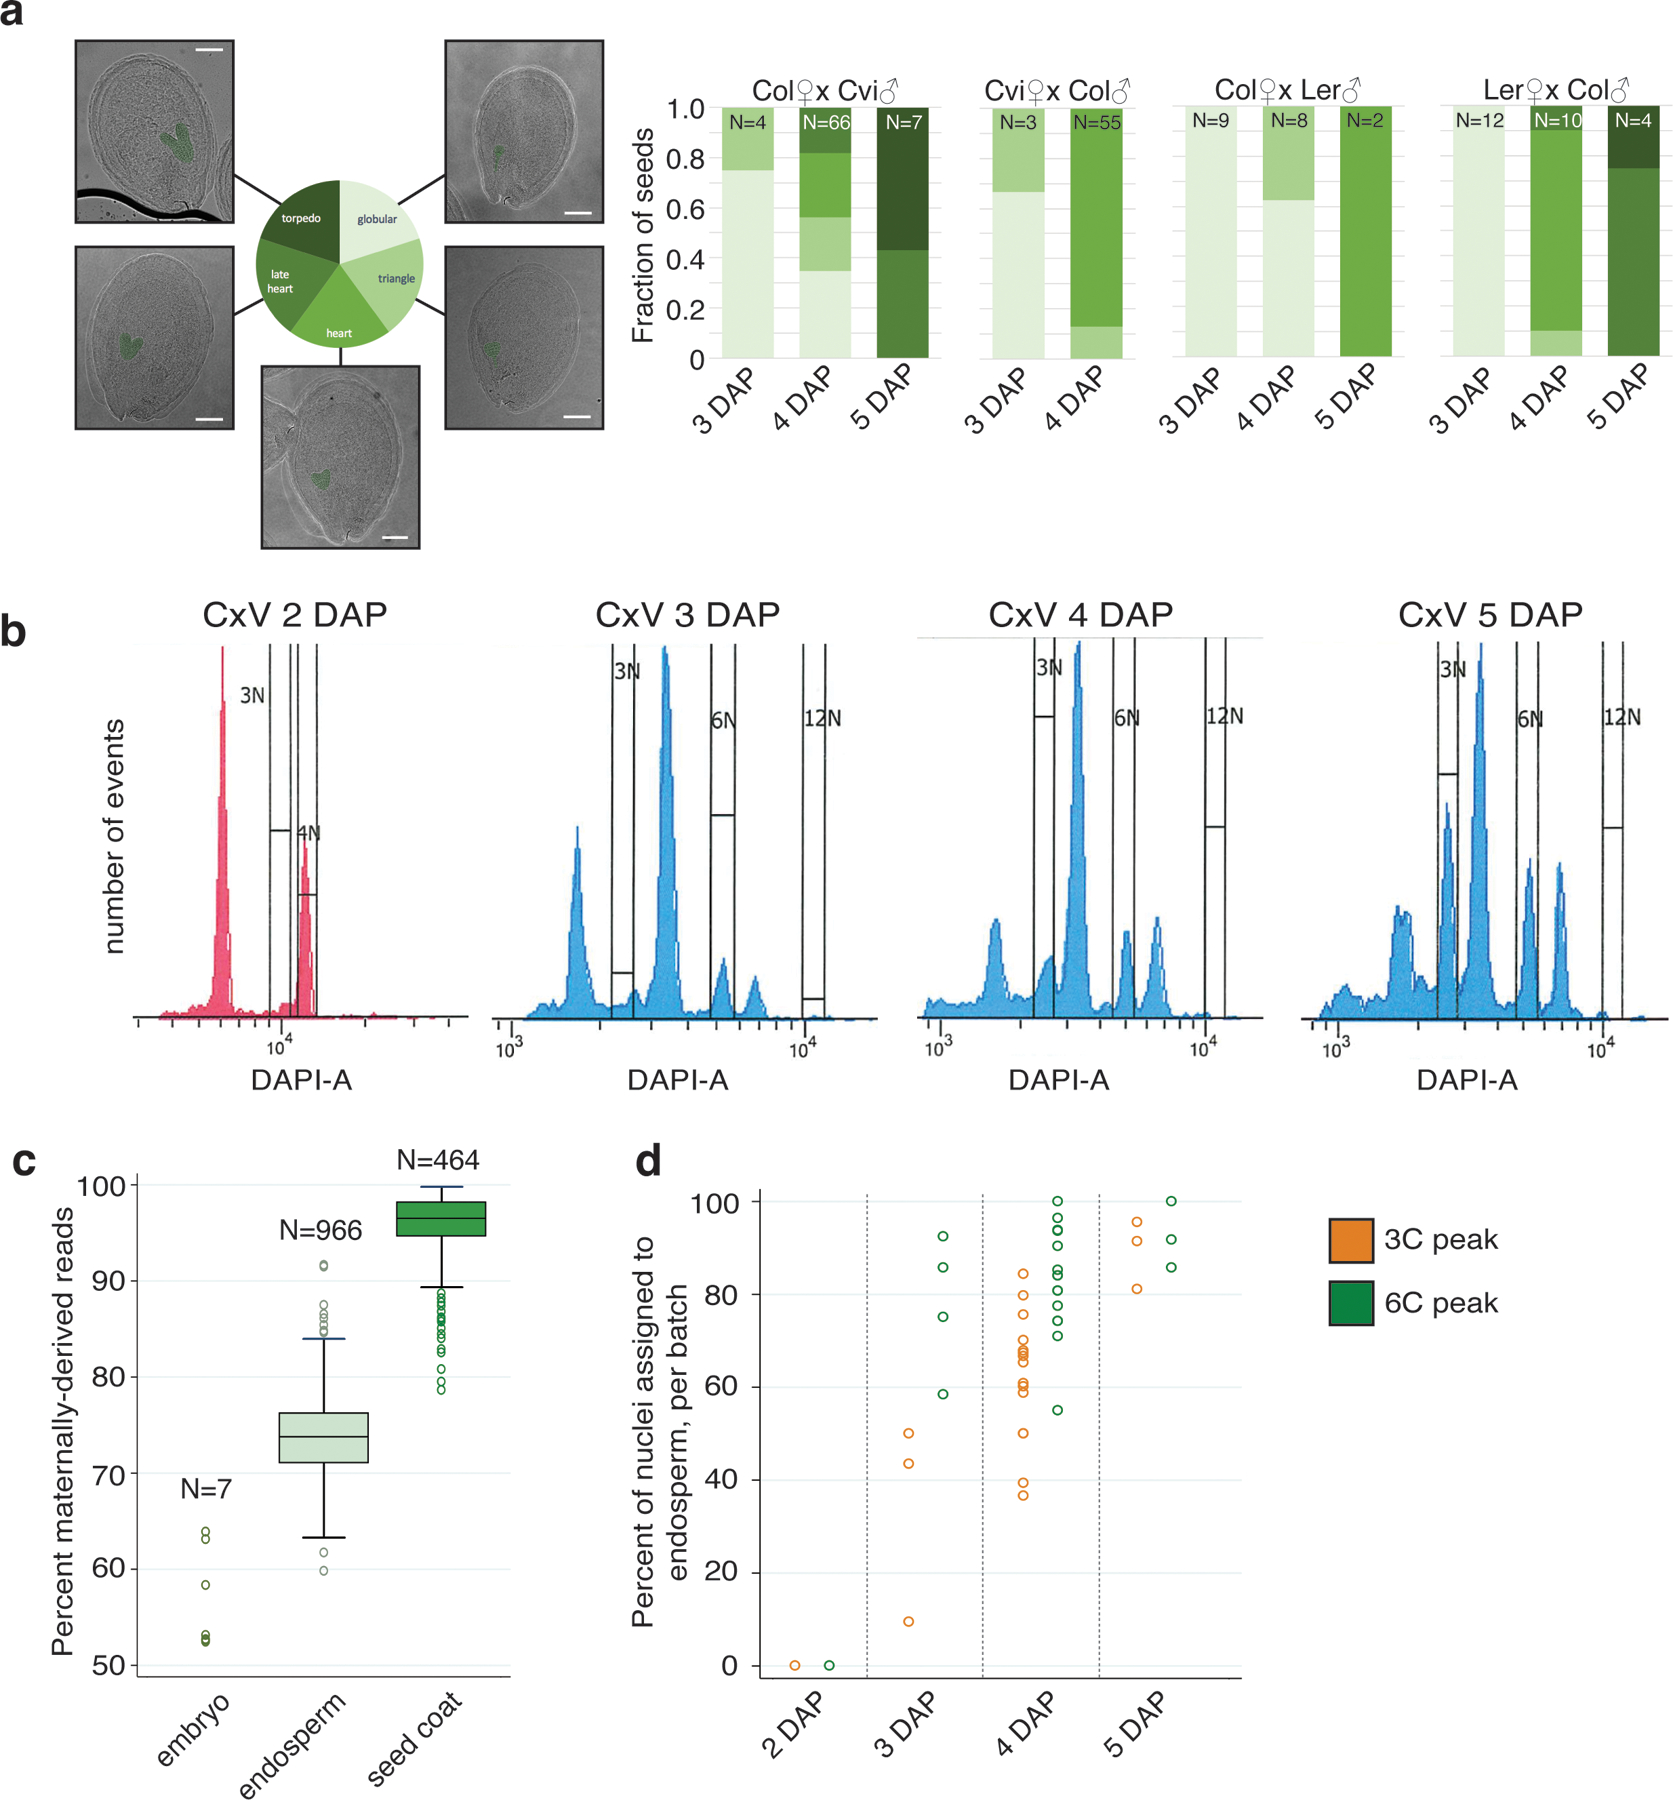
Seed developmental stages assayed, FANS profiles, and impact on endosperm enrichment.
(a) Summary of seed developmental stages in the different genotypes and timepoints assayed. Number of seeds imaged for each bar shown at top. Scale bar 100 μm. (b) FANS sorting profiles of Col × Cvi (CxV) seeds at 2 DAP (sorted 09/26/17), 3 DAP (08/10/17), 4 DAP (11/16/17) and 5 DAP (11/14/17). The 2 DAP sample was processed on a different FACS machine than the other three samples. (c) Percent of allelic reads that were derived from the maternally inherited allele, for nuclei assigned as embryo, endosperm, and seed coat (see methods). Median, interquartile range and upper-/lower-adjacent values (1.5*IQR) indicated by center line, box, and whiskers of each boxplot, respectively. (d) Percent of nuclei per batch (96-well plate) assigned to endosperm. Nuclei from later timepoints, as well as from the 6C peak, are more likely to correspond to endosperm than nuclei from earlier timepoints or from the 3C peak.
Extended Data Fig. 2.
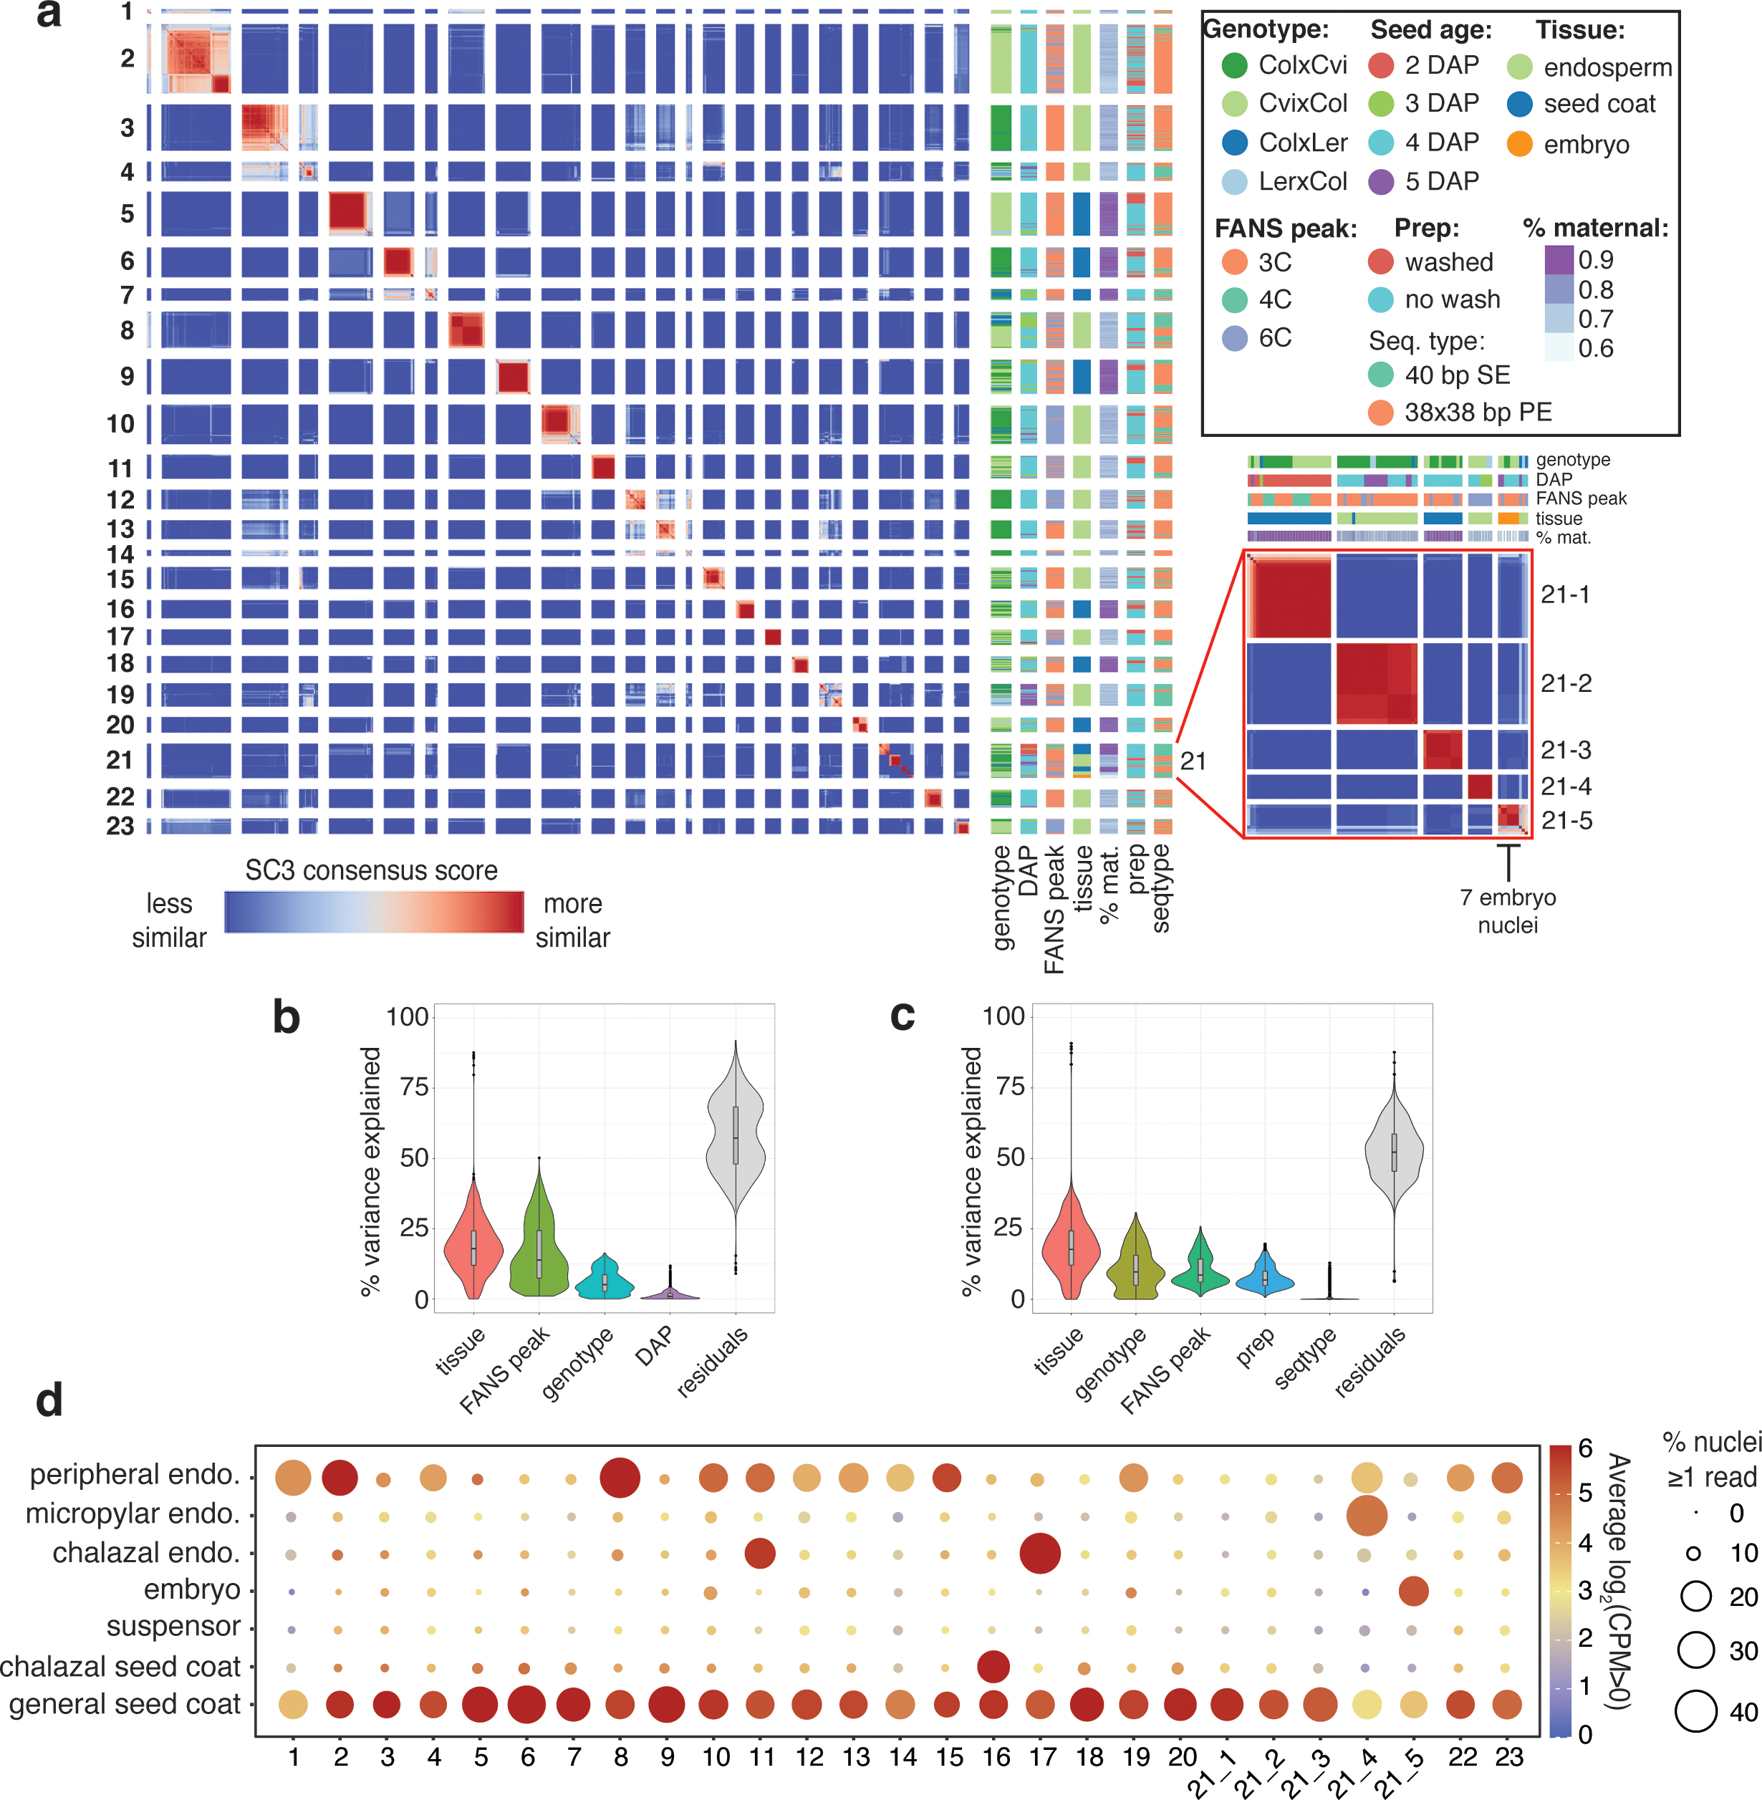
Clustering of all 1437 high-quality nuclei in the dataset.
(a) Heatmap of SC3 clustering of all 1437 nuclei. Genotype, FANS peak, prep method (see ‘Seed nuclei FANS’), sequencing type, % maternal (percent of allelic reads derived from maternal allele), and seed age also shown. (b) Partitioning of the variance in CPM values for the 22,950 expressed genes in the dataset over the 1437 nuclei samples, according to tissue, peak, genotype and DAP, using the R package ‘variancePartition’ (53). Median, interquartile range and upper-/lower-adjacent values (1.5*IQR) indicated by center line, box, and whiskers within each violin plot. (c) Same as (b), over the 1096 Col × Cvi and Cvi × Col 4 DAP samples only. In this group, prep and sequencing type are less confounded with sources of biological variation (e.g. all washed samples are either Col × Cvi or Cvi × Col 4 DAP, so prep is confounded with genotype and DAP in the full dataset), so their contribution to the variation could be more reliably estimated. (d) Average expression of marker genes for various seed compartments (globular and heart stage) (9,31) for nuclei in each cluster. Size indicates the average percent of nuclei with > 0 counts, color indicates average log2(CPM) for all nuclei with CPM > 0.
Extended Data Fig. 3.
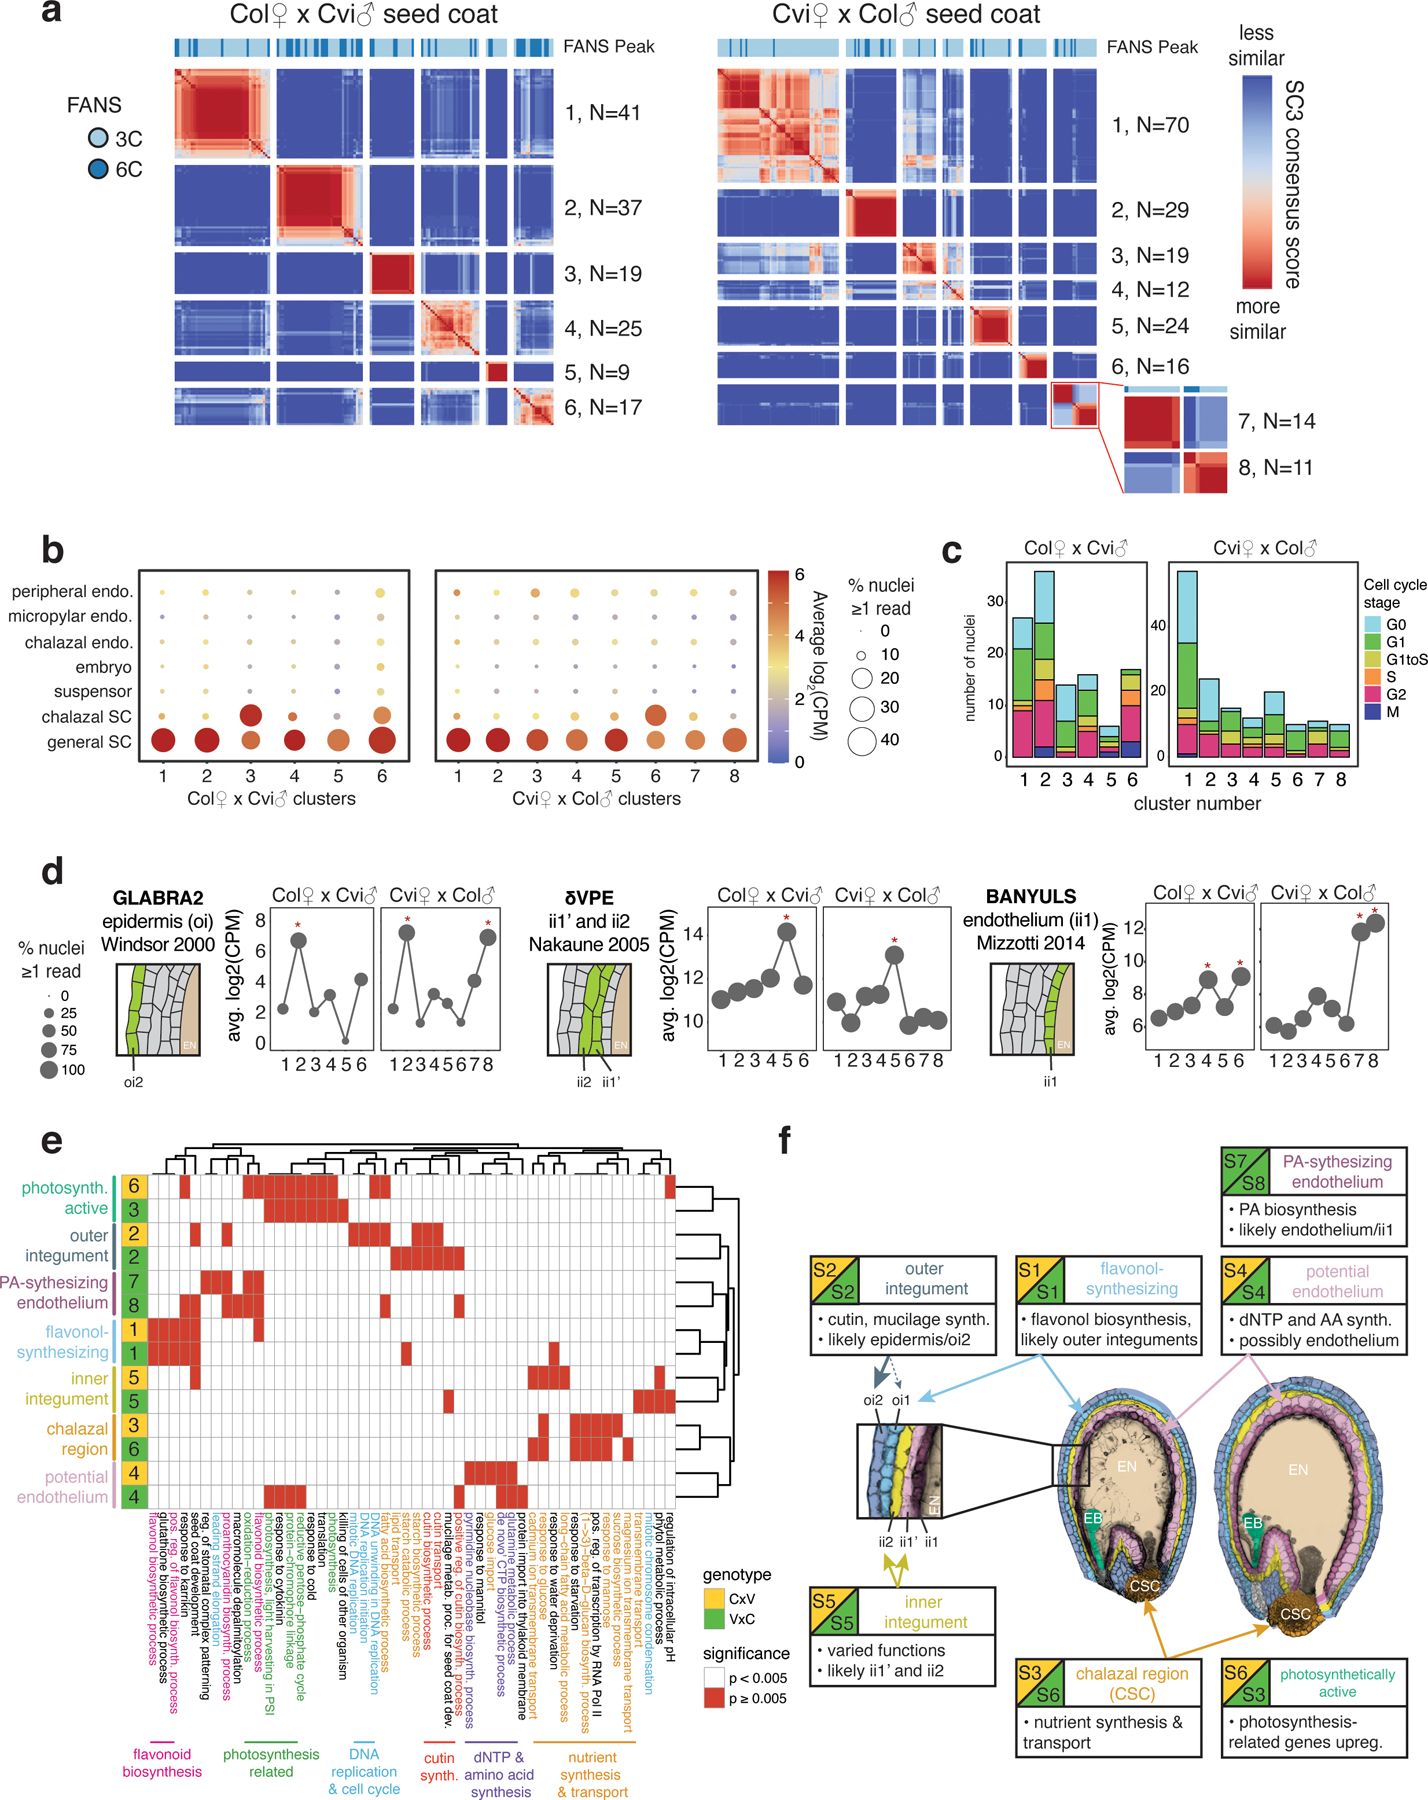
Characterization of seed coat nuclei.
(a) SC3 clustering of 4 DAP seed coat nuclei. (b) Average expression of LCM seed tissue markers (9, 31), over seed coat clusters. Dot color: average log2(CPM); dot size: average percent nuclei with CPM > 0. (c) Cell cycle phase by cluster. (d) Average expression of genes specific to particular seed coat cell layers (54–56) across nuclei clusters. Schematic of seed coat cell layers, from ii1 (the endothelium, innermost) to oi2 (epidermis, outermost); layers where expression was observed in indicated study highlighted green. Red star: significantly higher expression in cluster (permutation test, p < 0.05). (e) Top 5 GO terms for significantly upregulated genes in each cluster. (f) Cluster identities and characteristics; false-colored Col × Cvi (left) and Cvi × Col (right) seed images. EB = embryo, EN = endosperm, CSC = chalazal seed coat. Inset: the five seed coat cell layers.
Extended Data Fig. 4.
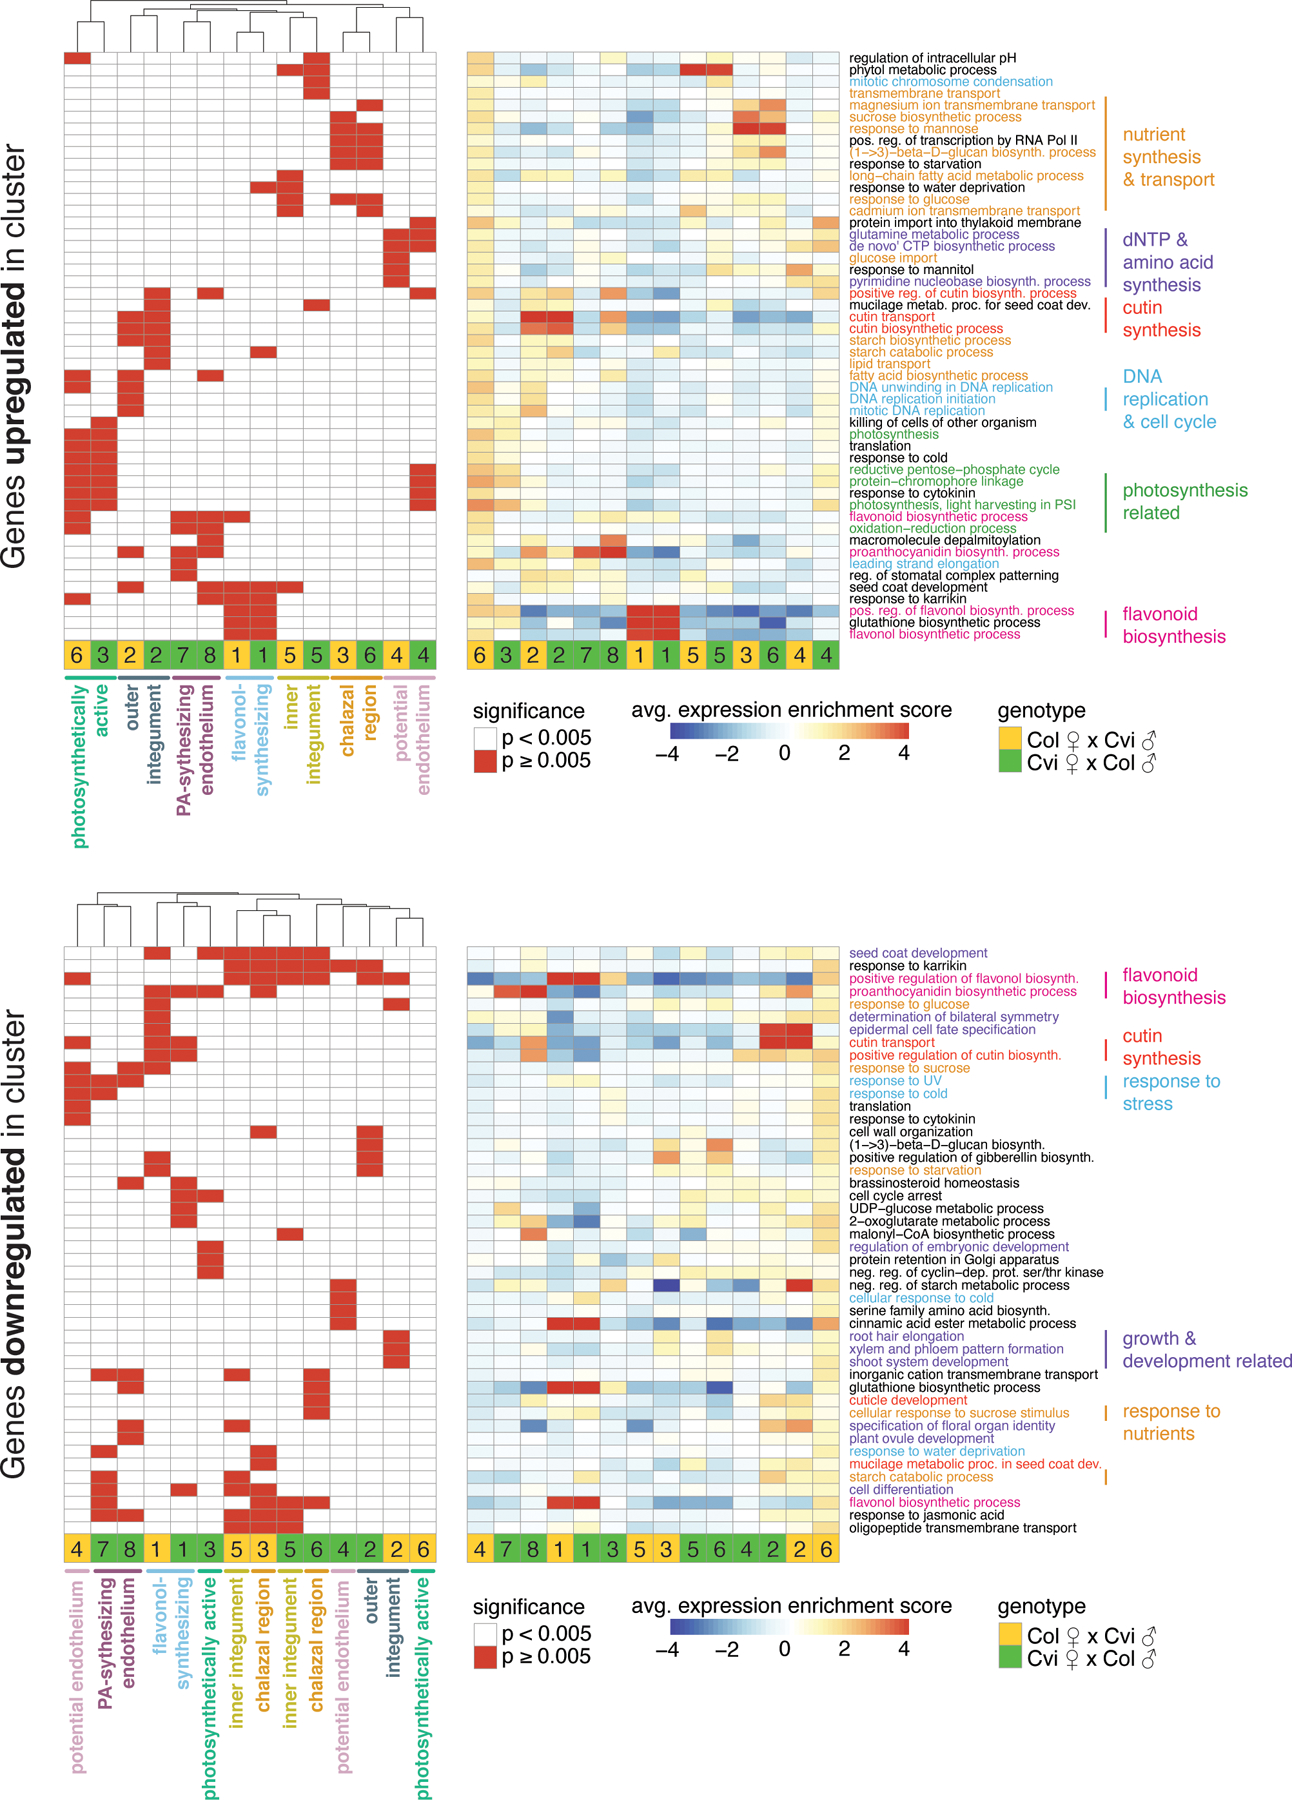
Heatmaps of the 5 most significantly enriched GO terms among genes upregulated (top) and downregulated (bottom) in each seed coat cluster.
Significant terms are flagged in left heatmap, while average expression ‘enrichment score’ across all genes associated with GO term is shown at right. Average includes any genes associated with the GO-term that are not significantly up/downregulated in the indicated cluster, so average may not reflect expectations. Full lists of significant GO-terms, and specific lists of genes in each significant GO-term that are up/downregulated in cluster, are in Supplementary Data 2. Order of rows and columns same for left and right heatmaps.
Extended Data Fig. 5.
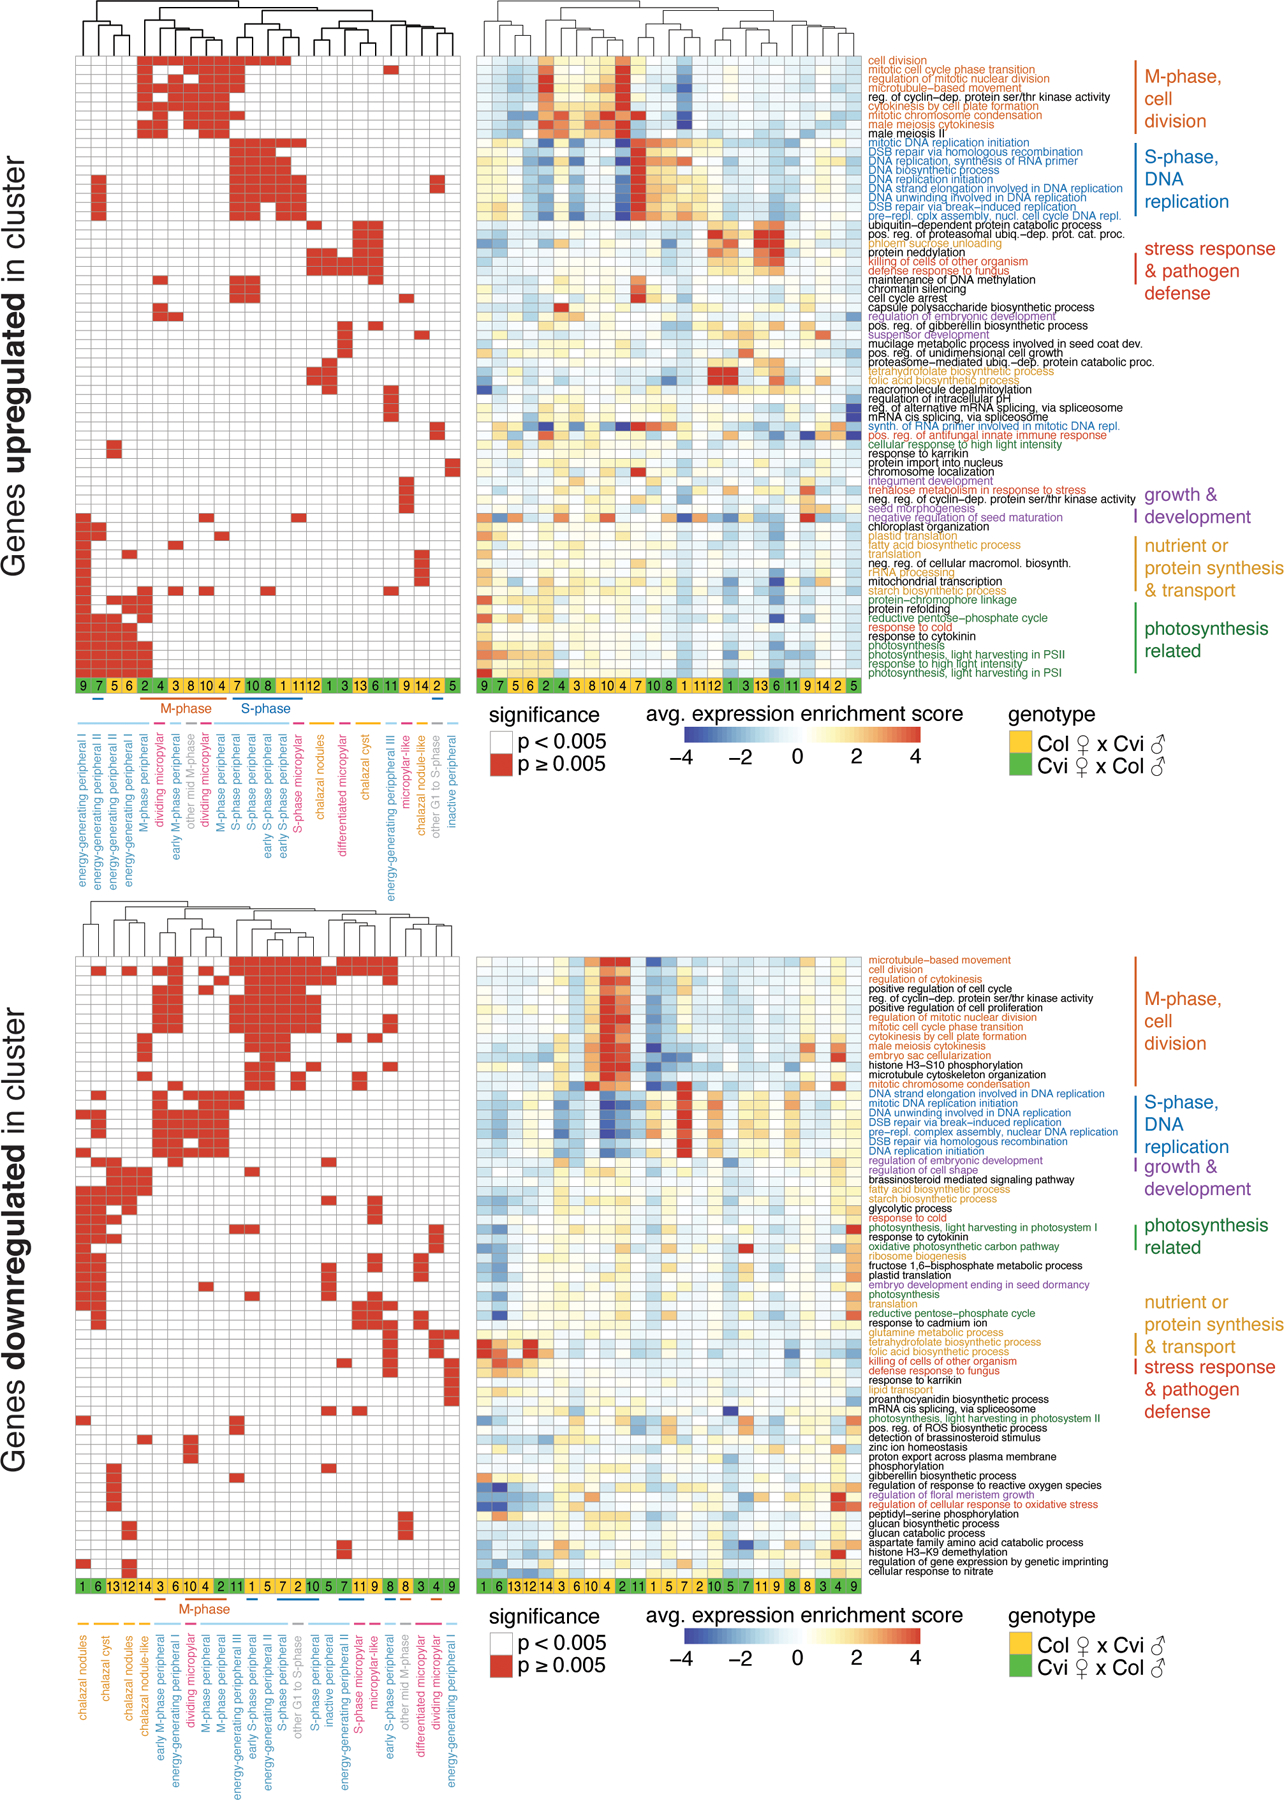
Heatmaps of the 5 most significantly enriched GO terms among genes upregulated (top) and downregulated (bottom) in each endosperm cluster.
Significant terms, p < 0.005, are flagged in left heatmap, while average expression ‘enrichment score’ across all genes associated with GO term is shown at right. Average includes any genes associated with the GO-term that are not significantly up/downregulated in the indicated cluster; so average may not reflect expectations. Full lists of significant GO-terms, and specific lists of genes in each significant GO-term that are up/downregulated in cluster, are in Supplementary Data 2. Order of rows/columns same for left and right heatmaps.
Extended Data Fig. 6.
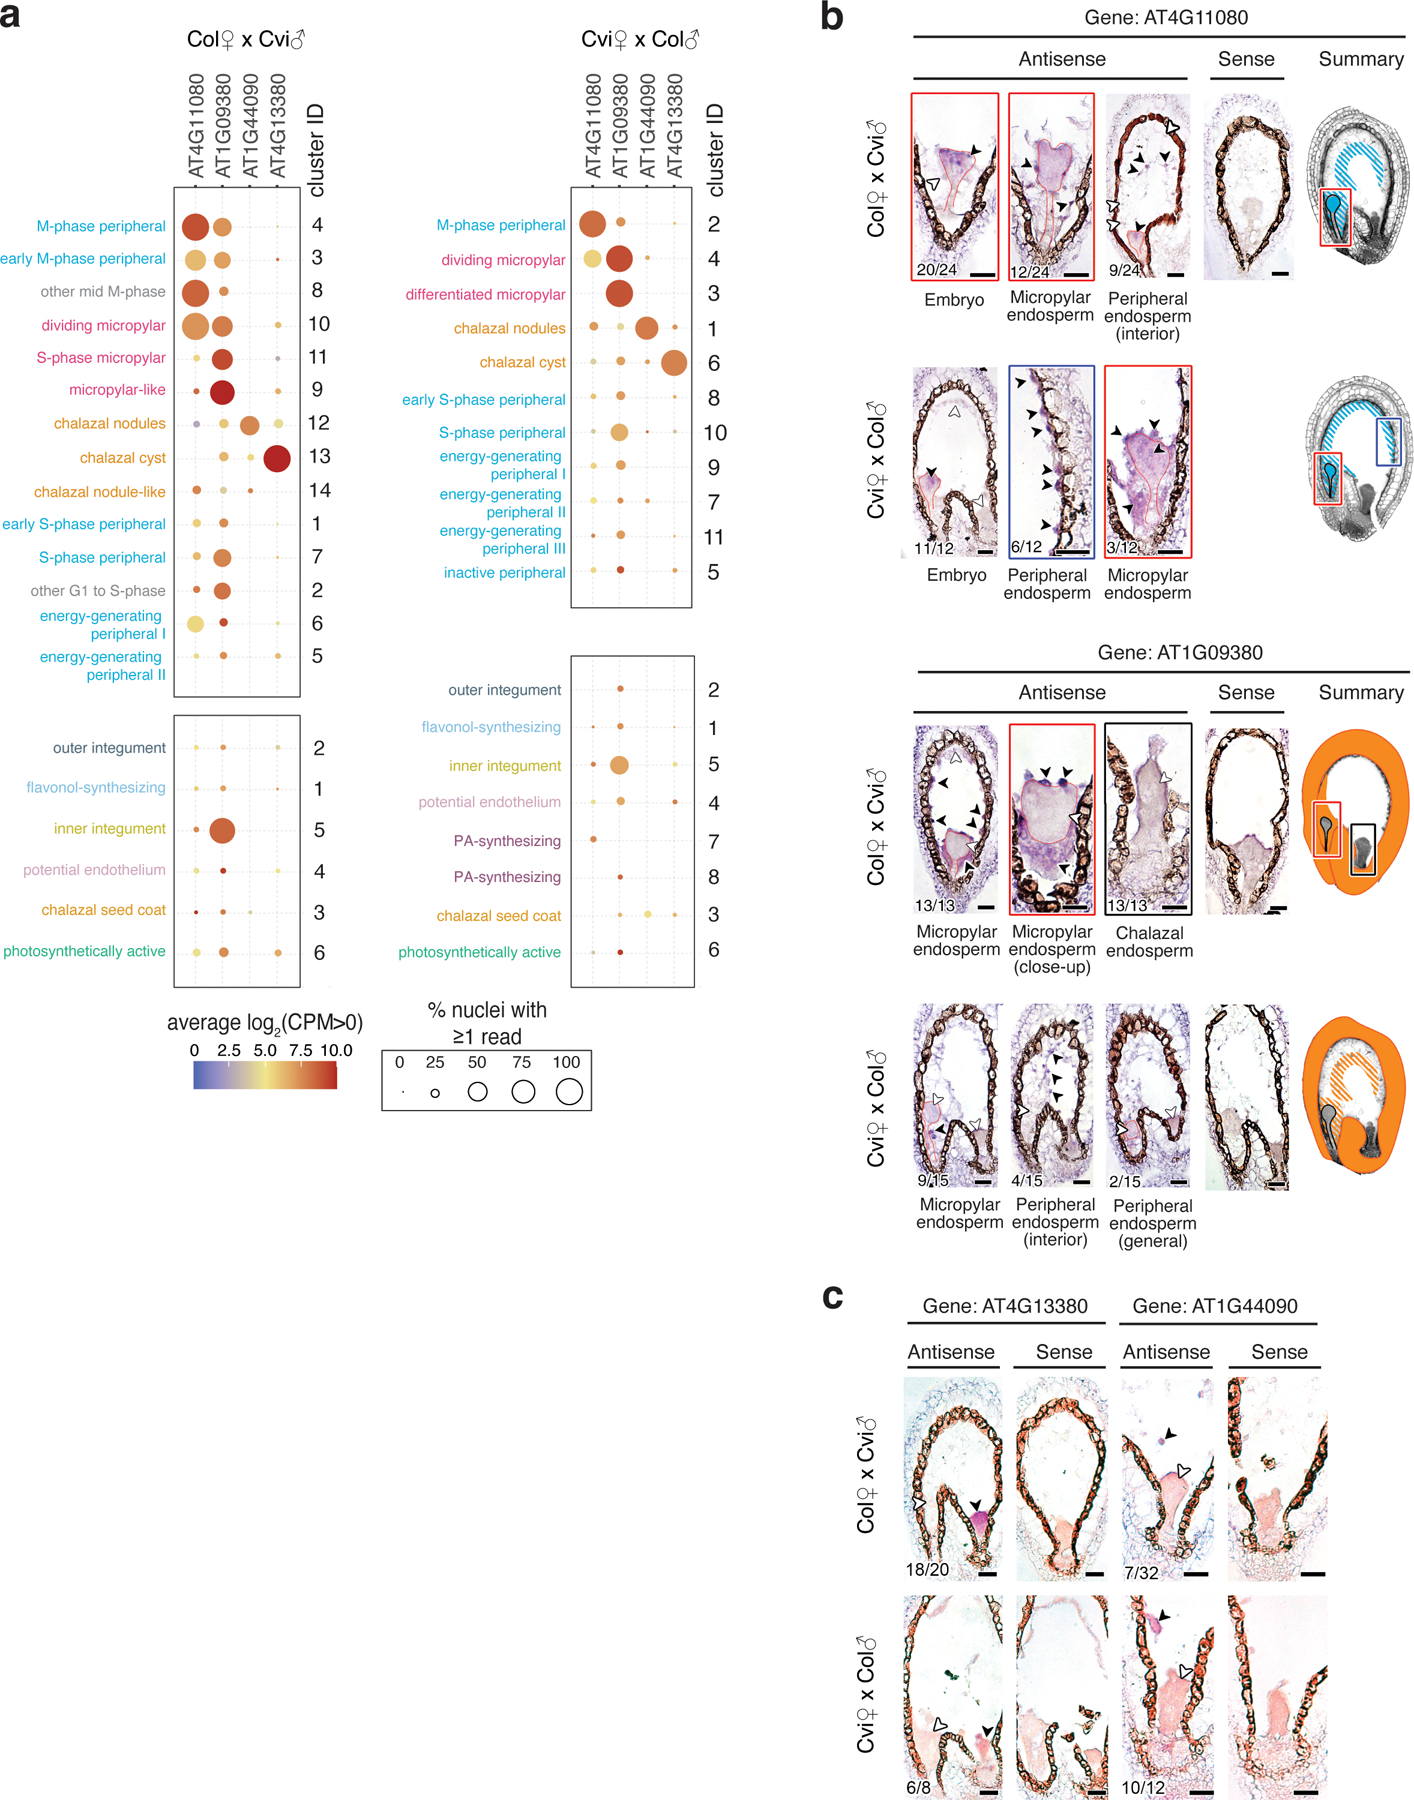
In situ hybridization analysis for additional cluster-specific transcripts.
(a) Expression data for four additional marker genes used for RNA in situ hybridization experiments, across endosperm and seed coat clusters. (b) In situ hybridization (purple signal) results for two micropylar/peripheral clusters. AT4G11080 is most notably expressed in peripheral and micropylar endosperm and in the embryo. AT1G09380 is most notably expressed in the micropylar endosperm and seed coat. In gene summaries, expression indicated by hatched pattern indicates inconsistent expression in that zone among seeds. (c) In situ hybridization results for two additional chalazal endosperm transcripts not shown in Fig. 2: AT4G13380 is predominantly expressed in the chalazal cyst, while AT1G44090 is predominantly expressed in the chalazal nodules. (b-c) Black arrowheads indicate sites of transcript accumulation; white arrowheads indicate examples of sites without transcripts. Number of seeds with expression in specific zones relative to the number of seeds examined is shown in bottom left of panels; expression in one zone does not exclude expression in other zones. Seeds were from three independent controlled pollination events, collected together. For all antisense probes, in situ experiment was performed at least twice, except for AT4G11080, which was performed once. Both sense and antisense probe images shown. Scale bars = 25 μm.
Extended Data Fig. 7.
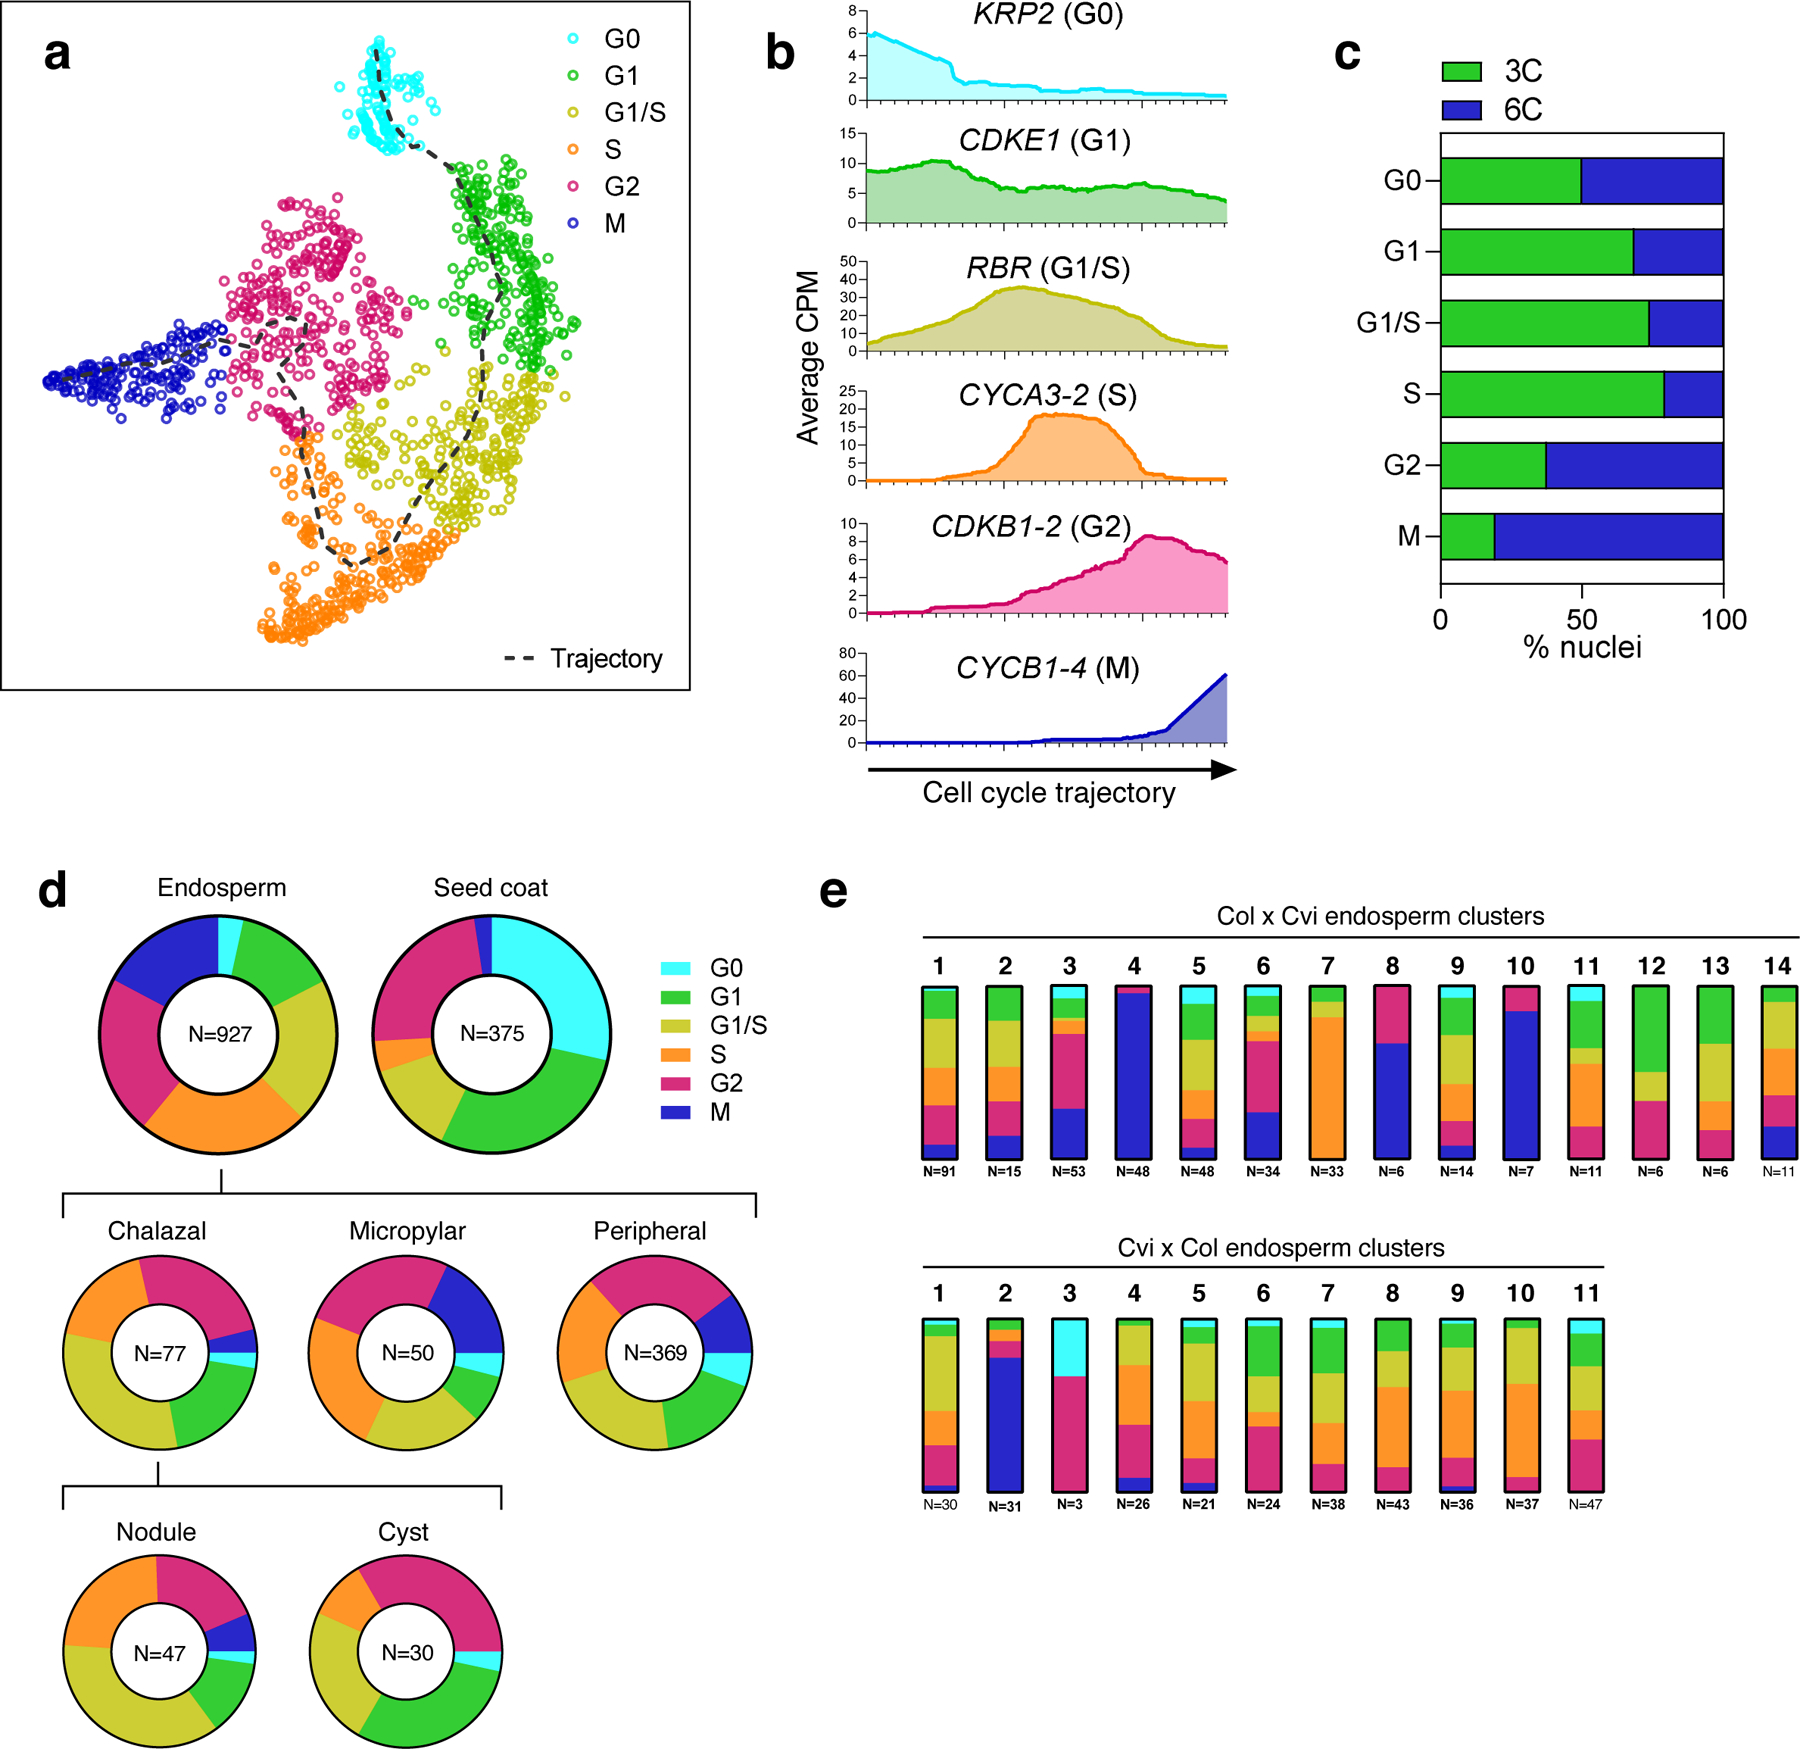
Cell cycle is a source of variability among endosperm clusters.
(a) t-SNE projection and trajectory analysis of 1,309 nuclei in the dataset, based on expression of a manually curated list of 22 cell cycle-dependent marker genes. Dotted line represents cell cycle trajectory from G0 -> G1 -> S -> G2 -> M. (b) Average expression of six of the 22 marker genes used in analysis shown in (a), with nuclei ordered according to their linear projection onto the cell cycle trajectory, starting from G0 (left) to M (right). Moving averages were calculated using a sliding window of 200 data points. (c) Percent of nuclei in each phase of the cell cycle that were sorted from the 3C or 6C FANS peak (d) Distribution of nuclei among cell cycle phases in seed coat and endosperm. Endosperm data are further divided into peripheral, micropylar, and chalazal; the chalazal region is also divided into the cyst and nodules. (e) Distribution of nuclei among cell cycle phases for each of the endosperm clusters.
Extended Data Fig. 8.
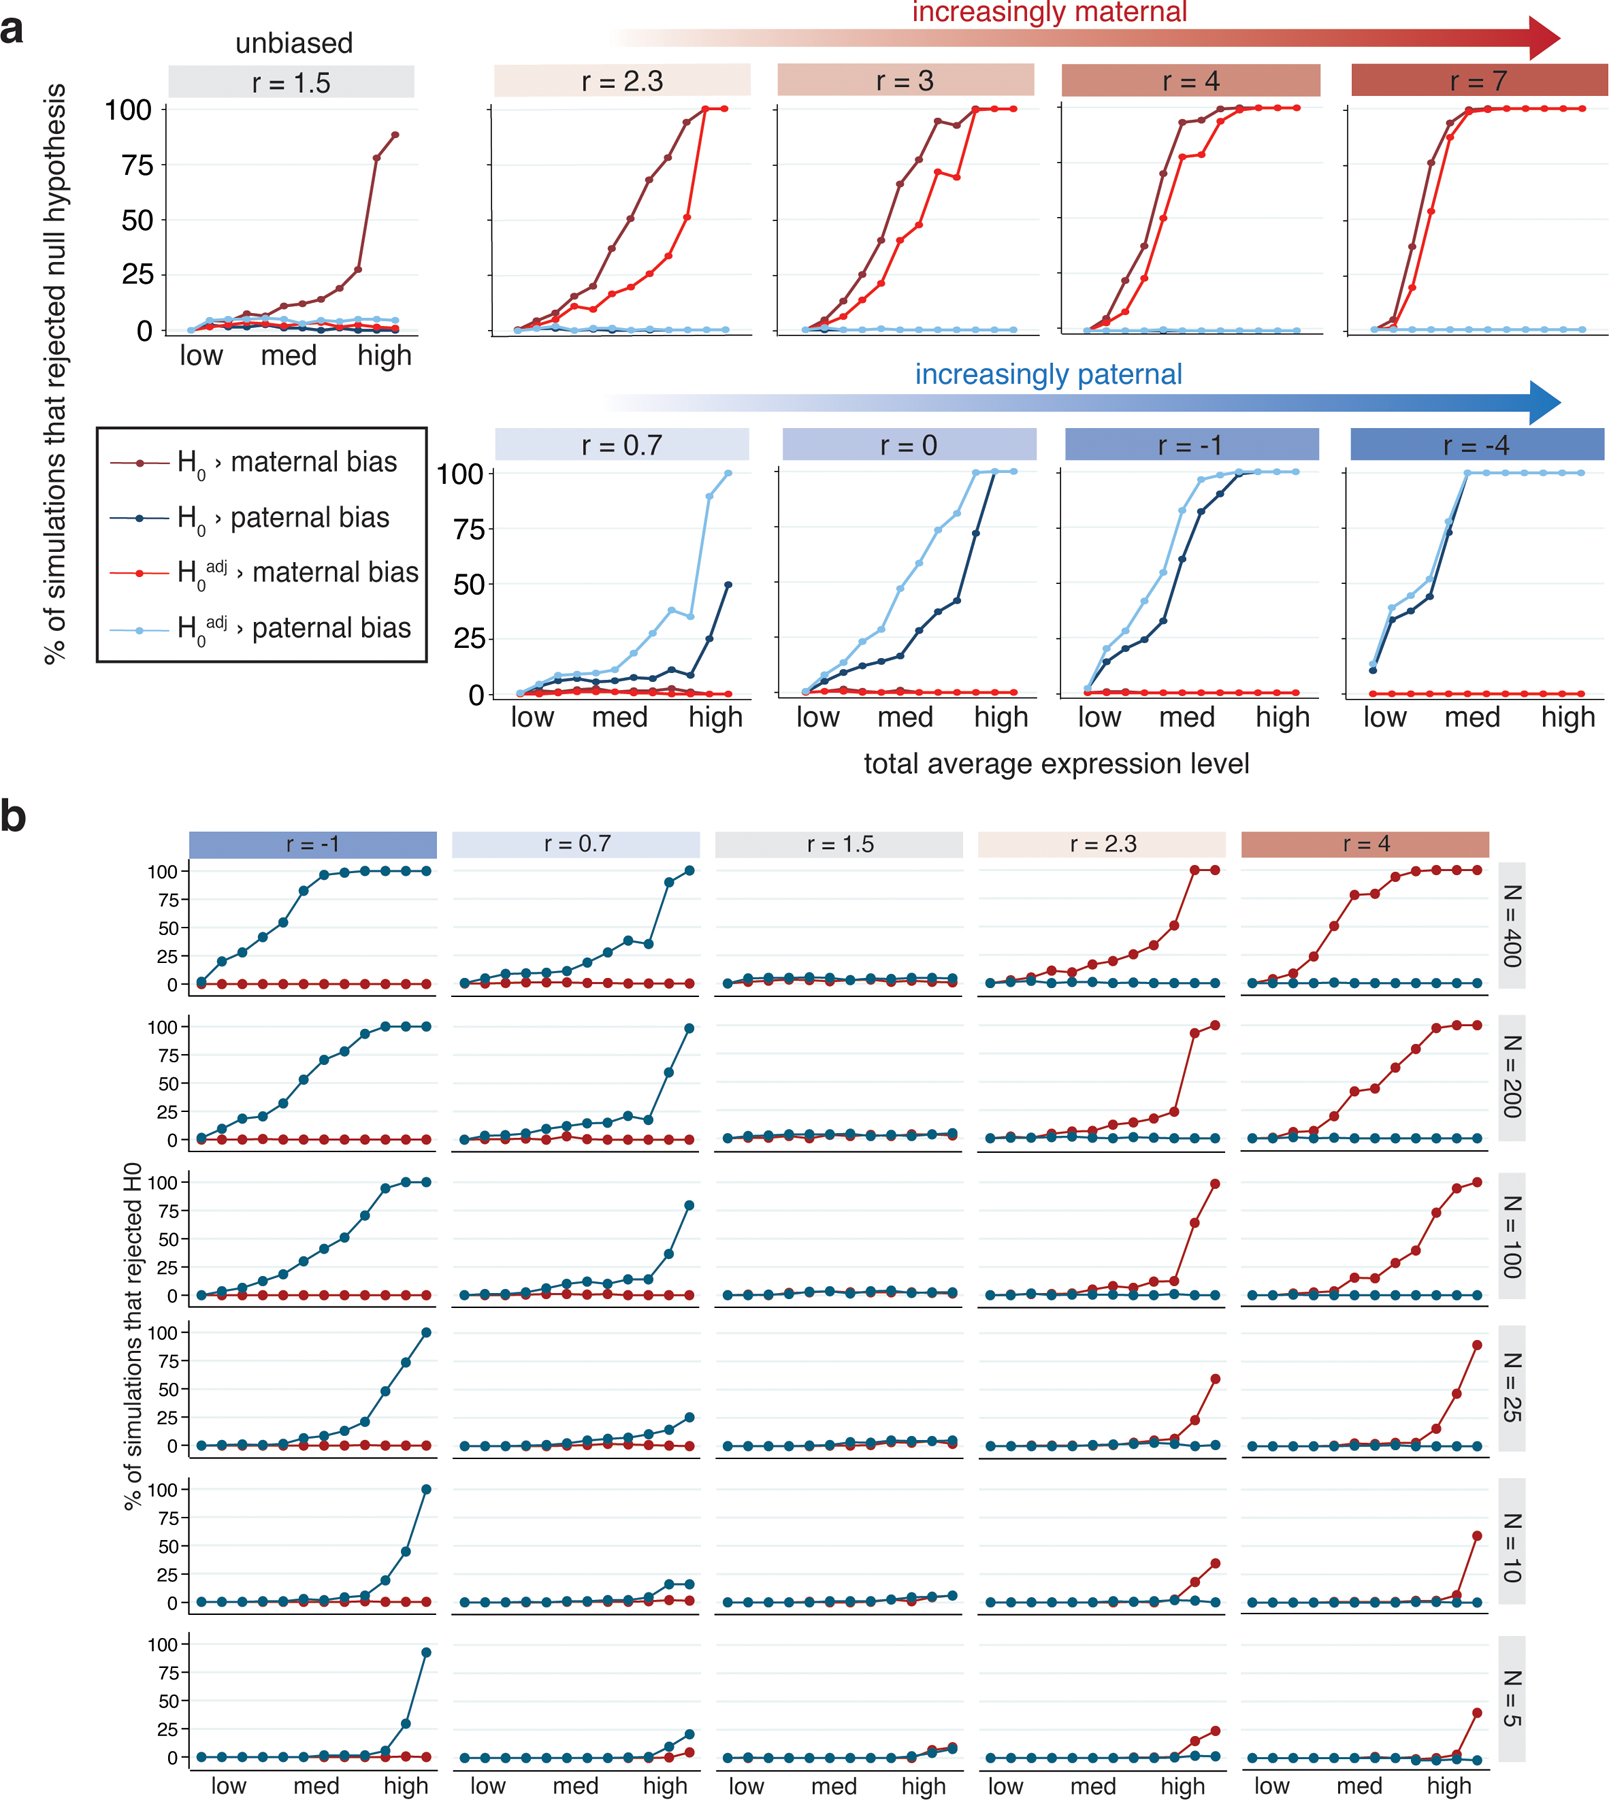
Statistical power and accuracy of imprinting model under various simulated conditions.
(a) Percent of simulations (out of 200) where the null hypothesis of no parental bias was rejected, for simulations with varied total expression and log2(m/p) ratio (r). Simulations mimicked degree of maternal skew in the Col × Cvi data, so ‘unbiased’ simulations had r = 1.5. Twelve values of total expression were tested: 0.01, 0.05, 0.1, 0.15, 0.25, 0.5, 0.75, 1.0, 1.5, 3.5, 15, and 50. The 1st, 25th, 50th, 75th and 99th percentiles for total expression in the Col × Cvi dataset are 0.033, 0.21, 0.58, 1.57 and 15.4, respectively. Blue lines indicate paternal bias, red indicate maternal bias. (b) Effect of number of observations (nuclei) in simulations on power to reject H0adj. Highly expressed and highly biased genes can be detected even with as few as 5 observations. Blue lines indicate tests for paternal bias, red indicate tests for maternal bias.
Extended Data Fig. 9.
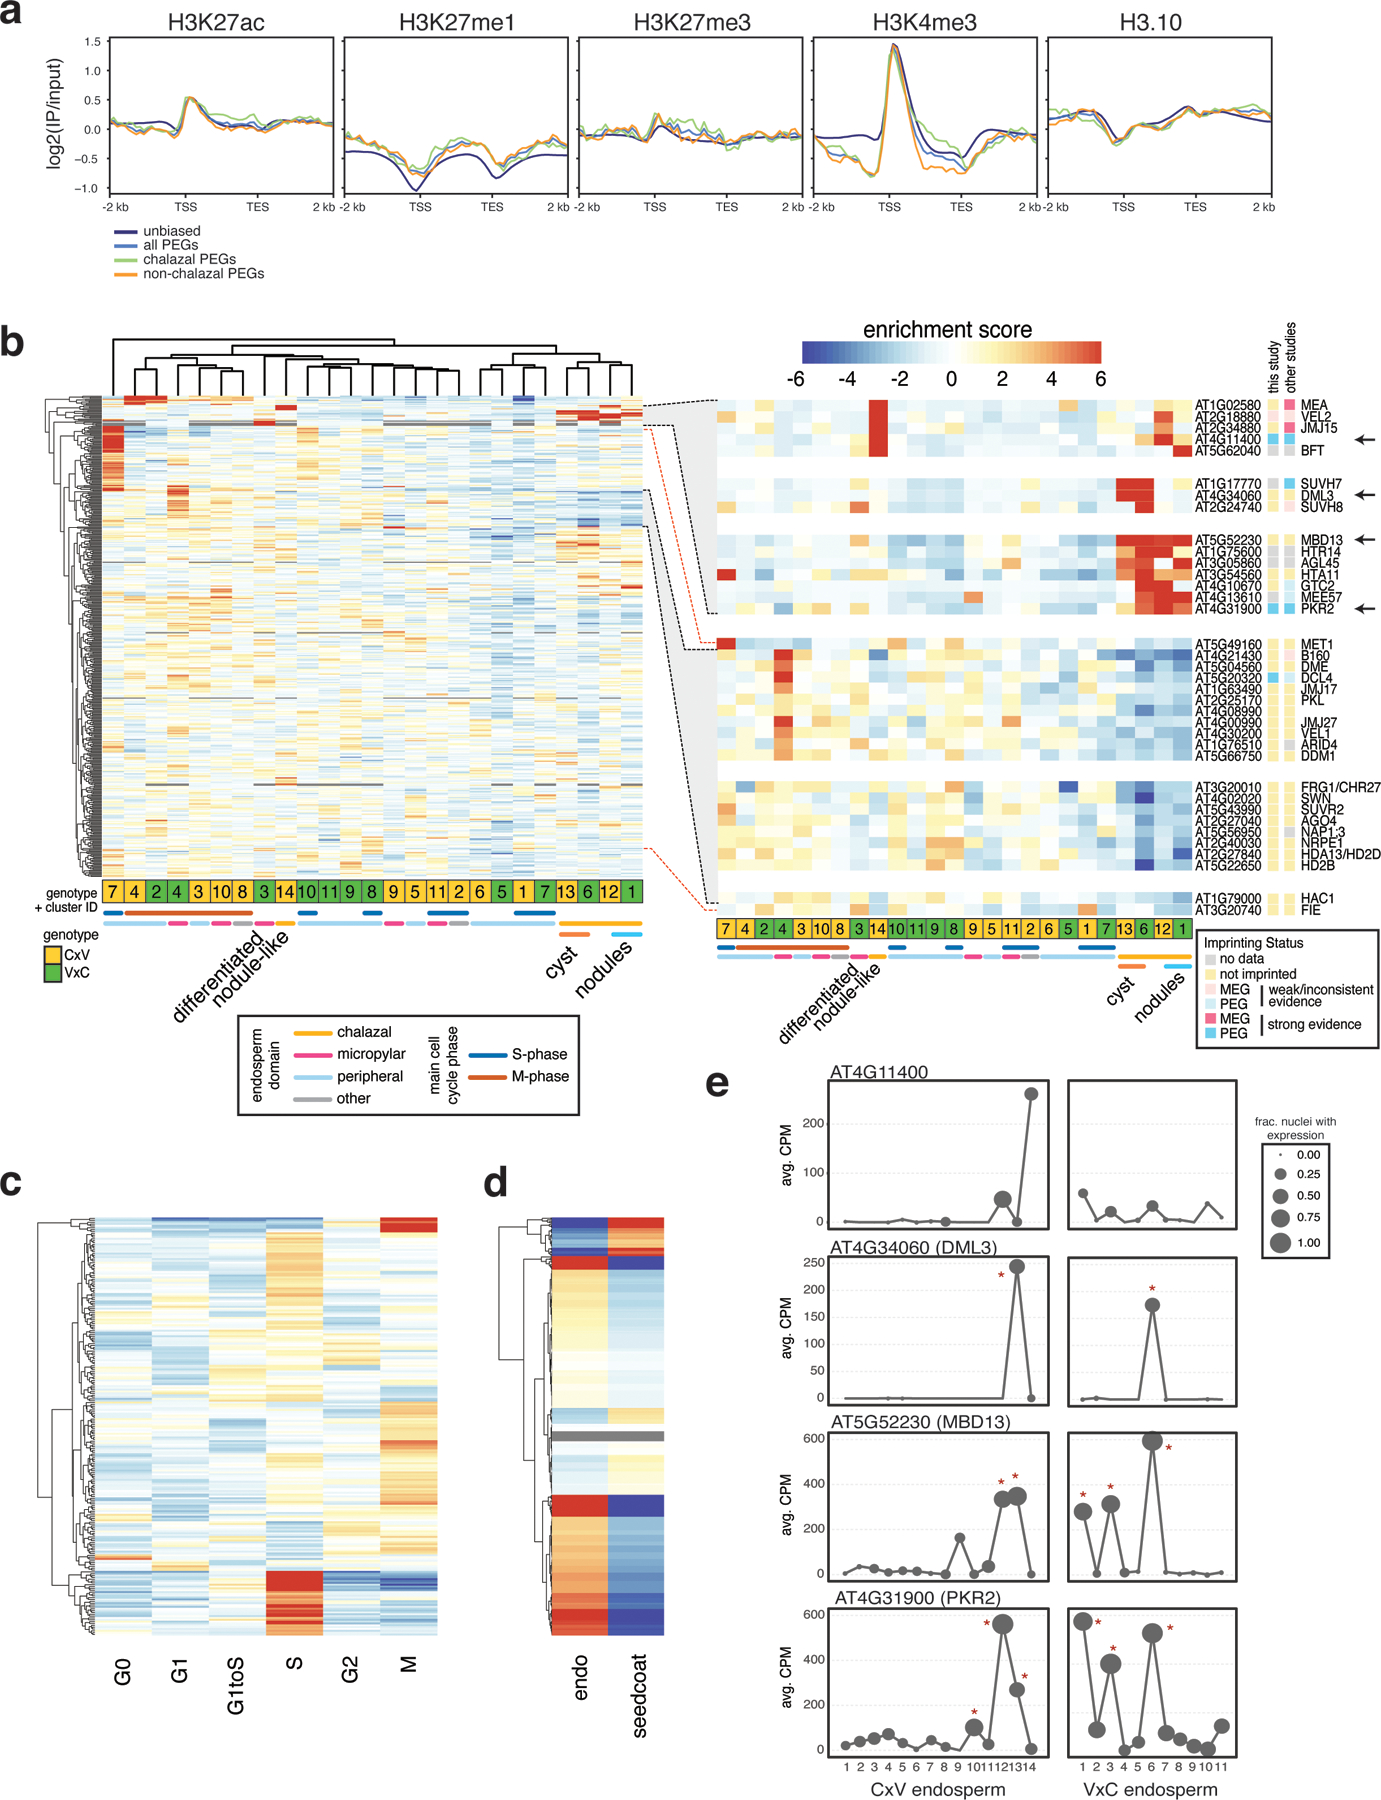
Expression of chromatin-related genes.
(a) Sperm ChIP-seq profiles from (28) over non-imprinted genes, all PEGs, chalazal PEGs and non-chalazal PEGs. (b) Heatmap of expression enrichment scores (ES) across endosperm nuclei clusters, for 464 chromatin-related genes with variable expression across the clusters. Inset: subset of genes enriched in chalazal nodules, cyst, or both (top); subset of genes with depleted expression in chalazal endosperm, grouped by expression pattern (bottom). Not all genes in highlighted region in left plot shown. (c) Heatmap of expression ES for the full 4 DAP endosperm + seed coat dataset, over cell cycle phases. 227 chromatin-related genes with variation across cell cycle shown. Color bar same as (b). (d) Expression ES in endosperm vs. seed coat for 553 chromatin-related genes. Color bar same as (b). (e) Average expression profiles across the endosperm clusters for four genes shown in (b) (see arrows). Stars indicate clusters with significantly enriched expression based on a permutation test. CPM = counts per million.
Supplementary Material
Acknowledgements:
We thank the MIT BioMicro Center and the Whitehead Institute Genome Technology Core and Flow Cytometry Core Facility for research assistance, and Francine Lafontaine for valuable input on statistical methods. This research was funded by NIH R01 GM112851 and NSF MCB 1453459 grants to M.G.; NSF Graduate Research Fellowship and Abraham Siegel Fellowship to C.L.P., and NSF IOS 1812116 to R.A.P.
Footnotes
Competing interests declaration:
The authors declare no competing financial or non-financial interests.
Supplementary Material is available for this paper.
Main References:
- 1.Li J & Berger F Endosperm: food for humankind and fodder for scientific discoveries. New Phytol 195, 290–305 (2012). [DOI] [PubMed] [Google Scholar]
- 2.Gehring M & Satyaki PR Endosperm and imprinting, inextricably linked. Plant Physiol 173, 143–154 (2017). [DOI] [PMC free article] [PubMed] [Google Scholar]
- 3.Costa LM, Gutièrrez-Marcos JF, Dickinson HG More than a yolk: the short life and complex times of the plant endosperm. Trends Plant Sci 9, 507–514 (2004). [DOI] [PubMed] [Google Scholar]
- 4.Nguyen H, Brown RC, Lemmon BE The specialized chalazal endosperm in Arabidopsis thaliana and Lepidium verginicum (Brassicaceae). Protoplasma 212, 99–110 (2000). [Google Scholar]
- 5.Mansfield SG, Briarty LG Development of the free-nuclear endosperm in Arabidopsis thaliana. Arabidopsis Information Service 27 (1990). [Google Scholar]
- 6.Brown RC, Lemmon BE, Nguyen H, Olsen O-A Development of endosperm in Arabidopsis thaliana. Sex. Plant Reprod 12, 32–42 (1999). [Google Scholar]
- 7.Brown RC, Lemmon BE, Nguyen H Events during the first four rounds of mitosis establish three developmental domains in the syncytial endosperm of Arabidopsis thaliana. Protoplasma 222, 167–174 (2003). [DOI] [PubMed] [Google Scholar]
- 8.Boisnard-Lorig C, et al. Dynamic analyses of the expression of the HISTONE::YFP fusion protein in Arabidopsis show that syncytial endosperm is divided in mitotic domains. Plant Cell 13, 495–509 (2001). [DOI] [PMC free article] [PubMed] [Google Scholar]
- 9.Belmonte MF, et al. Comprehensive developmental profiles of gene activity in regions and subregions of the Arabidopsis seed. Proc. Natl. Acad. Sci. USA 110, E435–E444 (2013). [DOI] [PMC free article] [PubMed] [Google Scholar]
- 10.Picelli S et al. Smart-seq2 for sensitive full-length transcriptome profiling in single cells. Nat. Methods 10, 1096–1098 (2013). [DOI] [PubMed] [Google Scholar]
- 11.Kiselev VY, et al. SC3: consensus clustering of single-cell RNA-seq data. Nat. Methods 14, 483–486 (2017). [DOI] [PMC free article] [PubMed] [Google Scholar]
- 12.Radchuk V & Borisjuk L, Physical, metabolic and developmental functions of the seed coat. Front. Plant Sci 5, 510 (2014). [DOI] [PMC free article] [PubMed] [Google Scholar]
- 13.Kiyosue T, et al. Control of fertilization-independent endosperm development by the MEDEA polycomb gene in Arabidopsis. Proc. Natl Acad. Sci. USA 96: 4186–4191 (1999). [DOI] [PMC free article] [PubMed] [Google Scholar]
- 14.Olsen O, Nuclear endosperm development in cereals and Arabidopsis thaliana. Plant Cell 16, S214–S227 (2004). [DOI] [PMC free article] [PubMed] [Google Scholar]
- 15.Baroux C, Fransz P, Grossniklaus U Nuclear fusions contribute to polyploidization of the gigantic nuclei in the chalazal endosperm of Arabidopsis. Planta 220, 38–46 (2004). [DOI] [PubMed] [Google Scholar]
- 16.Alvarez-Buylla ER, et al. MADS-box gene evolution beyond flowers: expression in pollen, endosperm, guard cells, roots and trichomes. Plant J 24, 457–466 (2000). [DOI] [PubMed] [Google Scholar]
- 17.Sørensen MB, Chaudhury AM, Robert H, Bancharel E, Berger F Polycomb group genes control pattern formation in plant seed. Curr. Biol 11, 277–281 (2001). [DOI] [PubMed] [Google Scholar]
- 18.Gorelova V, Ambach L, Rébeillé F, Stove C, Van Der Straeten D Folates in plants: research advances and progress in crop biofortification. Front. Chem 5, 21 (2017). [DOI] [PMC free article] [PubMed] [Google Scholar]
- 19.Waters AJ, et al. Comprehensive analysis of imprinted genes in maize reveals allelic variation for imprinting and limited conservation with other species. Proc Natl Acad Sci U S A 110, 19639–19644 (2013). [DOI] [PMC free article] [PubMed] [Google Scholar]
- 20.Pignatta D, et al. Natural epigenetic polymorphisms lead to intraspecific variation in Arabidopsis gene imprinting. Elife 3, e03198 (2014). [DOI] [PMC free article] [PubMed] [Google Scholar]
- 21.Klosinska M, Picard CL, Gehring M Conserved imprinting associated with unique epigenetic signatures in the Arabidopsis genus. Nat. Plants 2, 16145 (2016). [DOI] [PMC free article] [PubMed] [Google Scholar]
- 22.Hatorangan MR, Laenen B, Steige KA, Slotte T, Köhler C Rapid evolution of genomic imprinting in two species of the Brassicaceae. Plant Cell 28, 1815–1827 (2016). [DOI] [PMC free article] [PubMed] [Google Scholar]
- 23.Florez-Rueda AM, et al. Genomic imprinting in the endosperm is systematically perturbed in abortive hybrid tomato seeds. Mol Biol Evol 33, 2935–2946 (2016). [DOI] [PMC free article] [PubMed] [Google Scholar]
- 24.Liu J, et al. Genome-wide screening and analysis of imprinted genes in rapeseed (Brassica napus L.) endosperm. DNA Res 25, 629–640 (2018). [DOI] [PMC free article] [PubMed] [Google Scholar]
- 25.Gehring M, et al. DEMETER DNA glycosylase establishes MEDEA polycomb gene self-imprinting by allele-specific demethylation. Cell 124, 495–506 (2006). [DOI] [PMC free article] [PubMed] [Google Scholar]
- 26.Satyaki PRV & Gehring M DNA methylation and imprinting in plants: machinery and mechanisms. Crit. Rev. Biochem. Mol. Biol 52, 163–175 (2017). [DOI] [PubMed] [Google Scholar]
- 27.Batista RA & Köhler C Genomic imprinting in plants – revisiting existing models. Genes Dev 34, 24–36 (2020). [DOI] [PMC free article] [PubMed] [Google Scholar]
- 28.Borg M, et al. Targeted reprogramming of H3K27me3 resets epigenetic memory in plant paternal chromatin. Nat. Cell. Bio 22, 621–629 (2020). [DOI] [PMC free article] [PubMed] [Google Scholar]
- 29.Haig D & Westoby M Parent-specific gene-expression and the triploid endosperm. Am Nat 134: 147–155 (1989). [Google Scholar]
- 30.Patten MM, et al. The evolution of genomic imprinting: theories, predictions and empirical tests. Heredity 113, 119–128 (2014). [DOI] [PMC free article] [PubMed] [Google Scholar]
- 31.Schon MA & Nodine MD Widespread contamination of Arabidopsis embryo and endosperm transcriptome data sets. Plant Cell 29, 608–617 (2017). [DOI] [PMC free article] [PubMed] [Google Scholar]
- 32.Kunieda T, et al. NAC family proteins NARS1/NAC2 and NARS2/NAM in the outer integument regulate embryogenesis in Arabidopsis. Plant Cell 20, 2631–42 (2008). [DOI] [PMC free article] [PubMed] [Google Scholar]
- 33.Jackson D, “In situ hybridization in plants” in Molecular Plant Pathology: A Practical Approach (Oxford University Press, 1991). [Google Scholar]
- 34.Bortiri E, et al. ramosa2 encodes a LATERAL ORGAN BOUNDARY domain protein that determines the fate of stem cells in branch meristems of maize. Plant Cell 18, 574–85 (2006). [DOI] [PMC free article] [PubMed] [Google Scholar]
- 35.Slane D, Kong J, Schmid M, Jürgens G, Bayer M Profiling of embryonic nuclear vs. cellular RNA in Arabidopsis thaliana. Genom Data 4, 96–98 (2015). [DOI] [PMC free article] [PubMed] [Google Scholar]
- 36.Krueger F, Trim-Galore, https://github.com/FelixKrueger/TrimGalore (2019).
- 37.Dobin A, et al. STAR: ultrafast universal RNA-seq aligner. Bioinformatics 29, 15–21 (2012). [DOI] [PMC free article] [PubMed] [Google Scholar]
- 38.Picard CL & Gehring M “Identification and comparison of imprinted genes across plant species” in Plant Epigenetics and Epigenomics, Spillane C, McKeown P, Eds. (Humana, New York, NY, 2020), vol. 2093 of Methods in Molecular Biology. [DOI] [PubMed] [Google Scholar]
- 39.Picard Toolkit, Broad Institute, http://broadinstitute.github.io/picard (2019).
- 40.Anders S, Pyl TP, Huber W HTSeq — A Python framework to work with high-throughput sequencing data. Bioinformatics 31, 166–169 (2015). [DOI] [PMC free article] [PubMed] [Google Scholar]
- 41.Cheng C-Y, et al. Araport11: a complete reannotation of the Arabidopsis thaliana reference genome. Plant J 89, 789–804 (2017). [DOI] [PubMed] [Google Scholar]
- 42.McCarthy DJ, Campbell KR, Lun ATL, Willis QF Scater: pre-processing, quality control, normalisation and visualisation of single-cell RNA-seq data in R. Bioinformatics 2017; 33: 1179–1186. [DOI] [PMC free article] [PubMed] [Google Scholar]
- 43.Tian L, et al. Benchmarking single cell RNA-sequencing analysis pipelines using mixture control experiments. Nat. Methods 16, 479–487 (2019). [DOI] [PubMed] [Google Scholar]
- 44.Miao Z, Deng K, Wang X, Zhang X DEsingle for detecting three types of differential expression in single-cell RNA-seq data. Bioinformatics 34, 3223–3224 (2018). [DOI] [PubMed] [Google Scholar]
- 45.Wang T, Li B, Nelson CE, Nabavi S Comparative analysis of differential gene expression analysis tools for single-cell RNA sequencing data. BMC Bioinformatics 20, 40 (2019). [DOI] [PMC free article] [PubMed] [Google Scholar]
- 46.Alexa A & Rahnenfuhrer J topGO: Enrichment Analysis for Gene Ontology. R package version 2.40.0 (2020). [Google Scholar]
- 47.Durinck S, et al. BioMart and Bioconductor: a powerful link between biological databases and microarray data analysis. Bioinformatics 21, 3439–3440 (2005). [DOI] [PubMed] [Google Scholar]
- 48.Kim JK, Kolodziejczyk AA, Illicic T, Teichmann SA, Marioni JC Characterizing noise structure in single-cell RNA-seq distinguishes genuine from technical stochastic allelic expression. Nat. Commun 6: 8687 (2015). [DOI] [PMC free article] [PubMed] [Google Scholar]
- 49.Deng Q, Ramsköld D, Reinius B, Sandberg R Single-cell RNA-seq reveals dynamic, random monoallelic gene expression in mammalian cells. Science 343, 193–196 (2014). [DOI] [PubMed] [Google Scholar]
- 50.Borel C, et al. Biased allelic expression in human primary fibroblast single cells. Am. J. Hum. Genet 96, 70–80 (2015). [DOI] [PMC free article] [PubMed] [Google Scholar]
- 51.Jiang Y, Zhang NR, Li M SCALE: modeling allele-specific gene expression by single-cell RNA sequencing. Genome Biol 18, 74 (2017). [DOI] [PMC free article] [PubMed] [Google Scholar]
- 52.Choi K, Raghupathy N, Churchill GA A Bayesian mixture model for the analysis of allelic expression in single cells. Nat. Commun 10, 5188 (2019). [DOI] [PMC free article] [PubMed] [Google Scholar]
- 53.Hoffman GE & Schadt EE variancePartition: Interpreting drivers of variation in complex gene expression studies. BMC Bioinformatics 17, 483 (2016). [DOI] [PMC free article] [PubMed] [Google Scholar]
- 54.Windsor JB, Symonds VV, Mendenhall J, Lloyd AM Arabidopsis seed coat development: Morphological differentiation of the outer integument. Plant J 22, 483–493 (2000). [DOI] [PubMed] [Google Scholar]
- 55.Nakaune S, et al. A vacuolar processing enzyme, deltaVPE, is involved in seed coat formation at the early stage of seed development. Plant Cell 17, 876–887 (2005). [DOI] [PMC free article] [PubMed] [Google Scholar]
- 56.Mizzotti C, et al. SEEDSTICK is a master regulator of development and metabolism in the Arabidopsis seed coat. PLoS Genet 10, e1004856 (2014). [DOI] [PMC free article] [PubMed] [Google Scholar]
Associated Data
This section collects any data citations, data availability statements, or supplementary materials included in this article.
Supplementary Materials
Data Availability Statement
All sequencing data generated in this study have been deposited to the NCBI Gene Expression Omnibus with accession number GSE157145.


