

Abstract
Background
Evidence indicates that reducing dietary salt may reduce the incidence of heart disease and delay decline in kidney function in people with chronic kidney disease (CKD). This is an update of a review first published in 2015.
Objectives
To evaluate the benefits and harms of altering dietary salt for adults with CKD.
Search methods
We searched the Cochrane Kidney and Transplant Register of Studies up to 6 October 2020 through contact with the Information Specialist using search terms relevant to this review. Studies in the Register are identified through searches of CENTRAL, MEDLINE, and EMBASE, conference proceedings, the International Clinical Trials Register (ICTRP) Search Portal and ClinicalTrials.gov.
Selection criteria
Randomised controlled trials comparing two or more levels of salt intake in adults with any stage of CKD.
Data collection and analysis
Two authors independently assessed studies for eligibility, conducted risk of bias evaluation and evaluated confidence in the evidence using GRADE. Results were summarised using random effects models as risk ratios (RR) for dichotomous outcomes or mean differences (MD) for continuous outcomes, with 95% confidence intervals (CI).
Main results
We included 21 studies (1197 randomised participants), 12 in the earlier stages of CKD (779 randomised participants), seven in dialysis (363 randomised participants) and two in post‐transplant (55 randomised participants). Selection bias was low in seven studies, high in one and unclear in 13. Performance and detection biases were low in four studies, high in two, and unclear in 15. Attrition and reporting biases were low in 10 studies, high in three and unclear in eight.
Because duration of the included studies was too short (1 to 36 weeks) to test the effect of salt restriction on endpoints such as death, cardiovascular events or CKD progression, changes in salt intake on blood pressure and other secondary risk factors were examined.
Reducing salt by mean ‐73.51 mmol/day (95% CI ‐92.76 to ‐54.27), equivalent to 4.2 g or 1690 mg sodium/day, reduced systolic/diastolic blood pressure by ‐6.91/‐3.91 mm Hg (95% CI ‐8.82 to ‐4.99/‐4.80 to ‐3.02; 19 studies, 1405 participants; high certainty evidence). Albuminuria was reduced by 36% (95% CI 26 to 44) in six studies, five of which were carried out in people in the earlier stages of CKD (MD ‐0.44, 95% CI ‐0.58 to ‐0.30; 501 participants; high certainty evidence). The evidence is very uncertain about the effect of lower salt intake on weight, as the weight change observed (‐1.32 kg, 95% CI ‐1.94 to ‐0.70; 12 studies, 759 participants) may have been due to fluid volume, lean tissue, or body fat. Lower salt intake may reduce extracellular fluid volume in the earlier stages of CKD (‐0.87 L, 95% CI ‐1.17 to ‐0.58; 3 studies; 187 participants; low certainty evidence). The evidence is very uncertain about the effect of lower salt intake on reduction in antihypertensive dose (RR 2.45, 95% CI 0.98 to 6.08; 8 studies; 754 participants). Lower salt intake may lead to symptomatic hypotension (RR 6.70, 95% CI 2.40 to 18.69; 6 studies; 678 participants; moderate certainty evidence). Data were sparse for other types of adverse events.
Authors' conclusions
We found high certainty evidence that salt reduction reduced blood pressure in people with CKD, and albuminuria in people with earlier stage CKD in the short‐term. If such reductions could be maintained long‐term, this effect may translate to clinically significant reductions in CKD progression and cardiovascular events. Research into the long‐term effects of sodium‐restricted diet for people with CKD is warranted.
Plain language summary
Altered dietary salt intake for adults with chronic kidney disease
What is the issue?
People with chronic kidney disease (CKD) have a reduced kidney function that persists over time. People with CKD are at increased risk of heart disease and worsening kidney function which can lead to the need for dialysis or kidney transplantation to survive. High salt intake is linked to risk factors for both heart disease and worsening kidney function, including high blood pressure, excess protein in the urine and fluid overload. Therefore reducing salt intake may help reduce risk of heart disease and preserve kidney function. We aimed to assess the benefits and harms of reducing salt intake for people with CKD.
What did we do?
We searched the evidence up to October 2020 to find randomised controlled trials comparing two or more levels of salt intake in adults with CKD, including those in the earlier stages of CKD, those treated with dialysis, and those who had received a kidney transplant.
What did we find?
We found 21 studies that included 1197 adults with CKD (725 in low salt and 725 people in high salt group). Study participants included adults who were in the early stages of CKD (779 people in 12 studies), adults who were on dialysis (363 people in seven studies), and adult kidney transplant recipients (55 people in two studies). The average study duration was seven weeks, ranging from one to 36 weeks. We did not find any studies that measured the effect on the incidence of death, heart disease, or need for dialysis or kidney transplantation. Instead, we found studies that measured risk factors for these outcomes.
We found that lowering salt intake reduced blood pressure and protein in the urine in people with CKD. Lowering salt intake may reduce extracellular fluid volume in the earlier stages of CKD. The evidence is very uncertain about the effects on body weight and reductions in blood pressure medications. The effect on kidney function measures was mixed. Lower salt intake may increase dizziness due to low blood pressure.
Conclusions
We found that reducing salt intake reduced risk factors for heart disease and worsening kidney function in people with CKD in the short term. We could not find evidence of the longer term effects of reducing salt intake, which meant we were unable to determine the direct effects of salt intake on death, heart disease, or need for dialysis or kidney transplantation. We need more high quality research in these areas.
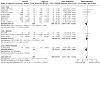
Summary of findings
Summary of findings 1. Lower salt intake versus higher salt intake for participants with chronic kidney disease.
| Lower salt intake versus higher salt intake for participants with CKD | |||||
| Patient or population: participants with CKD Setting: any Intervention: lower salt intake Comparison: higher salt intake | |||||
| Outcomes | Anticipated absolute effects* (95% CI) | Relative effect (95% CI) | No. of participants (studies) | Certainty of the evidence (GRADE) | |
| Risk with higher salt intake | Risk with lower salt intake | ||||
| Systolic blood pressure | The mean SBP in the lower salt intake group was 6.91 mm Hg lower (8.82 lower to 4.99 lower) than the higher salt intake group | ‐ | 1261 (19) | ⊕⊕⊕⊕ HIGH | |
| Diastolic blood pressure | The mean DBP in the lower salt intake group was 3.91 mm Hg lower (4.8 lower to 3.02 lower) than the higher salt intake group | ‐ | 1257 (19) | ⊕⊕⊕⊕ HIGH | |
| Albuminuria | The mean albuminuria in the lower salt intake group was 36%1 lower (44% lower to 26% lower) than the higher salt intake group | ‐ | 501 (6) | ⊕⊕⊕⊕ HIGH | |
| Extracellular fluid volume | The mean extracellular fluid volume in the lower salt intake group was 0.87 L lower (1.17 lower to 0.58 lower) than the higher salt intake group | ‐ | 187 (3) | ⊕⊕⊝⊝ LOW 2 3 | |
| Weight | The mean weight in the lower salt intake group was 1.32 kg lower (1.94 lower to 0.7 lower) than the higher salt intake group | ‐ | 759 (12) | ⊕⊝⊝⊝ VERY LOW 2 4 5 | |
| Reduction in antihypertensive dose | 24 per 1,000 | 58 per 1,000 (23 to 144) | RR 2.45 (0.98 to 6.08) | 664 (7) | ⊕⊝⊝⊝ VERY LOW 6 7 |
| Symptomatic hypotension | 8 per 1,000 | 56 per 1,000 (20 to 156) | RR 6.70 (2.40 to 18.69) | 478 (6) | ⊕⊕⊕⊝ MODERATE 3 |
| *The risk in the intervention group (and its 95% CI) is based on the assumed risk in the comparison group and the relative effect of the intervention (and its 95% CI). CKD: chronic kidney disease; CI: confidence interval; SBP: systolic blood pressure; DBP: diastolic blood pressure; RR: risk ratio | |||||
| GRADE Working Group grades of evidence High certainty: We are very confident that the true effect lies close to that of the estimate of the effect Moderate certainty: We are moderately confident in the effect estimate: The true effect is likely to be close to the estimate of the effect, but there is a possibility that it is substantially different Low certainty: Our confidence in the effect estimate is limited: The true effect may be substantially different from the estimate of the effect Very low certainty: We have very little confidence in the effect estimate: The true effect is likely to be substantially different from the estimate of effect | |||||
1 Albuminuria was analysed as log‐transformed (mg/day) and expressed as a percentage reduction
2 Evidence certainty downgraded one level for uncertain or high risk of bias
3 Evidence certainty downgraded one level for few events and/or participants across all studies
4 Evidence certainty downgraded one level for moderate heterogeneity
5 Evidence certainty downgraded one levels for indirectness of outcome
6 Evidence certainty downgraded two levels for a high risk of bias
7 Evidence certainty downgraded one level for wide confidence interval range that include benefit or harm
Background
Description of the condition
Chronic kidney disease (CKD) is a major global public health problem, affecting an estimated 10% of the global population (GBD 2019). According to the Global Burden of Disease, CKD was the 12th most common cause of death in 2017, accounting for 1.2 million deaths worldwide (GBD 2019). Overall CKD death increased by 34% from 2007 to 2017, making it one of the fastest rising major causes of death, alongside diabetes and dementia (GBD 2019). Diabetes and high blood pressure (BP) remain the two biggest risks for developing CKD, with 28% of CKD deaths being due to diabetes, and 28% due to high BP (GBD 2019).
CKD is a progressive condition, and risk of cardiovascular disease and death increases with declining glomerular filtration rate (GFR) (Go 2004). Healthcare costs of treating people with end‐stage kidney disease (ESKD), where dialysis or kidney transplantation is required to survive, have been estimated at about 10 times greater than the cost of CKD management (Hunsicker 2004). Because both cardiovascular disease and progression to ESKD may be delayed, or possibly prevented, effective strategies to reduce these outcomes are needed to improve patients' prognoses and reduce healthcare costs.
Description of the intervention
Excessive salt (sodium) intake is related to many risk factors for cardiovascular disease and CKD progression (Jones‐Burton 2006; Suckling 2010; Malta 2018). These include increased BP, fluid retention, proteinuria, inflammation, oxidative stress, and endothelial dysfunction (Al‐Solaiman 2009; Ritz 2009). The World Health Organisation recommends adults consume less than 5 g of salt (2 g or 87 mmol sodium) per day (WHO 2012). Data from populations around the world show that salt intakes far exceed this (Mozaffarian 2014; Trieu 2015). Estimates in people with CKD are commonly between 9 to 12 g (150 to 200 mmol sodium) (McMahon 2012a). National salt reduction strategies have been established in 75 countries; most of these aim to reduce population salt intake through reducing salt content of food and/or consumer education to shift dietary behaviour (Trieu 2015). Intervention trials comparing two or more levels of salt intake usually achieve a difference in salt intake by dietary education (e.g., individual or group counselling, online support), providing meals to participants and/or using salt supplements (McMahon 2012a).
How the intervention might work
Sodium is an essential nutrient, and has vital roles in regulating fluid homeostasis, blood volume and osmotic pressure (Elliot 2006). Excess sodium increases serum osmolality, triggering the release of vasopressin (arginine vasopressin (AVP), also known as antidiuretic hormone) which initiative a cascade of metabolic actions including activation of the renin‐angiotensin‐aldosterone system (RAAS) causing blood vessels to constrict and increasing water reabsorption from the urine (Qian 2018). Chronic high‐salt intake (> 7 days) leads to excessive AVP production and vasoconstriction. This can lead to kidney and cardiovascular damage through dysregulation of fluid volume homeostasis and BP. Non‐osmotic storage of salt in the skin and the muscle is thought to be linked to increased risk of cardiovascular and kidney disease (Garofalo 2018; Qian 2018).
High BP is common in CKD, and sustained elevations in BP hasten CKD progression (Bakris 2000). Studies in the general population have consistently demonstrated a link between dietary salt intake and BP (He 2013; Svetkey 1999). A 2017 Cochrane review found that reducing salt from 11.5 g/day to 3.8 g/day reduced systolic BP/diastolic BP in people with normotension by 1/0 mm Hg, and in people with hypertension about approximately 5.5/3 mm Hg (Graudal 2020). High salt intake may have a greater impact on BP in people with CKD than in those without CKD since CKD may reduce the ability to excrete the excess salt. A 2010 Cochrane review on reducing salt intake in people with diabetic kidney disease showed considerable BP reductions; systolic/diastolic BP was lowered by 7/3 mm Hg (Suckling 2010).
It has also been suggested that salt has adverse effects independent of BP. Todd 2010 found arterial stiffness measured by pulse wave velocity was significantly decreased independently of BP changes in hypertensive people on a low salt diet. Increased pulse wave velocity is a predictor of all‐cause and cardiovascular death (Guerin 2001). Proteinuria, a risk factor for both CKD progression and cardiovascular disease in people with CKD, has also shown to be reduced by salt restriction independent of BP (Verhave 2004).
Why it is important to do this review
Salt intake shows great promise as a modifiable risk factor for reducing cardiovascular risk and CKD progression even among people in the very early stages of the disease. However, clear consensus of the benefits of reducing salt for people with CKD and the optimal target salt intake for this population have yet to be established. This review updates a 2015 Cochrane review of altered dietary salt intake in people with CKD (McMahon 2015). Updating the review will ensure that best evidence is available for the benefits (and potential adverse effects) of reducing salt for people with CKD.
Objectives
This review evaluated the benefits and harms of altering dietary salt intake in adults with CKD.
Methods
Criteria for considering studies for this review
Types of studies
We included randomised controlled trials (RCTs) and quasi‐RCTs (RCTs in which allocation to treatment was obtained by alternation, use of alternate medical records, date of birth or other predictable methods) measuring the effect of low versus high salt intake in adults with CKD.
Types of participants
Inclusion criteria
Adults (≥ 18 years) with CKD were included. For this review update, we defined CKD as those who are receiving any form of kidney replacement therapy, have a functioning kidney transplant, have impaired kidney function defined as a reduced GFR (< 60 mL/min/1.73 m²) or the presence of other markers of kidney damage such as proteinuria (KDOQI stages 1‐5) or an elevated serum creatinine (SCr > 120 mmol/L) (KDIGO 2013), or as defined by study authors. This definition of CKD has been updated from that used in the initial review (McMahon 2015), where we defined CKD using the Kidney Disease Outcomes Quality Initiative (KDOQI) Clinical Practice Guidelines) at all disease stages (NKF 2002).
Exclusion criteria
Pregnant women
Children (aged up to 18 years).
Types of interventions
We planned to evaluate the following interventions.
Comparing two or more differing levels of sodium intake
Of at least one week duration
Where concomitant interventions such as antihypertensive medication or other dietary modifications were used during the study period, providing that these interventions were constant throughout the low and high salt interventions.
In the initial review (2015), we included studies that evaluated sodium intake using 24‐hour urinary sodium excretion (24‐hour UNa) with a minimum difference in 24‐hour UNa of 34 mmol/day (2 g salt/day) achieved between allocated interventions. No studies were excluded based on this criterion in the initial review. This eligibility criterion has been removed in this update, allowing the inclusion of studies measuring sodium intake using other methods (such as food records or 24‐hour recalls) and allowing any magnitude of difference in sodium intake between the allocated interventions.
Types of outcome measures
Primary outcomes
Cardiovascular death
Death (any cause)
Secondary outcomes
Cardiovascular disease (coronary artery disease, heart failure, cerebrovascular disease, peripheral vascular disease)
Progression to ESKD requiring dialysis or transplantation
24‐hour UNa
Change in BP: clinic and 24‐hour measurement
Change in arterial stiffness: pulse wave velocity and augmentation index)
Change in kidney function measures: creatinine clearance (CrCl), SCr, proteinuria, GFR
Change in markers of fluid overload: brain natriuretic peptide (NT‐proBNP), weight, bio‐impedance analysis
Change in markers of oxidative stress or inflammation: C‐reactive protein, adipokines
Adverse events: hypotensive episodes, undesirable change in blood lipids (low density lipoprotein, high‐density lipoprotein).
Search methods for identification of studies
Electronic searches
We searched the Cochrane Kidney and Transplant Register of Studies up to 6 October 2020 through contact with the Information Specialist using search terms relevant to this review. The Register contains studies identified from the following sources:
Monthly searches of the Cochrane Central Register of Controlled Trials (CENTRAL)
Weekly searches of MEDLINE OVID SP
Searches of kidney and transplant journals, and the proceedings and abstracts from major kidney and transplant conferences
Searching of the current year of EMBASE OVID SP
Weekly current awareness alerts for selected kidney and transplant journals
Searches of the International Clinical Trials Register (ICTRP) Search Portal and ClinicalTrials.gov.
Studies contained in the Register are identified through searches of CENTRAL, MEDLINE, and EMBASE based on the scope of Cochrane Kidney and Transplant. Details of search strategies, as well as a list of handsearched journals, conference proceedings and current awareness alerts, are available on the Cochrane Kidney and Transplant website.
See Appendix 1 for search terms used in strategies for this review.
Searching other resources
Reference lists of review articles, relevant studies, and clinical practice guidelines
Contacting relevant individuals/organisations seeking information about unpublished or incomplete studies.
Data collection and analysis
Selection of studies
2021 update
The search results were screened and studies included or excluded based on the selection criteria listed above. Excluded studies from the 2015 review were reassessed based on the updated eligibility criteria. Screening was done independently by two authors.
2015 review
The search strategy described was used to obtain titles and abstracts of studies that may be relevant to the review. The titles and abstracts were screened independently by two authors, who discarded studies that were not applicable; however, studies and reviews that might have included relevant data or information on studies were retained initially. Two authors independently assessed the retrieved abstracts, and if necessary, the full text of these studies to determine which studies satisfied the inclusion criteria.
Data extraction and management
Data extraction for studies new to this 2021 update was done using standard data extraction forms. In the 2015 review, data extraction was carried out independently by two authors. Studies reported in non‐English language journals were translated before assessment. Where more than one publication of one study exists, reports were grouped together and the publication with the most complete data was used in the analyses. Where relevant outcomes were only published in earlier versions these data were used. Any discrepancies between published versions were highlighted.
Assessment of risk of bias in included studies
The following items were independently assessed by two authors using the risk of bias assessment tool (Higgins 2011) (see Appendix 2).
Was there adequate sequence generation (selection bias)?
Was allocation adequately concealed (selection bias)?
-
Was knowledge of the allocated interventions adequately prevented during the study?
Participants and personnel (performance bias)
Outcome assessors (detection bias)
Were incomplete outcome data adequately addressed (attrition bias)?
Are reports of the study free of suggestion of selective outcome reporting (reporting bias)?
-
Was the study apparently free of other problems that could put it at a risk of bias? Two additional domains were addressed:
Carry‐over effect
Confounding factors (bias due to differences between groups other than sodium intake that are likely to impact the effect estimate (in either direction) including differential changes in diet/medication (potassium intake, body weight changes, anti‐hypertensive medication dosage) and baseline differences in the outcome, where likely to impact the effect estimate)
Measures of treatment effect
For dichotomous outcomes (cardiovascular death, death (any cause), progression to ESKD, cardiovascular disease, symptomatic hypotension, reduction in anti‐hypertensive dose) results were expressed as risk ratios (RR) with 95% confidence intervals (CI). Where continuous scales of measurement were used to assess the effects of treatment (BP, pulse wave velocity, augmentation index, CrCl, SCr, proteinuria, GFR, brain natriuretic peptide (NT‐proBNP), weight, bio‐impedance analysis, C‐reactive protein, adipokines) the mean difference (MD) was used, or the standardised mean difference (SMD) if different scales were used. Studies analysing change scores were included in meta‐analysis along with studies including endpoint data only.
Unit of analysis issues
For cross‐over studies, we determined the mean difference in outcomes as the difference between the end of low salt and high salt periods. Standard deviations for cross‐over studies were imputed from paired analysis CIs or P values. Where these were not reported, SD of the values at the end of each period was used.
For parallel studies, we calculated the treatment effect as the difference between treatment groups' change in outcomes from baseline. Where these were not reported, or could not be imputed from reported values, values at the end of the intervention were used.
Dealing with missing data
Any further information required from the original author was requested by written correspondence (e.g. emailing corresponding author) and any relevant information obtained in this manner was included in the review. Evaluation of important numerical data such as screened, randomised subjects as well as intention‐to‐treat, as‐treated and per‐protocol population were performed. Attrition rates, for example drop‐outs, losses to follow‐up and withdrawals were investigated. Issues of missing data and imputation methods (e.g. last‐observation‐carried‐forward) were critically appraised (Higgins 2011).
Assessment of heterogeneity
We first assessed the heterogeneity by visual inspection of the forest plot. We then quantified statistical heterogeneity using the I² statistic, which describes the percentage of total variation across studies that is due to heterogeneity rather than sampling error (Higgins 2003). A guide to the interpretation of I² values was as follows.
0% to 40%: might not be important
30% to 60%: may represent moderate heterogeneity
50% to 90%: may represent substantial heterogeneity
75% to 100%: considerable heterogeneity.
The importance of the observed value of I² depends on the magnitude and direction of treatment effects and the strength of evidence for heterogeneity (e.g. P value from the Chi² test, or a CI for I²) (Higgins 2011).
Assessment of reporting biases
If possible, funnel plots were to be constructed to assess for the potential existence of small study bias (Higgins 2011). There were insufficient data to enable construction of funnel plots for this review.
Data synthesis
Data were pooled using the random‐effects model but the fixed‐effect model was also used to ensure robustness of the model chosen and susceptibility to outliers.
Subgroup analysis and investigation of heterogeneity
Subgroup analysis was used to explore possible sources of heterogeneity. Heterogeneity among participants could be related to age, ethnicity, stage of CKD and presence of comorbidities (e.g. hypertension and diabetes).
Sensitivity analysis
Where necessary, we performed sensitivity analyses in order to explore the influence of the following factors on effect size.
repeating the analysis excluding unpublished studies
repeating the analysis taking account of risk of bias, as specified
repeating the analysis excluding any very long or large studies to establish how much they dominate the results
repeating the analysis excluding studies using the following filters: diagnostic criteria, language of publication, source of funding (industry versus other), and country.
Summary of findings and assessment of the certainty of the evidence
We presented the main results of the review in 'Summary of findings' tables. These tables present key information concerning the quality of the evidence, the magnitude of the effects of the interventions examined, and the sum of the available data for the main outcomes (Schunemann 2011a). The 'Summary of findings' tables also include an overall grading of the evidence related to each of the main outcomes using the GRADE (Grades of Recommendation, Assessment, Development and Evaluation) approach (GRADE 2008; GRADE 2011). The GRADE approach defines the quality of a body of evidence as the extent to which one can be confident that an estimate of effect or association is close to the true quantity of specific interest. The quality of a body of evidence involves consideration of within‐trial risk of bias (methodological quality), directness of evidence, heterogeneity, precision of effect estimates and risk of publication bias (Schunemann 2011b). We presented the following outcomes in the 'Summary of findings' tables.
Systolic BP
Diastolic BP
Albuminuria
Extracellular fluid volume
Weight
Reduction in antihypertensive dose
Symptomatic hypotension.
Results
Description of studies
See Characteristics of included studies; Characteristics of excluded studies; Characteristics of studies awaiting classification; Characteristics of ongoing studies.
Results of the search
Figure 1 details the study search results. The initial version of this review (McMahon 2015) included eight studies (24 reports) with 224 participants in the low salt group and 218 participants in the high salt group (442 combined; 261 unique). Nine studies were excluded, four were ongoing, and two studies were awaiting assessment. None of the previously excluded studies were eligible when reassessed against the updated eligibility criteria.
1.

Study flow diagram
For this update (2021), we identified 67 new reports. We included 13 new included studies (45 reports) (BalanceWise‐HD 2013; BalanceWise‐PD 2011; Catto 1973; de Vries 2016; Doulton 2007; ESMO 2017; ESPECIAL 2014; Kwakernaak 2014; Mulhauser 1996; Power 2010; Rodrigues Telini 2014; Saran 2017; ViRTUE‐CKD 2016); three of these were previously ongoing studies (BalanceWise‐HD 2013; Doulton 2007; Saran 2017). We also identified six new reports of five previously included studies; seven new excluded studies (14 reports); four new reports of two existing excluded studies; and six reports for five new ongoing studies. One study previously listed as ongoing was withdrawn in late 2015 and has been moved to excluded studies (Reyes 2013). All non‐randomised studies and RCTs in non‐CKD patients have been removed from this update.
A total of 21 studies (72 reports) have been included and 11 studies (26 reports) have been excluded from this review update. There are five ongoing studies (6 reports) which will be assessed in a future update of this review.
Included studies
See Characteristics of included studies.
We included 21 studies (1197 randomised participants), 12 in the earlier stages of CKD (779 randomised participants), seven in dialysis (363 randomised participants) and two in post‐transplant (55 randomised participants). These studies reported the results of 725 participants in the low salt arm and 725 participants in the high salt arm. Power 2010 (31 participants) did not report the sample size for each group and therefore the results could not be included in the quantitative synthesis.
Six studies were conducted in the Netherlands (de Vries 2016; DUAAAL 2011; ESMO 2017; Kwakernaak 2014; ViRTUE‐CKD 2016; Vogt 2008), four in the USA (BalanceWise‐HD 2013; BalanceWise‐PD 2011; Fine 1997; Saran 2017), four in the UK (de Brito‐Ashurst 2013; Catto 1973; Doulton 2007; Power 2010), and one study in Australia (LowSALT CKD 2012), Brazil (Rodrigues Telini 2014), Germany (Mulhauser 1996), Japan (Konishi 2001), Korea (ESPECIAL 2014), Spain (Ruilope 1992a), and Turkey (Keven 2006).
Of the 21 included studies, 12 were cross‐over studies (Catto 1973; de Vries 2016; Doulton 2007; DUAAAL 2011; Fine 1997; Konishi 2001; Kwakernaak 2014; LowSALT CKD 2012; Ruilope 1992a; Saran 2017; ViRTUE‐CKD 2016; Vogt 2008) and nine were parallel design studies (BalanceWise‐HD 2013; BalanceWise‐PD 2011de Brito‐Ashurst 2013; ESMO 2017; ESPECIAL 2014; Keven 2006; Mulhauser 1996; Power 2010; Rodrigues Telini 2014). Values from paired analyses were reported for most cross‐over studies, although not always for all outcomes. Konishi 2001 and Ruilope 1992a did not report paired analyses and values from the end of the intervention were used. Four of the parallel studies (BalanceWise‐HD 2013; BalanceWise‐PD 2011; de Brito‐Ashurst 2013; ESPECIAL 2014) reported change from baseline for each group, and these data were used for analysis. Mulhauser 1996 reported change from baseline for BP but not for other outcomes. Four of the parallel studies (ESMO 2017; Keven 2006; Power 2010; Rodrigues Telini 2014) did not present data on change from baseline, and because there were no appropriate data available to impute values, values at the end of the intervention were used.
Nine studies enrolled participants with ESKD, seven in dialysis (haemodialysis (HD): BalanceWise‐HD 2013; Catto 1973; Doulton 2007; Power 2010; Rodrigues Telini 2014; peritoneal dialysis (PD): BalanceWise‐PD 2011; Fine 1997) and two post‐transplant (Keven 2006; de Vries 2016). Twelve studies enrolled participants in earlier stages of CKD (de Brito‐Ashurst 2013; DUAAAL 2011; ESMO 2017; ESPECIAL 2014; Konishi 2001; Kwakernaak 2014; LowSALT CKD 2012; Mulhauser 1996; Ruilope 1992a; Saran 2017; ViRTUE‐CKD 2016; Vogt 2008).
Median study duration was seven weeks, ranging from one to 36 weeks. A cut‐off of four weeks was used to classify studies according to intervention duration (short‐term: fewer than four weeks; longer‐term: four weeks or more). Three studies were classified as short‐term, all of which were cross‐over studies with two arms and enrolled participants in the earlier stages of CKD: Konishi 2001 and Ruilope 1992a had one‐week interventions and LowSALT CKD 2012 had two‐week interventions. We classified 15 studies as longer‐term (range: four to 36 weeks); these included all ESKD studies (BalanceWise‐HD 2013; BalanceWise‐PD 2011; Catto 1973; de Vries 2016; Doulton 2007; Fine 1997; Keven 2006; Power 2010; Rodrigues Telini 2014) and nine studies in earlier CKD (de Brito‐Ashurst 2013; DUAAAL 2011; ESMO 2017; ESPECIAL 2014; Kwakernaak 2014; Mulhauser 1996; Saran 2017; ViRTUE‐CKD 2016; Vogt 2008).
Thirteen studies used dietary counselling to achieve a difference in sodium intake. Of these, 11 studies compared sodium restriction achieved through dietary counselling in the low salt intervention to usual diet or usual care in the high salt intervention (BalanceWise‐PD 2011;de Brito‐Ashurst 2013; de Vries 2016; DUAAAL 2011; ESMO 2017; Keven 2006; Kwakernaak 2014; Rodrigues Telini 2014; Saran 2017; ViRTUE‐CKD 2016; Vogt 2008). Two studies compared against a less intensive education strategy to reduce dietary sodium: ESPECIAL 2014 compared intensive education to reduce sodium in the high salt intervention versus brief education in the low salt intervention, and BalanceWise‐HD 2013 provided individualised dietary counselling paired with personal digital assistant‐based self‐monitoring and feedback on sodium intake to participants in the low salt intervention and six educational modules to both groups (attention control for the high salt group). Six studies used sodium supplements to achieve difference in sodium intake with sodium supplements in the high salt group compared against placebo (Catto 1973; Doulton 2007; Fine 1997; LowSALT CKD 2012; Mulhauser 1996) or a lower dose of sodium supplementation (Ruilope 1992a) in the low salt group. Power 2010 did not specify means for achieving difference in sodium intake. Konishi 2001 provided all food for participants.
Five studies included concomitant interventions of medications that remained stable throughout the high and low salt phases. DUAAAL 2011 and Kwakernaak 2014 started all participants on lisinopril 40 mg/day, ESPECIAL 2014 used olmesartan medoxomil 40 mg/day, Ruilope 1992a used verapamil 240 mg/day, and ViRTUE‐CKD 2016 used ramipril 10 mg/day. The protocol for Konishi 2001 included cessation of all medications one week before the study.
Outcome reporting in included studies
Where multiple markers of sodium intake were collected, 24‐hour UNa excretion was used preferentially in analyses. Fifteen studies reported 24‐hour UNa excretion as a marker of sodium intake (de Brito‐Ashurst 2013;de Vries 2016;DUAAAL 2011;ESMO 2017;ESPECIAL 2014;Fine 1997;Keven 2006;Konishi 2001;Kwakernaak 2014;LowSALT CKD 2012;Mulhauser 1996; Ruilope 1992a;Saran 2017;ViRTUE‐CKD 2016;Vogt 2008). Fine 1997, whose participants were receiving PD, added 24‐hour UNa excretion to 24‐hour dialysate sodium to achieve a total value for sodium excretion, and this value was used for analysis. Four studies collected self‐reported dietary sodium intake measurements (values were converted to mmol/day prior to analysis); BalanceWise‐HD 2013 and BalanceWise‐PD 2011 used three, 24‐hour recalls, Rodrigues Telini 2014 used three‐day diet records, while Catto 1973, Doulton 2007 and Power 2010 did not report sodium intake or excretion.
All studies except BalanceWise‐HD 2013 and Power 2010 measured and reported BP. Where more than one BP measurement was reported, 24‐hour ambulatory BP was used preferentially in analyses, and clinic‐assessed BP was used preferentially over self‐assessed BP measurements. Seven studies measured 24‐hour ambulatory BP (de Brito‐Ashurst 2013; Doulton 2007; ESMO 2017; Konishi 2001; LowSALT CKD 2012; Ruilope 1992a; Saran 2017), 10 used clinic‐assessed BP (Catto 1973; de Vries 2016; DUAAAL 2011; ESPECIAL 2014; Keven 2006; Kwakernaak 2014; Mulhauser 1996; Rodrigues Telini 2014; ViRTUE‐CKD 2016; Vogt 2008); BalanceWise‐PD 2011 and Fine 1997 used self‐assessed BP. If more than one position was reported, standing BP was the first preference, except in BalanceWise‐PD 2011 where sitting BPs were used due to there being more missing data for the standing measurements.
Eleven studies reported changes in urinary protein or albumin (de Vries 2016; DUAAAL 2011; ESMO 2017; ESPECIAL 2014; Konishi 2001; Kwakernaak 2014; LowSALT CKD 2012; Mulhauser 1996; Saran 2017; ViRTUE‐CKD 2016; Vogt 2008). Pooled analyses were performed on log‐transformed values (mg/day) to give log mean (95% CI of log mean). The exponential of these values were also reported to indicate percentage change for ease of understanding (Bland 1996).
Nine studies reported 24‐hour urinary protein excretion (de Vries 2016; DUAAAL 2011; ESMO 2017; Konishi 2001; Kwakernaak 2014; LowSALT CKD 2012; Mulhauser 1996;ViRTUE‐CKD 2016; Vogt 2008). Three studies (DUAAAL 2011; Kwakernaak 2014; ViRTUE‐CKD 2016) reported geometric mean (95% CI) which was transformed to log mean and SD using the methods specified in the Cochrane Handbook. Two studies (ESMO 2017; Vogt 2008) reported values as mean and standard error which were converted to log mean and SD using the methods specified in Higgins 2008. LowSALT CKD 2012 provided raw data and these were log‐transformed. Two studies (de Vries 2016; Konishi 2001) reported data as median and inter‐quartile range and could not be entered into pooled analysis. Mulhauser 1996 reported values as mean and range and from these values it appeared that the data were not normally distributed therefore could not be entered into pooled analysis.
Six studies reported 24‐hour urinary albumin excretion (de Vries 2016; ESPECIAL 2014; Kwakernaak 2014; LowSALT CKD 2012; Saran 2017; ViRTUE‐CKD 2016). de Vries 2016 and Saran 2017 reported values as change in log mean and 95% CI. Two studies (Kwakernaak 2014; ViRTUE‐CKD 2016) reported geometric mean (95% CI) which was transformed to log mean and SD using the methods specified in the Cochrane Handbook. Two studies (LowSALT CKD 2012; ESPECIAL 2014) provided raw data which were log‐transformed for analysis.
Thirteen studies reported change in body weight (BalanceWise‐HD 2013de Brito‐Ashurst 2013; de Vries 2016; Doulton 2007; DUAAAL 2011; ESMO 2017; Fine 1997; Kwakernaak 2014; LowSALT CKD 2012; Ruilope 1992a; Saran 2017; ViRTUE‐CKD 2016; Vogt 2008).
Objective markers of fluid status were reported by six studies; three studies reported extracellular fluid volume (LowSALT CKD 2012; Rodrigues Telini 2014; Saran 2017), de Brito‐Ashurst 2013 reported total body water, two studies reported presence of oedema (DUAAAL 2011; ViRTUE‐CKD 2016), and three reported intradialytic weight gain (BalanceWise‐HD 2013; Doulton 2007; Rodrigues Telini 2014). Doulton 2007 reported only mean values at the end of each intervention arm and the P value for the mean difference for body weight and inter‐dialytic weight gain, therefore SDs were imputed from P values using the methods described in the Cochrane Handbook.
Excluded studies
We excluded 11 studies (26 reports) that did not meet our inclusion criteria. Reasons for exclusion were non‐CKD population (Li 2013f; Suckling 2016), concomitant intervention that was not stable between interventions (DD 2017; Esnault 2005; Kauric‐Klein 2012; HHK 2018) not comparing two or more levels of sodium intake (Chanwikrai 2012; Imanishi 1997), or less than one week duration (Clark‐Cutaia 2016; De Nicola 2000).
Ongoing studies
Five studies are ongoing and will be assessed once they have been completed (NCT03373500; OxCKD1 2012; STICK 2015; SUBLIME 2020; SUPER 2016).
Risk of bias in included studies
Figure 2 and Figure 3 summarise risk of bias assessment for the included studies.
2.

Risk of bias summary: review authors' judgements about each risk of bias item for each included study.
3.

Risk of bias graph: review authors' judgements about each risk of bias item presented as percentages across all included studies.
Studies were frequently assessed as having unclear or high risk of bias for the risk of bias study domains with selection bias, performance bias, detection bias, and confounding bias domains having the largest proportion of unclear/high risk of bias.
Allocation
Random sequence generation
All included studies were randomised. Further details were provided about the method of randomisation for 12 studies and these studies were judged to be at low risk of bias (BalanceWise‐HD 2013; BalanceWise‐PD 2011; de Brito‐Ashurst 2013; de Vries 2016; DUAAAL 2011; ESMO 2017; ESPECIAL 2014; Fine 1997; Kwakernaak 2014; LowSALT CKD 2012; Vogt 2008; ViRTUE‐CKD 2016). The remaining nine studies were judged to have unclear risk of bias.
Allocation concealment
Allocation concealment was not described for 11 studies and these were judged to be low risk of bias (Catto 1973; de Brito‐Ashurst 2013; de Vries 2016; DUAAAL 2011; Keven 2006; Konishi 2001; Kwakernaak 2014; Power 2010; Rodrigues Telini 2014; Ruilope 1992a; Vogt 2008). Saran 2017 was considered to be at high risk of bias due to allocation concealment. Randomisation was concealed using sealed envelopes but it was unclear how this process was monitored. This study had considerable violation of the protocol at one of the two study sites (6/21 given treatment in the reverse order for unknown reasons, 4/21 recommended to continue low salt instead of crossing over to high salt diet) (Saran 2017). The remaining nine studies were judged to have unclear risk of bias.
Blinding
Most outcomes were objective and therefore at lower risk of being influenced by performance bias. Five studies (Catto 1973; Doulton 2007, Fine 1997;LowSALT CKD 2012;Mulhauser 1996) were double blinded. Clinicians, but not participants, were blinded in ESPECIAL 2014. Investigators, but not participants or study coordinators, were blinded in Saran 2017, and the lack of blinding of study coordinators may have influenced the outcomes, as evidenced by the protocol deviations described previously.
Twelve studies had open‐label dietary interventions (BalanceWise‐HD 2013; BalanceWise‐PD 2011; de Brito‐Ashurst 2013; de Vries 2016; DUAAAL 2011; ESMO 2017; Keven 2006; Kwakernaak 2014; Power 2010; Rodrigues Telini 2014; ViRTUE‐CKD 2016; Vogt 2008).
Konishi 2001 and Ruilope 1992a did not describe blinding.
Incomplete outcome data
There was a high risk of attrition bias due to incomplete outcome data for three studies; BalanceWise‐PD 2011 reported 19% attrition and data were missing for a large proportion of participants for BP, weight and urine outcomes; Power 2010 had 38% attrition and did not report reasons or attrition by allocation; Saran 2017 had a proportion of participants with missing data for some outcomes (e.g. only 10/21 participants at one of the sites included in urinary albumin data, but 21/21 included in urinary creatinine data), and reasons for this were not provided. The authors were contacted to provide further information, but none was provided.
Konishi 2001 and Ruilope 1992a did not report participant attrition. Doulton 2007 specified a target enrolment of 20 and reported 13 completers but did not report actual enrolment to determine attrition. Fine 1997 reported a large degree of attrition (12/32 participants; 37%) that was even among the two groups, however may have introduced bias as some participants withdrew due to concern about values when self‐measuring BP. Rodrigues Telini 2014 reported 26% attrition which was higher in the high salt (9/30; 30%) than the low salt group (5/23; 21%).
Selective reporting
Risk of reporting bias was unclear for four studies for which trial registration or study protocol could not be located (Keven 2006; Konishi 2001; Ruilope 1992a) and for Saran 2017 with unexplained missing outcome data. Risk of reporting bias was high for two studies where most or all outcomes could not be meta‐analysed due to the way that they were reported (Mulhauser 1996; Power 2010).
Other potential sources of bias
Carry‐over effect in cross‐over studies
Carry‐over effect may have introduced bias in Konishi 2001 and Ruilope 1992a; both were of one week duration with no washout between interventions. Ruilope 1992a introduced a new antihypertensive medication at day 1 of the first intervention, increasing risk of treatment order effect.
Bias from cofounders
Bias from confounders was classified as unclear or high risk for nearly all studies, mostly due to lack of measurement or failing to adequately report or account for the impact of changes in medications and/or dietary changes such as potassium intake, protein intake and/or weight loss between interventions. Dietary changes were considered more likely to introduce bias in studies comparing a sodium restricted to usual diet, and less so those using sodium supplements to achieve differences in salt intake. Mean systolic/diastolic BP was 6‐7/3 mm Hg higher in low salt versus high salt group at baseline in both Keven 2006 and Rodrigues Telini 2014. While this difference may not have been statistically significant, this may have impacted the clinical significance of the results, as both studies did not report results as change from baseline. This information was sought from authors but was not provided.
We assessed that two studies were at high risk of bias in relation to funding sources (Fine 1997; Saran 2017).
Effects of interventions
See: Table 1
Duration of the included studies was too short to test the efficacy of salt restriction on endpoints such as death, cardiovascular events, or progression to ESKD. Therefore, changes in salt intake on BP and risk factors for cardiovascular disease and ESKD were considered in evaluating the evidence for this review.
Sodium intake/excretion
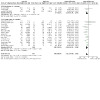
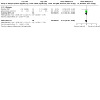
Low salt intake resulted in sodium intake/excretion being reduced in included studies (Analysis 1.1 (18 studies, 1383 participants): MD ‐73.51 mmol/day, 95% CI ‐92.76 to ‐54.27; high certainty evidence) although heterogeneity was high (I² = 93%).
1.1. Analysis.

Comparison 1: CKD stage, Outcome 1: Sodium intake/excretion
CKD stage
In the earlier stages of CKD, reducing salt intake reduced sodium intake/excretion (Analysis 1.1.1 (12 studies, 1048 participants): MD ‐83.81 mmol/day, 95% CI ‐104.54 to ‐63.08; I² = 92%). In studies in dialysis patients, reducing salt intake reduced sodium intake/excretion (Analysis 1.1.2 (4 studies, 259 participants): MD ‐27.17 mmol/day, 95% CI ‐48.59, ‐5.76; I² = 70%. In studies in post‐transplant recipients, reducing salt intake reduced sodium intake/excretion (Analysis 1.1.3 (2 studies, 76 participants): MD ‐96.99 mmol/day, 95% CI ‐148.10 to ‐45.89; I² = 55%).
The test for subgroup differences showed a difference between the earlier stages of CKD and dialysis patients (Chi² = 13.87, df = 1 (P = 0.0002), I² = 92.8%) and dialysis patients and transplant recipients (Chi² = 6.10, df = 1 (P = 0.01), I² = 83.6%) but not between the earlier stages of CKD and transplant recipients (Chi² = 0.22, df = 1 (P = 0.64), I² = 0%).
Duration
In short‐term studies (< 4 weeks), reducing salt intake reduced sodium intake/excretion (Analysis 2.1.1 (3 studies, 142 participants): MD ‐111.29 mmol/day, 95% CI ‐134.25 to ‐88.32; I² = 77%;). In longer‐term studies (≥ 4 weeks), reducing salt intake reduced sodium intake/excretion ( Analysis 2.1.2 (15 studies, 1241 participants): MD ‐64.53 mmol/day, 95% CI ‐83.29, ‐45.78; I² = 90%).
The test for subgroup differences showed a difference between short‐ and longer‐term studies (Chi² = 248.56, df = 1 (P = 0.00001), I² = 93%).
Blood pressure
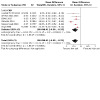
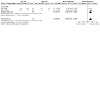
Reducing salt intake reduced both systolic (Analysis 1.2 (19 studies, 1261 participants): MD ‐6.91 mm Hg, 95% CI ‐8.82 to ‐4.99; I² = 50%; high certainty evidence) and diastolic BP (Analysis 1.3 (19 studies, 1257 participants): MD ‐3.91 mm Hg, 95% CI ‐4.80 to ‐3.02; I² = 21%; high certainty evidence).
Power 2010 reported intradialytic BP stability as being significantly improved when sodium restriction was combined with low dialysate (P < 0.05), but did not report results for sodium restriction alone.
CKD stage
In the earlier stages of CKD, reducing salt intake reduced both systolic (Analysis 1.2.1 (12 studies, 1036 participants): MD ‐6.10 mm Hg, 95% CI ‐8.11 to ‐4.08; I² = 48%) and diastolic BP (Analysis 1.3.1 (12 studies, 1032 participants): MD ‐3.47 mm Hg, 95% CI ‐4.28 to ‐2.65; I² = 0%).
1.2. Analysis.

Comparison 1: CKD stage, Outcome 2: Systolic blood pressure
1.3. Analysis.

Comparison 1: CKD stage, Outcome 3: Diastolic blood pressure
In dialysis patients, reducing salt intake reduced both systolic (Analysis 1.2.2 (5 studies, 149 participants): MD ‐6.32 mm Hg, 95% CI ‐11.04 to ‐1.60; I² = 0%) and diastolic BP (Analysis 1.3.2 (5 studies, 149 participants): MD ‐3.46 mm Hg, 95% CI ‐6.39 to ‐0.54; I² = 0%).
In post‐transplant recipients, reducing salt intake reduced both systolic (Analysis 1.2.3 (2 studies, 76 participants): MD ‐11.94 mm Hg, 95% CI ‐15.77 to ‐8.11; I² = 12%) and diastolic BP (Analysis 1.3.2 (2 studies, 76 participants): MD ‐7.13 mm Hg, 95% CI ‐9.46 to ‐4.79; I² = 0%).
For systolic BP, the test for subgroup differences showed a difference between the earlier stages of CKD and post‐transplant recipients (Test for subgroup differences: Chi² = 7.01, df = 1 (P = 0.008), I² = 85.7%) but not between the earlier stages of CKD and dialysis patients (Chi² = 0.01, df = 1 (P = 0.93), I² = 0%) or dialysis patients and post‐transplant recipients (Chi² = 3.28, df = 1 (P = 0.07), I² = 69.6%).
For diastolic BP, the test for subgroup differences showed a difference between earlier stages of CKD and post‐transplant recipient (Chi² = 8.38, df = 1 (P = 0.004), I² = 88.1%), but not for earlier stages of CKD and dialysis patients (Chi² = 0.00, df = 1 (P = 1.00), I² = 0%) or dialysis patients and post‐transplant recipients (Chi² = 3.68, df = 1 (P = 0.06), I² = 72.8%).
Duration
In short‐term studies (< 4 weeks), reducing salt intake reduced both systolic (Analysis 2.2.1 (3 studies, 144 participants): MD ‐7.91 mm Hg, 95% CI ‐11.53 to ‐4.28; I² = 0%) and diastolic BP (Analysis 2.3.1 (3 studies, 144 participants): MD ‐3.70 mm Hg, 95% CI ‐5.74 to ‐1.67; I² = 0%). In longer‐term studies (≥ 4 weeks), reducing salt intake reduced both systolic (Analysis 2.2.2 (16 studies, 1117 participants): MD ‐6.82 mm Hg, 95% CI ‐9.00 to ‐4.64; I² = 56%) and diastolic BP (Analysis 2.3.2 (16 studies, 1113 participants): MD ‐3.99 mm Hg, 95% CI ‐5.03 to ‐2.94; I² = 32%; .2).
2.2. Analysis.

Comparison 2: Duration, Outcome 2: Systolic blood pressure
2.3. Analysis.
Comparison 2: Duration, Outcome 3: Diastolic blood pressure
The tests for subgroup differences showed no difference between short‐ and longer‐term studies for both systolic (Chi² = 0.25, df = 1 (P = 0.6155), I² = 0%) and diastolic BP (Chi² = 0.06, df = 1 (P = 0.8073), I² = 0%).
Urinary protein excretion
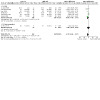
Reducing salt intake reduced 24‐hour urinary protein excretion in the earlier stages of CKD (Analysis 1.4 (6 studies, 436 participants): MD ‐0.41 ln mg/day, 95% CI ‐0.58 to ‐0.25; I² = 78%) corresponding to an average percentage difference of ‐33.9% (95% CI ‐44.1 to ‐21.9) from the high salt to the low salt intervention.
1.4. Analysis.
Comparison 1: CKD stage, Outcome 4: Proteinuria [ln mg/d]
Three studies could not be entered into the pooled analysis (de Vries 2016; Konishi 2001; Mulhauser 1996). Konishi 2001 reported a reduction in median protein excretion with salt restriction (P = 0.004, 38 CKD participants) equivalent to a 27% reduction. de Vries 2016 found no effect on urinary protein excretion (P = 0.9, 22 post‐transplant participants). Mulhauser 1996 reported no significant difference in proteinuria between the low salt group and the high salt group (P > 0.05 using analysis of covariance adjusted for baseline values), although the analysis method may have been inappropriate as it is likely that data were not normally distributed (mean (range) values g/day end of run‐in low salt: 1 (0.06 to 1.92) High salt: 0.71 (0.06 to 2.31); end of intervention: low salt 0.79 (0.1 to 1.39) high salt 1.14 (0.1 to 5.06)).
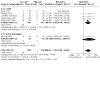
Reducing salt intake reduced 24‐hour urinary albumin excretion (Analysis 1.5 (6 studies, 501 participants): MD ‐0.44 ln mg/day, 95% CI ‐0.58 to ‐0.3; I² = 29%; high certainty evidence) corresponding to an average percentage difference of ‐35.6 (95% CI ‐44.2 to ‐25.7) from the high salt to the low salt intervention.
1.5. Analysis.

Comparison 1: CKD stage, Outcome 5: Albuminuria [ln mg/d]
All six studies reporting 24‐hour urinary protein (520 participants) were in the earlier stages of CKD and all but one (LowSALT CKD 2012) were of longer‐term duration.
Most studies reporting 24‐hour urinary albumin were in the earlier stages of CKD (except de Vries 2016 which is in post‐transplant) and most were of longer‐term duration (except LowSALT CKD 2012).
Measures of kidney function
Measures of kidney function reported by the included studies included eGFR, SCr, CrCl, effective renal plasma flow, and filtration fraction. Mulhauser 1996 reported no significant effect on renal parameters including eGFR, CrCl, effective renal plasma flow, filtration fraction or renal vascular resistance (P > 0.05 using analysis of covariance adjusted for baseline values) but data could not be pooled as values were reported as mean and range.
Estimated glomerular filtration rate
Reducing salt intake made little or no difference to eGFR (Analysis 1.6 (7 studies, 559 participants): MD ‐0.82 mL/min/1.73 m², 95% CI ‐2.31 to 0.66; I² = 0%). Of the seven studies that reported eGFR, all but one (de Vries 2016, post‐transplant) were in the earlier stages of CKD and all but one (LowSALT CKD 2012) were of longer‐term duration. Results were similar if including only earlier stages of CKD or in longer‐term studies only. Results did not change when analysed using fixed effects.
1.6. Analysis.

Comparison 1: CKD stage, Outcome 6: eGFR [mL/min/1.73 m2]
Creatinine clearance
Reducing salt intake reduced CrCl (Analysis 1.7 (7 studies, 529 participants): MD ‐4.70 mL/min, 95% CI ‐6.94 to ‐2.47; I² = 0%). DUAAAL 2011 (52 participants) analysed log‐transformed CrCl and reported the results as geometric means with a significant reduction from 72 (62 to 84) mL/min in high salt to 66 (57 to 76) mL/min in low salt (P = 0.002).
1.7. Analysis.
Comparison 1: CKD stage, Outcome 7: Creatinine clearance
The test for subgroup differences showed no difference between short‐ and longer‐term studies in CrCl (Chi² = 0.96, df = 1 (P = 0.33), I² = 0%). Results did not change when analysed using fixed versus random effects.
Serum creatinine
Reducing salt intake increased SCr (Analysis 1.8 (7 studies, 519 participants): MD 4.46 μmol/L, 95% CI 0.08 to 8.83; I² = 24%). de Vries 2016 analysed log transformed SCr and found no effect with salt restriction (MD ln ‐0.02 mg/dL, 95% CI ‐0.03 to 0.07 P = 0.4). LowSALT CKD 2012 reported a significant increase in SCr (μmol/L) from median 149 (IQR 135–230) with high salt intake to 172 (157–276) with low salt intake (P < 0.05).
1.8. Analysis.

Comparison 1: CKD stage, Outcome 8: Serum creatinine
Effective renal plasma flow
Konishi 2001 (41 participants) reported no significant difference in effective renal plasma flow between low and high salt intake.
Filtration fraction
Reducing salt intake may make little or no difference to filtration fraction in the earlier stages of CKD (Analysis 1.9 (2 studies, 160 participants): MD ‐0.40%, 95% CI ‐0.87 to 0.07; studies = 2; participants = 160; I² = 0%).
1.9. Analysis.
Comparison 1: CKD stage, Outcome 9: Filtration fraction
Body weight
The evidence is very uncertain about the effect of reducing salt intake on body weight (Analysis 1.10 (12 studies, 759 participants): MD ‐1.32 kg, 95% CI ‐1.94 to ‐0.70; I² = 54%; very low certainty evidence).
1.10. Analysis.
Comparison 1: CKD stage, Outcome 10: Weight
CKD stage
In the earlier stages of CKD, reducing salt intake reduced body weight (Analysis 1.10.1 (8 studies, 634 participants): MD ‐1.47 kg, 95% CI ‐2.42 to ‐0.53; I² = 62%). In studies in dialysis patients, reducing salt intake may make little or no difference to body weight (Analysis 1.10.2 (3 studies, 81 participants): MD ‐0.67 kg, 95% CI ‐1.37 to 0.04; I² = 0%). In post‐transplant recipients de Vries 2016 reported reducing salt intake reduced body weight (Analysis 1.10,3 (44 participants): MD ‐2.00 kg, 95% CI ‐3.00 to ‐1.00). The test for subgroup differences showed no differences between the stages of CKD (Chi² = 5.01, df = 2 (P = 0.0819), I² = 60%).
Duration
In both short‐term studies (< 4 weeks) (Analysis 2.6.1 (2 studies, 68 participants): MD ‐0.41 kg, 95% CI ‐0.81 to ‐0.01; I² = 0%) and longer‐term studies (≥ 4 weeks) (Analysis 2.6.2 (10 studies, 691 participants): MD ‐1.53 kg, 95% CI ‐2.02 to ‐1.04; I² = 11%) reducing salt intake reduced body weight. The test for subgroup differences showed no difference between short‐ and longer‐term studies for body weight (Chi² = 12.09, df = 1 (P = 0.0005), I² = 91.7%)
2.6. Analysis.

Comparison 2: Duration, Outcome 6: Weight
Fluid status
Reducing salt intake may reduce extracellular fluid volume in the earlier stages of CKD (Analysis 1.12 (3 studies, 187 participants): MD ‐0.87 L, 95% CI ‐1.17 to ‐0.58; I² = 0%; low certainty evidence). de Brito-Ashurst 2013 reported a significant reduction in mean total body water in the low salt group of 0.50 L (P < 0.01) and no change in the control group (0.26 L, not statistically significant).
Reducing salt intake did not change interdialytic weight gain (Analysis 1.11 (2 studies, 187 participants): MD ‐0.11 kg, 95% CI ‐0.28 to 0.06; I² = 0%). Power 2010 reported intradialytic weight gain was significantly reduced when sodium restriction was combined with low dialysate but did not report results for sodium restriction alone. Catto 1973 did not report intradialytic weight gain; however differences between mean pre‐ and post‐dialysis weights taken over 15 dialysis sessions were similar in the low salt (2.17 kg) and the high salt (2.21 kg) arms.
1.11. Analysis.
Comparison 1: CKD stage, Outcome 11: Inter‐dialytic weight gain
Reducing salt intake reduced oedema in the earlier stages of CKD (Analysis 1.13 (2 studies, 191 participants): RR 0.52, 95% CI 0.31 to 0.90; I² = 0%).
1.13. Analysis.

Comparison 1: CKD stage, Outcome 13: Presence of oedema
Renin‐angiotensin‐aldosterone system and N‐terminal pro‐brain natriuretic peptide stimulation
RAAS stimulation was reported as plasma renin activity, plasma renin, plasma aldosterone and serum aldosterone.
In the earlier stages of CKD reducing salt intake increased plasma renin activity (Analysis 1.14 (2 studies, 142 participants): MD 1.08 ng/mL/h, 95% CI 0.51 to 1.65; studies = 2; participants = 142; I² = 0%) and increased aldosterone (plasma or serum) (Analysis 1.15 (2 studies, 142 participants): MD 6.20 ng/dL, 95% CI 3.82 to 8.58; I² = 0%). Some data on renin and aldosterone could not be pooled; de Vries 2016 reported a significant increase in log transformed plasma aldosterone (MD 0.5 ln pmol/L; 95% CI 0.3 to 0.8; P < 0.001), corresponding to a percentage difference in geometric mean of 65% (35% to 123%) and no significant effect on plasma renin (MD 0.2 ln IU/mL; 95% CI ‐0.1 to 0.5; P = 0.1) in post‐transplant recipients. LowSALT CKD 2012 reported an increase in plasma renin of median 48 pmol/L (interquartile range (IQR) 23.5 to 70.5) and plasma aldosterone by 53.8 mU/L (IQR 4.8 to 74.7) with salt restriction (P < 0.001 for both analyses) in the earlier stages of CKD.
1.14. Analysis.

Comparison 1: CKD stage, Outcome 14: Plasma renin activity
1.15. Analysis.
Comparison 1: CKD stage, Outcome 15: Aldosterone (plasma or serum)
NT‐proBNP results could not be pooled. Two studies in earlier stages of CKD reported a significant reduction in NT‐proBNP with salt restriction; LowSALT CKD 2012 reported that salt restriction reduced NT‐proBNP by 125 pg/mL from median 330 (IQR 167–793) to 205 (124–528) pg/mL (P < 0.05); Vogt 2008 reported salt restriction significantly decreased NT‐proBNP from geometric mean 91 pg/mL (IQR 60 – 137) 62 (IQR 41 – 93) to (P = 0.005). de Vries 2016 reported no significant effect of salt restriction on log‐transformed NT‐proBNP (‐0.1 ln ng/L,95% CI ‐0.4 to 0.1; P = 0.3) in post‐transplant participants.
Change in antihypertensive regimen
Seven studies (664 participants) reported incidence of reduction in antihypertensives with salt restriction (de Vries 2016; DUAAAL 2011; ESPECIAL 2014; Keven 2006; LowSALT CKD 2012; Saran 2017; ViRTUE‐CKD 2016). Three of these reported no changes in either low salt or high salt groups (DUAAAL 2011; ESPECIAL 2014; ViRTUE‐CKD 2016).
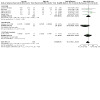
The evidence is very uncertain about the effect of reducing salt intake on antihypertensive medication dosage (Analysis 1.16 (7 studies, 664 participants): RR 2.45, 95% CI 0.98 to 6.08; I² = 12%; very low certainty evidence). Antihypertensive medication dosage were reported by four studies (228 participants; de Vries 2016; Keven 2006; LowSALT CKD 2012; Saran 2017). This may have reduced the effect size of sodium restriction on BP in these studies. There were 20 instances of reduction in antihypertensive dosage in low salt group versus eight in the high salt group. Six of the eight instances in the high salt arm occurred in Saran 2017, and these were mostly in the second arm of the cross‐over study. Saran 2017 also experienced protocol violations with respect to treatment order; 10 of the 56 patients were not receiving the correct treatment in the second arm (six in the first arm), therefore this may have impacted anti‐hypertensive dose. If Saran 2017 is excluded from the analysis, the effect size is larger (RR 5.38, 95% CI 1.45 to 20.01 12 events in low salt and two in high salt arms).
1.16. Analysis.
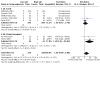
Comparison 1: CKD stage, Outcome 16: Reduction in antihypertensive dose
ESMO 2017 reported the number of antihypertensive medications was not significantly changed with salt restriction (MD 0.0 95% ‐0.3 to 0.2) but did not report change in dosage. Rodrigues Telini 2014 reported there was no significant difference in the number of antihypertensive medications between the groups at follow‐up.
Some studies did not report change in antihypertensive medications but it is reasonable to assume medication changes did not occur due to their study protocols; the study protocols for Kwakernaak 2014 and Vogt 2008 specified keeping medications stable; Konishi 2001 refrained from the use of antihypertensive medications during the study; Ruilope 1992a specified that no medications were given during run‐in and it is likely that this continued (besides the co‐intervention of 240 mg verapamil); Mulhauser 1996 excluded participants taking antihypertensive medications.
Fine 1997 reported that there were no increases to medication in the 10 hypertensive patients during the high salt intervention, but it is unclear whether changes occurred in the low salt intervention or in the other 10 participants. de Brito‐Ashurst 2013 study protocol included salt restriction “in addition to standard hypertension medication management” therefore there may have been changes to medications but measurement of this was not specified. Power 2010 measured antihypertensive dosage but did not report results.
Adverse effects
Potential adverse effects reported included symptomatic hypotension, cramps, and serum cholesterol.
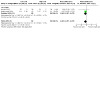
Reducing salt intake may increase symptomatic hypotension (Analysis 1.17 (4 studies, 478 participants): RR 6.70, 95% CI 2.40 to 18.69; I² = 0%; moderate certainty evidence). These were mostly considered mild (ViRTUE‐CKD 2016) or were resolved by lowering the dose of antihypertensive medication (de Vries 2016; LowSALT CKD 2012). This is a potential adverse effect associated with salt restriction, although one that could be rectified by reducing the antihypertensive dose.
1.17. Analysis.
Comparison 1: CKD stage, Outcome 17: Symptomatic hypotension
Power 2010 reported that sodium restriction increased frequency, but not severity, of cramps by 21% (P = 0.04). Catto 1973 reported that administration of slow sodium during dialysis (versus placebo) resulted in a 26% reduction in the frequency (P < 0.05) and 30% in the severity (P < 0.02) of muscle cramps recorded over 15 dialysis sessions.
Reducing salt intake did not change total cholesterol (Analysis 1.18 (7 studies, 473 participants): MD ‐0.11 mmol/L, 95% CI ‐0.31 to 0.10; I² = 0%)
1.18. Analysis.
Comparison 1: CKD stage, Outcome 18: Total cholesterol
Sensitivity analysis
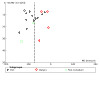
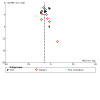
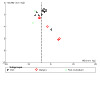
The funnel plots of analyses for sodium intake/excretion (Figure 4), systolic BP (Figure 5) and diastolic BP (Figure 6) were investigated. Studies giving rise to asymmetry for systolic BP (BalanceWise‐PD 2011) and diastolic BP (BalanceWise‐PD 2011; Rodrigues Telini 2014) were removed with no change in direction or effect size.
4.
Funnel plot of comparison: 1 CKD stage, outcome: 1.1 Sodium intake/excretion [mmol/d].
5.
Funnel plot of comparison: 1 CKD stage, outcome: 1.2 Systolic blood pressure [mm Hg].
6.
Funnel plot of comparison: 1 CKD stage, outcome: 1.3 Diastolic blood pressure [mm Hg].
Studies with high risk of bias in more than one domain (BalanceWise‐PD 2011; Saran 2017) were removed. The differences in analyses were mostly minimal except when Saran 2017 was eliminated from antihypertensive dosage reduction analysis as discussed previously (analyses not shown).
Discussion
Summary of main results
We included 21 studies (1197 randomised participants), 12 in the earlier stages of CKD (779 randomised participants), seven in dialysis (363 randomised participants) and two in post‐transplant (55 randomised participants). Included studies had a median study duration of seven weeks (range 1 to 36 weeks) and compared two levels of sodium intake achieved via dietary counselling to reduce salt (13 studies); sodium supplements (six studies) providing food (one study) or unspecified methods (one study).
Reducing salt reduced BP in all stages of CKD. We found that reducing salt intake by approximately 4.2 g/day (73.52 mmol or 1690 mg sodium) lowered BP by 7/4 mm Hg in people with CKD and proteinuria/albuminuria by 34% to 36% in people in the earlier stages of CKD. This is a clinically significant reduction in BP, comparable to expectations of administering a single antihypertensive drug (Law 2009).
In non‐dialysed, non‐transplanted people with CKD, reducing salt intake by 4.8 g/day (84 mmol or 1930 mg sodium) for a median of six weeks duration reduced BP by 6.1/3.5 mm Hg. In dialysed people with CKD reducing salt by 1.6 g/day (27 mmol or 620 mg sodium) for a median of 16 weeks duration reduced BP by 6.3/3.5 mm Hg. In people who had undergone transplantation (two studies 6 and 12 week duration), reducing salt by 5.6 g/day (97 mmol or 2230 mg sodium) reduced BP by 11.9/7.1 mm Hg.
In studies of less than four weeks duration, reducing salt by 6.4 g/day (111 mmol or 2550 mg sodium) reduced BP by 7.9/3.7mm Hg. In studies of four weeks or more duration, reducing salt by 3.7 g/day (64.53 mmol or 1480 mg sodium) reduced BP by 6.8/4.0 mm Hg.
The evidence is very uncertain about the effect of lower salt intake on weight. We found body weight was reduced by 1.3 kg with salt reduction, with a larger reduction in studies over 4 weeks (1.5 kg) than studies under 4 weeks duration (0.4 kg). However, it was not possible to determine the extent to which this weight loss was due to fluid volume, lean tissue, or body fat. Salt restriction resulted in reduced extracellular fluid volume by 0.87 L and a 48% reduced risk of oedema in non‐transplanted people with CKD. Reducing salt intake did not significantly change inter‐dialytic weight gain. Evidence for effects on fluid status was not available for transplanted people with CKD. Reductions in body weight were seen in all stages of CKD with 1.5 kg weight loss in non‐dialysed, non‐transplanted CKD, 0.7 kg in dialysed CKD and 2 kg in transplanted CKD.
Reducing salt intake reduced 24‐hour urinary protein excretion in the earlier stages of CKD by ‐0.41 ln mg/day (95% CI ‐0.58 to ‐0.25) which corresponded to an average percentage difference of ‐33.9% (95% CI ‐44.1 to ‐21.9). Reducing salt intake may reduce extracellular fluid volume and oedema in the earlier stages of CKD but did not alter interdialytic weight gain.
It was found that eGFR was not significantly changed by salt restriction, but salt restriction decreased CrCl by 4.7 ml/min and increased SCr by 4.5 μmol/L. These effects were more pronounced in studies under four weeks duration than those four or more weeks duration, but the difference by duration was not statistically significant.
While reduced salt intake may increase symptomatic hypotension, the evidence is very uncertain about the effect of reducing salt intake on antihypertensive medication dosage.
Overall completeness and applicability of evidence
We aimed to evaluate the benefits and harms of altering dietary salt intake for people with CKD. We could not assess the effect of restricting salt intake on endpoints such as death, cardiovascular events of progression to ESKD in people with CKD because there were no RCTs of adequate size or duration to examine these outcomes. This limitation has been noted in previous reviews in non‐CKD populations (Hooper 2002; Suckling 2010), and may be also in part due to the resources and practical aspects of providing the ongoing and regular support that is needed to achieve long‐term adherence to a sodium‐restricted diet (McMahon 2012a). In practice, supporting patients to achieve this requires an individualised approach tailored to support patients to improve their motivation, knowledge and develop personal coping skills to prevent behaviour change decay over time. More research on these elements are needed. In this review, we identified some ongoing studies with longer intervention durations meaning that we may be able to assess the longer‐term effects on salt restriction in people with CKD in future updates of this review.
While nearly all included studies reported effects of salt restriction on dietary salt intake/excretion and BP, there were limited evidence for effects on kidney function, proteinuria/albuminuria, and fluid status. Subgroup analyses were not possible for many outcomes due to the small number of studies reporting these outcomes. We examined results by stage of CKD and study duration; we were unable to explore other potential sources of heterogeneity such as presence of diabetes mellitus or albuminuria/proteinuria, primary kidney disease, or antihypertensive regimen.
There was a substantial degree of heterogeneity among study results for some outcomes, including sodium intake/excretion, systolic BP, and weight, although this was reduced in subgroup analyses in most cases. A contributor to heterogeneity was inclusion of people across the stages of CKD, including early stage CKD (non‐dialysis), dialysis, and transplant populations. Sodium handling in people with mild CKD is likely to differ considerably from those with severe kidney dysfunction, people on dialysis, and kidney transplant recipients. We analysed outcomes by CKD stage where possible, however this subgroup analysis was limited due to the small number of included studies, particularly in the more advanced stages of CKD. Only two studies included post‐transplant participants and seven in dialysis (two with people receiving PD, four with people receiving HD, one dialysis modality not specified). Other salt restriction studies have been conducted in people undergoing dialysis, but these are either observational (Kayikcioglu 2009), non‐randomised (Ang 1999; Osanai 2002) or used a concomitant intervention in the sodium restricted group (Rupp 1978) and were not eligible for inclusion in this review.
There were important differences in methodology between short‐ (fewer than four weeks) and longer‐term studies (four weeks and more) that limited subgroup analysis according to study duration. Short‐term studies achieved a larger reduction in salt (6.4 g/day; 111 mmol or 2550 mg sodium) than studies of four weeks or longer reducing salt by (3.7 g/day; 64.53 mmol or 1480 mg sodium) but achieved similar reductions in BP (8/4 and 7/4 mm Hg respectively). However short‐term studies used either supplemental sodium (Konishi 2001; LowSALT CKD 2012) or full meal provision (Ruilope 1992a), therefore dietary confounders may have been more tightly controlled than in longer‐term studies which most commonly compared dietary education to reduce salt versus usual diet. A limitation in two of the three short‐term studies was that neither employed a washout period (Konishi 2001; Ruilope 1992a). Considering that these studies had intervention durations of only one week, carry‐over effect may have influenced study results. Ruilope 1992a, a short‐term study, began a new antihypertensive medication on day one of the study, further increasing risk of carry‐over effect.
It is likely that differing magnitude of salt restriction impacted heterogeneity. A previous analysis showed a dose‐response relationship between salt reduction and BP reduction (He 2003). We could not examine differential effects by magnitude of sodium reduction achieved as studies did not report results separately by level of sodium reduction achieved.
Quality of the evidence
We assessed the quality of study evidence using standard risks of bias domains within the Cochrane tool together with GRADE methodology. Confidence in evidence was high for systolic and diastolic BP and albuminuria. Confidence in evidence was low for sodium intake/excretion (substantial heterogeneity), extracellular fluid volume (uncertain or high risk of bias; few participants across all studies) and symptomatic hypotension (few participants across all studies; wide confidence interval range that include benefit or harm). Confidence in evidence was very low for weight (uncertain or high risk of bias; moderate heterogeneity; indirectness of outcome) and reduction in antihypertensive dose (high risk of bias; wide confidence interval range that include benefit or harm).
Potential bias from confounders were mostly due to lack of measurement or failing to adequately report or account for the impact of changes in medications and/or dietary changes such as potassium intake, protein intake and/or weight loss between interventions. Reduction in anti‐hypertensive medications may have led to underestimations of the effect of salt restriction on BP and proteinuria. Studies that provided supplementary sodium (Catto 1973; Doulton 2007; Fine 1997; LowSALT CKD 2012; Mulhauser 1996; Ruilope 1992a) to manage sodium intake were at lower risk of bias from dietary confounders because other dietary factors were likely to remain stable over the study period (McMahon 2012a). Previous research has found that when dietary advice is given about reducing sodium intake, other factors such as energy and potassium intake can also change (Korhonen 2000). This means that studies relying on dietary advice to manage sodium intake (BalanceWise‐HD 2013; BalanceWise‐PD 2011; de Brito‐Ashurst 2013; de Vries 2016; DUAAAL 2011; ESMO 2017; ESPECIAL 2014; Keven 2006; Kwakernaak 2014; Rodrigues Telini 2014; Saran 2017; ViRTUE‐CKD 2016; Vogt 2008) may be at a higher risk of bias from dietary confounders.
It is widely accepted that potassium intake affects BP. Nine of the 19 studies that reported BP as an outcome measured change in potassium intake either directly or indirectly and reported the findings. Seven studies (de Brito‐Ashurst 2013; de Vries 2016; ESMO 2017; Kwakernaak 2014; LowSALT CKD 2012; Mulhauser 1996; ViRTUE‐CKD 2016) reported potassium intake/excretion as unchanged with sodium restriction. DUAAAL 2011 and Ruilope 1992a reported small, but significant, reductions in urinary potassium excretion in the sodium‐restricted groups (3 to 4 mmol/day), which is likely to reflect reduction in urinary volume.
Body weight has also been reported to affect BP and proteinuria (Siebenhofer 2016). Given that most studies did not report change in fluid status, we could not determine the degree to which body weight change observed in included studies was due to reduction in fluid volume or body fat. The latter could introduce bias by overestimating the effect of salt restriction on BP and proteinuria.
Saran 2017 had high risk of bias across several domains due to protocol violation meaning that a large proportion of participants did not receive treatments in the allocated order or did not receive both treatments, incomplete outcome data and potential conflict of interest (due to two study authors holding stock in a company that makes the tool used for primary outcome measurement). Results for were similar when Saran 2017 was excluded for all outcomes anti‐hypertensive dosage reduction; the magnitude of effect was increased when Saran 2017 was excluded.
Potential biases in the review process
This review was conducted according to a pre‐specified protocol and used a highly sensitive search strategy. Inclusion/exclusion and risk of bias was conducted by two independent review authors and we considered evidence certainty in interpretation of the results. All efforts were made to minimise bias inherent in the review process. Study inclusion and risk of bias assessment were carried out by two authors working independently.
In the 2015 review, we contacted all study authors for additional information to inform our risk of bias assessment and received further information for five of the eight included studies (de Brito‐Ashurst 2013; DUAAAL 2011; Konishi 2001; LowSALT CKD 2012; Vogt 2008). Of the 13 additional studies included in this review update, we did not require further information for one study (Kwakernaak 2014); we could not find current contact details to request further information for three studies (Catto 1973; Doulton 2007; Mulhauser 1996); and we contacted study authors of the remaining nine studies and received further information for five studies (BalanceWise‐HD 2013; BalanceWise‐PD 2011; ESMO 2017; ESPECIAL 2014; ViRTUE‐CKD 2016).
We applied a search strategy to include both published and unpublished studies, and were able to include one study where main findings were unpublished (BalanceWise‐PD 2011) and two studies where main findings were published as conference abstracts only (Doulton 2007; Power 2010).
Agreements and disagreements with other studies or reviews
Previous version of this review
This review update included 21 studies with 725 participants in the low salt group and 725 in the high salt group. This is a considerable increase compared with our 2015 review which included eight studies with 224 participants in the low salt group and 218 in the high salt group (McMahon 2015), and we were able to include additional outcomes in this update (proteinuria, albuminuria, inter‐dialytic weight gain). A further difference from the 2015 review is that we included results from paired analyses where available which in most instances led to narrower confidence intervals than when results from unpaired analyses were included. Some key differences in the results of this update compared to the 2015 review are discussed below.
Our 2015 review included six studies in the earlier stages of CKD, one in dialysis, and one post‐transplant. This update includes an additional six studies in the earlier stages of CKD (12 studies total), six in dialysis (seven studies total) and one post‐transplant (two studies total). The additional studies in ESKD in this update improves generalisability of the findings to participants at this stage of kidney disease.
We found a smaller reduction on sodium intake/excretion in included studies in this update (mean 74 mmol/day) compared with the 2015 review (mean 106 mmol/day). This is likely due to an increase in the number of studies examining effectiveness of behavioural and education‐based approaches to reducing salt intake, rather than the efficacy of salt reduction in a controlled setting. Included studies also had a longer intervention duration in this update compared with the 2015 review. Four of the eight included studies in the 2015 review used education to reduce sodium intake compared to 13 of the 21 studies in this update. Of these studies, those in the 2015 review tended to have higher baseline sodium intakes (mean values ranging from 177 to 261 mmol/day) than those added in this update (mean values ranging from 98 to 175 mmol/day), however target sodium intakes for the low salt group were similar, ranging between 50 to 100 mmol/day. This likely contributed to the smaller reduction in sodium seen in this review update versus the 2015 review. The inclusion of studies with lower sodium reduction also likely explains the slightly lower effect on systolic BP. We originally demonstrated that reducing salt intake by approximately 6 g/day (100 mmol or 2300 mg sodium/day) lowered BP by 9/4 mm Hg in people with CKD. In this update, we found that reducing salt intake by approximately 4.2 g/day (73.52 mmol or 1690 mg sodium) lowered BP by 7/4 mm Hg.
In the 2015 review, we did not meta‐analyse the effects on proteinuria and albuminuria due to heterogeneity in outcome reporting. Instead we reported the range of effect in the four studies reporting proteinuria and one reporting albuminuria. In this update, we meta‐analysed the effect of salt restriction on proteinuria (six studies) and albuminuria (six studies) mostly in the earlier stages of CKD, and our findings were consistent with those we reported in the 2015 review.
This update included three additional studies (four total) reporting on extracellular fluid, one (two total) reporting on presence of oedema and four (four total) reporting on intra‐dialytic weight gain. We found significant reductions on extracellular fluid volume and presence of oedema which is an important finding as fluid overload is a strong predictor of cardiovascular events and kidney function decline in CKD (Essig 2008). We also found significant changes in CrCl and body weight in this update, while these were not significantly altered in the 2015 review, although these changes are likely due to changes in BP, proteinuria/albuminuria and fluid status and are unlikely to be clinically significant.
Other reviews in CKD
There have been three reviews of trials of salt restriction in people with CKD published since the 2015 review, including: 1) a narrative review of seven RCTs in non‐dialysed, non‐transplanted CKD participants (Nerbass 2018); 2) a systematic review of 12 randomised and non‐randomised trials achieving at least one gram salt reduction in dialysis participants, and meta‐analysis of the four RCTs (Cole 2019); and 3) a systematic review and meta‐analysis of 11 RCTs in non‐dialysed CKD patients (Garofalo 2018). Agreements and disagreements with the findings of the meta‐analyses are discussed below.
Cole 2019 reported that salt restriction in four RCTs in dialysis reduced systolic/diastolic BP by 8/4. mm Hg. This is slightly higher than the difference in BP in our meta‐analysis of five RCTs in dialysis (8/3 mm Hg), likely due to our inclusion of the BalanceWise‐PD 2011 Study which did not achieve a significant reduction in sodium intake or BP.
Garofalo 2018 reported that a mean 80 mmol/day reduction in sodium excretion reduced ambulatory BP by 6/2 mm Hg and clinic‐assessed BP by 5/3 in 11 RCTs in non‐dialysed CKD patients, similar to our findings of a 6/3 reduction in 12 RCTs in the earlier stages of CKD, and resulted in a 29% mean reduction in proteinuria, similar to our results (34% reduction), and 14% reduction in albuminuria, whereas we found a 37% reduction in our analysis of the same five studies. These are likely due to differences in meta‐analysis methods. We analysed albuminuria as log‐transformed values (which in some cases was made possible only by provision of raw data by study authors), because these data are usually not normally distributed and effect is highly dependent on their baseline values. Garofalo 2018 converted medians and inter‐quartile ranges to means and SD and pooled log‐transformed with untransformed data. Three studies were weighted very low due to wide CI suggesting no effect on albuminuria (Kwakernaak 2014; LowSALT CKD 2012; ViRTUE‐CKD 2016); however these studies all reported clinically and statistically significant effects on albuminuria (P < 0.001). It is likely that the study by Saran 2017 was weighted heavily because log‐transformed values were used, leading to narrower confidence intervals.
Other reviews in non‐CKD
Previous reviews investigating the effect of salt restriction have been conducted in people with normal kidney function, and these consistently show that reducing dietary sodium intake reduces BP, although magnitudes vary (Graudal 2020; He 2013; Hernandez 2018; Hooper 2002). Across these reviews, dietary salt reduction generally has a greater effect on people who are hypertensive (Graudal 2020; He 2013; Hooper 2002). We could not conduct subgroup analyses by hypertensive status as most participants in the included studies were hypertensive and it was rare to report findings separately for hypertensive and normotensive participants. We found a reduction in BP of approximately 7/4 mm Hg with salt reduction of approximately 74 mmol. This is a similar to that found in hypertensive people without CKD; Graudal 2020 reported mean reduction of 6/3 mm Hg with median salt reduction of 145 mmol; Hernandez 2018 found that low‐sodium salt substitutes decreased systolic BP by 8/4 mm Hg, with a 27 mmol decrease in urinary sodium and 13 mmol increase in urinary potassium.
Graudal 2020 also identified that increased serum cholesterol level was an adverse effect in a meta‐analysis of sodium restriction. We found no significant change in total cholesterol in relation to salt restriction in people with CKD.
In a pooled meta‐analysis of people with diabetes, Suckling 2010 reported that CrCl was significantly reduced (‐6.33 mL/min, 95% CI ‐10.47 to ‐2.19) with salt restriction; eGFR was not significantly changed (MD ‐1.92; 95% CI ‐4.49 to 0.64). Our update found similar, with CrCl significantly reducing by 4.46 and that eGFR did not change significantly with salt restriction. It is thought that reductions in CrCl with salt restriction occur as a result of hyperfiltration paradoxically decreasing risk of kidney disease (Allen 1997).
Suckling 2010 found mixed results for the effects of salt restriction on proteinuria in people with diabetes. Aburto 2013 reported urinary protein excretion and albuminuria was reduced with lower sodium intake in a systematic review including two studies in the general population. Our review demonstrated proteinuria to significantly reduce by 34% following salt restriction; this difference was expected as people with CKD are more susceptible to proteinuria.
Authors' conclusions
Implications for practice.
We found a strong case for the benefits of salt restriction in people with CKD. We found that reducing dietary salt considerably reduced BP in people with CKD. We found consistent evidence that dietary salt restriction reduced proteinuria in people with earlier stage (non‐dialysed, non‐transplanted) CKD by 34% to 36%. If such reductions were maintained long‐term, this may translate to clinically significant reductions in ESKD and cardiovascular events.
Reduced salt intake may increase symptomatic hypotension. Data were sparse for other types of adverse events.
Current evidence‐based clinical guidelines recommend a sodium intake target of less than 6 g of salt (100 mmol; 2300 mg sodium) per day for people with CKD, although achieving longer‐term adherence to this target can be challenging for patients without regular and ongoing support to improve their motivation, knowledge and prevent behaviour change decay. These findings were based on studies with intervention durations up to 6 months. There are ongoing studies with longer intervention durations which will strengthen the evidence for longer‐term effects.
Implications for research.
We found that salt reduction in people with CKD reduced BP considerably and consistently reduced proteinuria over a time‐frame of up to 6 months. We found a critical evidence gap in long‐term effects of salt restriction in people with CKD that meant we were unable to determine the direct effects of sodium restriction on critical outcomes such as death and progression to ESKD. If the reductions we found in short‐term studies could be maintained long‐term, these benefits may translate to clinically significant reductions in ESKD incidence and cardiovascular events. Research into longer‐term effects of dietary sodium restriction for people with CKD is warranted, along with investigation of adherence to a low salt diet.
Despite consistent data from observational and non‐randomised studies showing that salt restriction reduced fluid volume in people with CKD, high quality RCTs are lacking. Further research on the effect of salt restriction on other cardiac and vascular abnormalities such as arterial stiffness, left ventricular hypertrophy, inflammation and oxidative stress is warranted.
Future studies investigating salt restriction should employ methods that limit risk of bias due to dietary confounders where possible and should take care to adequately measure dietary intake of not only sodium, but other nutrients that may confound study results. Research into long‐term adherence to a sodium‐restricted diet may assist in translating these results into a practical setting.
What's new
| Date | Event | Description |
|---|---|---|
| 17 June 2021 | New search has been performed | 13 additional studies included |
| 17 June 2021 | New citation required and conclusions have changed | GRADE used to assess the evidence Inclusion criteria modified 1) updated definition of CKD; 2) removed eligibility criterion related to measurement of 24‐hour urine and achieving at least a 34 mmol difference. Previously excluded studies were re‐assessed based on updated eligibility criteria. New analyses: proteinuria; albuminuria; inter‐dialytic weight gain New outcome: muscle cramps Used results from paired analyses where possible |
History
Protocol first published: Issue 9, 2012 Review first published: Issue 2, 2015
Acknowledgements
We would like to acknowledge the Cochrane Kidney and Transplant for providing administrative and support for the conduct of this review, and Brydee Johnston and Rabia Khalid for providing support with data extraction. We would also like to acknowledge the ongoing support from Menzies School of Health Research, University of Queensland, the Princess Alexandra Hospital and the Queensland Government. Emma McMahon is currently supported by a cofunded NHMRC/Australian Heart Foundation Early Career Fellowship (100085) and previously received support from the Australian Government through an Australian Postgraduate Award scholarship. The information and opinions contained in this paper are solely the responsibility of the authors and do not necessarily reflect the views or policy of NHMRC, Australian Heart Foundation, Menzies School of Health Research, University of Queensland, Griffith University, the Princess Alexandra Hospital and the Queensland Government.
The authors are grateful to the following peer reviewers for their time and comments: Ronald L. Koretz, M.D. Emeritus Professor of Clinical Medicine, David Geffen‐UCLA School of Medicine, Los Angeles, California, USA; Retired Chief, Division of Gastroenterology, Olive View‐UCLA Medical Center, Sylmar, California, USA; Colin H Jones, Consultant Physician and Nephrologist, York Teaching Hospital NHS Foundation Trust.
Appendices
Appendix 1. Electronic search strategies
| Database | Search terms |
| CENTRAL |
|
| MEDLINE |
|
| EMBASE |
|
Appendix 2. Risk of bias assessment tool
| Potential source of bias | Assessment criteria |
|
Random sequence generation Selection bias (biased allocation to interventions) due to inadequate generation of a randomised sequence |
Low risk of bias: Random number table; computer random number generator; coin tossing; shuffling cards or envelopes; throwing dice; drawing of lots; minimization (minimization may be implemented without a random element, and this is considered to be equivalent to being random). |
| High risk of bias: Sequence generated by odd or even date of birth; date (or day) of admission; sequence generated by hospital or clinic record number; allocation by judgement of the clinician; by preference of the participant; based on the results of a laboratory test or a series of tests; by availability of the intervention. | |
| Unclear: Insufficient information about the sequence generation process to permit judgement. | |
|
Allocation concealment Selection bias (biased allocation to interventions) due to inadequate concealment of allocations prior to assignment |
Low risk of bias: Randomisation method described that would not allow investigator/participant to know or influence intervention group before eligible participant entered in the study (e.g. central allocation, including telephone, web‐based, and pharmacy‐controlled, randomisation; sequentially numbered drug containers of identical appearance; sequentially numbered, opaque, sealed envelopes). |
| High risk of bias: Using an open random allocation schedule (e.g. a list of random numbers); assignment envelopes were used without appropriate safeguards (e.g. if envelopes were unsealed or non‐opaque or not sequentially numbered); alternation or rotation; date of birth; case record number; any other explicitly unconcealed procedure. | |
| Unclear: Randomisation stated but no information on method used is available. | |
|
Blinding of participants and personnel Performance bias due to knowledge of the allocated interventions by participants and personnel during the study |
Low risk of bias: No blinding or incomplete blinding, but the review authors judge that the outcome is not likely to be influenced by lack of blinding; blinding of participants and key study personnel ensured, and unlikely that the blinding could have been broken. |
| High risk of bias: No blinding or incomplete blinding, and the outcome is likely to be influenced by lack of blinding; blinding of key study participants and personnel attempted, but likely that the blinding could have been broken, and the outcome is likely to be influenced by lack of blinding. | |
| Unclear: Insufficient information to permit judgement | |
|
Blinding of outcome assessment Detection bias due to knowledge of the allocated interventions by outcome assessors. |
Low risk of bias: No blinding of outcome assessment, but the review authors judge that the outcome measurement is not likely to be influenced by lack of blinding; blinding of outcome assessment ensured, and unlikely that the blinding could have been broken. |
| High risk of bias: No blinding of outcome assessment, and the outcome measurement is likely to be influenced by lack of blinding; blinding of outcome assessment, but likely that the blinding could have been broken, and the outcome measurement is likely to be influenced by lack of blinding. | |
| Unclear: Insufficient information to permit judgement | |
|
Incomplete outcome data Attrition bias due to amount, nature or handling of incomplete outcome data. |
Low risk of bias: No missing outcome data; reasons for missing outcome data unlikely to be related to true outcome (for survival data, censoring unlikely to be introducing bias); missing outcome data balanced in numbers across intervention groups, with similar reasons for missing data across groups; for dichotomous outcome data, the proportion of missing outcomes compared with observed event risk not enough to have a clinically relevant impact on the intervention effect estimate; for continuous outcome data, plausible effect size (difference in means or standardized difference in means) among missing outcomes not enough to have a clinically relevant impact on observed effect size; missing data have been imputed using appropriate methods. |
| High risk of bias: Reason for missing outcome data likely to be related to true outcome, with either imbalance in numbers or reasons for missing data across intervention groups; for dichotomous outcome data, the proportion of missing outcomes compared with observed event risk enough to induce clinically relevant bias in intervention effect estimate; for continuous outcome data, plausible effect size (difference in means or standardized difference in means) among missing outcomes enough to induce clinically relevant bias in observed effect size; ‘as‐treated’ analysis done with substantial departure of the intervention received from that assigned at randomisation; potentially inappropriate application of simple imputation. | |
| Unclear: Insufficient information to permit judgement | |
|
Selective reporting Reporting bias due to selective outcome reporting |
Low risk of bias: The study protocol is available and all of the study’s pre‐specified (primary and secondary) outcomes that are of interest in the review have been reported in the pre‐specified way; the study protocol is not available but it is clear that the published reports include all expected outcomes, including those that were pre‐specified (convincing text of this nature may be uncommon). |
| High risk of bias: Not all of the study’s pre‐specified primary outcomes have been reported; one or more primary outcomes is reported using measurements, analysis methods or subsets of the data (e.g. subscales) that were not pre‐specified; one or more reported primary outcomes were not pre‐specified (unless clear justification for their reporting is provided, such as an unexpected adverse effect); one or more outcomes of interest in the review are reported incompletely so that they cannot be entered in a meta‐analysis; the study report fails to include results for a key outcome that would be expected to have been reported for such a study. | |
| Unclear: Insufficient information to permit judgement | |
|
Carry‐over effect Bias due to treatment order in cross‐over studies |
Low risk of bias: Sufficient time between outcome assessments in the first and second periods to ensure carryover effects are not present; insufficient time between outcome assessments in the first and second periods but treatment order effect accounted for in the analysis (by inclusion of intervention‐by‐time period interactions) |
| High risk of bias: Insufficient time between outcome assessments in the first and second periods to ensure carryover effects are not present and treatment order effect not accounted for in analysis. | |
| Unclear: Insufficient information to permit judgement | |
|
Confounding factors Bias due to differences between groups other than sodium intake |
Low risk of bias: Behavioural factors that are associated with the outcome and covary with dietary sodium (e.g., potassium intake, body weight, anti‐hypertensive medication dosage) are unchanged, or changes were similar between groups, or differences between groups unlikely to modify the intervention effect estimate. |
| High risk of bias: Changes in confounding factors or baseline imbalances likely to have modified intervention effect estimate | |
| Unclear: Insufficient information to permit judgement | |
|
Other bias Bias due to problems not covered elsewhere in the table |
Low risk of bias: The study appears to be free of other sources of bias. |
| High risk of bias: Had a potential source of bias related to the specific study design used; stopped early due to some data‐dependent process (including a formal‐stopping rule); had extreme baseline imbalance; has been claimed to have been fraudulent; had some other problem. | |
| Unclear: Insufficient information to assess whether an important risk of bias exists; insufficient rationale or evidence that an identified problem will introduce bias. |
Data and analyses
Comparison 1. CKD stage.
| Outcome or subgroup title | No. of studies | No. of participants | Statistical method | Effect size |
|---|---|---|---|---|
| 1.1 Sodium intake/excretion | 18 | 1383 | Mean Difference (IV, Random, 95% CI) | ‐73.51 [‐92.76, ‐54.27] |
| 1.1.1 CKD | 12 | 1048 | Mean Difference (IV, Random, 95% CI) | ‐83.81 [‐104.54, ‐63.08] |
| 1.1.2 Dialysis | 4 | 259 | Mean Difference (IV, Random, 95% CI) | ‐27.17 [‐48.59, ‐5.76] |
| 1.1.3 Post‐transplant | 2 | 76 | Mean Difference (IV, Random, 95% CI) | ‐96.99 [‐148.10, ‐45.89] |
| 1.2 Systolic blood pressure | 19 | 1261 | Mean Difference (IV, Random, 95% CI) | ‐6.91 [‐8.82, ‐4.99] |
| 1.2.1 CKD | 12 | 1036 | Mean Difference (IV, Random, 95% CI) | ‐6.10 [‐8.11, ‐4.08] |
| 1.2.2 Dialysis | 5 | 149 | Mean Difference (IV, Random, 95% CI) | ‐6.32 [‐11.04, ‐1.60] |
| 1.2.3 Post‐transplant | 2 | 76 | Mean Difference (IV, Random, 95% CI) | ‐11.94 [‐15.77, ‐8.11] |
| 1.3 Diastolic blood pressure | 19 | 1257 | Mean Difference (IV, Random, 95% CI) | ‐3.91 [‐4.80, ‐3.02] |
| 1.3.1 CKD | 12 | 1032 | Mean Difference (IV, Random, 95% CI) | ‐3.47 [‐4.28, ‐2.65] |
| 1.3.2 Dialysis | 5 | 149 | Mean Difference (IV, Random, 95% CI) | ‐3.46 [‐6.39, ‐0.54] |
| 1.3.3 Post‐transplant | 2 | 76 | Mean Difference (IV, Random, 95% CI) | ‐7.13 [‐9.46, ‐4.79] |
| 1.4 Proteinuria [ln mg/d] | 6 | Mean Difference (IV, Random, 95% CI) | ‐0.41 [‐0.58, ‐0.25] | |
| 1.4.1 CKD | 6 | Mean Difference (IV, Random, 95% CI) | ‐0.41 [‐0.58, ‐0.25] | |
| 1.5 Albuminuria [ln mg/d] | 6 | Mean Difference (IV, Random, 95% CI) | ‐0.44 [‐0.58, ‐0.30] | |
| 1.5.1 CKD | 5 | Mean Difference (IV, Random, 95% CI) | ‐0.47 [‐0.60, ‐0.34] | |
| 1.5.2 Post‐transplant | 1 | Mean Difference (IV, Random, 95% CI) | ‐0.03 [‐0.63, 0.57] | |
| 1.6 eGFR [mL/min/1.73 m2] | 7 | 559 | Mean Difference (IV, Random, 95% CI) | ‐0.82 [‐2.31, 0.66] |
| 1.6.1 CKD | 6 | 515 | Mean Difference (IV, Random, 95% CI) | ‐1.00 [‐2.85, 0.85] |
| 1.6.2 Post‐transplant | 1 | 44 | Mean Difference (IV, Random, 95% CI) | ‐0.50 [‐3.00, 2.00] |
| 1.7 Creatinine clearance | 7 | 529 | Mean Difference (IV, Random, 95% CI) | ‐4.70 [‐6.94, ‐2.47] |
| 1.7.1 CKD | 6 | 485 | Mean Difference (IV, Random, 95% CI) | ‐5.06 [‐7.40, ‐2.72] |
| 1.7.2 Post‐transplant | 1 | 44 | Mean Difference (IV, Random, 95% CI) | ‐1.00 [‐8.50, 6.50] |
| 1.8 Serum creatinine | 7 | 519 | Mean Difference (IV, Random, 95% CI) | 4.46 [0.08, 8.83] |
| 1.8.1 CKD | 6 | 487 | Mean Difference (IV, Random, 95% CI) | 4.86 [0.95, 8.76] |
| 1.8.2 Post‐transplant | 1 | 32 | Mean Difference (IV, Random, 95% CI) | ‐11.00 [‐32.30, 10.30] |
| 1.9 Filtration fraction | 2 | 160 | Mean Difference (IV, Random, 95% CI) | ‐0.40 [‐0.87, 0.07] |
| 1.9.1 CKD | 2 | 160 | Mean Difference (IV, Random, 95% CI) | ‐0.40 [‐0.87, 0.07] |
| 1.10 Weight | 12 | 759 | Mean Difference (IV, Random, 95% CI) | ‐1.32 [‐1.94, ‐0.70] |
| 1.10.1 CKD | 8 | 634 | Mean Difference (IV, Random, 95% CI) | ‐1.47 [‐2.42, ‐0.53] |
| 1.10.2 Dialysis | 3 | 81 | Mean Difference (IV, Random, 95% CI) | ‐0.67 [‐1.37, 0.04] |
| 1.10.3 Post‐transplant | 1 | 44 | Mean Difference (IV, Random, 95% CI) | ‐2.00 [‐3.00, ‐1.00] |
| 1.11 Inter‐dialytic weight gain | 2 | 187 | Mean Difference (IV, Random, 95% CI) | ‐0.11 [‐0.28, 0.06] |
| 1.11.1 Dialysis | 2 | 187 | Mean Difference (IV, Random, 95% CI) | ‐0.11 [‐0.28, 0.06] |
| 1.12 Extracellular fluid volume | 3 | 187 | Mean Difference (IV, Random, 95% CI) | ‐0.87 [‐1.17, ‐0.58] |
| 1.12.1 CKD | 2 | 148 | Mean Difference (IV, Random, 95% CI) | ‐0.89 [‐1.20, ‐0.59] |
| 1.12.2 Dialysis | 1 | 39 | Mean Difference (IV, Random, 95% CI) | ‐0.30 [‐1.87, 1.27] |
| 1.13 Presence of oedema | 2 | 191 | Risk Ratio (M‐H, Random, 95% CI) | 0.52 [0.31, 0.90] |
| 1.13.1 CKD | 2 | 191 | Risk Ratio (M‐H, Random, 95% CI) | 0.52 [0.31, 0.90] |
| 1.14 Plasma renin activity | 2 | 142 | Mean Difference (IV, Random, 95% CI) | 1.08 [0.51, 1.65] |
| 1.14.1 CKD | 2 | 142 | Mean Difference (IV, Random, 95% CI) | 1.08 [0.51, 1.65] |
| 1.15 Aldosterone (plasma or serum) | 2 | 142 | Mean Difference (IV, Random, 95% CI) | 6.20 [3.82, 8.58] |
| 1.15.1 CKD | 2 | 142 | Mean Difference (IV, Random, 95% CI) | 6.20 [3.82, 8.58] |
| 1.16 Reduction in antihypertensive dose | 7 | 664 | Risk Ratio (M‐H, Random, 95% CI) | 2.45 [0.98, 6.08] |
| 1.16.1 CKD | 5 | 588 | Risk Ratio (M‐H, Random, 95% CI) | 1.53 [0.62, 3.78] |
| 1.16.2 Post‐transplant | 2 | 76 | Risk Ratio (M‐H, Random, 95% CI) | 7.52 [1.45, 39.04] |
| 1.17 Symptomatic hypotension | 6 | 478 | Risk Ratio (M‐H, Random, 95% CI) | 6.70 [2.40, 18.69] |
| 1.17.1 CKD | 5 | 433 | Risk Ratio (M‐H, Random, 95% CI) | 6.26 [2.08, 18.81] |
| 1.17.2 Post‐transplant | 1 | 45 | Risk Ratio (M‐H, Random, 95% CI) | 10.54 [0.62, 180.07] |
| 1.18 Total cholesterol | 7 | 473 | Mean Difference (IV, Random, 95% CI) | ‐0.11 [‐0.31, 0.10] |
| 1.18.1 CKD | 5 | 390 | Mean Difference (IV, Random, 95% CI) | ‐0.06 [‐0.30, 0.19] |
| 1.18.2 Dialysis | 1 | 39 | Mean Difference (IV, Random, 95% CI) | ‐0.42 [‐0.99, 0.15] |
| 1.18.3 Post‐transplant | 1 | 44 | Mean Difference (IV, Random, 95% CI) | ‐0.08 [‐0.54, 0.39] |
1.12. Analysis.

Comparison 1: CKD stage, Outcome 12: Extracellular fluid volume
Comparison 2. Duration.
| Outcome or subgroup title | No. of studies | No. of participants | Statistical method | Effect size |
|---|---|---|---|---|
| 2.1 Sodium intake/excretion | 18 | 1383 | Mean Difference (IV, Random, 95% CI) | ‐73.51 [‐92.76, ‐54.27] |
| 2.1.1 Short‐term (< 4 weeks) | 3 | 142 | Mean Difference (IV, Random, 95% CI) | ‐111.29 [‐134.25, ‐88.32] |
| 2.1.2 Longer‐term (≥ 4 weeks) | 15 | 1241 | Mean Difference (IV, Random, 95% CI) | ‐64.53 [‐83.29, ‐45.78] |
| 2.2 Systolic blood pressure | 19 | 1261 | Mean Difference (IV, Random, 95% CI) | ‐6.91 [‐8.82, ‐4.99] |
| 2.2.1 Short‐term (< 4 weeks) | 3 | 144 | Mean Difference (IV, Random, 95% CI) | ‐7.91 [‐11.53, ‐4.28] |
| 2.2.2 Longer‐term (≥ 4 weeks) | 16 | 1117 | Mean Difference (IV, Random, 95% CI) | ‐6.82 [‐9.00, ‐4.64] |
| 2.3 Diastolic blood pressure | 19 | 1257 | Mean Difference (IV, Random, 95% CI) | ‐3.91 [‐4.80, ‐3.02] |
| 2.3.1 Short‐term (< 4 weeks) | 3 | 144 | Mean Difference (IV, Random, 95% CI) | ‐3.70 [‐5.74, ‐1.67] |
| 2.3.2 Longer‐term (≥ 4 weeks) | 16 | 1113 | Mean Difference (IV, Random, 95% CI) | ‐3.99 [‐5.03, ‐2.94] |
| 2.4 Creatinine clearance | 7 | 529 | Mean Difference (IV, Random, 95% CI) | ‐4.70 [‐6.94, ‐2.47] |
| 2.4.1 Short‐term (< 4 weeks) | 2 | 104 | Mean Difference (IV, Random, 95% CI) | ‐5.88 [‐9.14, ‐2.63] |
| 2.4.2 Longer‐term (≥ 4 weeks) | 5 | 425 | Mean Difference (IV, Random, 95% CI) | ‐3.65 [‐6.72, ‐0.58] |
| 2.5 Serum creatinine | 7 | 519 | Mean Difference (IV, Random, 95% CI) | 4.46 [0.08, 8.83] |
| 2.5.1 Short‐term (< 4 weeks) | 1 | 28 | Mean Difference (IV, Random, 95% CI) | 17.68 [‐47.51, 82.87] |
| 2.5.2 Longer‐term (≥ 4 weeks) | 6 | 491 | Mean Difference (IV, Random, 95% CI) | 4.40 [‐0.41, 9.20] |
| 2.6 Weight | 12 | 759 | Mean Difference (IV, Random, 95% CI) | ‐1.32 [‐1.94, ‐0.70] |
| 2.6.1 Short‐term (< 4 weeks) | 2 | 68 | Mean Difference (IV, Random, 95% CI) | ‐0.41 [‐0.81, ‐0.01] |
| 2.6.2 Longer‐term (≥ 4 weeks) | 10 | 691 | Mean Difference (IV, Random, 95% CI) | ‐1.53 [‐2.02, ‐1.04] |
2.1. Analysis.

Comparison 2: Duration, Outcome 1: Sodium intake/excretion
2.4. Analysis.
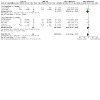
Comparison 2: Duration, Outcome 4: Creatinine clearance
2.5. Analysis.

Comparison 2: Duration, Outcome 5: Serum creatinine
Characteristics of studies
Characteristics of included studies [ordered by study ID]
BalanceWise‐HD 2013.
| Study characteristics | ||
| Methods |
|
|
| Participants |
|
|
| Interventions | Low salt group
High salt group
Co‐interventions
|
|
| Outcomes |
|
|
| Notes |
|
|
| Risk of bias | ||
| Bias | Authors' judgement | Support for judgement |
| Random sequence generation (selection bias) | Low risk | Randomised. Change from baseline reported Quote: "Within each dialysis centre, participants were then randomised using a permuted block algorithm developed by the study statistician." Quote: “Median Kt/V differed somewhat between the groups with attention control group participants being better dialyzed. Otherwise, no significant differences were observed in baseline characteristics of the intervention and attention control group participants." |
| Allocation concealment (selection bias) | Low risk | Randomisation occurred after participants were recruited and baseline measurements collected as above |
| Blinding of participants and personnel (performance bias) All outcomes | Unclear risk | Open‐label study |
| Blinding of outcome assessment (detection bias) All outcomes | Unclear risk | Outcomes were objective. Study staff performed measurements |
| Incomplete outcome data (attrition bias) All outcomes | Low risk | 16% attrition; 8‐week sodium intake data used and this was mostly complete (a lot of missing data at week 16) Quote: "Of the 191 individuals enrolling, 31 (16.2%) did not complete the study. Three individuals withdrew before randomisation, and 3 were excluded post hoc (1 for confusion, 1 was a family relative of another participant, and 1 due to residence in an institutional setting). Of those who continued beyond the baseline assessment, 14 intervention participants and 11 attention control participants did not complete the study for the following reasons: 10 withdrew voluntarily (6 intervention, 4 control); 5 discontinued the study due to illness; 3 died; 3 relocated to a nonparticipating dialysis centre; 2 were admitted to an institutional setting; and 2 were transferred to home HD." "Some participants (16 intervention and 11 attention control) have missing sodium data due to missing dietary recalls, and some have missing IDGWA data due to missing haemodialysis sessions." |
| Selective reporting (reporting bias) | Low risk | Study was registered online and the pre‐specified outcomes were reported |
| Bias from confounders | Unclear risk | Confounding factors not measured/described. Baseline imbalances: Change from baseline reported |
| Other | Low risk | Funding: University of Pittsburgh |
BalanceWise‐PD 2011.
| Study characteristics | ||
| Methods |
|
|
| Participants |
|
|
| Interventions | Low salt group
High salt group
Co‐interventions
|
|
| Outcomes |
|
|
| Notes |
|
|
| Risk of bias | ||
| Bias | Authors' judgement | Support for judgement |
| Random sequence generation (selection bias) | Low risk | Quote: "In the BalanceWise‐PD study, 2 dialysis units participated. Within dialysis centres, participants were stratified according to where they were dialyzed using CAPD versus CCPD, and then randomised within strata." (From email correspondence 23rd July 2019) Baseline values not provided, but change from baseline reported |
| Allocation concealment (selection bias) | Low risk | Randomisation on sequentially assigned participant identification numbers |
| Blinding of participants and personnel (performance bias) All outcomes | Unclear risk | Open‐label study |
| Blinding of outcome assessment (detection bias) All outcomes | High risk | Open‐label study; outcomes self‐recorded |
| Incomplete outcome data (attrition bias) All outcomes | High risk | Considerable missing data; BP > 30%, weight 28%, urine ~50% missing. 19% attrition (5/26) but reasons well explained and unlikely to be due to allocation Quote: "Five participants were lost to follow‐up, due to transfer to another dialysis facility (n = 2), transfer to haemodialysis (n = 1), prolonged hospitalisation (n = 1), or death (n = 1)." |
| Selective reporting (reporting bias) | Low risk | Study was registered online and the pre‐specified outcomes were reported |
| Bias from confounders | Unclear risk | Confounding factors not measured/described. Baseline imbalances: Change from baseline reported |
| Other | Low risk | Funding: University of Pittsburgh; National Institute of Diabetes and Digestive and Kidney Diseases (NIDDK) |
Catto 1973.
| Study characteristics | ||
| Methods |
|
|
| Participants |
|
|
| Interventions | Low salt group
High salt group
|
|
| Outcomes |
|
|
| Notes |
|
|
| Risk of bias | ||
| Bias | Authors' judgement | Support for judgement |
| Random sequence generation (selection bias) | Unclear risk | “Randomised”. Further information not provided |
| Allocation concealment (selection bias) | Unclear risk | Double‐blind, likely concealed, but not described |
| Blinding of participants and personnel (performance bias) All outcomes | Low risk | Double‐blind |
| Blinding of outcome assessment (detection bias) All outcomes | Low risk | Likely that outcome assessors were blinded |
| Incomplete outcome data (attrition bias) All outcomes | Low risk | 12% attrition (2/17), reasons explained Quote:“One patient taking the placebo died from acute bacterial endocarditis and another was withdrawn from the trial while receiving the sodium chloride preparation." "The patient withdrawn from the trial, a 22‐year‐old bachelor, had a long history of erratic behaviour and hypertension that was difficult to control adequately; he was not able to keep to a standard diet or to control his fluid intake and his weight gain between dialyses was excessive. Though his blood pressure at the time was no higher than it had been on many previous occasions it was considered that the additional sodium intake was not justified.” |
| Selective reporting (reporting bias) | Unclear risk | Pre‐specified study protocol not available. Inter‐dialytic weight gain not reported (but mean pre‐ and post‐ dialysis weights reported). Two‐month intervention meaning participants would have had 17‐18 dialysis sessions, but only 15 analysed and further information not specified beyond Quote: “The results obtained from 15 dialyses on a particular treatment were analysed.” |
| Carry‐over effect | Low risk | Sufficient intervention duration to avoid carry‐over effect (2 months) |
| Bias from confounders | Unclear risk | Dietary and medication confounders not described; actual sodium intake or excretion not described |
| Other | Low risk | No competing interests declared. Pharmaceutical company supplied tablets |
de Brito‐Ashurst 2013.
| Study characteristics | ||
| Methods |
|
|
| Participants |
|
|
| Interventions | Low salt group
High salt group
Co‐interventions
|
|
| Outcomes |
|
|
| Notes |
|
|
| Risk of bias | ||
| Bias | Authors' judgement | Support for judgement |
| Random sequence generation (selection bias) | Low risk | Quote: "Randomisation to treatment was conducted by the study statistician using computer‐generated random blocks with block sizes between four and eight" |
| Allocation concealment (selection bias) | Unclear risk | Quote: "Group assignment given to the researcher" Further information not provided |
| Blinding of participants and personnel (performance bias) All outcomes | Unclear risk | Unblinded; objective outcomes unlikely to be affected by performance bias; dietary behaviour may have differed due to lack of blinding |
| Blinding of outcome assessment (detection bias) All outcomes | Low risk | Outcomes were objective and not immediately available, analysis was performed blinded. Quote: “Neither participants nor the dietitian administering the intervention could be blinded to treatment allocation. Data analysis was conducted by the study statistician who was blinded to treatment allocation.” Blinding of participants: no, blinding of investigators: no; blinding of outcomes assessors: no, blinding of data assessors: yes |
| Incomplete outcome data (attrition bias) All outcomes | Low risk | Reasons for attrition unlikely to be related to allocation. 56 participants enrolled; 8 withdrew (14% attrition); unwilling to complete: 24‐hour urine collection (3), BP monitoring (2), attend dietary education (1) lost to follow‐up: death (1); emigration (1) Attrition by allocation: low salt group (3); high salt group (5) |
| Selective reporting (reporting bias) | Low risk | No evidence of outcomes missing from report |
| Bias from confounders | Unclear risk | Intervention is described as salt restriction Quote: "in addition to standard hypertension medication management" but unclear whether changes to medication occurred (or were measured) during follow up. Major confounders (potassium intake, body weight change, physical activity) measured and reported as 'unchanged'. Baseline imbalances: Change from baseline reported |
| Other | Low risk | Funding: PhD scholarship from charitable trust Quote: "this study was funded by a PhD fellowship grant from the trustees of Barts and The London Charitable Foundation. The analysis, interpretation of data, generation of the manuscript and decision to submit for publication were carried out independently of the funding body" |
de Vries 2016.
| Study characteristics | ||
| Methods |
|
|
| Participants |
|
|
| Interventions | Low salt group
High salt group
Other information
|
|
| Outcomes |
|
|
| Notes |
|
|
| Risk of bias | ||
| Bias | Authors' judgement | Support for judgement |
| Random sequence generation (selection bias) | Low risk | Quote: "For allocation, a computer‐generated list of random numbers was used." |
| Allocation concealment (selection bias) | Unclear risk | Insufficient information to permit judgement |
| Blinding of participants and personnel (performance bias) All outcomes | Unclear risk | Dietary interventions were open label |
| Blinding of outcome assessment (detection bias) All outcomes | Unclear risk | Insufficient information to permit judgement |
| Incomplete outcome data (attrition bias) All outcomes | Low risk | Of the 23 who were randomly assigned, 1 patient withdrew halfway through the low‐sodium period because of orthostatic hypotension (This participant was included in the orthostatic hypotension outcome). May have reduced the effect on BP, but only 1/23 participants |
| Selective reporting (reporting bias) | Low risk | No indication of selective reporting |
| Carry‐over effect | Low risk | Adequate intervention duration to reduce risk of carry over effect (6 weeks follow‐up) |
| Bias from confounders | Unclear risk | Antihypertensive dose reduction (5/23 in low salt group) likely to reduce effect on BP; Potassium not significantly changed |
| Other | Low risk | Quote:“Dr Krediet was supported by the innovation grant IP‐11.40 of the Dutch Kidney Foundation.” Quote: “Financial Disclosure: The other authors declare that they have no relevant financial interests.” |
Doulton 2007.
| Study characteristics | ||
| Methods |
|
|
| Participants |
|
|
| Interventions | Low salt group
High salt group
|
|
| Outcomes |
|
|
| Notes |
|
|
| Risk of bias | ||
| Bias | Authors' judgement | Support for judgement |
| Random sequence generation (selection bias) | Unclear risk | “Randomised". Further information not provided. Baseline values not provided |
| Allocation concealment (selection bias) | Low risk | Double blind; allocation concealment not described; likely to have been concealed |
| Blinding of participants and personnel (performance bias) All outcomes | Low risk | "Double blind". Slow sodium versus placebo. No details of placebo matching. |
| Blinding of outcome assessment (detection bias) All outcomes | Low risk | "Double blind". Further information not provided. Some risk of unblinding with outcome measurement |
| Incomplete outcome data (attrition bias) All outcomes | Unclear risk | Attrition not provided. 13 completed; target 20 enrolled. Actual enrolment not provided 24‐hour ambulatory BP outcome unavailable in 2 participants |
| Selective reporting (reporting bias) | Low risk | Study was pre‐registered online and the pre‐specified outcomes were reported. All outcomes reported in abstract |
| Carry‐over effect | Low risk | Adequate intervention duration to reduce risk of carry over effect (4 weeks follow‐up) |
| Bias from confounders | Unclear risk | Measurement of dietary or medication confounders not described; Target weight kept stable during the study; alterations to dialysis prescription not specified |
| Other | Low risk | Funding: British Heart Foundation |
DUAAAL 2011.
| Study characteristics | ||
| Methods |
|
|
| Participants |
|
|
| Interventions | Low salt group
High salt group
Co‐interventions
Other information
|
|
| Outcomes |
|
|
| Notes |
|
|
| Risk of bias | ||
| Bias | Authors' judgement | Support for judgement |
| Random sequence generation (selection bias) | Low risk | Quote: "An independent pharmacist randomised these sequences, using a computer program” |
| Allocation concealment (selection bias) | Unclear risk | Insufficient information to permit judgement |
| Blinding of participants and personnel (performance bias) All outcomes | Unclear risk | Dietary interventions were open label but outcomes were objective and unlikely to be influenced by performance bias |
| Blinding of outcome assessment (detection bias) All outcomes | Unclear risk | Insufficient information to permit judgement |
| Incomplete outcome data (attrition bias) All outcomes | Low risk | Quote: "Additionally, we analysed the data for all 54 patients who were included (intention to treat). As the effect estimates and confidence intervals were very similar and the statistical and clinical conclusions did not change, we have not shown these data" 54 randomised, 2 withdrew after randomisation; 52 included in analysis |
| Selective reporting (reporting bias) | Low risk | Study was pre‐registered online and the pre‐specified outcomes were reported |
| Carry‐over effect | Low risk | Adequate intervention duration to reduce risk of carry‐over effect |
| Bias from confounders | High risk | Medication changes reported and did not occur during placebo phases. Comparison of usual intake versus low sodium intervention increases risk of dietary confounders ‐ reduction in body weight, potassium excretion and urinary urea in low salt phase suggests potential confounding |
| Other | Unclear risk | Funding: study supported by Novartis; declaration of non‐involvement by funder Quote: "Funding: Unrestricted grant from Novartis. No role in the design and conduct of the study; collection, management, analysis, and interpretation of the data; and preparation, review, or approval of the manuscript" |
ESMO 2017.
| Study characteristics | ||
| Methods |
|
|
| Participants |
|
|
| Interventions | Low salt group
High salt group
|
|
| Outcomes |
|
|
| Notes |
|
|
| Risk of bias | ||
| Bias | Authors' judgement | Support for judgement |
| Random sequence generation (selection bias) | Low risk | Quote: “A medical information specialist allocated patients to the intervention or control condition using a computer‐based block randomisation procedure. The number of patients in each condition was predefined, and different sizes of blocks were used to prevent too many patients being consecutively assigned to the same condition.” |
| Allocation concealment (selection bias) | Low risk | Quote: “Only the medical information specialist knew the block sizes. Thereafter, researchers and patients were notified of the allocation.” |
| Blinding of participants and personnel (performance bias) All outcomes | Unclear risk | Outcomes were objective and unlikely to be influenced by performance bias Blinding of participants: no; Blinding of Investigators: no; Blinding of Outcomes assessors: not reported; Blinding of Data assessors: not reported |
| Blinding of outcome assessment (detection bias) All outcomes | Unclear risk | Insufficient information to permit judgement |
| Incomplete outcome data (attrition bias) All outcomes | Low risk | Reasons for attrition unlikely to be related to allocation. Both intention to treat and sensitivity analyses performed Details: between allocation to baseline, 13/151 withdrew (8 in intervention group & 5 in control; not included in intention‐to‐treat analysis). Between baseline to 3‐month follow up, 21/138 withdrew: 8 from intervention group (health problems (4),too busy (1), too much burden (1), participation other study (1); 13 from control group (too much burden and no gain (6), health problems (2), too busy (2), negative experience phlebotomy (1), lost interest (1), no response (1)) |
| Selective reporting (reporting bias) | Low risk | Study was pre‐registered online and the pre‐specified outcomes were reported |
| Bias from confounders | High risk | Body weight change: measured; significant reduction in intervention group (1.5 kg) but may be due to fluid (not measured) Quote: "An explanation for our intervention effect could be that the weight reduction was not sodium specific, but due to weight loss goals that 21 (31%) participants set in addition to sodium goals." Physical activity: not measured; antihypertensive dose: measured; reported not significantly changed; potassium excretion measured and not significantly changed Baseline imbalances: results not reported as change from baseline for each group but were adjusted for baseline values. Some differences between groups in baseline values (higher sodium excretion in control) Crude analyses and analyses performed adjusting for baseline values had similar results. |
| Other | Low risk | Funding: Grants from The Netherlands Organization for Health Research Development ‐ Medical Sciences, the Dutch Kidney Foundation; Conflict of interest: nil |
ESPECIAL 2014.
| Study characteristics | ||
| Methods |
|
|
| Participants |
|
|
| Interventions | Low salt group
High salt group
Co‐interventions
|
|
| Outcomes |
|
|
| Notes |
|
|
| Risk of bias | ||
| Bias | Authors' judgement | Support for judgement |
| Random sequence generation (selection bias) | Low risk | Quote: “Randomly assigned (1:1) to either conventional education or intensive education for LSD with computerized block randomisation (block size six) and balanced according to institution and sex.” |
| Allocation concealment (selection bias) | Low risk | Quote: “It was not feasible to mask participants to allocation, but clinicians were masked to group assignment”. |
| Blinding of participants and personnel (performance bias) All outcomes | Unclear risk | Outcomes were objective and unlikely to be influenced by performance bias; blinding of participants: no; blinding of Investigators: yes; blinding of outcomes assessors: no; blinding of data assessors: unclear |
| Blinding of outcome assessment (detection bias) All outcomes | Low risk | Most outcomes were objective and not immediately available (24‐hour urinary markers) |
| Incomplete outcome data (attrition bias) All outcomes | Low risk | 11/256 (4%) withdrew. Intervention group: 6 withdrawn (withdrew consent (1), adverse events (2), continuous user of steroids (1), missed education (1), follow‐up loss (1)); control group: 5 withdrawn (withdrew consent (1), adverse events (1), diagnosed DM (1), education error (1),follow‐up loss (1)); attrition balanced between groups and unlikely to introduce bias |
| Selective reporting (reporting bias) | Low risk | Study was pre‐registered online and the pre‐specified outcomes were reported |
| Bias from confounders | Unclear risk | Potassium: measured but only reported at baseline; body weight: measured, not reported by group (total change calculated from Ahn 2018 = 0.1 ± 2.2); protein intake not significantly changed; Physical activity: measured at baseline but not follow up; No changes to medications Quote: "During the 16 weeks, no medications were changed, other than olmesartan medoxomil," Quote: “During the study period, hyperkalaemia (range of 5.6–6.2 mEq/L) was detected in five participants (2.0%) after olmesartan treatment. However, all of the hyperkalaemic events were developed before randomisation and corrected with dietary potassium restriction and cation exchange resin” Baseline imbalances: some baseline differences, but unlikely to impact findings and change from baseline values was used for analysis. Details: significant difference at baseline in exercise minutes (intervention group median 0.0 (IQR 0.0; 180.0); control group 120.0 (0.0; 240.0), P = 0.001) and BUN |
| Other | Unclear risk | Funding: This study was funded by Daiichi Sankyo Korea Co. Ltd. And Daewoong Pharmaceutical Co. Ltd. Olmesartan medoxomil was provided by the same pharmaceutical companies for all participants. Conflict of interest: none reported Quote: “the finding that the baseline 24‐hour urinary sodium excretion amount was relatively low compared with the mean value of the Korean population on the basis of the 2011 Korea Health Statistics (18) can be explained by the possibility that somewhat routine LSD education was already applied and emphasized in study populations according to the guidelines for patients with hypertension and proteinuria.” |
Fine 1997.
| Study characteristics | ||
| Methods |
|
|
| Participants |
|
|
| Interventions | Low salt diet
High salt diet
Other information
|
|
| Outcomes |
|
|
| Notes |
|
|
| Risk of bias | ||
| Bias | Authors' judgement | Support for judgement |
| Random sequence generation (selection bias) | Low risk | Quote: “By pharmacy”. Further information not provided; however, low risk of bias due to study design |
| Allocation concealment (selection bias) | Low risk | “Double blind” and medications packaged by pharmacy. Probably concealed |
| Blinding of participants and personnel (performance bias) All outcomes | Low risk | Quote: “Physician, patient, and study nurse were blinded” |
| Blinding of outcome assessment (detection bias) All outcomes | Unclear risk | Quote: “Patients recorded own weights and BP”. Objective outcome; however, introduced attrition and could have unblinded allocation |
| Incomplete outcome data (attrition bias) All outcomes | Unclear risk | 12/32 withdrew (37.5%). Large degree of attrition, even in both groups and well‐explained, however self‐measurement of BP led to some attrition. Details: 32 participants enrolled, 12 withdrew (6 in each intervention), 20 completed and were included for analysis. Reasons for attrition Quote: "Twelve patients. six on salt pills and six on placebo, could not complete both arms of the study for the following reasons: gastrointestinal symptoms (5), itch (1), depression (1), poor record keeping (1), patient decision for no identifiable reason (2), and patient concern about their BP based on single BP readings (2). In one of these two patients, the diastolic BP did not exceed 85, and in the second patient systolic BP did not exceed 160. Their data have been excluded. Twenty patients completed the entire study. The high dropout rate warrants further discussion. This protocol placed considerable demands on these patients. beyond the usual rigours of home dialysis, and in our view, five to six of the dropouts were related to a general apathy that developed during the study. The gastrointestinal symptoms may in part be related to the highly artificial manner in which the salt was given, but the strict design of the study mandated the procedure. To our surprise, two of the five patients whose gastrointestinal intolerance led to withdrawal from the study developed those symptoms when taking placebo." |
| Selective reporting (reporting bias) | Low risk | No evidence of reporting bias |
| Carry‐over effect | Low risk | Sufficient washout |
| Bias from confounders | Unclear risk | Measurement of dietary confounders not described. Medication changes not well reported. Quote: "None of the hypertensive patients had to adjust their medications during the salt period." |
| Other | High risk | Funding: Baxter Healthcare Corporation |
Keven 2006.
| Study characteristics | ||
| Methods |
|
|
| Participants |
|
|
| Interventions | Low salt group
High salt group
Co‐interventions
|
|
| Outcomes |
|
|
| Notes |
|
|
| Risk of bias | ||
| Bias | Authors' judgement | Support for judgement |
| Random sequence generation (selection bias) | Unclear risk | “Randomised". Further information not provided. Considerable difference in baseline BP likely to underestimate effect of intervention with parallel design |
| Allocation concealment (selection bias) | Unclear risk | Insufficient information to permit judgement |
| Blinding of participants and personnel (performance bias) All outcomes | Unclear risk | Open‐label dietary intervention however outcomes were objective and unlikely to be influenced by performance bias |
| Blinding of outcome assessment (detection bias) All outcomes | Unclear risk | Insufficient information to permit judgement |
| Incomplete outcome data (attrition bias) All outcomes | Low risk | Attrition reasons explained; however, attrition for each group not provided. 35 participants began study, 3 withdrew (noncompliance with study visits (1), long‐term hospitalisation secondary to chronic diarrhoea (1), development of chronic allograft nephropathy (1)) |
| Selective reporting (reporting bias) | Unclear risk | No evidence of reporting bias; however, study registration could not be located |
| Bias from confounders | High risk | Confounding factors not measured/described (body weight, potassium, antihypertensive medication changes (7 in low salt group; 1 in high salt group). Highly likely that other dietary factors may have confounded results with unblinded, usual intake versus low sodium, study design. Baseline imbalances: SBP/DBP was 6/3 mm Hg higher in low salt versus high salt group at baseline which may have masked the effect on BP as change from baseline was not reported |
| Other | Unclear risk | Funding: not reported |
Konishi 2001.
| Study characteristics | ||
| Methods |
|
|
| Participants |
|
|
| Interventions | Low salt group
High salt group
Other information
|
|
| Outcomes |
|
|
| Notes |
|
|
| Risk of bias | ||
| Bias | Authors' judgement | Support for judgement |
| Random sequence generation (selection bias) | Unclear risk | Insufficient information to permit judgement |
| Allocation concealment (selection bias) | Unclear risk | Insufficient information to permit judgement |
| Blinding of participants and personnel (performance bias) All outcomes | Unclear risk | Information not provided however outcomes were objective and unlikely to be influenced by performance bias |
| Blinding of outcome assessment (detection bias) All outcomes | Low risk | Information not provided. However, given nature of outcomes (objective and results not available immediately) |
| Incomplete outcome data (attrition bias) All outcomes | Unclear risk | Insufficient information to permit judgement |
| Selective reporting (reporting bias) | Unclear risk | No evidence of reporting bias; however, study registration could not be located |
| Carry‐over effect | Unclear risk | Short interventions with no washout ‐ carry over effect may be present |
| Bias from confounders | Unclear risk | Standardised meals were provided reducing risk of dietary confounders, but as confounders (e.g. potassium intake, weight loss) were not discussed, risk of bias is unclear. Medications not reported but protocol was to refrain from medications |
| Other | Unclear risk | Funding not reported |
Kwakernaak 2014.
| Study characteristics | ||
| Methods |
|
|
| Participants |
|
|
| Interventions | Low salt group
High salt group
Co‐interventions
Other information
|
|
| Outcomes |
|
|
| Notes |
|
|
| Risk of bias | ||
| Bias | Authors' judgement | Support for judgement |
| Random sequence generation (selection bias) | Low risk | Quote: “Independent pharmacist used a computer program to randomise patients in blocks of two. No stratification was needed as the trial has a crossover design. An independent pharmacist randomised treatment sequences. Patients were sequentially enrolled according to moment of recruitment. The randomisation code remained secret during the entire trial” |
| Allocation concealment (selection bias) | Unclear risk | Quote“...drug intervention was double blind, whereas the dietary intervention was open label”. “All patients, investigators, and health‐care providers were masked, apart from the pharmacist who did the randomisation. On completion of the trial, the principal investigator (AJK) provided the pharmacist and the medical ethics committee with a written statement that the trial was completed, after which masking ended” |
| Blinding of participants and personnel (performance bias) All outcomes | Unclear risk | Dietary interventions were open label but outcomes were objective and unlikely to be influenced by performance bias Blinding of participants: yes for drug, no for diet; blinding of investigators: yes for drug, no for diet; blinding of outcomes assessors: yes for drug, no for diet; blinding of data assessors: yes for drug, no for diet |
| Blinding of outcome assessment (detection bias) All outcomes | Unclear risk | The drug intervention was double blind, whereas the dietary intervention was open label |
| Incomplete outcome data (attrition bias) All outcomes | Low risk | 45 randomised; 2 excluded after randomisation, due to onset of malignancy and 1 non‐adherence to sodium restriction; all 45 included in intention‐to‐treat analysis |
| Selective reporting (reporting bias) | Low risk | Study was pre‐registered online and the pre‐specified outcomes were reported |
| Carry‐over effect | Low risk | Quote: "Use of 6‐week treatment periods was based on previous studies from our department in patients with non‐diabetic nephropathy, showing that changes in albuminuria generally stabilise 3–4 weeks after the change in therapy” |
| Bias from confounders | Unclear risk | Potassium: urinary excretion measured and reported unchanged; body weight change: measured and 2 kg significant reduction with low salt; physical activity: not reported; antihypertensive dose: change not reported but protocol to keep stable; urinary urea excretion measured and reported unchanged |
| Other | Low risk | Quote: “No funding was received for this trial. The sponsor of this trial is the University Medical Centre Groningen, Netherlands.” Conflict of interest: nil |
LowSALT CKD 2012.
| Study characteristics | ||
| Methods |
|
|
| Participants |
|
|
| Interventions | Low salt group
High salt group
Other information
|
|
| Outcomes |
|
|
| Notes |
|
|
| Risk of bias | ||
| Bias | Authors' judgement | Support for judgement |
| Random sequence generation (selection bias) | Low risk | Randomisation was performed by an external statistical consultant |
| Allocation concealment (selection bias) | Low risk | Quote: "Study medication was packaged offsite and labelled with the study numbers and intervention order" |
| Blinding of participants and personnel (performance bias) All outcomes | Low risk | Quote: "Participants, investigators, and outcome assessors were blinded to the allocation" |
| Blinding of outcome assessment (detection bias) All outcomes | Low risk | Quote: "Participants, investigators, and outcome assessors were blinded to the results of all outcomes." Quote: "Data analysis was initially performed blinded to treatment order and then was performed unblinded to confirm treatment order" Blinding of participants: all outcomes Blinding of investigators and outcome assessors: serum and urinary markers, 24‐hour BP and clinic BP blinded; arterial stiffness (pulse wave velocity and analysis) unblinded Blinding of data assessors: initial data analysis performed blinded to allocation and urinary sodium data |
| Incomplete outcome data (attrition bias) All outcomes | Low risk | 25% attrition (5/25) Attrition balanced between intervention periods and reasons for attrition well documented and unrelated to study results. Those who withdrew from the study did not differ in age or sex but had significantly higher weight and body mass index values compared with those who completed the study. 25 participants randomised; 5 withdrew; visit schedule too demanding (3), hospital admission unrelated to study (1), symptoms related to pre‐existing medical condition (1). Some data missing for some outcomes but these are well justified Quote: "One patient had missing data for urinary measures (sample not collected, n = 1), and two for fluid measurement (presence of a pacemaker contraindicating measurement [n = 1]; data loss [n = 1])." |
| Selective reporting (reporting bias) | Low risk | Study was pre‐registered online and the pre‐specified outcomes were reported. Data for all outcomes available for inclusion in review |
| Carry‐over effect | Low risk | "To test for ... variation due to treatment order ... analysis of covariance was conducted" No relationship found significant difference. Data analysed for carry over effect |
| Bias from confounders | Low risk | Major confounding factors measured (potassium intake, energy intake, protein intake, body weight, medication changes) and assessed for potential impact on outcomes. Medication changes may have affected outcomes, although likely to underestimate effect size |
| Other | Low risk | Funding by hospital trust and not‐for‐profit organisation. Funding: research grants from the Princess Alexandra Hospital Private Practice Trust Fund and Kidney Health Australia. Study foods provided by Freedom Foods, Norco, Real Foods, Carman’s Fine Foods, Sanitarium Health & Wellbeing Company, Rosella, and Diego’s |
Mulhauser 1996.
| Study characteristics | ||
| Methods |
|
|
| Participants |
|
|
| Interventions | Low salt group
High salt group
Other
|
|
| Outcomes |
|
|
| Notes |
|
|
| Risk of bias | ||
| Bias | Authors' judgement | Support for judgement |
| Random sequence generation (selection bias) | Unclear risk | Not described; some baseline differences but analyses adjusted for baseline values |
| Allocation concealment (selection bias) | Low risk | “Double blind” and medications packaged by pharmacy. Probably concealed |
| Blinding of participants and personnel (performance bias) All outcomes | Low risk | Double blind Quote: “All relevant laboratory results of the blinded study period, including excretion of urinary electrolytes, were kept blinded to patients and investigators until the last patient had finished the study.” |
| Blinding of outcome assessment (detection bias) All outcomes | Low risk | Outcome assessors were blinded |
| Incomplete outcome data (attrition bias) All outcomes | Low risk | No attrition reported after randomisation; no missing data reported |
| Selective reporting (reporting bias) | High risk | Pre‐specified study protocol not available. Many outcomes could not be included in meta‐analyses as they were reported as mean and range and analysed using t‐test (despite values indicating the data were not normally distributed), P values were not reported, adjustment for multiple comparisons occurred but not clear if this applied to all outcomes. Change (from end of run in to end of intervention) reported for BP only, unclear while other outcomes are reported only as values at the end of the intervention. |
| Bias from confounders | Unclear risk | Participants were not on anti‐hypertensive medications; known dietary confounders measured and reported unchanged; weight stable Baseline imbalances: change from baseline not reported. Unable to determine if this would have impacted findings based on information given |
| Other | Unclear risk | Funding: The study has been supported by Cassella Riedel, Frankfurt, Germany, and by the E Klockner Stiftung, Duisburg, Germany. Unclear of role of funding bodies |
Power 2010.
| Study characteristics | ||
| Methods |
|
|
| Participants |
|
|
| Interventions | Low salt group
High salt group
Other information
|
|
| Outcomes |
|
|
| Notes |
|
|
| Risk of bias | ||
| Bias | Authors' judgement | Support for judgement |
| Random sequence generation (selection bias) | Unclear risk | Insufficient information to permit judgement |
| Allocation concealment (selection bias) | Unclear risk | Insufficient information to permit judgement |
| Blinding of participants and personnel (performance bias) All outcomes | Unclear risk | Open‐label study |
| Blinding of outcome assessment (detection bias) All outcomes | Unclear risk | Insufficient information to permit judgement |
| Incomplete outcome data (attrition bias) All outcomes | High risk | 38% attrition (50 entered, 31 analysed; reasons not described; attrition by allocation not stated); unclear if there are missing outcome data |
| Selective reporting (reporting bias) | High risk | Pre‐specified study protocol not available. Results on ambulatory BP and anti‐hypertensive dose for control versus sodium restriction groups not reported Note: abstract‐only publication (requested additional results from study authors but have not received a response) |
| Bias from confounders | Unclear risk | Measurement of confounders not described Baseline imbalances: baseline values not reported |
| Other | Low risk | Disclosure of financial relationships "nothing to describe" |
Rodrigues Telini 2014.
| Study characteristics | ||
| Methods |
|
|
| Participants |
|
|
| Interventions | Low salt group
High salt group
Other information:
|
|
| Outcomes |
|
|
| Notes |
|
|
| Risk of bias | ||
| Bias | Authors' judgement | Support for judgement |
| Random sequence generation (selection bias) | Unclear risk | Not described. Imbalance in group numbers (30 randomised to high salt; 23 to low salt) |
| Allocation concealment (selection bias) | Unclear risk | Insufficient information to permit judgement |
| Blinding of participants and personnel (performance bias) All outcomes | Unclear risk | Open‐label study but outcomes were objective and unlikely to be influenced by performance bias |
| Blinding of outcome assessment (detection bias) All outcomes | Unclear risk | Insufficient information to permit judgement |
| Incomplete outcome data (attrition bias) All outcomes | Unclear risk | 26% attrition (14/53) Quote: “During the follow‐up, 9 of 30 subjects in group A and 5 of 23 in group B were excluded because of acute infections. Therefore, 39 patients (21 in group A and 18 in group B) completed the study period.” |
| Selective reporting (reporting bias) | Low risk | No evidence of selective reporting |
| Bias from confounders | High risk | Potassium: not measured; body weight change; physical activity: not measured; antihypertensive dose: reported not significantly different between groups. Reported energy and protein intake not changed Baseline imbalances: no significant differences at baseline, but there are clinically significant differences in the mean values. Change from baseline not reported, therefore baseline imbalances can bias estimated effect size when using values at the end of the intervention. SBP/DBP is 7/3 mm Hg higher at baseline in intervention than control. Using end of intervention mean change is 1.7/‐3.78, using change from baseline 8.2/‐0.8 |
| Other | Low risk | Funding: São Paulo Research Foundation; Conflict of interest: None declared |
Ruilope 1992a.
| Study characteristics | ||
| Methods |
|
|
| Participants |
|
|
| Interventions | Low salt group
High salt group
Other details
|
|
| Outcomes |
|
|
| Notes |
|
|
| Risk of bias | ||
| Bias | Authors' judgement | Support for judgement |
| Random sequence generation (selection bias) | Unclear risk | “Randomised”, no further information provided |
| Allocation concealment (selection bias) | Unclear risk | Insufficient information to permit judgement |
| Blinding of participants and personnel (performance bias) All outcomes | Unclear risk | Information not provided, but outcomes were objective and unlikely to be influenced by performance bias |
| Blinding of outcome assessment (detection bias) All outcomes | Unclear risk | Insufficient information to permit judgement |
| Incomplete outcome data (attrition bias) All outcomes | Unclear risk | Insufficient information to permit judgement |
| Selective reporting (reporting bias) | Unclear risk | No evidence of reporting bias; however, study registration not available |
| Carry‐over effect | High risk | Addition of antihypertensive medication on study day 1; short study duration and lack of washout meant that carry over effect was likely |
| Bias from confounders | Unclear risk | Unable to assess using information provided; no indication of medication adherence; difference in sodium intake larger than intended suggesting some protocol deviation. |
| Other | Unclear risk | Insufficient information to permit judgement |
Saran 2017.
| Study characteristics | ||
| Methods |
|
|
| Participants |
|
|
| Interventions | Low salt group
High salt group
Other information
|
|
| Outcomes |
|
|
| Notes |
|
|
| Risk of bias | ||
| Bias | Authors' judgement | Support for judgement |
| Random sequence generation (selection bias) | Unclear risk | Insufficient information to permit judgement |
| Allocation concealment (selection bias) | High risk | Quote: “Randomization was performed using sealed envelopes at each site.” However allocation sequence not followed Quote: “Of the 21 patients enrolled at UNC, six were given treatment in the reverse sequence from the randomised assignment for unknown reasons." |
| Blinding of participants and personnel (performance bias) All outcomes | High risk | Quote: “Study investigators were blinded to assigned treatment, which was only known to study dieticians and coordinators” Blinding of participants: no; blinding of investigators: yes; blinding of outcomes assessors: unclear; blinding of data assessors: unclear Lack of blinding may have led to protocol deviation Quote: “Of the 21 patients enrolled at UNC, six were given treatment in the reverse sequence from the randomised assignment for unknown reasons. In addition, four patients who were initially randomised to the SRD in phase 1 had poor compliance and, in violation of the protocol, were encouraged to continue the SRD in phase 2.” |
| Blinding of outcome assessment (detection bias) All outcomes | Unclear risk | Insufficient information to permit judgement |
| Incomplete outcome data (attrition bias) All outcomes | High risk | 3 participants withdrew 2 Illness unrelated to intervention; 1 for personal reasons (some data included for the latter). Incomplete outcome data as evidenced by supplementary table S3 (e.g. different in number for SBP & DBP, only 10/21 participants at one of the sites with urinary albumin), have contacted authors for further information |
| Selective reporting (reporting bias) | Unclear risk | No evidence of reporting bias in terms of outcomes not reported; incomplete outcome data evident for some outcomes and unexplained |
| Carry‐over effect | Low risk | 2‐week washout; analysed both treatment orders & found no treatment order effect |
| Bias from confounders | Unclear risk | Potassium: measured, have requested data. Body weight change: measured, significant change & higher than body water loss, may have influenced outcomes Physical activity: not measured Antihypertensive dose: measured & change reported. Quote: "At enrolment, 48 patients were taking at least one antihypertensive medication, with 77% taking two or more and 48% taking three or more. During the study, 12 patients discontinued 27 medications; eight patients discontinued 15 medications during the SRD phase compared with six patients (and 12 medications) during the usual diet phase. The majority (75%) of the changes during the usual diet phase occurred during phase 2, after the SRD phase." |
| Other | High risk | Funding: Renal Research Institute and grant from the National Center for Research Resources (NCRR) Conflict of interest: Two study authors (N Levin and P Kotanko) hold stock in Fresenius Medical Care, which makes the machine used to assess the primary outcome. Protocol deviation: “Of the 21 patients enrolled at UNC, six were given treatment in the reverse sequence from the randomised assignment for unknown reasons. In addition, four patients who were initially randomised to the SRD in phase 1 had poor compliance and, in violation of the protocol, were encouraged to continue the SRD in phase 2.” |
ViRTUE‐CKD 2016.
| Study characteristics | ||
| Methods |
|
|
| Participants |
|
|
| Interventions | Low salt group
High salt group
Co‐interventions
Other information
|
|
| Outcomes |
|
|
| Notes |
|
|
| Risk of bias | ||
| Bias | Authors' judgement | Support for judgement |
| Random sequence generation (selection bias) | Low risk | Quote: “To prevent systematic errors resulting from the crossover design, the order of the treatment periods was randomised (1:1:1:1) for each patient. Four different treatment sequences were defined.” “Randomization of these sequences was performed externally by the pharmaceutical company that delivered the study medication (AbbVie)”. |
| Allocation concealment (selection bias) | Low risk | Quote: “Computer‐generated randomisation was performed by AbbVie. The investigators (C.A.K. and G.F.v.B.) enrolled participants. Patients received study medication containers labelled with a unique number representing the randomly allocated sequence, whereby all participants and involved investigators and care providers remained blinded to the study medication type (paricalcitol or placebo) throughout the entire study. Assignment of the treatment order was not disclosed until the study database was locked. The dietary intervention was open label.” |
| Blinding of participants and personnel (performance bias) All outcomes | Unclear risk | Dietary intervention was open label but outcomes were objective and unlikely to be influenced by performance bias Blinding of participants: yes for medication, no for diet; blinding of investigators: yes for medication, no for diet; blinding of outcomes assessors: yes for medication, no for diet; blinding of data assessors: yes for medication, no for diet |
| Blinding of outcome assessment (detection bias) All outcomes | Unclear risk | Lab personnel assessing proteinuria were not aware of allocation; study personnel that assessed BP, weight, oedema were aware of allocation. |
| Incomplete outcome data (attrition bias) All outcomes | Low risk | 3 patients excluded after randomisation, however all included in intention‐to‐treat analysis |
| Selective reporting (reporting bias) | Low risk | Study was pre‐registered online and the pre‐specified outcomes were reported |
| Carry‐over effect | Low risk | Quote: “8‐week period was long enough to minimize potential carryover” |
| Bias from confounders | Unclear risk | Potassium: measured and reported no change; body weight change: 2 kg weight loss with sodium restriction, difficult to determine if due to fluid; physical activity: not reported; antihypertensive medications: no changes to medication reported during placebo period |
| Other | Low risk | Funding: AbbVie (Chicago, IL) funded the study medication (paricalcitol and placebo) Quote: “This trial was supported by a consortium grant from the Dutch Kidney Foundation (NIGRAM Consortium grant CP10.11).H.J.L.H. is supported by a grant from The Netherlands Organization for Scientific Research (Veni and Vidi grants). M.H.d.B. is supported by personal grants from the Dutch Kidney Foundation (grant no. KJPB.08.07) and the Netherlands Organization for Scientific Research (Veni grant). The funding source had no role in the design and conduct of the study; collection, management, analysis, and interpretation of the data; or preparation, review, or approval of the manuscript.” |
Vogt 2008.
| Study characteristics | ||
| Methods |
|
|
| Participants |
|
|
| Interventions | Low salt group
High salt group
Other details
|
|
| Outcomes |
|
|
| Notes |
|
|
| Risk of bias | ||
| Bias | Authors' judgement | Support for judgement |
| Random sequence generation (selection bias) | Low risk | Randomisation was conducted by pharmacists using a computer generated model |
| Allocation concealment (selection bias) | Unclear risk | Insufficient information to permit judgement |
| Blinding of participants and personnel (performance bias) All outcomes | Unclear risk | Dietary interventions were open label; outcomes were objective and unlikely to be affected by performance bias |
| Blinding of outcome assessment (detection bias) All outcomes | Unclear risk | Insufficient information to permit judgement |
| Incomplete outcome data (attrition bias) All outcomes | Low risk | Low (3%) attrition and unlikely to introduce bias. 35 were randomised, one withdrew |
| Selective reporting (reporting bias) | Low risk | No evidence of reporting bias |
| Carry‐over effect | Low risk | Sufficient intervention duration to avoid carry‐over effect |
| Bias from confounders | High risk | Reduction in body weight (unable to determine if fluid change) and urinary urea in low salt phase may have confounded results. Change in medication not reported but protocol was to keep stable during the study |
| Other | Low risk | Quote: "The original RCT was supported by Merck Sharp & Dohme (grand MSGP NETH‐15‐01). The second study was supported by an unrestricted grant from Novartis (CVAL489ANL08). The funding bodies had no role in study design, data collection, data analysis or data interpretation." (From Gant 2017) |
ACEi ‐ angiotensin‐converting‐enzyme inhibitor; ACR ‐ albumin:creatinine ratio; ANP ‐ atrial natriuretic peptide; ARB ‐ angiotensin receptor blocker; BMI ‐ body mass index; BP ‐ blood pressure; BUN ‐ blood urea nitrogen; CABG ‐ coronary artery bypass graft; CAPD ‐ continuous ambulatory peritoneal dialysis; CKD ‐ chronic kidney disease; CrCl ‐ creatinine clearance; CRP ‐ C‐reactive protein; CVD ‐ cardiovascular disease; DBP ‐ diastolic BP; DM ‐ diabetes mellitus; eGFR ‐ estimated glomerular filtration rate; ESKD ‐ end‐stage kidney disease; Hb ‐ haemoglobin; HCT ‐ haematocrit; HD ‐ haemodialysis; HDF ‐ haemodiafiltration; IgA ‐ immunoglobulin A; IQR ‐ interquartile range; KRT ‐ kidney replacement therapy; MAP ‐ mean arterial pressure; MDRD ‐ Modification of Diet in Renal Disease; MI ‐ myocardial infarction; Na ‐ sodium; NSAID ‐ nonsteroidal anti‐inflammatory drug; NT‐proBNP ‐ N‐terminal pro‐brain natriuretic peptide; NYHA ‐ New York Heart Association; NSAID ‐ non‐steroidal anti–inflammatory drug/s; PAH ‐ para‐aminohippuric acid; PCI ‐ percutaneous coronary arterial intervention; PD ‐ peritoneal dialysis; PDA ‐ personal digital assistant; RAAS ‐ renin‐angiotensin‐aldosterone system; RCT ‐ randomised controlled trial; RPF ‐ renal plasma flow; SBP ‐ systolic BP; SCr ‐ serum creatinine; SD ‐ standard deviation; UNa ‐ urinary sodium excretion; UTI ‐ urinary tract infection
Characteristics of excluded studies [ordered by study ID]
| Study | Reason for exclusion |
|---|---|
| Chanwikrai 2012 | Wrong intervention: not comparing two or more levels of salt intake; RCT where all groups are advised on low salt and low protein diet |
| Clark‐Cutaia 2016 | Wrong duration: < 1 week; RCT of sodium restriction in dialysis patients with 5‐day follow up |
| DD 2017 | Wrong intervention: concomitant intervention not stable between arms; RCT comparing diuretics versus sodium restriction in CKD |
| De Nicola 2000 | Wrong duration: < 1 week; RCT of differing dialysate sodium concentrations with 68‐hour follow up |
| Esnault 2005 | Wrong intervention: concomitant intervention not stable between arms; cross‐over RCT with 5 arms in proteinuric patients: ramipril at 5 mg/day with usual furosemide dosage and usual sodium intake; ramipril at 10 mg/day with usual furosemide dosage and usual sodium intake; valsartan at 160 mg/day with usual furosemide dosage and usual sodium intake; combined ramipril at 5 mg and valsartan at 80 mg/day with usual furosemide dosage and usual sodium intake; combined ramipril at 5 mg, valsartan at 80 mg/day with increased furosemide dosage & participants asked to avoid excess sodium |
| HHK 2018 | Wrong intervention: concomitant intervention not stable between arms; RCT of multiple behaviour change (physical activity, weight loss, restriction of sodium and phosphate additives) |
| Imanishi 1997 | Wrong intervention: not comparing two levels of salt intake; cross‐over RCT of high versus low salt (1 week), then 2 weeks of ACEi. Comparisons are made only for ACEi versus high salt arms |
| Kauric‐Klein 2012 | Wrong intervention: concomitant intervention not stable between arms; RCT comparing supportive educative nursing intervention to reduce BP versus usual care in HD patients. Intervention goals included sodium restriction, fluid restriction/limiting weight gain between dialysis sessions and medication adherence |
| Li 2013f | Wrong population: cluster RCT comparing education program to reduce sodium plus provision of a salt substitute versus control in rural Chinese villages (not a CKD population); sodium excretion measured at follow up only |
| Reyes 2013 | This study was stopped early and withdrawn 2015 (no reasons provided) |
| Suckling 2016 | Wrong population: RCT of sodium restriction in participants with impaired glucose tolerance and type 2 diabetes mellitus; excludes those with impaired kidney function |
ACEi ‐ angiotensin‐converting‐enzyme inhibitor; BP ‐ blood pressure; CKD ‐ chronic kidney disease; eGFR ‐ estimated glomerular filtration rate; HD ‐ haemodialysis; RCT ‐ randomised controlled trial
Characteristics of ongoing studies [ordered by study ID]
NCT03373500.
| Study name | Effect of dietary salt reduction on blood pressure in kidney transplant recipients |
| Methods |
|
| Participants |
|
| Interventions | Low salt group
High salt group
|
| Outcomes |
|
| Starting date | October 11, 2017 |
| Contact information | Principal Investigator: Pauline Swift |
| Notes | Trial registration: https://clinicaltrials.gov/ct2/show/NCT03373500 Estimated completion date June 2019 |
OxCKD1 2012.
| Study name | OxCKD1 2012 ‐ Empowering healthy lifestyle choices in chronic kidney disease (OxCKD1 2012) |
| Methods |
|
| Participants |
|
| Interventions | Low salt group
High salt group
|
| Outcomes |
|
| Starting date | April 2012 |
| Contact information | Principal Investigator: Christopher A O'Callaghan |
| Notes | Trial registration: https://clinicaltrials.gov/ct2/show/NCT01552317 Listed as Completed November 2014. Emailed study authors on 11 July 2019 to ask if results are available. |
STICK 2015.
| Study name | Sodium intake in chronic kidney disease (STICK) |
| Methods |
|
| Participants |
|
| Interventions | Low salt group
High salt group
|
| Outcomes |
|
| Starting date | March 2016 |
| Contact information | Principal Investigator: Martin J O'Donnell, MB PhD MRCPI National University of Ireland Galway Principal Investigator: Andrew Smyth, MB PhD National University of Ireland Galway |
| Notes | Trial registration: https://clinicaltrials.gov/ct2/show/NCT02458248 Study listed as Active, not recruiting; Estimated Primary Completion Date: August 2020 |
SUBLIME 2020.
| Study name | SodiUm Burden Lowered by Lifestyle Intervention: Self‐Management and E‐health Technology (SUBLIME) |
| Methods |
|
| Participants |
|
| Interventions | Low salt group
High salt group
|
| Outcomes |
|
| Starting date | June 2014 |
| Contact information | Study Chair: Gerjan J Navis, MD PhD University Medical Center Groningen Principal Investigator: Paul JM Van der Boog, MD PhD Leiden University Medical Center Principal Investigator: Sandra Van Dijk, PhD Leiden University Medical Center |
| Notes | Trial registration: https://clinicaltrials.gov/ct2/show/study/NCT02132013 Study listed as completed December 2015 (last updated May 2016); Emailed on 12/6/19 re: availability of results |
SUPER 2016.
| Study name | Sodium lowering and Urinary ProtEin Reduction trial (SUPER) |
| Methods |
|
| Participants |
|
| Interventions | Low salt group
High salt group
|
| Outcomes |
|
| Starting date | June 2014 |
| Contact information | Principal Investigator: Katherine T Mills, PhD, MSPH Tulane University School of Public Health and Tropical Medicine |
| Notes | Trial registration: https://clinicaltrials.gov/ct2/show/NCT02945969 Study not completed (Study completion date March 2020; last updated April 2019) |
ACR ‐ albumin‐creatinine ratio; AKI ‐ acute kidney injury; ACEi ‐ angiotensin‐converting enzyme inhibitors; ARB ‐ angiotensin‐receptor blockers; BMI ‐ body mass index; BP ‐ blood pressure; CKD ‐ chronic kidney disease; CrCl ‐ creatinine clearance; DBP ‐ diastolic blood pressure; eGFR ‐ estimated glomerular filtration rate; KRT ‐ kidney replacement therapy; MDRD ‐ Modification of Diet in Renal Disease; MI ‐ myocardial infarction; Na ‐ sodium; NSAID/s ‐ nonsteroidal anti‐inflammatory drug/s; NYHA ‐ New York Heart Association; RAAS ‐ renin‐angiotensin‐aldosterone system; RCT ‐ randomised controlled trial; SBP ‐ systolic blood pressure; SCr ‐ serum creatinine; UNa ‐ urinary sodium excretion
Differences between protocol and review
2015 review: Outcome sodium excretion was included.
2021 update: Inclusion criteria modified i) updated definition of CKD; ii) removed eligibility criterion related to measurement of 24‐hour urine and achieving at least a 34 mmol difference. Outcome added: muscle cramps.
Contributions of authors
Review protocol: EM, KC, JB, DM
Study selection 2019 update: EM, KC; 2015 review: EM, KC, JB
Data extraction 2019 update: EM; 2015 review: EM, KC
Data analysis: EM
Quality assessment: EM, KC
GRADE assessment: EM, JK, JB
Interpret analysis: EM, KC, JB, DM, JK
Write review: EM, KC, JB, DM, JK
Sources of support
Internal sources
-
Princess Alexandra Hospital, Australia
Salary (DM, KC)
-
University of Queensland, Australia
Salary (JB, EH)
External sources
NHMRC/Australian Heart Foundation Early Career Fellowship (100085), Australia
Declarations of interest
Emma J McMahon: none known
Katrina L Campbell: none known
Judith D Bauer: none known
David W Mudge: none known
Jaimon T Kelly: JK reports consultancy fees from Amgen for travel and professional presentation unrelated to the submitted work.
New search for studies and content updated (conclusions changed)
References
References to studies included in this review
BalanceWise‐HD 2013 {published and unpublished data}
- Clark-Cutaia MN, Ren D, Hoffman LA, Burke LE, Sevick MA. Adherence to hemodialysis dietary sodium recommendations: influence of patient characteristics, self-efficacy, and perceived barriers. Journal of Renal Nutrition 2014;24(2):92-9. [MEDLINE: ] [DOI] [PMC free article] [PubMed] [Google Scholar]
- Clark-Cutaia MN, Ren D, Hoffman LA, Snetselaar L, Sevick MA. Psychometric validation of the self-efficacy for restricting dietary salt in hemodialysis scale. Topics in Clinical Nutrition 2013;28(4):384-91. [EMBASE: 2013726385] [DOI] [PMC free article] [PubMed] [Google Scholar]
- Clark-Cutaia MN, Sevick MA, Thurheimer-Cacciotti J, Hoffman LA, Snetselaar L, Burke LE, et al. Perceived barriers to adherence to hemodialysis dietary recommendations. Clinical Nursing Research 2019;28(8):1009-29. [MEDLINE: ] [DOI] [PubMed] [Google Scholar]
- Hu L, St-Jules DE, Popp CJ, Sevick MA. Determinants and the role of self-efficacy in a sodium-reduction trial in hemodialysis patients. Journal of Renal Nutrition 2019;29(4):328-32. [MEDLINE: ] [DOI] [PMC free article] [PubMed] [Google Scholar]
- Sevick MA, Piraino BM, St-Jules DE, Hough LJ, Hanlon JT, Marcum ZA, et al. No difference in average interdialytic weight gain observed in a randomized trial with a technology-supported behavioral intervention to reduce dietary sodium intake in adults undergoing maintenance hemodialysis in the United States: primary outcomes of the BalanceWise study. Journal of Renal Nutrition 2016;26(3):149-58. [MEDLINE: ] [DOI] [PMC free article] [PubMed] [Google Scholar]
- Stark S, Snetselaar L, Piraino B, Stone RA, Kim S, Hall B, et al. Personal digital assistant-based self-monitoring adherence rates in 2 dialysis dietary intervention pilot studies: BalanceWise-HD and BalanceWise-PD. Journal of Renal Nutrition 2011;21(6):492-8. [MEDLINE: ] [DOI] [PMC free article] [PubMed] [Google Scholar]
- St-Jules DE, Woolf K, Pompeii ML, Sevick MA. Exploring problems in following the hemodialysis diet and their relation to energy and nutrient intakes: the BalanceWise study. Journal of Renal Nutrition 2016;26(2):118-24. [MEDLINE: ] [DOI] [PMC free article] [PubMed] [Google Scholar]
BalanceWise‐PD 2011 {published and unpublished data}
- Koprucki M, Piraino B, Bender F, Snetselaar L, Hall B, Stark S, et al. RCT of Personal Digital Assistant (PDA) supported dietary intervention to reduce sodium intake in PD [abstract no: 162]. American Journal of Kidney Diseases 2010;55(4):A72. [EMBASE: 70124819] [Google Scholar]
- Sevick MA. BalanceWise-PD final progress report redacted (as supplied 14 June 2019). Data on file.
- Stark S, Snetselaar L, Piraino B, Stone RA, Kim S, Hall B, et al. Personal digital assistant-based self-monitoring adherence rates in 2 dialysis dietary intervention pilot studies: BalanceWise-HD and BalanceWise-PD. Journal of Renal Nutrition 2011;21(6):492-8. [MEDLINE: ] [DOI] [PMC free article] [PubMed] [Google Scholar]
Catto 1973 {published data only}
- Catto GR, Smith FW, MacLeod M. Treatment of muscle cramps during maintenance haemodialysis. BMJ 1973;3(5876):389-90. [MEDLINE: ] [DOI] [PMC free article] [PubMed] [Google Scholar]
de Brito‐Ashurst 2013 {published and unpublished data}
- De Brito-Ashurst I, Dobbie H, Raftery MJ, Yaqoob MM. Are hypertensive chronic kidney disease patients salt-sensitive? A randomised controlled study [abstract no: PUB722]. Journal of the American Society of Nephrology 2009;20(Abstract Suppl):990A. [Google Scholar]
- Brito-Ashurst I, Perry L, Sanders TA, Thomas JE, Dobbie H, Varagunam M, et al. The role of salt intake and salt sensitivity in the management of hypertension in South Asian people with chronic kidney disease: a randomised controlled trial. Heart 2013;99(17):1256-60. [MEDLINE: ] [DOI] [PMC free article] [PubMed] [Google Scholar]
- Brito-Ashurst I, Perry L, Sanders TA, Thomas JE, Dobbie H, Yaqoob MM. A dietitian's role in the management of blood pressure: results of a randomised controlled trial in British Bangladeshi chronic kidney disease patients [abstract no: PP077-MON]. Clinical Nutrition Supplements 2012;7(1):168-9. [EMBASE: 70903810] [Google Scholar]
de Vries 2016 {published data only (unpublished sought but not used)}
- Vries LV, Dobrowolski LC, Krediet CTP, Bemelman FJ, Bakker SJ, Navis G. Effect of dietary sodium restriction on blood pressure and urinary protein excretion in renal transplant recipients on RAAS-blockade [abstract no: FR-PO1030]. Journal of the American Society of Nephrology 2015;26(Abstract Suppl):605a. [Google Scholar]
- Vries LV, Dobrowolski LC, den Bosch JJ, Riphagen IJ, Krediet CT, Bemelman FJ, et al. Effects of dietary sodium restriction in kidney transplant recipients treated with renin-angiotensin-aldosterone system blockade: a randomized clinical trial. American Journal of Kidney Diseases 2016;67(6):936-44. [MEDLINE: ] [DOI] [PubMed] [Google Scholar]
Doulton 2007 {published data only}
- Doulton TW, Cassidy A, Wood M, Markandu ND, MacGregor GA. Reducing salt intake by 5 grams a day decreases thirst, inter-dialytic weight gain and blood pressure in haemodialysis patients [abstract]. In: Renal Association Annual Conference; 2007; Brighton, UK. 2007:152.
DUAAAL 2011 {published and unpublished data}50137410
- Humalda JK, Lambers Heerspink HJ, Kwakernaak AJ, Slagman MC, Waanders F, Vervloet MG, et al. Fibroblast growth factor 23 and the antiproteinuric response to dietary sodium restriction during renin-angiotensin-aldosterone system blockade. American Journal of Kidney Diseases 2015;65(2):259-66. [MEDLINE: ] [DOI] [PubMed] [Google Scholar]
- Kwakernaak AJ, Lambert G, Slagman MC, Waanders F, Laverman GD, Petrides F, et al. Proprotein convertase subtilisin-kexin type 9 is elevated in proteinuric subjects: relationship with lipoprotein response to antiproteinuric treatment. Atherosclerosis 2013;226(2):459-65. [MEDLINE: ] [DOI] [PubMed] [Google Scholar]
- Kwakernaak AJ, Waanders F, Slagman MC, Dokter MM, Laverman GD, Boer RA, et al. Sodium restriction on top of renin-angiotensin-aldosterone system blockade increases circulating levels of N-acetyl-seryl-aspartyl-lysyl-proline in chronic kidney disease patients. Journal of Hypertension 2013;31(12):2425-32. [MEDLINE: ] [DOI] [PubMed]
- Slagman MC, Waanders F, Hemmelder MH, Woittiez AJ, Janssen WM, Lambers Heerspink HJ, et al. Moderate dietary sodium restriction added to angiotensin converting enzyme inhibition compared with dual blockade in lowering proteinuria and blood pressure: randomised controlled trial. BMJ 2011;343:d4366. [MEDLINE: ] [DOI] [PMC free article] [PubMed] [Google Scholar]
ESMO 2017 {published and unpublished data}
- Meuleman Y, Hoekstra T, Dekker FW, Navis G, Vogt L, Boog PJ, et al. Sodium restriction in patients with CKD: a randomized controlled trial of self-management support. American Journal of Kidney Diseases 2017;69(5):576-86. [MEDLINE: ] [DOI] [PubMed] [Google Scholar]
ESPECIAL 2014 {published and unpublished data}
- Ahn SY, Kim DK, Han SS, Park JH, Choi B, Lim CS, et al. Weight loss has an additive effect on the anti-proteinuric effects of angiotensin II receptor blockers in hypertensive patients with CKD [abstract no: FR-PO502]. Journal of the American Society of Nephrology 2017;28(Abstract Suppl):531. [EMBASE: 633703439] [Google Scholar]
- Ahn SY, Kim DK, Han SS, Park JH, Shin SJ, Lee SH, et al. Weight loss has an additive effect on the proteinuria reduction of angiotensin II receptor blockers in hypertensive patients with chronic kidney disease. Kidney Research & Clinical Practice 2018;37(1):49-58. [MEDLINE: ] [DOI] [PMC free article] [PubMed] [Google Scholar]
- Ahn SY, Kim DK, Park JH, Shin SJ, Lee SH, Choi BS, et al. Long-term effects of intensive low-salt diet education on deterioration of glomerular filtration rate among non-diabetic hypertensive patients with chronic kidney disease. Kidney & Blood Pressure Research 2019;44(5):1101-14. [MEDLINE: ] [DOI] [PubMed] [Google Scholar]
- An JN, Hwang JH, Lee JP, Chin HJ, Kim S, Kim DK, et al. The decrement of hemoglobin concentration with angiotensin II receptor blocker treatment Is correlated with the reduction of albuminuria in non-diabetic hypertensive patients: post-hoc analysis of ESPECIAL trial. PLoS ONE [Electronic Resource] 2015;10(6):e0128632. [MEDLINE: ] [DOI] [PMC free article] [PubMed] [Google Scholar]
- Baek SH, Kim S, Kim DK, Park JH, Shin SJ, Lee SH, et al. A low-salt diet increases the estimated net endogenous acid production in nondiabetic chronic kidney disease patients treated with angiotensin receptor blockade. Nephron 2014;128(3-4):407-13. [MEDLINE: ] [DOI] [PubMed] [Google Scholar]
- ESPECIAL study investigators. Individual participant data urinary albumin (as supplied 30 May 2019). Data on file.
- Han SS, Bae E, Ahn SY, Kim S, Park JH, Shin SJ, et al. Urinary adiponectin and albuminuria in non-diabetic hypertensive patients: an analysis of the ESPECIAL trial. BMC Nephrology 2015;16:123. [MEDLINE: ] [DOI] [PMC free article] [PubMed] [Google Scholar]
- Hwang JH, Chin HJ, Kim S, Kim DK, Kim S, Park JH, et al. Effects of intensive low-salt diet education on albuminuria among nondiabetic patients with hypertension treated with olmesartan: a single-blinded randomized, controlled trial. Clinical Journal of the American Society of Nephrology: CJASN 2014;9(12):2059-69. [MEDLINE: ] [DOI] [PMC free article] [PubMed] [Google Scholar]
- Lee A, Chin HJ. Long term effects of intensive low salt diet education on deterioration of glomerular filtration rate among non-diabetic hypertensive patients with CKD [abstract no: FR-PO389]. Journal of the American Society of Nephrology 2017;28(Abstract Suppl):501. [EMBASE: 633700111] [Google Scholar]
- Lim CS, Hwang JH, Chin HJ, Kim DK, Kim S, Park JH, et al. Effects of low sodium intake on the antiproteinuric efficacy of olmesartan in hypertensive patients with albuminuria (ESPECIAL): a randomized clinical trial [abstract no: MP146]. Nephrology Dialysis Transplantation 2014;29(Suppl 3):iii376. [EMBASE: 71492549] [Google Scholar]
- Lim CS, Hwang JH, Chin HJ, Kim S, Choi BS. Effects of low sodium intake on the anti-proteinuric efficacy of olmesartan in hypertensive patients with albuminuria [abstract no: SA-PO155]. Journal of the American Society of Nephrology 2013;24(Abstract Suppl):659A. [Google Scholar]
- Yu MY, Kim DK, Park JH, Shin SJ, Lee SH, Choi BS, et al. Albuminuria during treatment with angiotensin type II receptor blocker is a predictor for GFR decline among non-diabetic hypertensive CKD patients. PLoS ONE [Electronic Resource] 2018;13(8):e0202676. [MEDLINE: ] [DOI] [PMC free article] [PubMed] [Google Scholar]
Fine 1997 {published data only}
- Fine A, Fontaine B, Ma M. Commonly prescribed salt intake in continuous ambulatory peritoneal dialysis patients is too restrictive: results of a double-blind crossover study. Journal of the American Society of Nephrology 1997;8(8):1311-4. [MEDLINE: ] [DOI] [PubMed] [Google Scholar]
- Fine A. CAPD patients can take more salt in diet than usually prescribed [abstract]. Nephrology Dialysis Transplantation 1997;12(9):A183. [CENTRAL: CN-00261430] [Google Scholar]
Keven 2006 {published and unpublished data}
- Keven K, Yalcin S, Canbakan B, Kutlay S, Sengul S, Erturk S, et al. The impact of daily sodium intake on posttransplant hypertension in kidney allograft recipients. Transplantation Proceedings 2006;38(5):1323-6. [MEDLINE: ] [DOI] [PubMed] [Google Scholar]
Konishi 2001 {published and unpublished data}
- Konishi Y, Imanishi M, Morikawa T, Teramoto K, Okada N, Okumura M, et al. Relationship of impairment of the renin-angiotensin system and sodium sensitivity of blood pressure in immunoglobulin A (IgA) nephropathy [abstract no: FC2-04]. Nephrology 2003;8(Suppl 1):A16. [CENTRAL: CN-01657789] [Google Scholar]
- Konishi Y, Morikawa T, Yasu T, Teramoto K, Okada N, Yoshioka K, et al. Blunted response of the renin-angiotensin system and nitric oxide synthesis related to sodium sensitivity in immunoglobulin A nephropathy. Hypertension Research - Clinical & Experimental 2004;27(1):7-13. [MEDLINE: ] [DOI] [PubMed] [Google Scholar]
- Konishi Y, Nishiyama A, Morikawa T, Kitabayashi C, Shibata M, Hamada M, et al. Relationship between urinary angiotensinogen and salt sensitivity of blood pressure in patients with IgA nephropathy. Hypertension 2011;58(2):205-11. [MEDLINE: ] [DOI] [PMC free article] [PubMed] [Google Scholar]
- Konishi Y, Okada N, Okamura M, Morikawa T, Okumura M, Yoshioka K, et al. Sodium sensitivity of blood pressure appearing before hypertension and related to histological damage in immunoglobulin A nephropathy. Hypertension 2001;38(1):81-5. [MEDLINE: ] [DOI] [PubMed] [Google Scholar]
Kwakernaak 2014 {published data only}
- Binnenmars SH, Corpeleijn E, Kwakernaak AJ, Touw DJ, Kema IP, Laverman GD, et al. Impact of moderate sodium restriction and hydrochlorothiazide on iodine excretion in diabetic kidney disease: data from a randomized cross-over trial. Nutrients 2019;11(9):2204. [MEDLINE: ] [DOI] [PMC free article] [PubMed] [Google Scholar]
- Humalda JK, Keyzer CA, Binnenmars SH, Kwakernaak AJ, Slagman MC, Laverman GD, et al. Concordance of dietary sodium intake and concomitant phosphate load: Implications for sodium interventions. Nutrition Metabolism & Cardiovascular Diseases 2016;26(8):689-96. [MEDLINE: ] [DOI] [PubMed] [Google Scholar]
- Humalda JK, Seiler-Muler S, Kwakernaak AJ, Vervloet MG, Navis G, Fliser D, et al. Response of fibroblast growth factor 23 to volume interventions in arterial hypertension and diabetic nephropathy. Medicine 2016;95(46):e5003. [MEDLINE: ] [DOI] [PMC free article] [PubMed] [Google Scholar]
- Humalda JK, Seiler S, Kwakernaak AJ, Vervloet MG, Navis G, Heine GH, et al. Response of fibroblast growth factor 23 to sodium interventions in diabetic nephropathy and arterial hypertension [abstract no: PUB535]. Journal of the American Society of Nephrology 2015;26(Abstract Suppl):1012A. [Google Scholar]
- Kwakernaak AJ, Krikken JA, Binnenmars SH, Visser FW, Hemmelder MH, Woittiez AJ, et al. Effects of sodium restriction and hydrochlorothiazide on RAAS blockade efficacy in diabetic nephropathy: a randomised clinical trial. Lancet Diabetes & Endocrinology 2014;2(5):385-95. [MEDLINE: ] [DOI] [PubMed] [Google Scholar]
LowSALT CKD 2012 {published and unpublished data}
- Campbell KL, Johnson DW, Bauer JD, Hawley CM, Isbel NM, Stowasser M, et al. A randomized trial of sodium-restriction on kidney function, fluid volume and adipokines in CKD patients. BMC Nephrology 2014;15(1):57. [MEDLINE: ] [DOI] [PMC free article] [PubMed] [Google Scholar]
- LowSALT CKD study Investigators. Individual patient data (as supplied 24 May 2019). Data on file.
- McMahon E, Bauer J, Hawley C, Isbel N, Stowasser M, Johnson D, et al. Effect of sodium restriction on blood pressure, fluid status and proteinuria in CKD patients: results of a randomised crossover trial and 6-month follow-up [abstract no: 004]. Nephrology 2013;18(Suppl 1):15-6. [CENTRAL: CN-01062204] [EMBASE: 71356987] [Google Scholar]
- McMahon EJ, Bauer JD, Hawley CM, Isbel NM, Stowasser M, Johnson DW, et al. A randomized trial of dietary sodium restriction in CKD. Journal of the American Society of Nephrology 2013;24(12):2096-103. [MEDLINE: ] [DOI] [PMC free article] [PubMed] [Google Scholar]
- McMahon EJ, Bauer JD, Hawley CM, Isbel NM, Stowasser M, Johnson DW, et al. The effect of lowering salt intake on ambulatory blood pressure to reduce cardiovascular risk in chronic kidney disease (LowSALT CKD study): protocol of a randomized trial. BMC Nephrology 2012;13(1):137. [MEDLINE: ] [DOI] [PMC free article] [PubMed] [Google Scholar]
Mulhauser 1996 {published data only}
- Mulhauser I, Prange K, Sawicki PT, Bender R, Dworschak A, Schaden W, et al. Effects of dietary sodium on blood pressure in IDDM patients with nephropathy. Diabetologia 1996;39(2):212-9. [MEDLINE: ] [DOI] [PubMed] [Google Scholar]
Power 2010 {published data only (unpublished sought but not used)}
- Power AJ, Singh S, Edwards C, Tandaric D, Taube D, Duncan ND. A randomized controlled trial of low dialysate and dietary sodium on blood pressure in hemodialysis [abstract no: F-FC320]. Journal of the American Society of Nephrology 2010;21(Abstract Suppl):73A. [Google Scholar]
Rodrigues Telini 2014 {published data only (unpublished sought but not used)}
- Rodrigues Telini LS, Carvalho BG, Caramori JC, Castro JH, Martin LC, Barretti P. Effect of dietary sodium restriction on body water, blood pressure, and inflammation in hemodialysis patients: a prospective randomized controlled study. International Urology & Nephrology 2014;46(1):91-7. [MEDLINE: ] [DOI] [PubMed] [Google Scholar]
Ruilope 1992a {published data only}
- Ruilope LM, Casal MC, Guerrero L, Alcázar JM, Férnandez ML, Lahera V, et al. Sodium intake does not influence the effect of verapamil in hypertensive patients with mild renal insufficiency. Drugs 1992;44 Suppl 1:94-8. [MEDLINE: ] [DOI] [PubMed] [Google Scholar]
Saran 2017 {published data only (unpublished sought but not used)}
- Saran R, Padilla RL, Gillespie BW, Heung M, Hummel SL, Derebail VK, et al. A randomized crossover trial of dietary sodium restriction in stage 3-4 CKD. Clinical Journal of the American Society of Nephrology: CJASN 2017;12(3):399-407. [MEDLINE: ] [DOI] [PMC free article] [PubMed] [Google Scholar]
- Saran R, Sands RL, Gillespie BW, Heung M, Hummel SL, Derebail VK, et al. A crossover trial of lowering dietary sodium (Na) in chronic kidney disease (CKD) [abstract no: FR-OR118]. Journal of the American Society of Nephrology 2012;23(Abstract Suppl):56A. [Google Scholar]
- Saran R, Sands RL, Gillespie BW, Heung M, Hummel SL, Derebail VK, et al. Baseline observations from a randomized crossover trial of lowering sodium intake in chronic kidney disease (CKD)-LOSALT study [abstract no: TH-PO357]. Journal of the American Society of Nephrology 2011;22(Abstract Suppl):195A. [Google Scholar]
ViRTUE‐CKD 2016 {published and unpublished data}
- De Borst MH, Keyzer CA, Breda F, Vervloet MG, Laverman GD, Hemmelder MH, et al. Vitamin D receptor activation and dietary sodium restriction to reduce residual albuminuria in chronic kidney disease [abstract no: SA-PO1106]. Journal of the American Society of Nephrology 2015;26(Abstract Suppl):B7. [Google Scholar]
- Jong MA, Keyzer CA, Breda F, Vervloet MG, Laverman GD, Hemmelder MH, et al. Baseline 25-hydroxyvitamin D level and the anti-albuminuric response to vitamin D receptor activation in patients with chronic kidney disease [abstract no: TH-PO515]. Journal of the American Society of Nephrology 2016;27(Abstract Suppl):210A-1A. [Google Scholar]
- Jong MA, Keyzer CA, Breda F, Vervloet MG, Navis G, Bakker SJ, et al. Effect of vitamin D receptor activation and sodium restriction on calcification propensity and fibroblast growth factor 23: the Virtue-CKD trial [abstract no: TH-PO516]. Journal of the American Society of Nephrology 2016;27(Abstract Suppl):211A. [Google Scholar]
- Keyzer CA, Jong MA, Breda GF, Vervloet MG, Laverman GD, Hemmelder M, et al. Vitamin D receptor activator and dietary sodium restriction to reduce residual urinary albumin excretion in chronic kidney disease (ViRTUE study): rationale and study protocol. Nephrology Dialysis Transplantation 2016;31(7):1081-7. [MEDLINE: ] [DOI] [PubMed] [Google Scholar]
- Keyzer CA, Breda GF, Vervloet MG, Jong MA, Laverman GD, Hemmelder MH, et al. Effects of vitamin D receptor activation and dietary sodium restriction on residual albuminuria in CKD: the ViRTUE-CKD trial. Journal of the American Society of Nephrology 2016;28(4):1296-305. [MEDLINE: ] [DOI] [PMC free article] [PubMed] [Google Scholar]
Vogt 2008 {published and unpublished data}
- Gant CM, Laverman GD, Vogt L, Slagman MC, Heerspink HJ, Waanders F, et al. Renoprotective RAAS inhibition does not affect the association between worse renal function and higher plasma aldosterone levels. BMC Nephrology 2017;18(1):370. [MEDLINE: ] [DOI] [PMC free article] [PubMed] [Google Scholar]
- Krikken JA, Waanders F, Dallinga-Thie GM, Dikkeschei LD, Vogt L, Navis GJ, et al. Antiproteinuric therapy decreases LDL-cholesterol as well as HDL-cholesterol in non-diabetic proteinuric patients: relationships with cholesteryl ester transfer protein mass and adiponectin. Expert Opinion on Therapeutic Targets 2009;13(5):497-504. [MEDLINE: ] [DOI] [PubMed] [Google Scholar]
- Mahmoodi BK, Mulder AB, Waanders F, Spronk HM, Mulder R, Slagman MC, et al. The impact of antiproteinuric therapy on the prothrombotic state in patients with overt proteinuria. Journal of Thrombosis & Haemostasis 2011;9(12):2416-23. [MEDLINE: ] [DOI] [PubMed] [Google Scholar]
- Slagman MC, Kwakernaak AJ, Yazdani S, Laverman GD, den Born J, Titze J, et al. Vascular endothelial growth factor C levels are modulated by dietary salt intake in proteinuric chronic kidney disease patients and in healthy subjects. Nephrology Dialysis Transplantation 2012;27(3):978-82. [MEDLINE: ] [DOI] [PubMed] [Google Scholar]
- Slagman MC, Nguyen TQ, Waanders F, Vogt L, Hemmelder MH, Laverman GD, et al. Effects of antiproteinuric intervention on elevated connective tissue growth factor (CTGF/CCN-2) plasma and urine levels in nondiabetic nephropathy. Clinical Journal of the American Society of Nephrology: CJASN 2011;6(8):1845-50. [MEDLINE: ] [DOI] [PMC free article] [PubMed] [Google Scholar]
- Slagman MC, Sinkeler SJ, Hemmelder MH, Waanders F, Vogt L, Kluin-Nelemans HC, et al. Erythropoietin is reduced by combination of diuretic therapy and RAAS blockade in proteinuric renal patients with preserved renal function. Nephrology Dialysis Transplantation 2010;25(10):3256-60. [MEDLINE: ] [DOI] [PubMed] [Google Scholar]
- Slagman MC, Waanders F, Vogt L, Damman K, Hemmelder M, Navis G, et al. Elevated N-terminal pro-brain natriuretic peptide levels predict an enhanced anti-hypertensive and anti-proteinuric benefit of dietary sodium restriction and diuretics, but not angiotensin receptor blockade, in proteinuric renal patients. Nephrology Dialysis Transplantation 2012;27(3):983-90. [MEDLINE: ] [DOI] [PubMed] [Google Scholar]
- Vogt L, Zeeuw D, Waanders F, Navis G. Independent and added effects of low sodium and diuretic on renoprotective effect of AII antagonist in non-diabetic proteinuric patients [abstract no: TH-FC171]. Journal of the American Society of Nephrology 2005;16:37A. [CENTRAL: CN-00644129] [Google Scholar]
- Vogt L, Waanders F, Boomsma F, Zeeuw D, Navis G. Effects of dietary sodium and hydrochlorothiazide on the antiproteinuric efficacy of losartan. Journal of the American Society of Nephrology 2008;19(5):999-1007. [MEDLINE: ] [DOI] [PMC free article] [PubMed] [Google Scholar]
- Waanders F, Vaidya VS, Goor H, Leuvenink H, Damman K, Hamming I, et al. Effect of renin-angiotensin-aldosterone system inhibition, dietary sodium restriction, and/or diuretics on urinary kidney injury molecule 1 excretion in nondiabetic proteinuric kidney disease: a post hoc analysis of a randomized controlled trial. American Journal of Kidney Diseases 2009;53(1):16-25. [MEDLINE: ] [DOI] [PMC free article] [PubMed] [Google Scholar]
References to studies excluded from this review
Chanwikrai 2012 {published data only}
- Chanwikrai Y, Satirapod B. A randomized controlled trial of dietary and lifestyle modification based on the empowerment approach among chronic kidney disease patients [abstract no: 311]. Kidney Research & Clinical Practice 2012;31(2):A95-6. [EMBASE: 70815020] [Google Scholar]
Clark‐Cutaia 2016 {published data only}
- Clark-Cutaia MN, Reisinger N, Anache MR, Ramos K, Sommers MS, Townsend RR, et al. Feasibility of assessing sodium-associated body fluid composition in end-stage renal disease. Nursing Research 2019;68(3):246-52. [MEDLINE: ] [DOI] [PMC free article] [PubMed] [Google Scholar]
- Clark-Cutaia MN, Sommers MS, Anderson E, Townsend RR. Design of a randomized controlled clinical trial assessing dietary sodium restriction and hemodialysis-related symptom profiles. Contemporary Clinical Trials Communications 2016;3:70-3. [MEDLINE: ] [DOI] [PMC free article] [PubMed] [Google Scholar]
DD 2017 {published data only}
- Bovee DM, Danser AH, Zietse R, Hoorn EJ. Dietary sodium restriction versus diuretics for salt-sensitive hypertension in chronic kidney disease [abstract no: 053]. Hypertension 2018;72(Suppl 1). [EMBASE: 626089737] [Google Scholar]
- Bovee DM, Danser AH, Zietse R, Hoorn EJ. Dietary sodium restriction versus diuretics for salt-sensitive hypertension in CKD [abstract no: TH-OR052]. Journal of the American Society of Nephrology 2017;28(Abstract Suppl):14. [EMBASE: 633699948] [Google Scholar]
- Bovee DM, Visser WJ, Middel I, De Mik-van EA, Greupink R, Masereeuw R, et al. A randomized trial of distal diuretics versus dietary sodium restriction for hypertension in chronic kidney disease. Journal of the American Society of Nephrology 2020;31(3):650-62. [MEDLINE: ] [DOI] [PMC free article] [PubMed] [Google Scholar]
De Nicola 2000 {published data only}
- De Nicola L, Bellizzi V, Minutolo R, Cioffi M, Giannattasio P, Terracciano V, et al. Effect of dialysate sodium concentration on interdialytic increase of potassium. Journal of the American Society of Nephrology 2000;11(12):2337-43. [MEDLINE: ] [DOI] [PubMed] [Google Scholar]
Esnault 2005 {published data only}
- Ekhlas Eid A, Nguyen J, Delcroix C, Moutel M, Esnault VL. Effect of diuretics after dual blockade of renin-angiotensin-aldosterone system on severe proteinuria [abstract]. In: 41st Congress. European Renal Association. European Dialysis and Transplantation Association; 2004 May 15-18; Lisbon, Portugal. 2004:434-5. [CENTRAL: CN-00509172]
- Esnault VL, Ekhlas A, Delcroix C, Moutel MG, Nguyen JM. Diuretic and enhanced sodium restriction results in improved antiproteinuric response to RAS blocking agents. Journal of the American Society of Nephrology 2005;16(2):474-81. [MEDLINE: ] [DOI] [PubMed] [Google Scholar]
- Esnault VL, Ekhlas A, Nguyen JM, Delcroix C, Moutel MG. Angiotensin converting enzyme inhibitors (ACEI), angiotensin receptor blockers (ARB) and diuretics for refractory proteinuria [abstract no: SU-PO1030]. Journal of the American Society of Nephrology 2003;14(Nov):762A. [CENTRAL: CN-00583888] [Google Scholar]
HHK 2018 {published data only}
- Sevick MA, Woolf K, Mattoo A, Katz SD, Li H, St-Jules DE, et al. The Healthy Hearts and Kidneys (HHK) study: Design of a 2x2 RCT of technology-supported self-monitoring and social cognitive theory-based counseling to engage overweight people with diabetes and chronic kidney disease in multiple lifestyle changes. Contemporary Clinical Trials 2018;64:265-73. [MEDLINE: ] [DOI] [PMC free article] [PubMed] [Google Scholar]
Imanishi 1997 {published data only}
- Imanishi M, Yoshioka K, Okumura M, Konishi Y, Tanaka S, Fujii S, et al. Mechanism of decreased albuminuria caused by angiotensin converting enzyme inhibitor in early diabetic nephropathy. Kidney International - Supplement 1997;51(63):S198-200. [MEDLINE: ] [PubMed] [Google Scholar]
Kauric‐Klein 2012 {published data only}
- Kauric-Klein Z, Peters RM, Yarandi HN. Self-efficacy and blood pressure self-care behaviors in patients on chronic hemodialysis. Western Journal of Nursing Research 2017;39(7):886-905. [MEDLINE: ] [DOI] [PubMed] [Google Scholar]
- Kauric-Klein Z. Blood pressure knowledge in hypertensive hemodialysis patients. Cannt Journal 2012;22(4):18-25. [MEDLINE: ] [PubMed] [Google Scholar]
- Kauric-Klein Z. Improving blood pressure control in end stage renal disease through a supportive educative nursing intervention. Nephrology Nursing Journal 2012;39(3):217-28. [MEDLINE: ] [PubMed] [Google Scholar]
Li 2013f {published data only}
- Jardine A, Li NY, Ninomiya T, Feng X, Zhang J, Shi J, et al. A sustained dietary sodium reduction program reduces albuminuria: a large cluster randomised trial [abstract no: SA-OR079]. Journal of the American Society of Nephrology 2014;25(Abstract Suppl):99a. [Google Scholar]
- Jardine MJ, Li N, Ninomiya T, Feng X, Zhang J, Shi J, et al. Dietary sodium reduction reduces albuminuria: a cluster randomized trial. Journal of Renal Nutrition 2019;29(4):276-84. [MEDLINE: ] [DOI] [PubMed] [Google Scholar]
- Li N, Yan LL, Niu W, Labarthe D, Feng X, Shi J, et al. A large-scale cluster randomized trial to determine the effects of community-based dietary sodium reduction--the China Rural Health Initiative Sodium Reduction Study. American Heart Journal 2013;166(5):815-22. [MEDLINE: ] [DOI] [PMC free article] [PubMed] [Google Scholar]
Reyes 2013 {published data only}
- Cuff L, Padilla RL, Verma TP, Gillespie BW, Peterman D, Heung M, et al. Barriers to dietary sodium restrictions among patients on hemodialysis [abstract no: SA-PO961]. Journal of the American Society of Nephrology 2014;25(Abstract Suppl):862A. [Google Scholar]
- Rao PS, Padilla RL, Cuff L, Verma TP, Peterman D, Heung M, et al. Salt taste sensitivity, sodium intake, and fluid status in hemodialysis [abstract no: TH-PO804]. Journal of the American Society of Nephrology 2015;26(Abstract Suppl):275a. [Google Scholar]
- Reyes J, Williams CM, Raimann JG, Sheppard PF, Thijssen S, Levin NW, et al. Association of dietary sodium restriction and thirst in hemodialysis patients [abstract no: FR-PO447]. Journal of the American Society of Nephrology 2013;24(Abstract Suppl):468A. [Google Scholar]
Suckling 2016 {published data only}
- Suckling R, He F, Markandu N, MacGregor G. Modest salt reduction in impaired glucose tolerance and type 2 diabetes lowers blood pressure and urinary albumin excretion [abstract no: Su139]. NDT Plus 2010;3(Suppl 3):iii349. [EMBASE: 70484357] [Google Scholar]
- Suckling R, He F, Markandu N, MacGregor G. Modest salt reduction lowers blood pressure and urinary albumin excretion in impaired glucose tolerance and type 2 diabetes [abstract no: SA.01]. Journal of Hypertension 2010;28(Suppl A):e219. [EMBASE: 70214893] [DOI] [PubMed] [Google Scholar]
- Suckling RJ, He F, Markandu N, MacGregor G. Modest reduction in salt intake lowers blood pressure and urinary albumin excretion in individuals with impaired glucose tolerance and type II diabetes [abstract no: PE.02]. Journal of Human Hypertension 2010;24(10):708. [EMBASE: 70273931] [Google Scholar]
- Suckling RJ, He FJ, Markandu ND, MacGregor GA. Modest salt reduction lowers blood pressure and albumin excretion in impaired glucose tolerance and type 2 diabetes mellitus: a randomized double-blind trial. Hypertension 2016;67(6):1189-95. [MEDLINE: ] [DOI] [PubMed] [Google Scholar]
References to ongoing studies
NCT03373500 {published data only}
- Swift P. Effect of dietary salt reduction on blood pressure in kidney transplant recipients. clinicaltrials.gov/show/nct03373500 (first received 14 December 2017).
OxCKD1 2012 {published data only}
- O'Callaghan CA. OxCKD1 - Empowering healthy lifestyle choices in chronic kidney disease (OxCKD1). clinicaltrials.gov/show/nct01552317 (first received 13 March 2012).
STICK 2015 {published data only}
- O'Donnell MJ, Smyth A. Sodium Intake in Chronic Kidney Disease (STICK). clinicaltrials gov/ct2/show/NCT02458248 (first received 1 Jun 2015).
SUBLIME 2020 {published data only}
- Humalda JK, Klaassen G, De Vries H, Meuleman Y, Laverman GD, Bos WJ, et al. The 'sublime' approach: Cost-efficacy of a novel self-management approach for dietary sodium restriction in CKD patients [abstract no: SP351]. Nephrology Dialysis Transplantation 2016;31(Suppl 1):i206-7. [EMBASE: 72326453] [Google Scholar]
- Humalda JK, Klaassen G, Vries H, Meuleman Y, Verschuur LC, Straathof EJ, et al. A self-management approach for dietary sodium restriction in patients with CKD: a randomized controlled trial. American Journal of Kidney Diseases 2020;75(6):847-56. [MEDLINE: ] [DOI] [PubMed] [Google Scholar]
SUPER 2016 {published data only}
- Mills KT. Sodium Lowering and Urinary Protein Reduction Trial (SUPER) [Effect of dietary sodium reduction in kidney disease patients with albuminuria]. clinicaltrials.gov/ct2/show/NCT02945969 (first received 26 October 2016).
Additional references
Aburto 2013
- Aburto NJ, Ziolkovska A, Hooper L, Elliott P, Cappuccio FP, Meerpohl JJ. Effect of lower sodium intake on health: systematic review and meta-analyses. BMJ 2013;346:f1326. [MEDLINE: ] [DOI] [PMC free article] [PubMed] [Google Scholar]
Allen 1997
- Allen TJ, Waldron MJ, Casley D, Jerums G, Cooper ME. Salt restriction reduces hyperfiltration, renal enlargement, and albuminuria in experimental diabetes. Diabetes 1997;46(1):19-24. [MEDLINE: ] [DOI] [PubMed] [Google Scholar]
Al‐Solaiman 2009
- Al-Solaiman Y, Jesri A, Zhao Y, Morrow JD, Egan BM. Low-Sodium DASH reduces oxidative stress and improves vascular function in salt-sensitive humans. Journal of Human Hypertension 2009;23(12):826-35. [MEDLINE: ] [DOI] [PMC free article] [PubMed] [Google Scholar]
Ang 1999
- Ang KS, Benarbia S, Boulahrouz R, Stanescu C, Charasse C, Le Cacheux P, et al. Arterial hypertension in the hemodialysis patient. A model of salt-sensitive hypertension in man [L'hypertension arterielle du patient hemodialyse. Un modele d'hypertension sensible au sel chez l'homme]. Archives des Maladies du Coeur et des Vaisseaux 1999;92(8):1023-6. [MEDLINE: ] [PubMed] [Google Scholar]
Bakris 2000
- Bakris GL, Williams M, Dworkin L, Elliott WJ, Epstein M, Toto R, et al. Preserving renal function in adults with hypertension and diabetes: a consensus approach. National Kidney Foundation Hypertension and Diabetes Executive Committees Working Group. American Journal of Kidney Diseases 2000;36(3):646-61. [MEDLINE: ] [DOI] [PubMed] [Google Scholar]
Bland 1996
- Bland JM, Altman DG. The use of transformation when comparing two means. BMJ 1996;312(7039):1153. [MEDLINE: ] [DOI] [PMC free article] [PubMed] [Google Scholar]
Cole 2019
- Cole NI, Swift PA, He FJ, MacGregor GA, Suckling RJ. The effect of dietary salt on blood pressure in individuals receiving chronic dialysis: a systematic review and meta-analysis of randomised controlled trials. Journal of Human Hypertension 2019;33(4):319-26. [MEDLINE: ] [DOI] [PubMed] [Google Scholar]
Elliot 2006
- Elliot P, Brown I. Sodium intakes around the world: background document prepared for the forum and technical meeting on reducing salt intake in populations (Paris 5-7th October 2006). Geneva: WHO Press, 2006. [ISBN: 978 92 4 159593 5] [Google Scholar]
Essig 2008
- Essig M, Escoubet B, Zuttere D, Blanchet F, Arnoult F, Dupuis E, et al. Cardiovascular remodelling and extracellular fluid excess in early stages of chronic kidney disease. Nephrology Dialysis Transplantation 2008;23(1):239-48. [MEDLINE: ] [DOI] [PubMed] [Google Scholar]
Garofalo 2018
- Garofalo C, Borrelli S, Provenzano M, De Stefano T, Vita C, Chiodini P, et al. Dietary salt restriction in chronic kidney disease: a meta-analysis of randomized clinical trials. Nutrients 2018;10(6):732. [MEDLINE: ] [DOI] [PMC free article] [PubMed] [Google Scholar]
GBD 2019
- Institute for Health Metrics and Evaluation (IHME). GBD Compare. Seattle, WA: IHME, University of Washington. 2019. www.vizhub.healthdata.org/gbd-compare (Accessed 8 May 2021).
Go 2004
- Go AS, Chertow GM, Fan D, McCulloch CE, Hsu CY. Chronic kidney disease and the risks of death, cardiovascular events, and hospitalization [Erratum in: N Engl J Med. 2008;18(4):4]. New England Journal of Medicine 2004;351(13):1296-305. [MEDLINE: ] [DOI] [PubMed] [Google Scholar]
GRADE 2008
- Guyatt GH, Oxman AD, Vist GE, Kunz R, Falck-Ytter Y, Alonso-Coello P, et al. GRADE: an emerging consensus on rating quality of evidence and strength of recommendations. BMJ 2008;336(7650):924-6. [MEDLINE: ] [DOI] [PMC free article] [PubMed] [Google Scholar]
GRADE 2011
- Guyatt G, Oxman AD, Akl EA, Kunz R, Vist G, Brozek J, et al. GRADE guidelines: 1. Introduction-GRADE evidence profiles and summary of findings tables. Journal of Clinical Epidemiology 2011;64(4):383-94. [MEDLINE: ] [DOI] [PubMed] [Google Scholar]
Graudal 2020
- Graudal NA, Hubeck-Graudal T, Jurgens G. Effects of low sodium diet versus high sodium diet on blood pressure, renin, aldosterone, catecholamines, cholesterol, and triglyceride. Cochrane Database of Systematic Reviews 2020, Issue 12. Art. No: CD004022. [DOI: 10.1002/14651858.CD004022.pub5] [DOI] [PMC free article] [PubMed] [Google Scholar]
Guerin 2001
- Guerin AP, Blacher J, Pannier B, Marchais SJ, Safar ME, London GM. Impact of aortic stiffness attenuation on survival of patients in end-stage renal failure. Circulation 2001;103(7):987-92. [MEDLINE: ] [DOI] [PubMed] [Google Scholar]
He 2003
- He FJ, MacGregor GA. How far should salt intake be reduced? Hypertension 2003;42(6):1093-9. [MEDLINE: ] [DOI] [PubMed] [Google Scholar]
He 2013
- He FJ, Li J, MacGregor GA. Effect of longer-term modest salt reduction on blood pressure. Cochrane Database of Systematic Reviews 2013, Issue 4. Art. No: CD004937. [DOI: 10.1002/14651858.CD004937.pub2] [DOI] [PMC free article] [PubMed] [Google Scholar]
Hernandez 2018
- Hernandez AV, Emonds EE, Chen BA, Loayza JA, Pasupuleti V, Roman-Morillo YM, et al. Systematic review and meta-analysis of the effects of low sodium salt substitutes on cardiovascular outcomes [abstract]. Journal of the American College of Cardiology 2018;71(11):A1749. [EMBASE: 621787030]
Higgins 2003
- Higgins JP, Thompson SG, Deeks JJ, Altman DG. Measuring inconsistency in meta-analyses. BMJ 2003;327(7414):557-60. [MEDLINE: ] [DOI] [PMC free article] [PubMed] [Google Scholar]
Higgins 2008
- Higgins JP, White IR, Anzures-Cabrera J. Meta-analysis of skewed data: combining results reported on log-transformed or raw scales. Statistics in Medicine 2008;27(29):6072-92. [MEDLINE: ] [DOI] [PMC free article] [PubMed] [Google Scholar]
Higgins 2011
- Higgins JP, Green S (editors). Cochrane Handbook for Systematic Reviews of Interventions Version 5.1.0 (updated March 2011). The Cochrane Collaboration, 2011. Available from www.cochrane-handbook.org.
Hooper 2002
- Hooper L, Bartlett C, Davey Smith G, Ebrahim S. Systematic review of long term effects of advice to reduce dietary salt in adults. BMJ 2002;325(7365):628. [MEDLINE: ] [DOI] [PMC free article] [PubMed] [Google Scholar]
Hunsicker 2004
- Hunsicker LG. The consequences and costs of chronic kidney disease before ESRD. Journal of the American Society of Nephrology 2004;15(5):1363-4. [MEDLINE: ] [DOI] [PubMed] [Google Scholar]
Jones‐Burton 2006
- Jones-Burton C, Mishra SI, Fink JC, Brown J, Gossa W, Bakris GK, et al. An in-depth review of the evidence linking dietary salt intake and progression of chronic kidney disease. American Journal of Nephrology 2006;26(3):268-75. [MEDLINE: ] [DOI] [PubMed] [Google Scholar]
Kayikcioglu 2009
- Kayikcioglu M, Tumuklu M, Ozkahya M, Ozdogan O, Asci G, Duman S, et al. The benefit of salt restriction in the treatment of end-stage renal disease by haemodialysis. Nephrology Dialysis Transplantation 2009;24(3):956-62. [MEDLINE: ] [DOI] [PubMed] [Google Scholar]
KDIGO 2013
- Levin A, Stevens PE, Bilous RW, Coresh J, De Francisco AL, De Jong PE, et al. Kidney disease: Improving global outcomes (KDIGO) CKD work group. KDIGO 2012 clinical practice guideline for the evaluation and management of chronic kidney disease. Kidney International Supplements 2013;3(1):1-150. [EMBASE: 369856107]
Korhonen 2000
- Korhonen MH, Jarvinen RM, Sarkkinen ES, Uusitupa MI. Effects of a salt-restricted diet on the intake of other nutrients. American Journal of Clinical Nutrition 2000;72(2):414-20. [MEDLINE: ] [DOI] [PubMed] [Google Scholar]
Law 2009
- Law MR, Morris JK, Wald NJ. Use of blood pressure lowering drugs in the prevention of cardiovascular disease: meta-analysis of 147 randomised trials in the context of expectations from prospective epidemiological studies. BMJ 2009;338:b1665. [MEDLINE: ] [DOI] [PMC free article] [PubMed] [Google Scholar]
Malta 2018
- Malta D, Petersen K S, Johnson C, Trieu K, Rae S, Jefferson K, et al. High sodium intake increases blood pressure and risk of kidney disease. From the Science of Salt: A regularly updated systematic review of salt and health outcomes (August 2016 to March 2017). Journal of Clinical Hypertension 2018;20(12):1654-65. [MEDLINE: ] [DOI] [PMC free article] [PubMed] [Google Scholar]
McMahon 2012a
- McMahon EJ, Campbell KL, Mudge D, Bauer JD. Achieving salt restriction in chronic kidney disease. International Journal of Nephrology 2012:720429. [MEDLINE: ] [DOI] [PMC free article] [PubMed] [Google Scholar]
Mozaffarian 2014
- Mozaffarian D, Fahimi S, Singh GM, Micha R, Khatibzadeh S, Engell RE, et al. Global sodium consumption and death from cardiovascular causes. New England Journal of Medicine 2014;371(7):624-34. [MEDLINE: ] [DOI] [PubMed] [Google Scholar]
Nerbass 2018
- Nerbass FB, Calice-Silva V, Pecoits-Filho R. Sodium intake and blood pressure in patients with chronic kidney disease: a salty relationship. Blood Purification 2018;45(1-3):166-72. [MEDLINE: ] [DOI] [PubMed] [Google Scholar]
NKF 2002
- National Kidney Foundation. K/DOQI clinical practice guidelines for chronic kidney disease: evaluation, classification, and stratification. American Journal of Kidney Diseases 2002;39(2 Suppl 1):S1-266. [MEDLINE: ] [PubMed] [Google Scholar]
Osanai 2002
- Osanai T, Fujiwara N, Saitoh M, Sasaki S, Tomita H, Nakamura M, et al. Relationship between salt intake, nitric oxide and asymmetric dimethylarginine and its relevance to patients with end-stage renal disease. Blood Purification 2002;20(5):466-8. [MEDLINE: ] [DOI] [PubMed] [Google Scholar]
Qian 2018
- Qian Q. Salt, water and nephron: mechanisms of action and link to hypertension and chronic kidney disease. Nephrology 2018;23 Suppl 4:44-9. [MEDLINE: ] [DOI] [PMC free article] [PubMed] [Google Scholar]
Ritz 2009
- Ritz E, Koleganova N, Piecha G. Role of sodium intake in the progression of chronic kidney disease. Journal of Renal Nutrition 2009;19(1):61-2. [MEDLINE: ] [DOI] [PubMed] [Google Scholar]
Rupp 1978
- Rupp JW, Stone RA, Gunning BE. Sodium versus sodium fluid restriction in hemodialysis: control of weight gains and blood pressures. American Journal of Clinical Nutrition 1978;31(10):1952-5. [MEDLINE: ] [DOI] [PubMed] [Google Scholar]
Schunemann 2011a
- Schünemann HJ, Oxman AD, Higgins JP, Vist GE, Glasziou P, Guyatt GH. Chapter 11: Presenting results and 'Summary of findings' tables. In: Higgins JP, Green S (editors). Cochrane Handbook for Systematic Reviews of Interventions Version 5.1.0 [updated March 2011]. The Cochrane Collaboration, 2011. Available from www.cochrane-handbook.org.
Schunemann 2011b
- Schünemann HJ, Oxman AD, Higgins JP, Deeks JJ, Glasziou P, Guyatt GH. Chapter 12: Interpreting results and drawing conclusions. In: Higgins JP, Green S (editors). Cochrane Handbook for Systematic Reviews of Interventions Version 5.1.0 [updated March 2011]. The Cochrane Collaboration, 2011. Available from www.cochrane-handbook.org.
Siebenhofer 2016
- Siebenhofer A, Jeitler K, Berghold A, Horvath K, Posch N, Poggenberg S, et al. Long‐term effects of weight‐reducing diets in people with hypertension. Cochrane Database of Systematic Reviews 2016, Issue 3. Art. No: CD008274. [DOI: 10.1002/14651858.CD008274.pub3] [DOI] [PMC free article] [PubMed] [Google Scholar]
Suckling 2010
- Suckling RJ, He FJ, MacGregor GA. Altered dietary salt intake for preventing and treating diabetic kidney disease. Cochrane Database of Systematic Reviews 2010, Issue 12. Art. No: CD006763. [DOI: 10.1002/14651858.CD006763.pub2] [DOI] [PubMed] [Google Scholar]
Svetkey 1999
- Svetkey LP, Simons-Morton D, Vollmer WM, Appel LJ, Conlin PR, Ryan DH, et al. Effects of dietary patterns on blood pressure: subgroup analysis of the Dietary Approaches to Stop Hypertension (DASH) randomized clinical trial. Archives of Internal Medicine 1999;159(3):285-93. [MEDLINE: ] [DOI] [PubMed] [Google Scholar]
Todd 2010
- Todd AS, Macginley RJ, Schollum JB, Johnson RJ, Williams SM, Sutherland WH, et al. Dietary salt loading impairs arterial vascular reactivity. American Journal of Clinical Nutrition 2010;91(3):557-64. [MEDLINE: ] [DOI] [PubMed] [Google Scholar]
Trieu 2015
- Trieu K, Neal B, Hawkes C, Dunford E, Campbell N, Rodriguez-Fernandez R, et al. Salt reduction initiatives around the world - a systematic review of progress towards the global target. PLoS ONE [Electronic Resource] 2015;10(7):e0130247. [MEDLINE: ] [DOI] [PMC free article] [PubMed]
Verhave 2004
- Verhave JC, Hillege HL, Burgerhof JG, Janssen WM, Gansevoort RT, Navis GJ, et al. Sodium intake affects urinary albumin excretion especially in overweight subjects. Journal of Internal Medicine 2004;256(4):324-30. [MEDLINE: ] [DOI] [PubMed] [Google Scholar]
WHO 2012
- World Health Organization. Guideline: sodium intake for adults and children. www.who.int/nutrition/publications/guidelines/sodium_intake_printversion.pdf 2012. [PubMed]
References to other published versions of this review
McMahon 2012b
- McMahon EJ, Campbell KL, Bauer JD, Mudge DW. Altered dietary salt intake for chronic kidney disease. Cochrane Database of Systematic Reviews 2012, Issue 9. Art. No: CD010070. [DOI: 10.1002/14651858.CD010070] [DOI] [PubMed] [Google Scholar]
McMahon 2015
- McMahon EJ, Campbell KL, Bauer JD, Mudge DW. Altered dietary salt intake for people with chronic kidney disease. Cochrane Database of Systematic Reviews 2015, Issue 2. Art. No: CD010070. [DOI: 10.1002/14651858.CD010070.pub2] [DOI] [PubMed] [Google Scholar]