

Abstract
The present study was aimed to assess the diversity of influenza A viruses (IAV) circulating in pig farms in the Iberian Peninsula. The study included two different situations: farms suffering respiratory disease outbreaks compatible with IAV (n = 211) and randomly selected farms without overt respiratory disease (n = 19). Initially, the presence of IAV and lineage determination was assessed by qRT‐PCR using nasal swabs. IAV was confirmed in 145 outbreaks (68.7%), mostly in nurseries (53/145; 36.5%). Subtyping by RT‐qPCR was possible in 94 of those cases being H1avN2hu (33.6%), H1avN1av (24.3%) and H1huN2hu (18.7%), the most common lineages. H3huN2hu and H1pdmN1pdm represented 7.5% and 6.5% of the cases, respectively. As for the randomly selected farms, 15/19 (78.9%) were positive for IAV. Again, the virus was mostly found in nurseries and H1avN2hu was the predominant lineage. Virus isolation in MDCK cells was attempted from positive cases. Sixty of the isolates were fully sequenced with Illumina MiSeq®. Within those 60 isolates, the most frequent genotypes had internal genes of avian origin, and these were D (19/60; 31.7%) and A (11/60; 18.3%), H1avN2hu and H1avN1av, respectively. In addition, seven previously unreported genotypes were identified. In two samples, more than one H or N were found and it was not possible to precisely establish their genotypes. A great diversity was observed in the phylogenetic analysis. Notably, four H3 sequences clustered with human isolates from 2004–05 (Malaysia and Denmark) that were considered uncommon in pigs. Overall, this study indicates that IAV is a very common agent in respiratory disease outbreaks in Spanish pig farms. The genetic diversity of this virus is continuously expanding with clear changes in the predominant subtypes and lineages in relatively short periods of time. The current genotyping scheme has to be enlarged to include the new genotypes that could be found in the future.
Keywords: epidemiology, influenza A, lineages, pig, sequencing
1. INTRODUCTION
Influenza A virus (IAV) is one of the most important respiratory pathogens in pigs being a key agent in the porcine respiratory disease complex (PRDC) of weaners and growers. For many years, IAV infection in pigs was mainly associated with epidemic outbreaks of acute respiratory disease affecting most animals in the farm. However, in the last years, increasing evidence indicates that most farms in Europe are endemically infected by one or more IAV viruses (Kyriakis et al., 2011, 2013; Van Reeth et al., 2008; Simon‐Grifé et al., 2012) and that reassortment events are not uncommon (Martín‐Valls et al., 2014). In those farms, the main circulation of the virus takes place in the farrowing units and nurseries (Ferreira et al., 2017; Ryt‐Hansen et al., 2019), with occasional generalised outbreaks when a new IAV strain enters the farm for the first time.
The IAV genome consists of eight segments, which encode for up to 14 proteins, among them five structural ones: haemagglutinin (HA), neuraminidase (NA), two matrix proteins (M1 and M2) and the nucleoprotein (NP). The combination of haemagglutinin (HA) and neuraminidase (NA) determines the subtype. At present, 18 types of HA and 11 types of NA are known in mammals and birds, but only three subtypes predominate in pigs: H1N1, H1N2 and H3N2. However, the genetic and antigenic diversity within those subtypes is considerable. In Europe, this diversity is particularly high for swine H1N1 and H1N2 viruses. Furthermore, these viruses have evolved into distinct genetic lineages in different geographic locations. Since the 2009 pandemic, four lineages are predominantly found in pig farms: Eurasian avian‐like H1N1 (H1avN1av), human‐like H1N2 (H1huN2hu), human‐like H3huN2hu and the pandemic lineage H1N1 (H1pdmN1pdm).
While the haemagglutination inhibition test (HI) may distinguish isolates of different phylogenetic origin within a given subtype (Van Reeth, Labarque, & Pensaert, 2006), cross‐reactivity among strains belonging to subtypes and lineages different to H1 have been reported for North American H1 and classical swine H1 (Kyriakis et al., 2010). Also, some degree of cross‐protection may exist between H1pdmN1pdm and H1avN1av (Busquets et al., 2010; Kyriakis et al., 2010). Altogether, this indicates the need for additional classification schemes.
Watson et al. (2015) proposed a genotyping system based on the origin of their two external (HA and NA) and six internal gene segments (NP, M, the three polymerase genes and the non‐structural protein, also known as internal gene cassette) to classify the swine IAV lineages detected in Europe. At the time of that publication, they had classified 23 genotypes, but only four of them presented a pan‐European distribution. In that study, most isolates contained an internal gene cassette derived from the Eurasian avian‐like lineage (67%) or the H1pdmN1pdm lineage (27%).
IAV diversity in pigs has been related to the intensification of the production system (Van Reeth et al., 2008). In this sense, it has been suggested that factors such as the continuous introduction of animals from different sources can contribute to the introduction of new viruses into a farm and the subsequent reassortment among strains. These reassortment events seem to be very common in Europe (Beato et al., 2016; Howard et al., 2011; Lange et al., 2013; Moreno et al., 2009, 2011; Simon‐Grifé et al., 2011).
At present, Spain is an ideal scenario for the examination of such IAV diversity in the European context. As it is one of the few countries in Europe where pig population increased in the last years. In 2019, with 2.2 million sows, a total census of 29 million pigs and imports of about 1 million animals (Ministerio de Agricultura, Pesca y Alimentación, 2019), Spain – together with Germany – are the leading pork‐producing countries in Europe and among the top 5 in the world (Eurostat, 2019).
Epidemiological information paired with sequencing and detailed phylogenetic analysis are tools that can help understand the circulation routes and mutation patterns of these viruses. The aim of the present study was to gain a better insight into the diversity of IAV in Spanish pig farms with outbreaks of respiratory disease or farms with subclinical infections.
2. MATERIALS AND METHODS
2.1. Data collection
The study took place between February 2017 and March 2019 and included two different situations: farms suffering respiratory disease and samples from subclinical farms that did not report respiratory disease cases.
For the farms suffering respiratory disease, a case was defined as a situation where respiratory disease was noticeable in at least one age group of pigs with predominant signs of cough and fever. Shipping of suspected influenza cases (nasal swabs) was requested from field veterinarians in Spain and Portugal. In order to accept a submission, a data sheet indicating clinical signs of the animals had to be fulfilled. Sampling had to include at least 10 nasal swabs from feverish animals. Samples were collected in a virus transport medium (Virocult®; Sigma‐Aldrich), kept at 4ºC during transport and immediately processed upon arrival. Occasionally, if dead animals were found, lungs were also sent for analysis.
To assess the circulation of IAV in subclinical farms (no obvious respiratory disease), sampling was performed in 19 farms in Catalonia. The selection of these farms was done randomly from a group of different pig producing enterprises representing 20% of the Catalan pig industry. The included farms fulfilled two criteria: 1) farms that were not suffering from respiratory outbreaks in any production phase and 2) farms that were farrow‐to‐finish. In those farms, nasal swabs were taken randomly from suckling pigs, weaners and fatteners (n = 20 each). Samples were collected using the aforementioned virus transport medium and under the mentioned storage conditions. That sampling strategy would allow us to detect viral circulation in at least one positive farm assuming a 15% herd prevalence of subclinical herds and considering a 95% confidence interval. Similarly, the sampling method allowed us to detect at least one positive assuming a prevalence of 15% of IAV in each sampled age (95% confidence interval).
2.2. Processing of samples
Upon arrival to the laboratory, the Virocoult® transport media containing the nasal swabs were vortexed and the medium was transferred to a sterile 1.5‐ml tube. Then, tubes were centrifuged at 4,000 g for 5 min and the supernatant was recovered for further processing. Viral RNA was extracted from 150 µl of the supernatant using a commercial kit (NucleoSpin® RNA virus, Macherey‐Nagel) according to the manufacturer's instructions. Initial detection of the virus was done by means of a RT‐qPCR targeted to the IAV matrix gene (Busquets et al., 2010) using the AgPath‐ID™ One‐Step RT‐PCR reagents (Thermo Fisher). Positive samples underwent a second RT‐qPCR for identifying subtypes and European lineages of H and N, including H1av, H1hu, H1pdm, H3hu, N1av, N1pdm and N2hu (Henritzi et al., 2016, 2019).
2.3. Virus isolation
Madin–Darby canine kidney (MDCK) cells (ATCC CRL‐2936™) were used for the isolation of IAV from RT‐qPCR‐positive (M gene). Viral isolation was attempted from up to three RT‐PCR‐positive samples per case (from both respiratory outbreaks and subclinical sampled farms), to obtain a high‐quality isolate for further sequencing. For the isolation process, 100 µl of the sample supernatant was mixed with 900 µl of Minimum Essential Medium Eagle (MEM) supplemented with L‐glutamine (200 mM), penicillin‐streptomycin (10,000 units and 10 mg/ml, respectively) and trypsin TPCK‐treated for a final concentration of 10 µg/ml of trypsin. Trypsin‐treated samples were inoculated in 25cm2 cell culture flasks. After 1.5 hr of incubation at 37ºC, the flasks were filled with 9 ml of medium without trypsin (final concentration of trypsin in the culture 1µg/ml) and cultures were incubated for up to 5 days.
Cells were observed every 24 hr to check for the development of cytopathic effect (CPE). Once, CPE was observed flasks were frozen at −80ºC, thawed and, after centrifugation, the cell culture supernatant was examined by RT‐PCR (M gene) to confirm the replication of the virus (lower Cq values compared to the initial inoculum). Samples were discarded when CPE was not observed after a third blind passage. Up to three samples per case were attempted for viral isolation.
2.4. Next‐generation sequencing
In order to have a more precise picture of the IAV circulating in the studied population, the genome of 60 representative isolates was fully sequenced using next‐generation sequencing technology (enough to detect at least one genotype with an occurrence of ≥5% in the cases, 95% confidence). These cases were selected from the MDCK‐isolated viruses, and this included one isolate per farm as maximum. The total RNA extraction from the 60 selected viruses isolated in MDCK cells was sequenced using an Illumina® MiSeq platform at Parc de Genòmica i Recerca‐UAB. The output reads in fastaq format (doubled paired) were checked for quality using Trimmomatic (matching of forward and reverse sequences and quality index >20). Next, high‐quality reads were filtered using IAV sequence references belonging to all known lineages for each of the eight genome segments (Supplementary material l). Genome consensuses were generated using the Simple Consensus maker tool (available at: https://www.hiv.lanl.gov/content/sequence/CONSENSUS/SimpCon.html) when a viral quasi‐species was obtained. The segments were then manually aligned and trimmed using BioEdit sequence alignment editor for Windows (Hall, 1999). When filtering did not yield a viral quasi‐species, consensus sequence for that gene was forced using QuASAR software (available at: https://github.com/piquelab/QuASAR). The resulting consensus sequence was blasted against available sequences in GenBank, and the closest sequence was used to re‐filter the original fastaq file.
2.5. Phylogenetic analysis and genotyping
Phylogenetic analysis was performed using the MEGA X software (available for download at: https://www.megasoftware.net/). An initial database was built using all sequences available in GenBank of Euroasian swine IAV for each genome segment. At first, an initial removal of identical sequences (100% of identity in identity matrix) was done. A preliminary phylogenetic analysis (neighbour‐joining) allowed the removal of redundant sequences within a given cluster. For each cluster, this corresponded to highly similar isolates (>97% identity). Finally, in order to improve the resolution of each tree, a BLAST was done using each of the sequences obtained in the present paper, and the output was used for completing the database for each gene with sequences not initially included. Final databases for each gene contained about 150–250 sequences representing the significant clusters in the preliminary analysis. Relevant non‐European strain sequences were included when needed. Supplementary file 2 shows the GenBank accession numbers of the included sequences. Sequences obtained in the present study were added to the corresponding databases for each gene. Final phylogenetic trees were built using the maximum likelihood method (1,000 iterations) using the general time‐reversible model (GTR) and subtree pruning and regrafting moves (SPR) option. Once the subtype, lineage and phylogenetic clustering for each isolate and gene was identified, the genotyping was done according to the classification of Watson et al. (2015). Briefly, for internal genes (PB2, PB1, PA, NP, M and NS), genes were classified as 'avian‐like' or 'pandemic'. For haemagglutinins, there was a differentiation between the three H1s: avian‐like, human‐like and pandemic. In literature, there is only one type of H3. For neuraminidases, N1 differentiation was also done depending if they clustered with avian‐like isolates and pandemic isolates, and for N2, only the human‐like isolate was considered. The combination of the 8 segments defined the genotype, and previously reported genotypes have been named according to Watson et al., (2015) proposal, following the alphabetical order. Previously unreported genotypes were assigned as UG – standing for 'unreported genotype' – followed by a number.
3. RESULTS
3.1. Cases of respiratory disease
Table 1 summarises the results for the submitted cases. During the study period, 211 submissions fulfilled the requirements and were considered respiratory disease cases. Cases were distributed in all regions of Spain with significant pig production, plus four cases submitted from Portugal. Most of the submissions corresponded to nursery pigs (39.8%), suckling piglets and fatteners had a considerable number of submissions (17.5% and 13.3%, respectively), while only 7.1% were sow samples, accounting this latter group for the lowest percentage of positive submissions (p = .02). Unfortunately, in 22.3% of submissions, the age information could not be provided to us for different reasons. Of the 211 submissions, in 145 (68.7%, CI95%:60.5%–73.8%), IAV‐positive animals (M gene RT‐qPCR) were present. Supplementary file 3 shows the geographic distribution of the positive cases for which the precise location of the farm was recorded.
TABLE 1.
Distribution of case submissions by age group and proportion of IAV‐positive cases (M gene RT‐qPCR)
| Age group | No. of submissions (%) | No. of positive submissions/Total submitted (%) |
|---|---|---|
| Suckling piglets | 37 (17.5) | 26/37 (70.3) |
| Nurseries | 84 (39.8) | 53/84 (63.1) |
| Fatteners | 28 (13.3) | 22/28 (78.8) |
| Sows* | 15 (7.1) | 6/15 (40)* |
| Other | 47 (22.3) | 38/47 (80.9) |
| Total | 211 (100) | 145/211 (68.7) |
p < .05
The Cq values in IAV‐positive cases versus the proportion of infected animals was also examined (Figure 1). The results showed that the higher the proportion of infected animals, the lower the average Cq in positive animals (r=−0.33, CI95% = −0.49 to −0.15; p < .0001).
FIGURE 1.
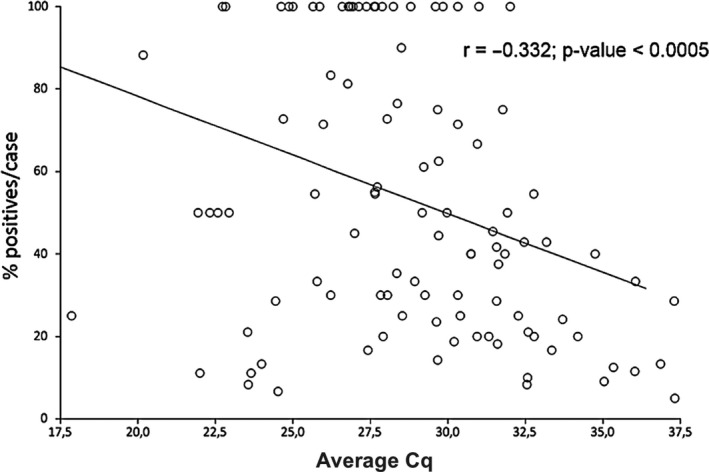
Distribution and regression of positive animals per case (respiratory outbreaks) and the Cq values. The graph shows the Cq for positive samples distributed by the percentage of positive animals per case
3.1.1. Assessment of apparently subclinical farms
Apparently healthy animals of 17 farrow‐to‐finish farms and 2 farms without fattening unit were examined. Of these, in 15 farms (78.9%) animals tested positive for IAV by RT‐PCR for the M gene (Table 2). The distribution of positive animals did not show differences between suckling piglets and weaners, as 12 farms were detected as positive in each of these two phases. In 7 farms, both phases were positive at the same time of sampling. There was one farm that tested positive for the 3 production phases, being the only one having positive results not only for suckling piglets and weaners, but also for the fattening unit.
TABLE 2.
Distribution of influenza A positive pools per farm and their average Cq value in herds subclinically infected
| Positive farms (n = 15) | Positive pools | Average Cq value | ||
|---|---|---|---|---|
| Suckling piglets | Weaners | Fatteners | ||
| Farm 1 | 4/5 | 0/5 | 0/5 | 31.3 |
| Farm 2 | 5/5 | 5/5 | 1/5 | 27.6 |
| Farm 3 | 1/5 | 4/5 | N/A a | 31.6 |
| Farm 4 | 0/5 | 3/5 | 0/5 | 28.1 |
| Farm 5 | 0/5 | 4/5 | 0/5 | 29.7 |
| Farm 6 | 4/5 | 2/5 | 0/5 | 31.6 |
| Farm 7 | 3/5 | 3/5 | 0/5 | 28.9 |
| Farm 8 | 4/5 | 2/5 | 0/5 | 27.7 |
| Farm 9 | 3/5 | 0/5 | 0/5 | 32.8 |
| Farm 10 | 3/5 | 0/5 | 0/5 | 30.3 |
| Farm 11 | 0/5 | 5/5 | 0/5 | 17.9 |
| Farm 12 | 4/5 | 4/5 | 0/5 | 26.9 |
| Farm 13 | 5/5 | 0/5 | 0/5 | 28.5 |
| Farm 14 | 2/5 | 4/5 | 0/5 | 27.8 |
| Farm 15 | 5/5 | 5/5 | N/A a | 27.5 |
Farms without a fattening unit.
3.1.2. Lineages detected
Among the 145 cases with positive samples for the M gene, 94 (85.4%; CI95%:78.1%–90.6%) could be subtyped using the subtyping RT‐qPCR (Table 3). All typable samples yielded Cq values < 30 for the M gene. Isolation of the virus was successful in 11/51 cases, in which RT‐qPCR typing was not possible (21.5%; CI95%:11.8%–35.7%). Those 11 samples were sequenced by NGS and belonged to different subtypes and lineages (H1avN1av, H1avN2hu, H3huN1av and H3huN2hu). For the 40 remaining cases, the complete lineage could not be obtained by RT‐qPCR and attempts of isolation in cell culture were unsuccessful. No geographical pattern in the distribution of the lineages was found, except for the H3huN1av isolates that were detected in two farms of the same company in the same province.
TABLE 3.
Distribution of detected lineages in influenza A positive pigs samples retrieved from cases of respiratory disease and one case from an apparently subclinical farm
| Lineages detected (n = 95) | No isolates RT‐qPCR | No isolates NGS | No isolates Total | Percentage |
|---|---|---|---|---|
| H1avN2hu | 31 | 5 a | 36 | 33.6 |
| H1avN1av | 24 | 2 | 26 | 24.3 |
| H1huN2hu | 20 | 0 | 20 | 18.7 |
| H3huN2hu | 6 | 2 | 8 | 7.5 |
| H1huN1av | 6 | 0 | 6 | 5.6 |
| H1pdmN1pdm | 5 | 0 | 5 | 4.7 |
| H3huN1av | 1 | 2 | 3 | 2.8 |
| H1pdmN1av/N1pdm | 1 | 0 | 1 | 0.9 |
| H1av/H1pdmN1av b | 0 | 1 | 1 | 0.9 |
| H3huN1av/N2hu b | 1 | 0 | 1 | 0.9 |
| Total | 95 | 12 | 107 | 100% |
Includes one case retrieved from an apparent subclinical farm where the initial RT‐qPCR assessment was H1avNx, and after successful isolation, the sequence obtained was found to be H1avN2hu.
In two cases, two H or two N were detected in the RT‐qPCR.
Regarding the assessment of apparently subclinical farms, the lineage of the IAV virus circulating in the farm could be determined by RT‐qPCR in 12 cases while in three farms only the H or N lineage could be determined. The lineages detected were as follows: H1avN2hu, H1huN2hu, H1avN1av, H1huN1av and for the three partially subtyped, these were HxN1av, HxN2hu and H1avNx. Out of these last three, one could be fully sequenced after isolation and corresponded to H1avN2hu.
3.1.3. Genotyping and phylogenetic analysis
Full genome sequencing allowed the determination of the genotype for 60 isolates (Figure 2). The most common were genotypes D (31.7%) and A (18.3%). In the present study, 7 previously unreported genotypes (UG) were identified and designated as UGx(1‐7). For two additional samples, two different H or N were detected in the sample (by PCR subtyping and NGS sequencing), while all other genes were consistent with a single origin. Since it was impossible to establish the genotype of the virus or viruses present, they were designated as undetermined genotype (UDX). For simplification purposes, each segment has been represented following the colour patterns used by Watson et al. (2015). In the cases where different lineages were found, new colours have been proposed.
FIGURE 2.
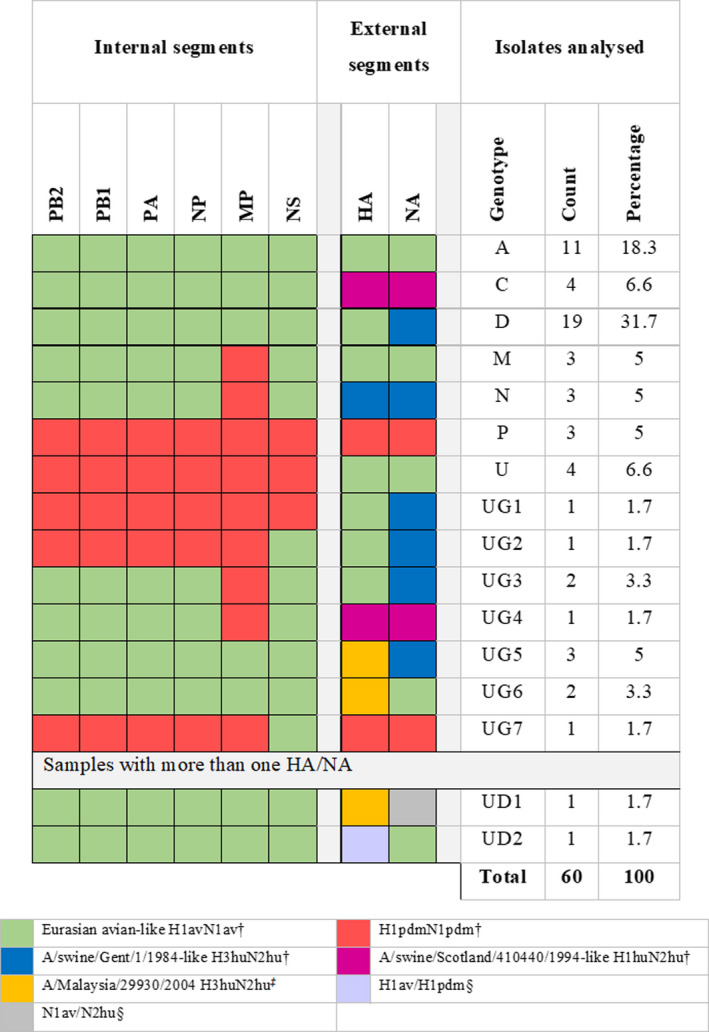
Distribution of genotypes in the 60 influenza A virus isolates sequenced. Designation of the genotypes followed the classification by Watson et al. (2015). For those genotypes previously unreported, we used the designation ‘unreported genotype’ (UG). †Denominations and strains used as reference according to Watson et al., 2015. ‡Older closest relative strain found in GenBank. §In these cases, two H or two N genes were detected but no differences for all other genes. In these cases, we used the designation undetermined genotype (UD)
A great diversity was observed in the phylogenetic analysis. Regarding H (Figure 3) and N segments/genes (Figure 4), all isolates belonged to the expected lineages. However, it is worth noting that four H3 pig sequences clustered with human isolates from 2004–05 (Malaysia and Denmark) that were considered uncommon in pigs. This finding corresponds to isolates dating from the last two years and could possibly mean the disappearance of the classic H3 and its replacement by this new type.
FIGURE 3.
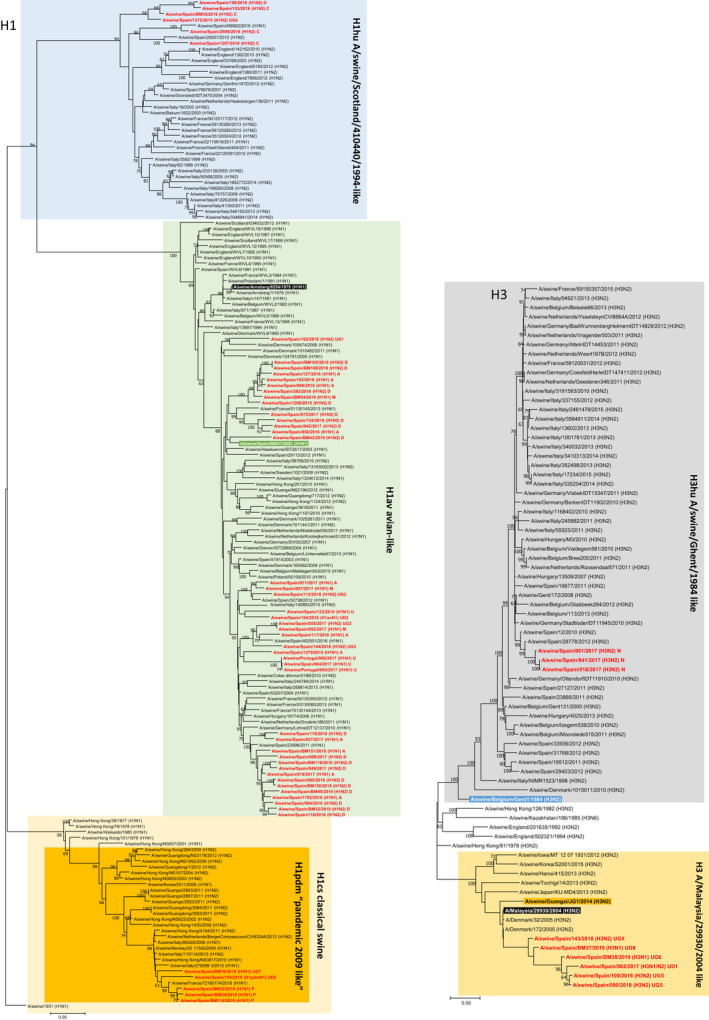
Maximum likelihood tree of the influenza A positive haemagglutinins H1 and H3 (1,000 iterations). Coloured boxes show the main lineages for Eurasian H1 and H3 as indicated in the figure. Sequences highlighted in black and white letters represent a common ancestor for the whole lineage indicated by the box. Green (avian‐like H1), dark red (pandemic H1), purple (human‐like H1), orange (new seasonal human H3), and blue (classical human‐like swine H3) indicate a strain previously isolated in swine that could be used as a more recent reference of the lineage in swine. Sequences in red are those from the present study. Values in the branches show the bootstrap values (only ≥60 are shown)
FIGURE 4.
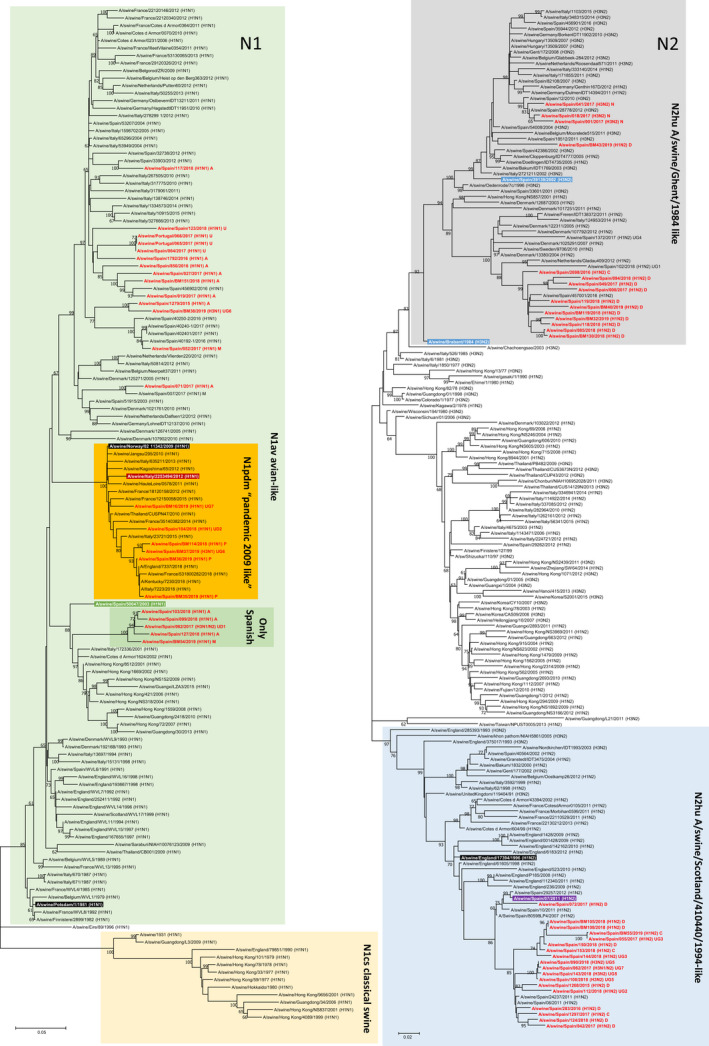
Maximum likelihood tree for influenza A positive N1 and N2 gene segments (1,000 iterations). Coloured boxes show the main lineages for Eurasian N1 and N2 as indicated in the figure. Sequences highlighted in black and white letters represent a common ancestor for the whole lineage indicated by the box. Green (avian‐like N1), dark red (pandemic N1) and blue (human‐like swine N2) indicate a strain previously isolated in swine that could be used as a more recent reference of the lineage in swine. Sequences in red are those from the present study. Values in the branches show the bootstrap values (only ≥60 are shown)
Interestingly, for some genes, particularly M (Figure 5), local (Spanish) clustering was observed. Thus, of the 60 sequences obtained in the present study, 37 grouped in two clusters mainly composed of Spanish sequences. Similarly, for the NS gene, 39 Spanish sequences from the present study clustered together in two groups (Supplementary file 8). For PB1 and PB2, a local cluster within the pandemic group was observed; this clustering was not maintained for PA (Supplementary files 4, 5 and 6). Regarding the NP segment, two main clusters can be observed (Supplementary file 7).
FIGURE 5.
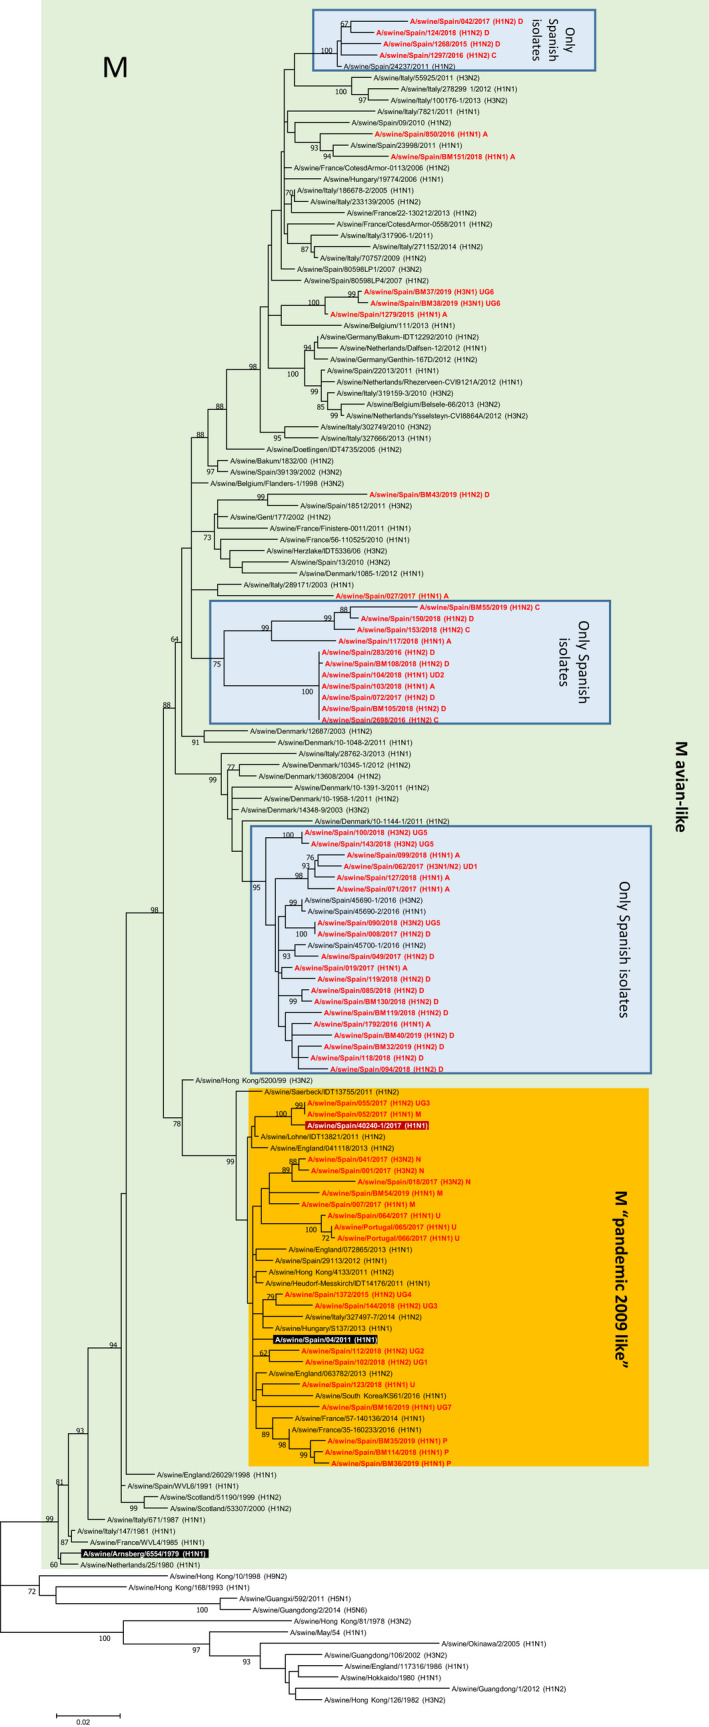
Maximum likelihood tree for influenza A positive Matrix gene segment (1,000 iterations). Coloured boxes show the main groups for Eurasian M genes. Sequences highlighted in black and white letters represent a common ancestor for the whole lineage indicated by the box. Green (avian‐like N1), dark red (pandemic N1) a strain previously isolated in swine that could be used as a more recent reference of the lineage in swine. Sequences in red are those from the present study. Clusters containing solely Spanish isolates are indicated. Values in the branches show the bootstrap values (only ≥60 are shown)
4. DISCUSSION
Influenza A virus is one of the main components of PRDC (Brockmeier, Halbur, & Thacker, 2002). In the present study, about two thirds of the cases submitted because of a respiratory disease episode in the herd were positive for IAV by RT‐qPCR. Although some selection bias may exist, this result indicates that IAV is a very common agent in those outbreaks in Spanish farms. Nevertheless, it is important to distinguish between a positive IAV result by RT‐PCR and attributing to IAV the role of primary agent in the outbreak. In the present study, we did not check for other respiratory pathogens that could have contributed to the clinical features observed in the farm. However, when we performed a random sampling in apparently subclinical farms, IAV was also commonly found in the nasal swabs examined. A deeper analysis of the data showed that while in subclinically infected herds the proportion of IAV‐positive samples rarely exceeded 50%, in most of the outbreaks the percentage of positive samples was above this value. Moreover, the average Cq values and the proportion of infected animals were significantly related. In addition, in subclinically infected animals, Cqs ≥ 30 were more frequent than in the outbreaks (not shown). Furthermore, in the outbreaks, sample size was smaller as it was directed to animals showing clinical signs, on the contrary, for the random sampling, a larger sample size was needed and it proved to have a higher detection rate. Taken together, these facts suggest that the diagnosis of IAV as a primary agent of a respiratory outbreak requires a large targeted sampling of animals with compatible signs. Our results indicate that an influenza outbreak can be presumed when > 50% of the samples are positive and average Cqs are below 30, as seen by the distribution of positive samples per case and their respective Cq (Figure 1). Nonetheless, there are other studies were, under subclinical circumstances, the percentage of IAV RT‐PCR‐positive animals were over 70% (Ferreira et al., 2017; Simon‐Grifé et al., 2012). Considering this, a better sampling approach should include an equivalent number of animals not showing clinical signs as control in order to confirm the diagnosis and properly evaluate the relative risks.
On the other hand, most positive animals were found in nurseries. This fact correlates with other published studies showing similar results (Ferreira et al., 2017; Simon‐Grifé et al., 2012). This pattern of respiratory outbreaks is compatible with the presence of IAV endemic circulation, where in most cases the circulation of the virus and the increase of clinical outcome can be observed in the nurseries probably due to the declining of maternally derived antibodies (Gillespie, 1999; Rose et al., 2013; Torremorell et al., 2009).
IAV‐positive cases were spread all over the territory. We were unable to detect any particular distribution of cases or lineages, except for the two H3huN1av isolates that were found in two adjacent farms in the same province. Although sampling was based on voluntary submissions and, therefore, the number and location of detected positive cases do not necessarily correlate with the real proportion and distribution of subtypes and lineages, it is clear that IAV is present in most farms.
The distribution of subtypes and lineages observed agrees with previous reports from Europe in the last years (Kyriakis et al., 2011; Van Reeth et al., 2008; Simon et al., 2014). In our case, just three lineages, H1avN2hu, H1avN1av and H1huN2hu, represented 75% of the cases. It is interesting to note that, as in other European countries H3N2 is becoming less common in the herds (Harder et al., 2013; Watson et al., 2015). In contrast, in a serological study conducted in 2008–2009 in Spain, more than 90% of the examined pigs were seropositive to H3N2 (Simon‐Grifé et al., 2011).
Watson et al. (2015) proposed a genotype classification for swine IAV. The classification was based on the composition and origin of the different viral genes. In the original description, 23 genotypes were reported, with an additional 4% of the strains being undetermined. Afterwards, other reports added new genotypes (Beato et al., 2016). In the present study, we found 7 additional genotypes, and in our opinion, more genotypes are very likely to be found in the future. Accordingly, it is necessary to establish a widened scheme for the designation of the new variants that will most likely appear. It is worth noting that we found four isolates harbouring an infrequent H3 'human‐like'. This H3 was previously reported by Krog, Hjulsager, Larsen, and Larsen (2017) in Denmark where a H3N2 virus with an internal pandemic cassette was detected. In our case, the H3 human‐like isolates were harbouring an avian internal cassette either with the N2 like in Denmark or with an N1av. This is an indication of reassortment and spreading out of Denmark.
Moreover, when the phylogenetic analysis of the different viral genes was performed, it was evident that either strains of different genotypes could cluster together, or that strains from the same genotype may be included in different clusters. This suggested that the complexity of the generation of genetic diversity in swine IAV cannot be covered by just the use of subtype, lineage and genotype classifications.
The phylogenetic analysis indicated the existence of some local clusters, being this particularly noticeable for the M and NS genes. Although the development of local variants is expected, the fact that strains from very diverse subtypes, lineages and genotypes shared a variant of the M gene locally developed suggests some degree of biological fitness or advantage for this variant. Moreover, some genotypes conserved their clusters in some of the genes, while other genotypes contained strains grouped into different clusters, disrupting any possible correlation between the genotype that can be assigned to a specific strain and its genetic or phylogenetic implications. Also, this result indicates a high level of intra‐ and inter‐genotype reassortment events.
From a methodological point of view, the present study also produced some interesting results. For example, subtyping by RT‐qPCR worked out for most samples with low Cq (<30) in the M gene PCR, but failed for higher Cqs. Interestingly, most of the samples yielding a Cq > 30 could not be isolated neither. Primer mismatching could reduce the efficiency of the PCR and this could be the explanation for some of the samples that were not subtyped. However, 11 samples with very low Cq (17–20) could not be subtyped but were successfully isolated in cell culture. The design of new primers could have helped to mildly increase the efficiency of PCR subtyping in the present study. However, given the degree of diversity observed, it can be foreseen in the future, that a continuous update of primers will be necessary, including the problems associated with multiplexing at a large scale. Isolation and sequencing by NGS could be a suitable alternative, particularly, considering the decreasing costs of NGS technologies.
In this study, we took the approach of isolating the virus and then deep sequenced it by using Illumina MiSeq. The reason for including the isolation step was the impossibility of performing direct sequencing on samples with Cqs lower than 24. By using this approach, maybe we were underestimating some of the diversity of Spanish IAV. This problem could be solved by PCR amplification instead of viral isolation (Nirmala et al., 2020). However, this step of PCR amplification could add some bias that would be especially difficult to assess when more than one virus is present in the sample. We first tested the fidelity of this approach by determining the divergence rate between direct sequencing and sequencing from a single‐passage isolate. The difference resulted to be in the range of 10–3 (namely 1 discrepancy per every 1,000 nucleotides). Obviously, some bias in the isolation can be produced by using MDCK cells and this could be in part responsible for the inability to sequence a second virus present in those samples where two H or N strains were initially found. However, the advantages of NGS for such diverse viruses like IAV balance the potential disadvantages of our approach.
5. CONCLUSION
IAV is widely present in most pig farms. The most common detected lineages were H1avN2hu and H1avN1av, representing the D and A genotypes, respectively. The genetic diversity of this virus is continuously expanding with clear changes in the predominant subtypes and lineages in relatively short periods of time. The current genotyping scheme has to be enlarged to include the new genotypes that can be found. As in any other case, for a good diagnosis of IAV, a differential diagnosis with the investigation of the presence of other pathogens is needed. A large targeted sampling of clinically affected and healthy animals, considering the proportion of positive animals and viral loads in each group may help to discriminate cases where IAV is the primary agent of the outbreak.
6. ETHICS STATEMENT
The authors confirm that the ethical policies of the journal, as noted on the journal's author guidelines page, have been adhered to. No ethical approval was required.
7. CONFLICT OF INTEREST
No competing interests.
Supporting information
File S1‐S3
File S3‐Map
File S4‐PB2
File S5‐PB1
File S6‐PA
File S7‐NP
File S8‐NS
ACKNOWLEDGEMENTS
This study was funded by IDT‐Biologika, now a part of CEVA. Special thanks to all collaborating veterinarians.
Sosa Portugal S, Cortey M, Tello M, et al. Diversity of influenza A viruses retrieved from respiratory disease outbreaks and subclinically infected herds in Spain (2017–2019). Transbound Emerg Dis.2021;68:519–530. 10.1111/tbed.13709
DATA AVAILABILITY STATEMENT
All influenza sequences that have been generated on this article have been submitted to GenBank and will be available after article publication. Accession numbers are listed in the supplementary file.
REFERENCES
- Beato, M. S. , Tassoni, L. , Milani, A. , Salviato, A. , Di Martino, G. , Mion, M. , … Fusaro, A. (2016). Circulation of multiple genotypes of H1N2 viruses in a swine farm in Italy over a two‐month period. Veterinary Microbiology, 195, 25–29. 10.1016/j.vetmic.2016.08.015 [DOI] [PubMed] [Google Scholar]
- Brockmeier, S. L. , Halbur, P. G. , & Thacker, E. L. (2002). Porcine respiratory disease complex. In Brogden K. A., & Guthmiller J. M. (Eds.), Polymicrobial Diseases (pp. 231–258). Washington, DC: ASM Press. [PubMed] [Google Scholar]
- Busquets, N. , Segalés, J. , Córdoba, L. , Mussá, T. , Crisci, E. , Martín‐Valls, G. E. , … Montoya, M. (2010). Experimental infection with H1N1 European swine influenza virus protects pigs from an infection with the 2009 pandemic H1N1 human influenza virus. Veterinary Research, 41(5), 74. 10.1051/vetres/2010046 [DOI] [PMC free article] [PubMed] [Google Scholar]
- Ministerio de Agricultura, Pesca y Alimentación (2019, June). El sector de la carne de cerdo en cifras: principales indicadores económicos. Subdirección general de productos ganaderos, Dirección general de producciones y Mercados agrarios. Retrieved from https://www.mapa.gob.es/va/ganaderia/temas/produccion‐y‐mercados‐ganaderos/indicadoreseconomicossectorporcinoano2018_tcm39‐379728.pdf.
- Eurostat (2019, September). Pork production up in the EU. Retrieved from https://ec.europa.eu/eurostat/web/products‐eurostat‐news/‐/DDN‐20170919‐1.
- Ferreira, J. B. , Grgić, H. , Friendship, R. , Wideman, G. , Nagy, É. , & Poljak, Z. (2017). Longitudinal study of influenza A virus circulation in a nursery swine barn. Veterinary Research, 48(1), 1–16. 10.1186/s13567-017-0466-x [DOI] [PMC free article] [PubMed] [Google Scholar]
- Gillespie, T. G. (1999). Diagnosing endemic swine influenza virus in nursery pigs using cross‐sectional serologic profiling. Journal of Swine Health and Production, 7(2), 81–83. [Google Scholar]
- Hall, T. A. (1999). BioEdit: a user‐friendly biological sequence alignment editor and analysis program for windows 95/98/NT. Nucleic Acids Symposium Series, 41, 95–98. [Google Scholar]
- Harder, T. C. , Grosse Beilage, E. , Lange, E. , Meiners, C. , Dohring, S. , Pesch, S. , … Starick, E. (2013). Expanded Cocirculation of Stable Subtypes, Emerging Lineages, and New Sporadic Reassortants of Porcine Influenza Viruses in Swine Populations in Northwest Germany. Journal of Virology, 87(19), 10460–10476. 10.1128/jvi.00381-13 [DOI] [PMC free article] [PubMed] [Google Scholar]
- Henritzi, D. , Hoffmann, B. , Wacheck, S. , Pesch, S. , Herrler, G. , Beer, M. , & Harder, T. C. (2019). A newly developed tetraplex real‐time RT‐PCR for simultaneous screening of influenza virus types A, B, C and D. Influenza and Other Respiratory Viruses, 13(1), 71–82. 10.1111/irv.12613 [DOI] [PMC free article] [PubMed] [Google Scholar]
- Henritzi, D. , Zhao, N. , Starick, E. , Simon, G. , Krog, J. S. , Larsen, L. E. , … Harder, T. C. (2016). Rapid detection and subtyping of European swine influenza viruses in porcine clinical samples by haemagglutinin‐ and neuraminidase‐specific tetra‐ and triplex real‐time RT‐PCRs. Influenza and Other Respiratory Viruses, 10(6), 504–517. 10.1111/irv.12407 [DOI] [PMC free article] [PubMed] [Google Scholar]
- Howard, W. A. , Essen, S. C. , Strugnell, B. W. , Russell, C. , Barrass, L. , Reid, S. M. , & Brown, I. H. (2011). Reassortant pandemic (H1N1) 2009 virus in pigs. United Kingdom. Emerging Infectious Diseases, 17(6), 1049–1052. 10.3201/eid1706.101886 [DOI] [PMC free article] [PubMed] [Google Scholar]
- Krog, J. S. , Hjulsager, C. K. , Larsen, M. A. , & Larsen, L. E. (2017). Triple‐reassortant influenza A virus with H3 of human seasonal origin, NA of swine origin, and internal A(H1N1) pandemic 2009 genes is established in Danish pigs. Influenza and Other Respiratory Viruses, 11(3), 298–303. 10.1111/irv.12451 [DOI] [PMC free article] [PubMed] [Google Scholar]
- Kyriakis, C. S. , Brown, I. H. , Foni, E. , Kuntz‐Simon, G. , Maldonado, J. , Madec, F. , … Van Reeth, K. (2011). Virological surveillance and preliminary antigenic characterization of influenza viruses in pigs in five European Countries from 2006 to 2008. Zoonoses and Public Health, 58(2), 93–101. 10.1111/j.1863-2378.2009.01301.x [DOI] [PubMed] [Google Scholar]
- Kyriakis, C. S. , Olsen, C. W. , Carman, S. , Brown, I. H. , Brookes, S. M. , Doorsselaere, J. V. , & Reeth, K. V. (2010). Serologic cross‐reactivity with pandemic (H1N1) 2009 virus in pigs, Europe. Emerging Infectious Diseases, 16(1), 96–99. 10.3201/eid1601.091190 [DOI] [PMC free article] [PubMed] [Google Scholar]
- Kyriakis, C. S. , Rose, N. , Foni, E. , Maldonado, J. , Loeffen, W. , Madec, F. , … Van Reeth, K. (2013). Influenza A virus infection dynamics in swine farms in Belgium, France, Italy and Spain, 2006–2008. Veterinary Microbiology, 162(2–4), 543–550. 10.1016/j.vetmic.2012.11.014 [DOI] [PubMed] [Google Scholar]
- Lange, J. , Groth, M. , Schlegel, M. , Krumbholz, A. , Wieczorek, K. , Ulrich, R. , … Dürrwald, R. (2013). Reassortants of the pandemic (H1N1) 2009 virus and establishment of a novel porcine H1N2 influenza virus, lineage in Germany. Veterinary Microbiology, 167(3–4), 345–356. 10.1016/j.vetmic.2013.09.024 [DOI] [PubMed] [Google Scholar]
- Martín‐Valls, G. E. , Simon‐Grifé, M. , van Boheemen, S. , de Graaf, M. , Bestebroer, T. M. , Busquets, N. , … Mateu, E. (2014). Phylogeny of Spanish swine influenza viruses isolated from respiratory disease outbreaks and evolution of swine influenza virus within an endemically infected farm. Veterinary Microbiology, 170(3–4), 266–277. 10.1016/j.vetmic.2014.02.031 [DOI] [PubMed] [Google Scholar]
- Moreno, A. , Barbieri, I. , Sozzi, E. , Luppi, A. , Lelli, D. , Lombardi, G. , … Cordioli, P. (2009). Novel swine influenza virus subtype H3N1 in Italy. Veterinary Microbiology, 138(3–4), 361–367. 10.1016/j.vetmic.2009.04.007 [DOI] [PubMed] [Google Scholar]
- Moreno, A. , Di Trani, L. , Faccini, S. , Vaccari, G. , Nigrelli, D. , Boniotti, M. B. , … Cordioli, P. (2011). Novel H1N2 swine influenza reassortant strain in pigs derived from the pandemic H1N1/2009 virus. Veterinary Microbiology, 149(3–4), 472–477. 10.1016/j.vetmic.2010.12.011 [DOI] [PubMed] [Google Scholar]
- Nirmala, J. , Perez, A. , Culhane, M. R. , Allerson, M. W. , Sreevatsan, S. , & Torremorell, M. (2020). Genetic variability of influenza A virus in pigs at weaning in Midwestern United States swine farms. Transboundary and Emerging Diseases. Advance online publication. doi: 10.1111/tbed.13529 [DOI] [PubMed] [Google Scholar]
- Rose, N. , Hervé, S. , Eveno, E. , Barbier, N. , Eono, F. , Dorenlor, V. , … Simon, G. (2013). Dynamics of influenza A virus infections in permanently infected pig farms: Evidence of recurrent infections, circulation of several swine influenza viruses and reassortment events. Veterinary Research, 44(1), 72. 10.1186/1297-9716-44-72 [DOI] [PMC free article] [PubMed] [Google Scholar]
- Ryt‐Hansen, P. , Larsen, I. , Kristensen, C. S. , Krog, J. S. , Wacheck, S. , & Larsen, L. E. (2019). Longitudinal field studies reveal early infection and persistence of influenza A virus in piglets despite the presence of maternally derived antibodies. Veterinary Research, 50(1), 1–10. 10.1186/s13567-019-0655-x [DOI] [PMC free article] [PubMed] [Google Scholar]
- Simon, G. , Larsen, L. E. , Dürrwald, R. , Foni, E. , Harder, T. , Van Reeth, K. , … Loeffen, W. (2014). European surveillance network for influenza in pigs: Surveillance programs, diagnostic tools and swine influenza virus subtypes identified in 14 European countries from 2010 to 2013. PLoS One, 9(12), 1–21. 10.1371/journal.pone.0115815 [DOI] [PMC free article] [PubMed] [Google Scholar]
- Simon‐Grifé, M. , Martín‐Valls, G. E. , Vilar, M. J. , Busquets, N. , Mora‐Salvatierra, M. , Bestebroer, T. M. , … Casal, J. (2012). Swine influenza virus infection dynamics in two pig farms; results of a longitudinal assessment. Veterinary Research, 43(1), 24. 10.1186/1297-9716-43-24 [DOI] [PMC free article] [PubMed] [Google Scholar]
- Simon‐Grifé, M. , Martín‐Valls, G. E. , Vilar, M. J. , García‐Bocanegra, I. , Mora, M. , Martín, M. , … Casal, J. (2011). Seroprevalence and risk factors of swine influenza in Spain. Veterinary Microbiology, 149(1–2), 56–63. 10.1016/j.vetmic.2010.10.015 [DOI] [PubMed] [Google Scholar]
- Torremorell, M. , Juarez, A. , Chavez, E. , Yescas, J. , Doporto, J. M. , & Gramer, M. (2009). Procedures to eliminate H3N2 swine influenza virus from a pig herd. Veterinary Record, 165(3), 74–77. 10.1136/vetrec.165.3.74 [DOI] [PubMed] [Google Scholar]
- Van Reeth, K. , Brown, I. H. , Dürrwald, R. , Foni, E. , Labarque, G. , Lenihan, P. , … Koch, G. (2008). Seroprevalence of H1N1, H3N2 and H1N2 influenza viruses in pigs in seven European countries in 2002–2003. Influenza and Other Respiratory Viruses, 2(3), 99–105. 10.1111/j.1750-2659.2008.00043.x [DOI] [PMC free article] [PubMed] [Google Scholar]
- Van Reeth, K. , Labarque, G. , & Pensaert, M. (2006). Serological profiles after consecutive experimental infections of pigs with European H1N1, H3N2, and H1N2 Swine influenza viruses. Viral Immunology, 19(3), 373–382. 10.1089/vim.2006.19.373 [DOI] [PubMed] [Google Scholar]
- Watson, S. J. , Langat, P. , Reid, S. M. , Lam, T.‐Y. , Cotten, M. , Kelly, M. , … Kellam, P. (2015). Molecular epidemiology and evolution of influenza viruses circulating within European Swine between 2009 and 2013. Journal of Virology, 89(19), 9920–9931. 10.1128/JVI.00840-15 [DOI] [PMC free article] [PubMed] [Google Scholar]
Associated Data
This section collects any data citations, data availability statements, or supplementary materials included in this article.
Supplementary Materials
File S1‐S3
File S3‐Map
File S4‐PB2
File S5‐PB1
File S6‐PA
File S7‐NP
File S8‐NS
Data Availability Statement
All influenza sequences that have been generated on this article have been submitted to GenBank and will be available after article publication. Accession numbers are listed in the supplementary file.