Abstract
Abstract: During the last decades, there has been growing interest in using therapeutic messager RNA (mRNA) together with drug delivery systems. Naked, unformulated mRNA is, however, unable to cross the cell membrane and is susceptible to degradation. Here we use graphene quantum dots (GQDs) functionalized with polyethyleneimine (PEI) as a novel mRNA delivery system. Our results show that these modified GQDs can be used to deliver intact and functional mRNA to Huh‐7 hepatocarcinoma cells at low doses and, that the GQDs are not toxic, although cellular toxicity is a problem for these first‐generation modified particles. Functionalized GQDs represent a potentially interesting delivery system that is easy to manufacture, stable and effective.
Keywords: drug delivery, functionalization, graphene quantum dots, hepatocarcinoma, mRNA
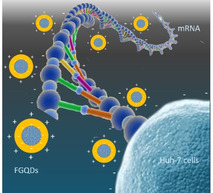
Message delivered! A novel graphene quantum dots based mRNA drug delivery platform was prepared. The results show that these modified GQDs can deliver intact and functional mRNA to Huh‐7 hepatocarcinoma cells at low doses. The transfection efficiency for FGQDs/mRNA complexes was 25 % with a formulation concentration of 4000 ng mRNA/mL, but comparable transfection efficiencies could be achieved at much lower doses if the ratio between carrier and cargo was optimized. This work describes the first steps towards a potentially interesting preparation method for stable and effective mRNA delivery systems.
1. Introduction
In recent years, graphene quantum dots (GQDs) have emerged as an attractive platform for bio‐applications, involving biosensing, biomedical imaging and drug delivery. This is because various desirable attributes from GQDs: dispersibility, good biocompatibility, large surface area, colloidal stability, and tunable surface structure. Moreover, GQDs are able to respond to physical stimuli, such as magnetic fields, ultrasound [3] and light. These unique responding features allow the accurate control of drug release. [1a] To date, some exciting examples, include a graphene oxide/carbon/mesoporous silica photo‐responsive drug delivery platform, an electrical fields activated graphene based microcapsule platform, and graphene based photothermal therapy [7] have been reported. Notably, GQDs are able to selectively interact with DNA or RNA and protect them from enzymatic degradation, [1b] suggests the possibility of integrating GQDs with DNA or RNA‐based therapeutics.
Messenger RNA (mRNA)‐based therapeutics are a promising class of drugs with a range of advantages, including reduced genotoxicity, increased control of product (protein) formation, no need for nuclear localization or transcription and better compatibility with biological systems. Structurally, mRNA is a single‐strand poly nucleotide that in cells is transcribed from a DNA template prior to translation into protein. mRNA molecules are, however, large, carrying a net charge and unstable in most biological fluids. These poor cell penetration and instability characteristics limit their use as therapeutic agents. To cope with this issue, composite particles made from mRNA and GQDs would ameliorate many of these problems due to the surface properties and colloidal stability of GQDs. [1b]
Unmodified GQDs will not, however, bind mRNA very well so GQDs need to be functionalized. In this regard, Polyethyleneimine (PEI) possess a high cationic charge density and allows the complexation of RNA and DNA. Besides, PEI functionalized carbon nanotubes (CNTs) have been designed successfully for nucleic acid delivery. Given the similar surface properties of GQDs and CNTs, we hypothesized that PEI would be a good starting point for exploring the utility of GQDs as an mRNA delivery system.
In this work, GQDs were prepared from citric acid, and surface zeta potential of GQDs were tailored by PEI. The GQDs/mRNA complexes were prepared by combining the functionalized GQDs (FGQDs) with mRNA. The mRNA molecules bind to the particles as a result of simple charge interactions. Finally, the novel FGQDs were used to deliver intact and functional mRNA to Huh‐7 hepatocarcinoma (liver) cells. This cell line is used as a model for the liver because most nanomedicine particles are cleared by the liver, resulting in higher levels of transfection in this organ.
2. Results and Discussion
GQDs were prepared from citric acid, as shown in Figure 1. After pyrolysis and carbonization, the carbon atoms grow to form interlinked hexagonal carbon rings (at the red ring site), and thus creating graphene. After that, PEI was used to functionalize the surface of the GQDs following a reaction with graphene carboxyl groups. The high concentration of positively charged amino groups on PEI imparts a surface zeta potential that permits mRNA complexation.
Figure 1.
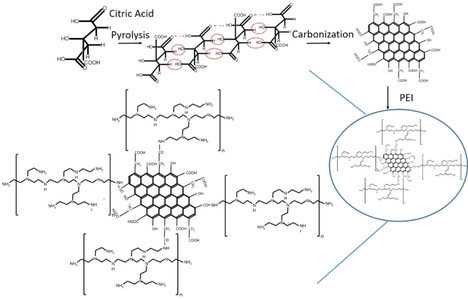
A schematic overview of the FGQDs synthesis. The red ring and arrow show the carbonization reaction sites.
FTIR was used to characterize the GQDs and PEI‐GQDs. After pyrolysis, only peaks at 620, 1646, 2103 cm−1 are observed on the FTIR spectrum of GQDs, corresponding to C−O−C, C=O and C=C=O groups, as shown in Figure 2(a), indicating the successful preparation of GQDs. Additionally, the GQDs spectra do not reveal any absorption caused by C−H bonds, suggesting the complete carbonization of citric acid. After PEI functionalization, typical peaks of C−N and N−H are observed in the FTIR spectrum of FGQDs at 1550 and 1396 cm−1, see Figure 2(b). Compared with the absorption peak of PEI, the position of C−N and N−H absorption peaks tend to shift to lower wavenumber. Such a blue shift phenomenon suggests a decrease in the polarity of these two bonds and can be attributed to the formation of the C−N bond between GQDs and PEI.
Figure 2.
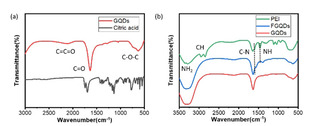
(a) FTIR spectrums of GQDs and citric acid; (b) FTIR spectrums of PEI, FGQDs and GQDs.
As shown in Figure 3(a), the average size of GQDs is 2–5 nm with a thickness less than 1 nm, indicating the GQDs were composed of 1–3 layers of graphene sheets. After functionalization with PEI, FGQDs grows to tens of nanometers. While FGQDs consist of 1–6 layers of graphene sheets with a thickness of 0.33–2 nm. Such results keep consistent with the TEM images of GQDs, see Figure S1. The surface zeta potential of GQDs is −36 V due to the oxygen‐containing functional groups, including hydroxyl and carboxyl groups. Following PEI functionalization, the surface zeta potential of FGQDs increases to +24.2 V. This increase is a result of the positively charged amino groups on PEI. Notably, the surface zeta potential of prepared FGQDs exhibits pH stability, as shown in Figure S2. The surface zeta potential of FGQDs stays at around +22 V over a pH range of 4–14. This positively charged surface enables the GQDs to combine with mRNA. Additionally, UV absorption and fluorescence properties of GQDs and FGQDs were investigated in Figure S3. Both GQDs and FGQDs are able to absorb UV light at 360 nm and emit blue fluorescence.
Figure 3.
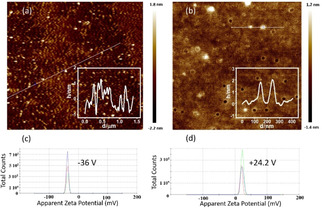
Atomic force microscopy images of (a) GQDs and (b) FGQDs. Insets show image intensities along the indicated lines. Panels (c) and (d) show the surface charge of the GQDs before and after PEI functionalization respectively (repeated three times).
The FGQDs have a positively charged surface, so an electrostatically driven interaction would be expected between FGQDs, and negatively charged EEGFP mRNA. FGQDs to mRNA ratios were expressed as molar ratios of N in FGQDs to molar ratios of P in mRNA (N/P ratio). As shown in Figure 4, agarose gel electrophoresis confirmed the formation of a complex between FGQDs and mRNA at various N/P ratios (i. e. at N/P 2, 4, 6, 8, 10, 20, 40 60, 100). At all N/P ratios, mRNA completely complexed with FGQDs, and remained close to the loading position. The particle size of the FGQDs/mRNA complexes formed at various N/P ratios demonstrate that higher N/P ratios lead to smaller particle sizes as a result of reduced amounts of positively charged FGQDs being available at lower N/P ratios (Figure 5(a)). All the FGQDs/mRNA complexes have particle sizes below 300 nm.
Figure 4.
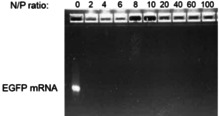
eGFP mRNA gel electrophoresis is retarded following complexation with FGQDs at various charge (N/P) ratios (0–100).
Figure 5.

Particle size and function at various FGQDs to mRNA ratios. (a) As the proportion of FGQDs increases in relation to the number of mRNA molecules in a solution, increased mRNA condensation results in smaller particle sizes. (b) A 2 h pulse of particles was created by removing dosed particles after 2 h and adding fresh growth medium. Imaging and quantification occurred at 24 h. Low doses of FGQDs/mRNA complexes resulted in particle uptake and dose‐dependent eGFP expression. (c) The amount of eGFP protein produced, shown as the total area under the curve for all particle doses together, was inversely proportional to the N/P ratio, with lower ratios resulting in more protein production. n=3 for all data points. 24 h continuous dosing produced similar data (not shown) but with lower protein expression due to cellular toxicity (see discussion).
2.1. Delivery of Functional mRNA to Cell Cultures
mRNA‐based therapeutics offer new possibilities for treating disease, so a variety of different biomaterial‐based systems have been developed for mRNA delivery, such as lipid nanoparticles, [10] polymeric nanoparticles, [11] and gold nanoparticles. [12] However, it is still necessary to find novel biomaterial delivery systems that can stably, safely and effectively deliver mRNA to specific sites with high selectivity and efficient protein expression. Here, FGQDs were employed to deliver mRNA, and the transfection efficiency was evaluated both qualitatively and, quantitatively by calculating the % EGFP positive cells in the images obtained using high‐throughput microscopy.
Our investigation of FGQDs/mRNA complexes began with experiments to determine the optimum ratio between FGQDs and the mRNA cargo. We created particles using various ratios, and DLS measurements indicated that particle size increased following mRNA addition and, that as expected, particle size decreased if mRNA condensation was then encouraged by adding more FGQDs and thus more charge (Figure 5(a)). Note that unbound mRNA (N/P 0) assumes a spherical form in aqueous buffers. The functional cellular experiments were performed at relatively low doses and exposures were short because of the acidic nature of this first round of formulations. Decreased eGFP production at higher doses of the FGQDs/mRNA complexes (Figure 5(b)) is the result of media acidity, rather than FGQDs toxicity. A clear relationship was seen where an increasing proportion of FGQDs was less effective (Figure 5(c)). Encouraged by this, and the fact that protein production was seen at very low doses, we continued with a second round of functional experiments with an improved formulation that was much less acidic.
Both the reference lipid nanoparticle (Figure 6(a) and (c)) and the FGQDs ((b) and (d)) could deliver functional EGFP mRNA to Huh‐7 cells. Qualitatively, differences are apparent. Wells treated with FGQDs tended to have fewer cells expressing EGFP, but positive cells did produce a lot of protein. This is in contrast to the more uniform expression obtained following LNP transfection. Likewise, FGQDs‐treated wells did have more propidium iodide staining than the reference lipid‐based particles, indicating greater disruption of the plasma membrane, a likely side‐effect of the PEI functionalization, rather than the graphene itself.
Figure 6.
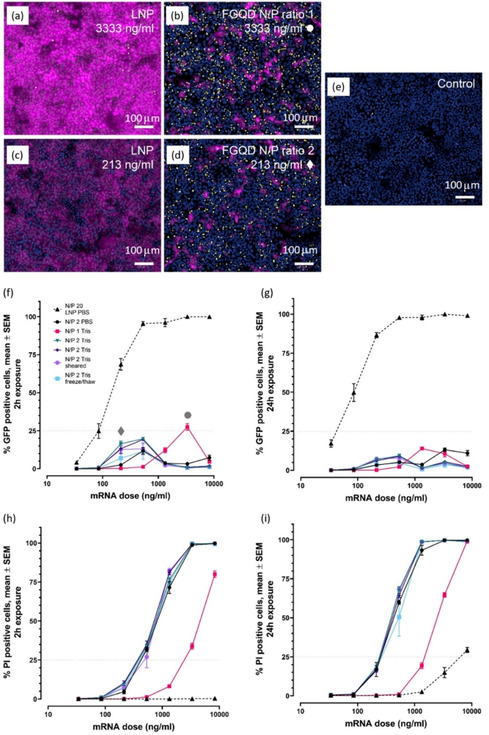
Functional cellular data obtained following transfection. Shown are representative images, of Huh‐7 cells exposed to LNPs (a and c) FGQDs (b and d) and control cells dosed with buffer (e), taken 24 h following the start of a 2 h pulsed exposure to either LNPs or FGQDs complexed with mRNA encoding for eEGFP (the entire 2 h data set is shown in f and h below). FGQDs images are taken from wells that produced the most EGFP: an N/P ratio of 1 at 3333 ng/mL mRNA (b) and an N/P ratio of 2 at 213 ng/mL mRNA (d). The corresponding points on the curves in panel f are noted with circle • and diamond ♦ symbols. Images from wells receiving LNPs at the same doses and time points are shown in a and c. EGFP protein production is shown in magenta, propidium iodide staining in yellow and nuclear staining with Hoechst 33342 is shown in blue; scale bars show 100 μm. Qualitatively similar images were obtained following 24 h of continuous exposure but with more PI signal (intensity and % positive cells). Quantitative image analysis data is shown in panels f and g for eEGFP (protein production) and h and i for PI staining (cell viability). The left panels (f and h) show data obtained at 24 h following a 2 h pulsed dose, while the right panels (g and i) show data obtained following continuous 24 h exposure. Curves show responses to FGQDs or reference LNPs complexed with mRNA at different charge ratios (N/P ratios). Data is shown as mean±SEM from 6 wells for each point (combined data from 3 replicates in two separate experiments for all data points).
GQDs are reported to be biocompatible and have great promise for drug delivery, [13] however, the size, functionalization of GQDs can influence their cytotoxicity in different ways. [14] To facilitate cellular uptake, nanoparticles are often designed to be catatonically charged, which can enhance the interaction of the particles with the anionic cell membrane, however, this results in cytotoxic effects as well. [15] The optimal doses and formulations, if one considers the ratio between EGFP production and cellular toxicity, occur at relatively low doses for FGQDs: 213 ng/mL mRNA is optimal for an N/P ratio of 2, using either PBS or Tris as a buffer system, and a 2 h pulsed dose (Figure 6(f) and (h)). Longer, 24 h exposures increase cellular toxicity, resulting in lower protein expression (Figure 6(g) and (i)). The cell health data in Figure S4 shows similar results. Interestingly, an N/P ratio of 1 between the FGQDs and the mRNA cargo resulted in less potent, but also less toxic particles, and in this case, the optimal dose was more than a magnitude higher.
The FGQDs tested here were both less effective and more toxic than the reference LNP‐based mRNA delivery system, but this was not unexpected as these are the first generation of functionalized graphene‐based delivery systems we have developed, while the LNPs represent a more mature technology. Furthermore, because the toxicity is primarily a result of functionalization [16] and the resulting particle charge, alternative functionalization strategies have the potential to produce less toxic particles. Hybrid particles, consisting of GQDs in complex with lipids, are an interesting possibility. GQDs do, however, have other desirable properties as well including a large surface area and the ability to respond to external stimuli such as ultrasound, magnetic fields and light. Since LNPs are sensitive to shearing force during formulation (AstraZeneca unpublished data), a shear tolerance test was performed on the FGQDs/mRNA complex formed at N/P 2. The sample was pressed through a thin needle (27G) 20 times. The performance of the FGQDs/mRNA complex was not very sensitive to this treatment and retained substantial activity, Figure 6(f–i). Finally, we found that one freeze‐thaw cycle did have an effect on the potency of the complexes but did not reduce cellular toxicity.
3. Conclusion
In this work, we prepared a novel mRNA delivery platform based on GQDs. Covalent functionalization of the GQDs surface with PEI was used to achieve positively charged GQDs (termed functionalized GQDs or FGQDs). Our results show that FGQDs were able to successfully complex mRNA and deliver it intact to the cytoplasm of Huh‐7 hepatocarcinoma cells. Furthermore, unlike LNP, the FGQDs/mRNA complex is not very sensitive to shearing force. The transfection efficiency for FGQDs/mRNA complexes was as high as 25 % with a formulation concentration of 4000 ng mRNA/mL, but comparable transfection efficiencies could be achieved at much lower doses if the ratio between the carrier and the cargo was optimized. This work describes the first steps towards a potentially interesting preparation method for stable and effective mRNA delivery systems based on GQDs.
Experimental Section
Materials
50 wt % polyethylenimine (PEI, Mw 60,000 by GPC) solution and citric acid were purchased from Sigma‐Aldrich Co. Ltd, Sweden. EEGFP mRNA (5moU) was purchased from Trilink BioTechnologies, Inc., USA. The huh‐7 hepatocarcinoma cell line was obtained from AstraZeneca AB, Sweden and originally sourced from ATCC. pH test paper was purchased from Fisher Scientific Co. Ltd, Sweden. The chemicals were analytically pure and used as received.
Preparation of GQDs
GQDs were prepared using a typical bottom‐up method. Briefly, 1 g citric acid was dissolved in 80 mL distilled water while stirring for 30 min at room temperature. Then, the prepared transparent solution was transferred in a 150 mL Teflon‐lined stainless‐steel autoclave. After that, the autoclave was put into a muffle furnace at 200 °C for 6 h. The resulting orange liquid was used to prepare GQDs by adding it drop by drop into 100 mL of 10 mg /mL NaOH solution, under vigorous stirring. After adjusting the pH to 7.0, an aqueous solution of GQDs was obtained. This solution was filtered and dialyzed (3.5 kDa cut‐off) for 7 days under running water. After concentrating the solution using centrifugation (8000 r/min), an orange solution of GQDs (4 mg/mL) was obtained. The production yield was calculated to be about 56 %.
Preparation of Functionalized GQDs (FGQDs)
PEI was used to modify the surface zeta potential of pre‐prepared GQDs. GQDs were aminated by adding ethylenediamine (EDA) and dicyclohexycarbodiimide (DCC) in 100 mL GQDs solution stirred for 1 h at 80 °C. After that, 10 wt % PEI solution was added into the aminated GQDs solution with stirring for 8 h. The resulting solution was further purified using 3.5 K MWCO dialysis tubing for 7 days under running water, resulting in a final concentration of 2.8 mg/mL FGQDs. FGQDs fluoresce somewhat with emission in the green part of the spectrum (around 520 nm), This could be mitigated by using moderate concentrations as the fluorescence at the concentrations used here is not intense when compared with eEGFP.
Formation of FGQDs/mRNA Complex
FGQDs to mRNA ratios were expressed as molar ratios of N in FGQDs to molar ratios of P in mRNA (N/P ratio). FGQDs/mRNA complex was formed by mixing varied volumes of FGQDs and mRNA solution to achieve the desired N/P ratio in water or adjusted to pH 7.5 using 1 M Tris pH 8 and incubated for 1 h at RT before analysis. The obtained FGQDs/mRNA complexes were examined by agarose gel electrophoresis (1 % Agarose E‐GelEX, Invitrogen). The particle sizes were measured using a Zetasizer APS (Malvern Instrument).
Cell Transfer Efficiency and Cytotoxicity Test
Huh‐7 hepatocarcinoma cells were cultured in DMEM supplemented with 10 % fetal bovine serum, 5 % L‐glutamine, 5 % sodium pyruvate and incubated at 37 °C in 5 % CO2. Cells were seeded into 384 well Perkin Elmer Cell Carrier imaging plates two days prior to test. FGQDs/mRNA source plates were created using acoustic dispensing (Echo 655) followed by robotic transfer (Agilent Bravo) to the Huh‐7 cultures. LNPs and FGQDs were incubated together with the growth medium normally used to maintain the cells, and the cells were incubated with FGQDs/mRNA in 2 different ways: 24 h continuous incubation or, using a 2 h pulse incubation followed by removal of the FGQDs/mRNA and an additional 22 h incubation in fresh growth medium. MC3‐based lipid nanoparticles (LNP) were added and used as a control. Hoechst 33342 and propidium iodide were added directly to living cells 24 h to stain nuclei and cells with compromised membranes respectively. Confocal images were acquired using a 20×objective (Olympus, NA 0.95) at two points in every well (Yokogawa CV7000). Wells were dosed in triplicate and the experiment was run twice.
Particles Characterisation
Fourier‐transform infrared (FTIR) and Raman spectroscopy were used to characterize the chemical structure of GQDs and FGQDs. The value of zeta potentials was measured using a Malvern zetasizer (Malvern Panalytical, England). Atomic force microscopy (AFM) was used to analyse the morphology of GQDs and FGQDs in tapping mode on a Nanoscope IIIa (Digital Instruments) with NSC15 tips (silicon cantilever, MikroMasch). High resolution transmission electron microscopy (HRTEM) observations were made on a Tecnai G2 F20S‐TWIN 200KV electron microscope. UV‐Vis absorption was characterized using a UV/Vis/NIR spectrophotometer (Agilent Cary 60). All FL spectra were obtained by an FL spectrophotometer (Cary Eclipse, Varian). pH values were obtained using pH test paper.
Data Analysis
The eEGFP mRNA transgene expression was investigated using confocal imaging after 24 h of incubation with FGQDs/mRNA. For transfection of mRNA and cytotoxicity test, 8 doses were used per formulation (as shown in Table S1), 3 replicates were performed per dose and two fields of view were acquired in each well. Columbus (ver2.9; Perkin Elmer) was used for automated analysis of the images. 15000 cells/concentration were typically analysed, and initial analysis extracted 16 parameters/cell. Cells were classified as EGFP‐positive, PI‐positive (dead), and/or PI‐negative (living). Additional measurements related to cell health were also generated (cell counts, nuclear intensities and nuclear morphological measures).
Conflict of interest
The authors declare no conflict of interest.
Supporting information
As a service to our authors and readers, this journal provides supporting information supplied by the authors. Such materials are peer reviewed and may be re‐organized for online delivery, but are not copy‐edited or typeset. Technical support issues arising from supporting information (other than missing files) should be addressed to the authors.
Supplementary
Supplementary
Acknowledgements
The authors acknowledge financial support from the Swedish Board for Innovation (Vinnova) under the Siografen program, from the Swedish National Science Foundation with the contract No: 621‐2007‐4660, from the Swedish Board for Strategic Research (SSF) with the contract No: SE13‐0061, from Formas with the contract No: FR‐2017/0009 and from STINT for the double degree PhD collaboration program with the contract No: DD2016‐6502 as well as from the Production Area of Advance at Chalmers University of Technology, Sweden. J.L. also acknowledges the financial support from the National Natural Science Foundation of China (No: 51872182). H.L thanks for the financial support from Shanghai International Collaboration research project (No: 19520713900) and State Key Laboratory of Molecular Engineering of Polymers at Fudan University.
Y. Liu, C. Zhao, A. Sabirsh, L. Ye, X. Wu, H. Lu, J. Liu, ChemistryOpen 2021, 10, 666.
Contributor Information
Dr. Xiaoqiu Wu, Email: Xiaoqiu.Wu@astrazeneca.com.
Prof. Hongbin Lu, Email: hongbinlu@fudan.edu.cn.
Prof. Johan Liu, Email: johan.liu@chalmers.se, Email: johanliu@shu.edu.cn.
References
- 1.
- 1a. Gu Z., Zhu S., Yan L., Zhao F., Zhao Y., Adv. Mater. 2019, 31, 1800662; [DOI] [PubMed] [Google Scholar]
- 1b. Sanchez V. C., Jachak A., Hurt R. H., Kane A. B., Chem. Res. Toxicol. 2011, 25, 15–34. [DOI] [PMC free article] [PubMed] [Google Scholar]
- 2. Peng E., Choo E. S. G., Chandrasekharan P., Yang C. T., Ding J., Chuang K. H., Xue J. M., Small 2012, 8, 3620–3630. [DOI] [PubMed] [Google Scholar]
- 3. Dai C., Zhang S., Liu Z., Wu R., Chen Y., ACS Nano 2017, 11, 9467–9480. [DOI] [PubMed] [Google Scholar]
- 4. Yang K., Hu L., Ma X., Ye S., Cheng L., Shi X., Li C., Li Y., Liu Z., Adv. Mater. 2012, 24, 1868–1872. [DOI] [PubMed] [Google Scholar]
- 5. Chen Y. W., Chen P. J., Hu S. H., Chen I. W., Chen S. Y., Adv. Funct. Mater. 2014, 24, 451–459. [Google Scholar]
- 6. Liu H. W., Huang W. C., Chiang C. S., Hu S. H., Liao C. H., Chen Y. Y., Chen S. Y., Adv. Funct. Mater. 2014, 24, 3715–3724. [Google Scholar]
- 7. Yang K., Zhang S., Zhang G., Sun X., Lee S.-T., Liu Z., Nano Lett. 2010, 10, 3318–3323. [DOI] [PubMed] [Google Scholar]
- 8.
- 8a. Li B., Zhang X., Dong Y., Wires. Nanomed. Nanobi. 2019, 11, e1530; [DOI] [PMC free article] [PubMed] [Google Scholar]
- 8b. Chalbatani G. M., Dana H., Gharagouzloo E., Grijalvo S., Eritja R., Logsdon C. D., Memari F., Miri S. R., Rad M. R., Marmari V., Int. J. Nanomed. 2019, 14, 3111. [DOI] [PMC free article] [PubMed] [Google Scholar]
- 9. Wang L., Shi J., Zhang H., Li H., Gao Y., Wang Z., Wang H., Li L., Zhang C., Chen C., Biomaterials 2013, 34, 262–274. [DOI] [PubMed] [Google Scholar]
- 10.
- 10a. Zohra F. T., Maitani Y., Akaike T., Biol. Pharm. Bull. 2012, 35, 111–115; [DOI] [PubMed] [Google Scholar]
- 10b. Bao Y., Jin Y., Chivukula P., Zhang J., Liu Y., Liu J., Clamme J.-P., Mahato R. I., Ng D., Ying W., Wang Y., Yu L., Pharm. Res. 2013, 30, 342–351. [DOI] [PubMed] [Google Scholar]
- 11.
- 11a. Menon J. U., Ravikumar P., Pise A., Gyawali D., Hsia C. C. W., Nguyen K. T., Acta Biomater. 2014, 10, 2643–2652; [DOI] [PMC free article] [PubMed] [Google Scholar]
- 11b. Su Z., Erdene-Ochir T., Ganbold T., Baigude H., Int. J. Biol. Macromol. 2019, 143, 118-125.. [DOI] [PubMed] [Google Scholar]
- 12. Kumar S., Diwan A., Singh P., Gulati S., Choudhary D., Mongia A., Shukla S., Gupta A., RSC Adv. 2019, 9, 23894–23907. [DOI] [PMC free article] [PubMed] [Google Scholar]
- 13. Chen F., Gao W., Qiu X., Zhang H., Liu L., Liao P., Fu W., Luo Y., Front. Lab. Med. 2017, 1, 192–199. [Google Scholar]
- 14. Nurunnabi M., Khatun Z., Huh K. M., Park S. Y., Lee D. Y., Cho K. J., Lee Y. K., ACS Nano 2013, 7, 6858–6867. [DOI] [PubMed] [Google Scholar]
- 15. Fischer D., Li Y., Ahlemeyer B., Krieglstein J., Kissel T., Biomaterials 2003, 24, 1121–1131. [DOI] [PubMed] [Google Scholar]
- 16. Liu Y., Zhao X., Wang C., Zhang L., Li M., Pan Y., Fu Y., Liu J., Lu H., J. Mater. Chem. A 2018, 6, 18267–18275. [Google Scholar]
Associated Data
This section collects any data citations, data availability statements, or supplementary materials included in this article.
Supplementary Materials
As a service to our authors and readers, this journal provides supporting information supplied by the authors. Such materials are peer reviewed and may be re‐organized for online delivery, but are not copy‐edited or typeset. Technical support issues arising from supporting information (other than missing files) should be addressed to the authors.
Supplementary
Supplementary


